Gear Ratio Optimization along with a Novel Gearshift Scheduling Strategy for a Two-Speed Transmission System in Electric Vehicle


Abstract
1. Introduction
2. EV Powertrain
2.1. Battery
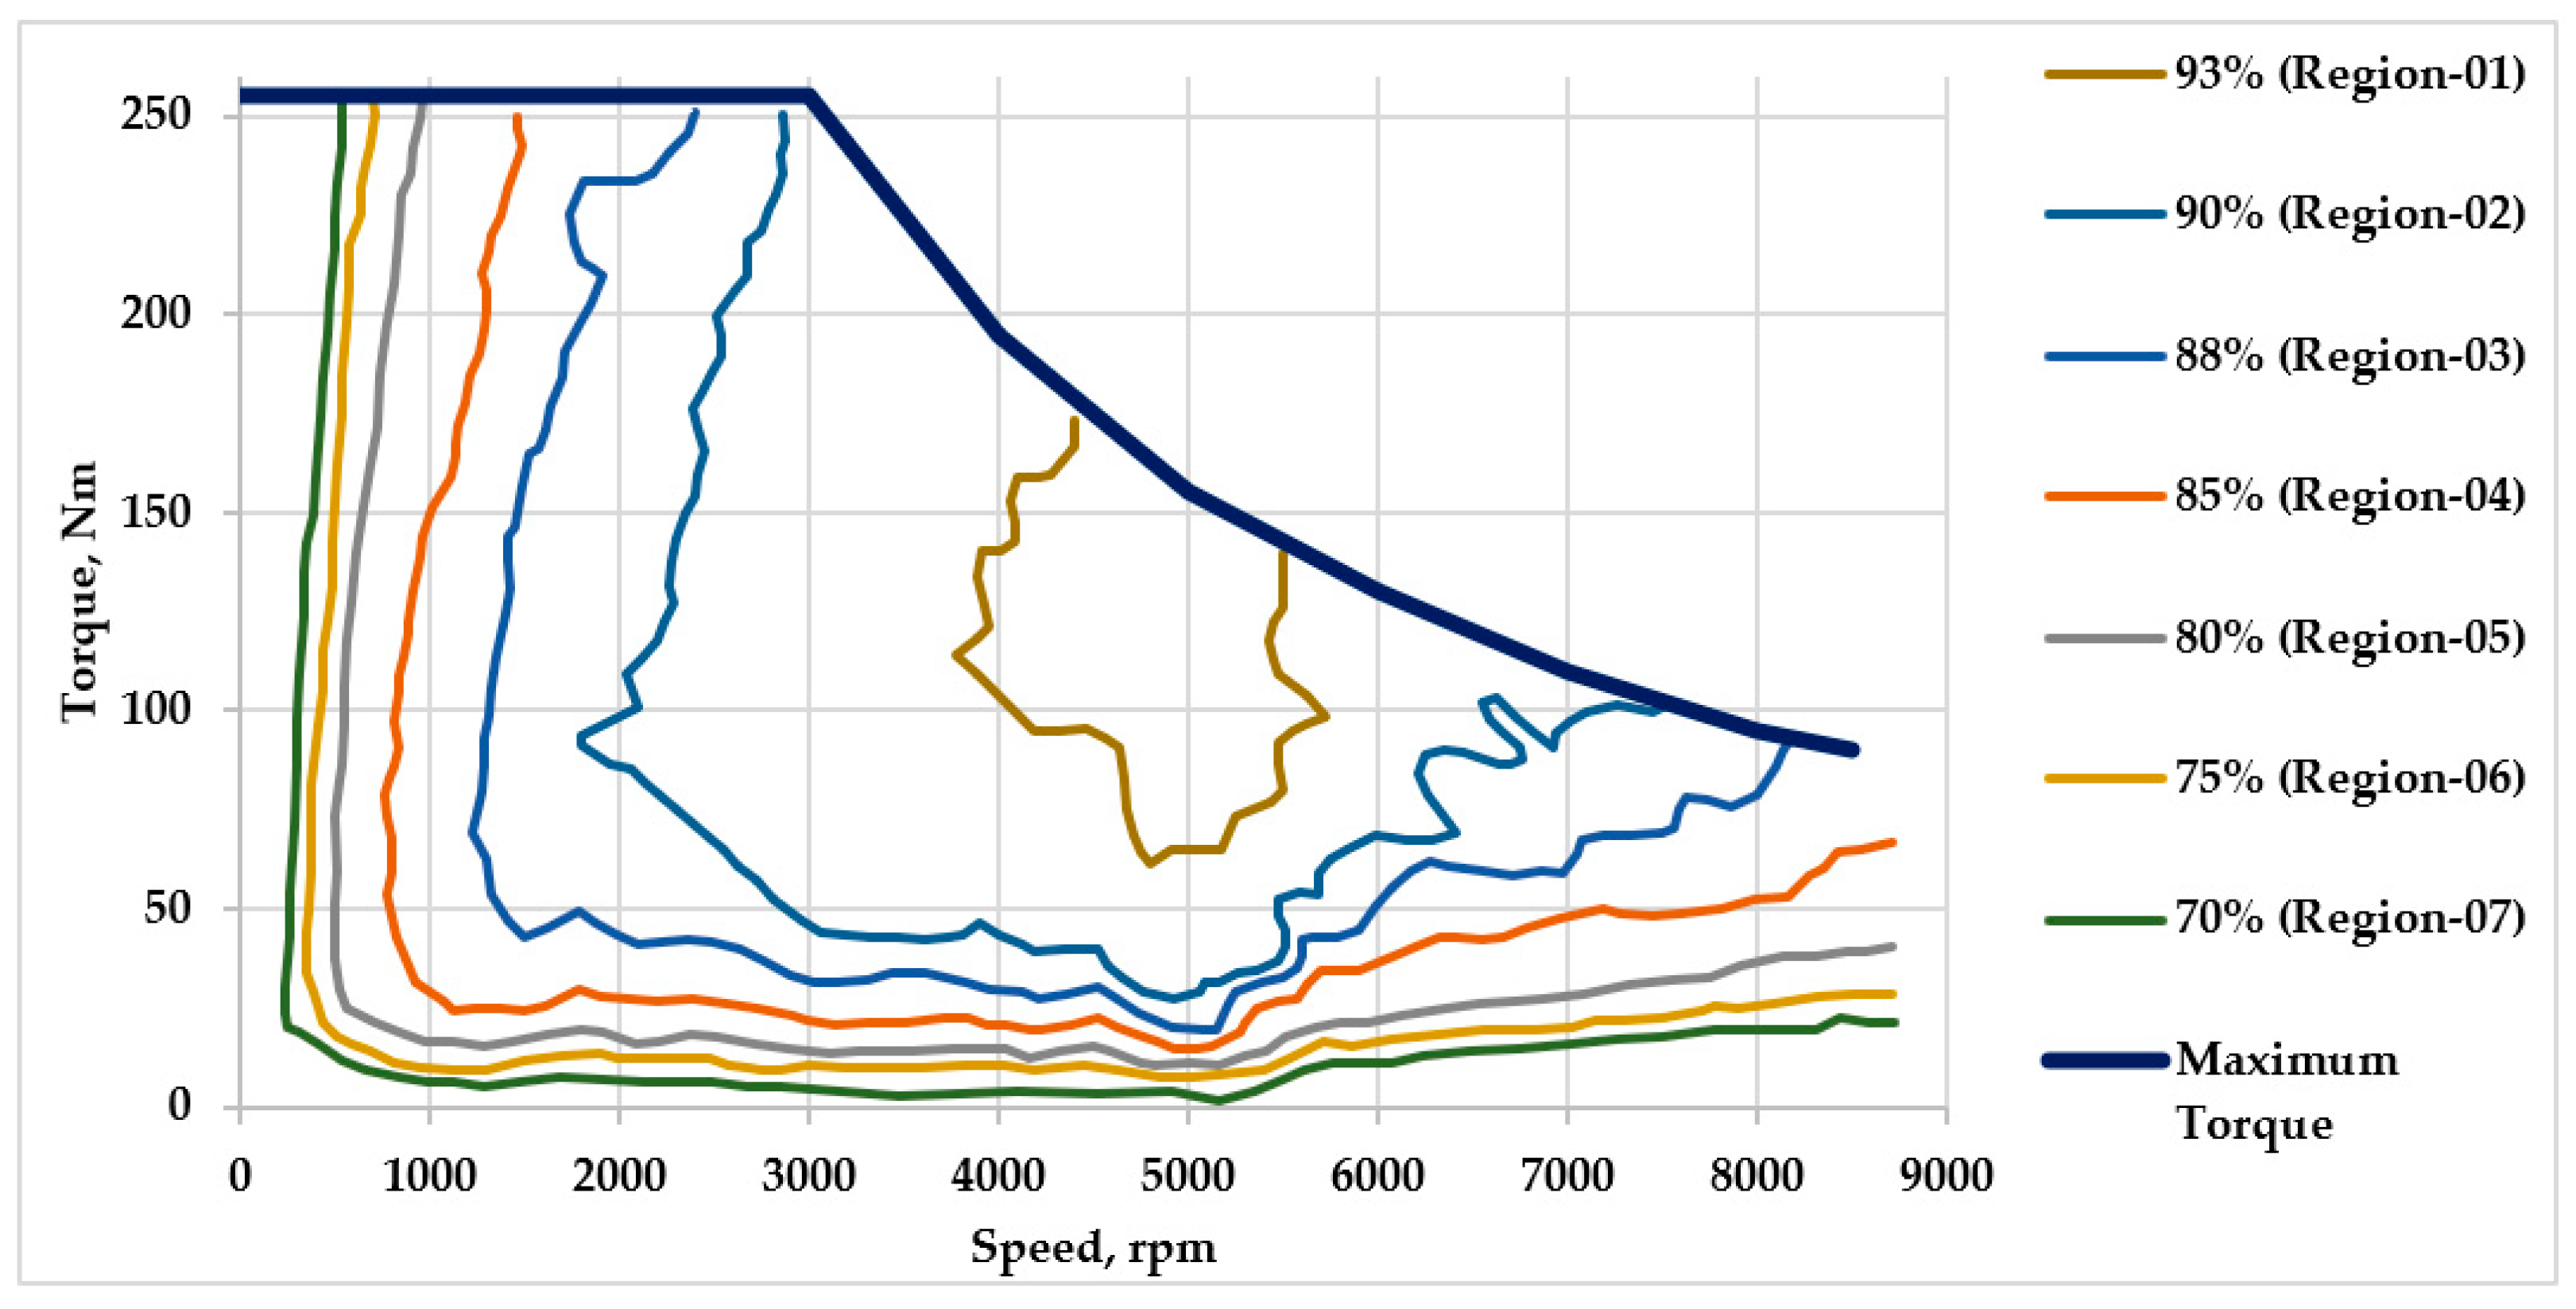
2.2. Electric Motor
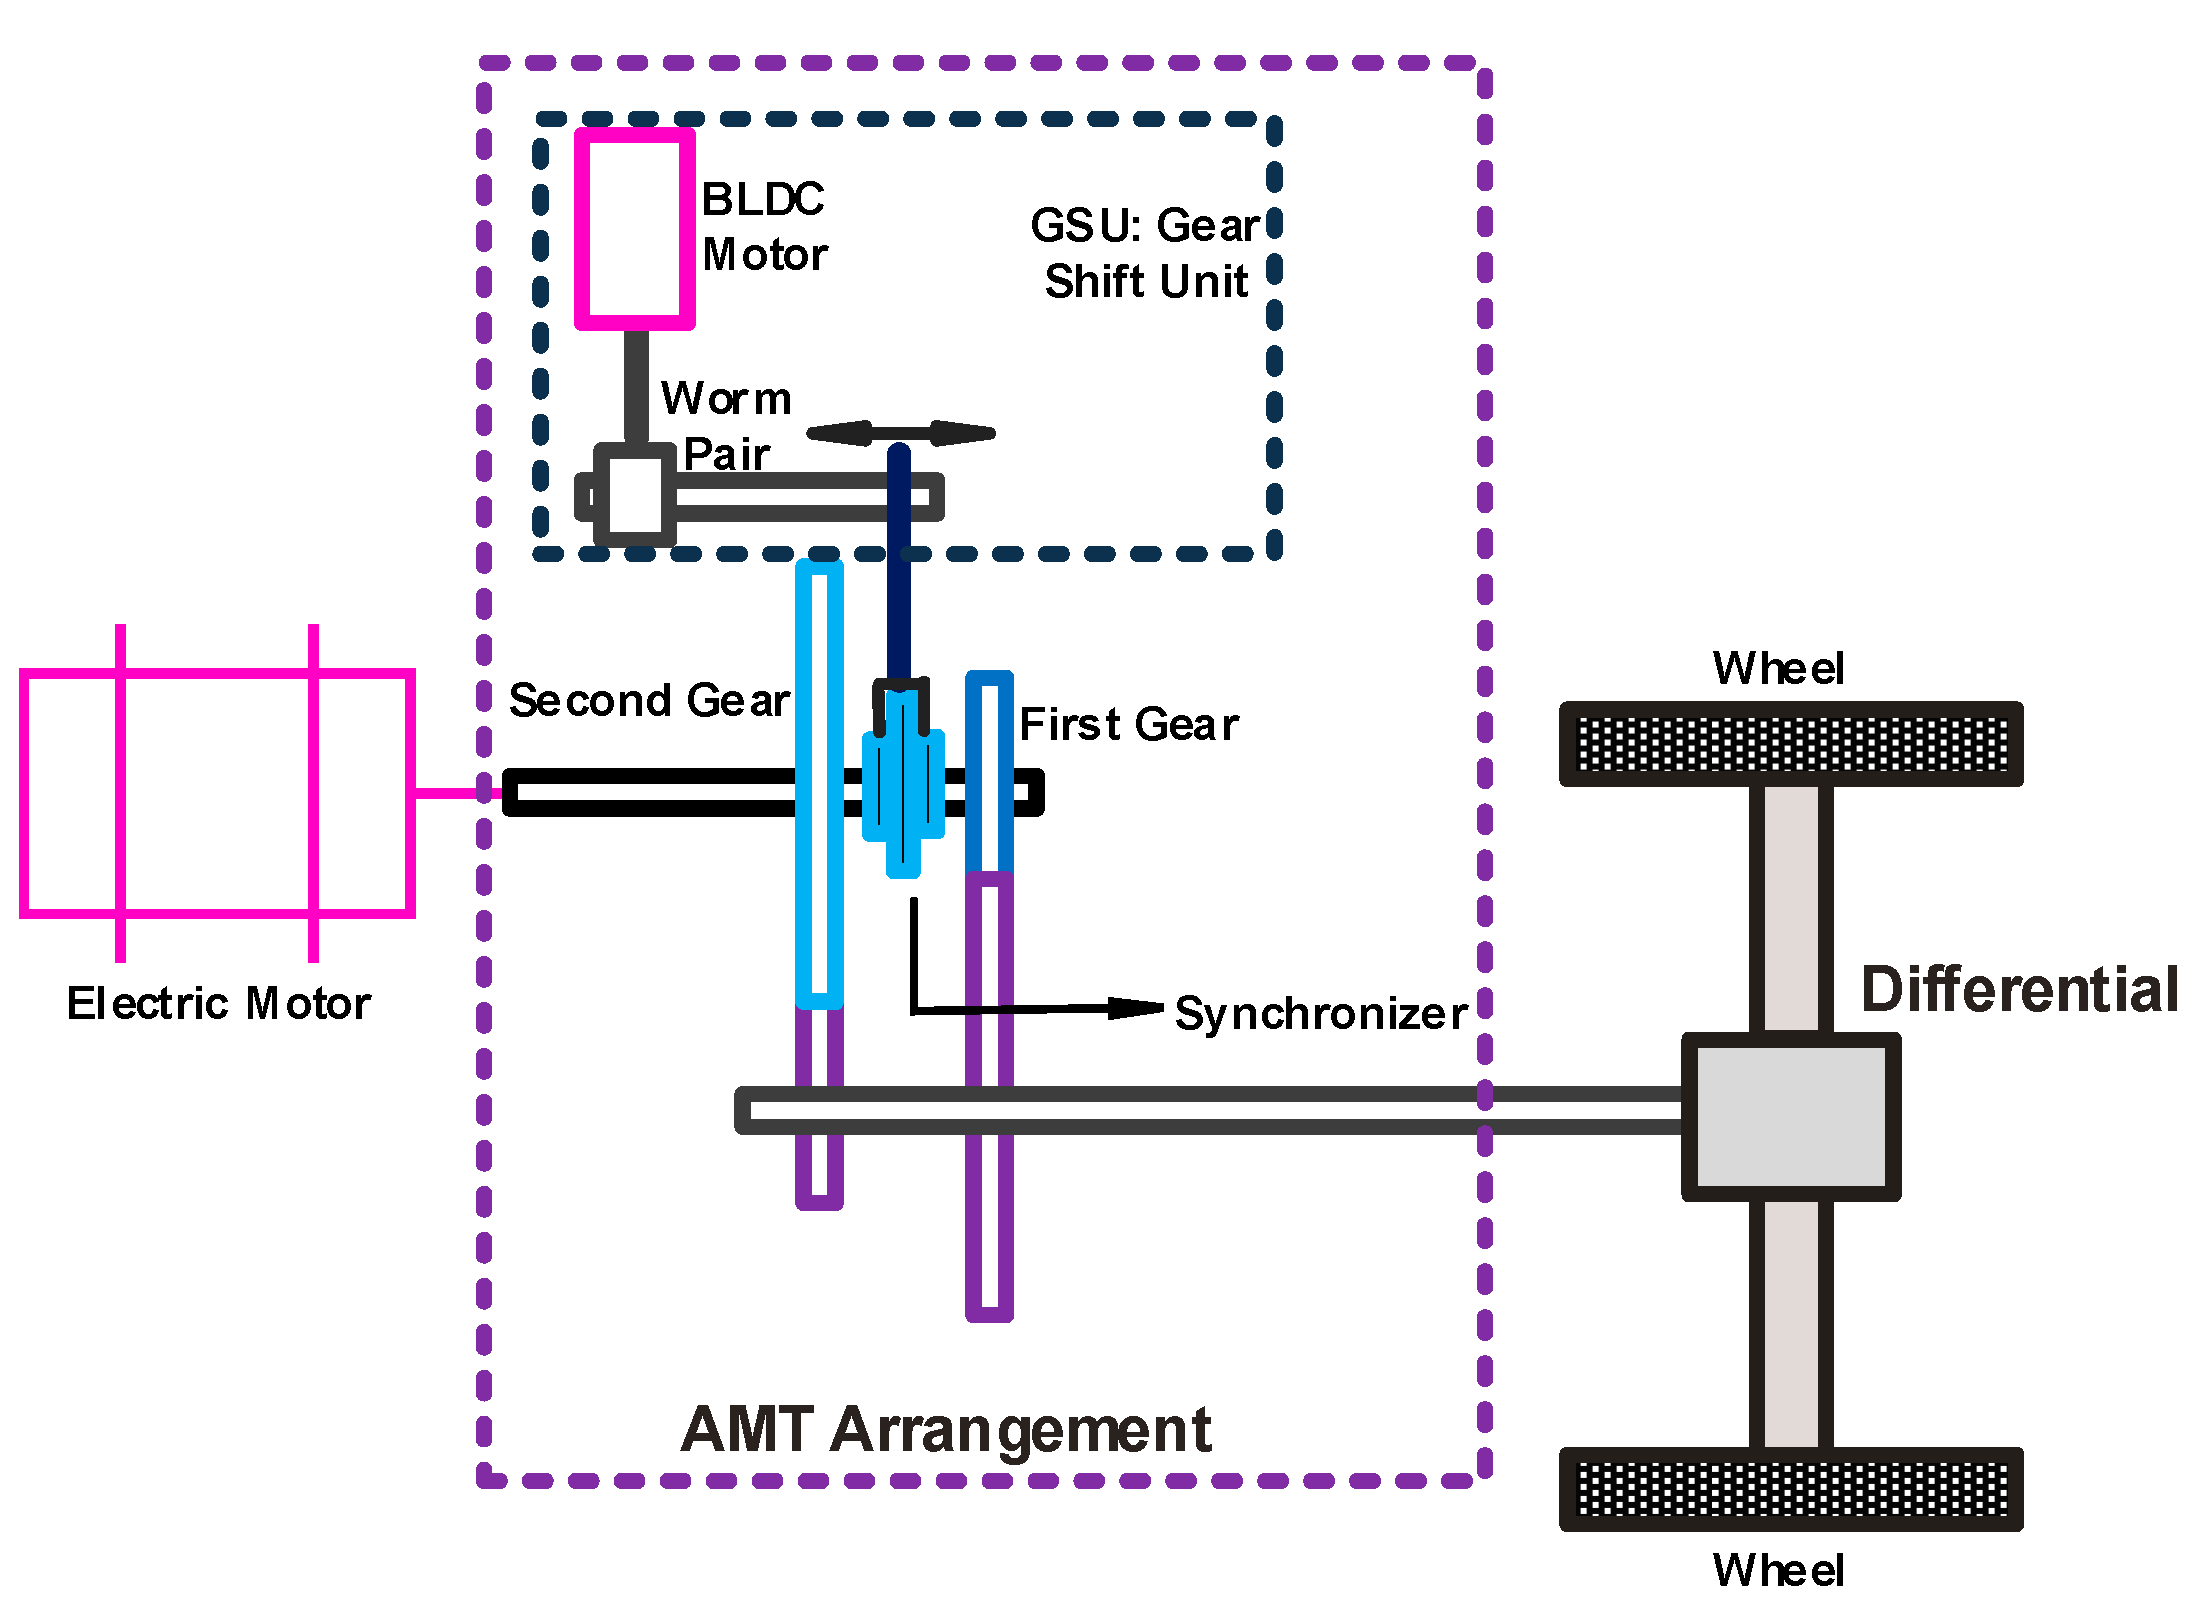
2.3. Transmission
3. Proposed Shift Scheduling Strategy
3.1. Gearshift Schedule Parameter–Vehicle Speed
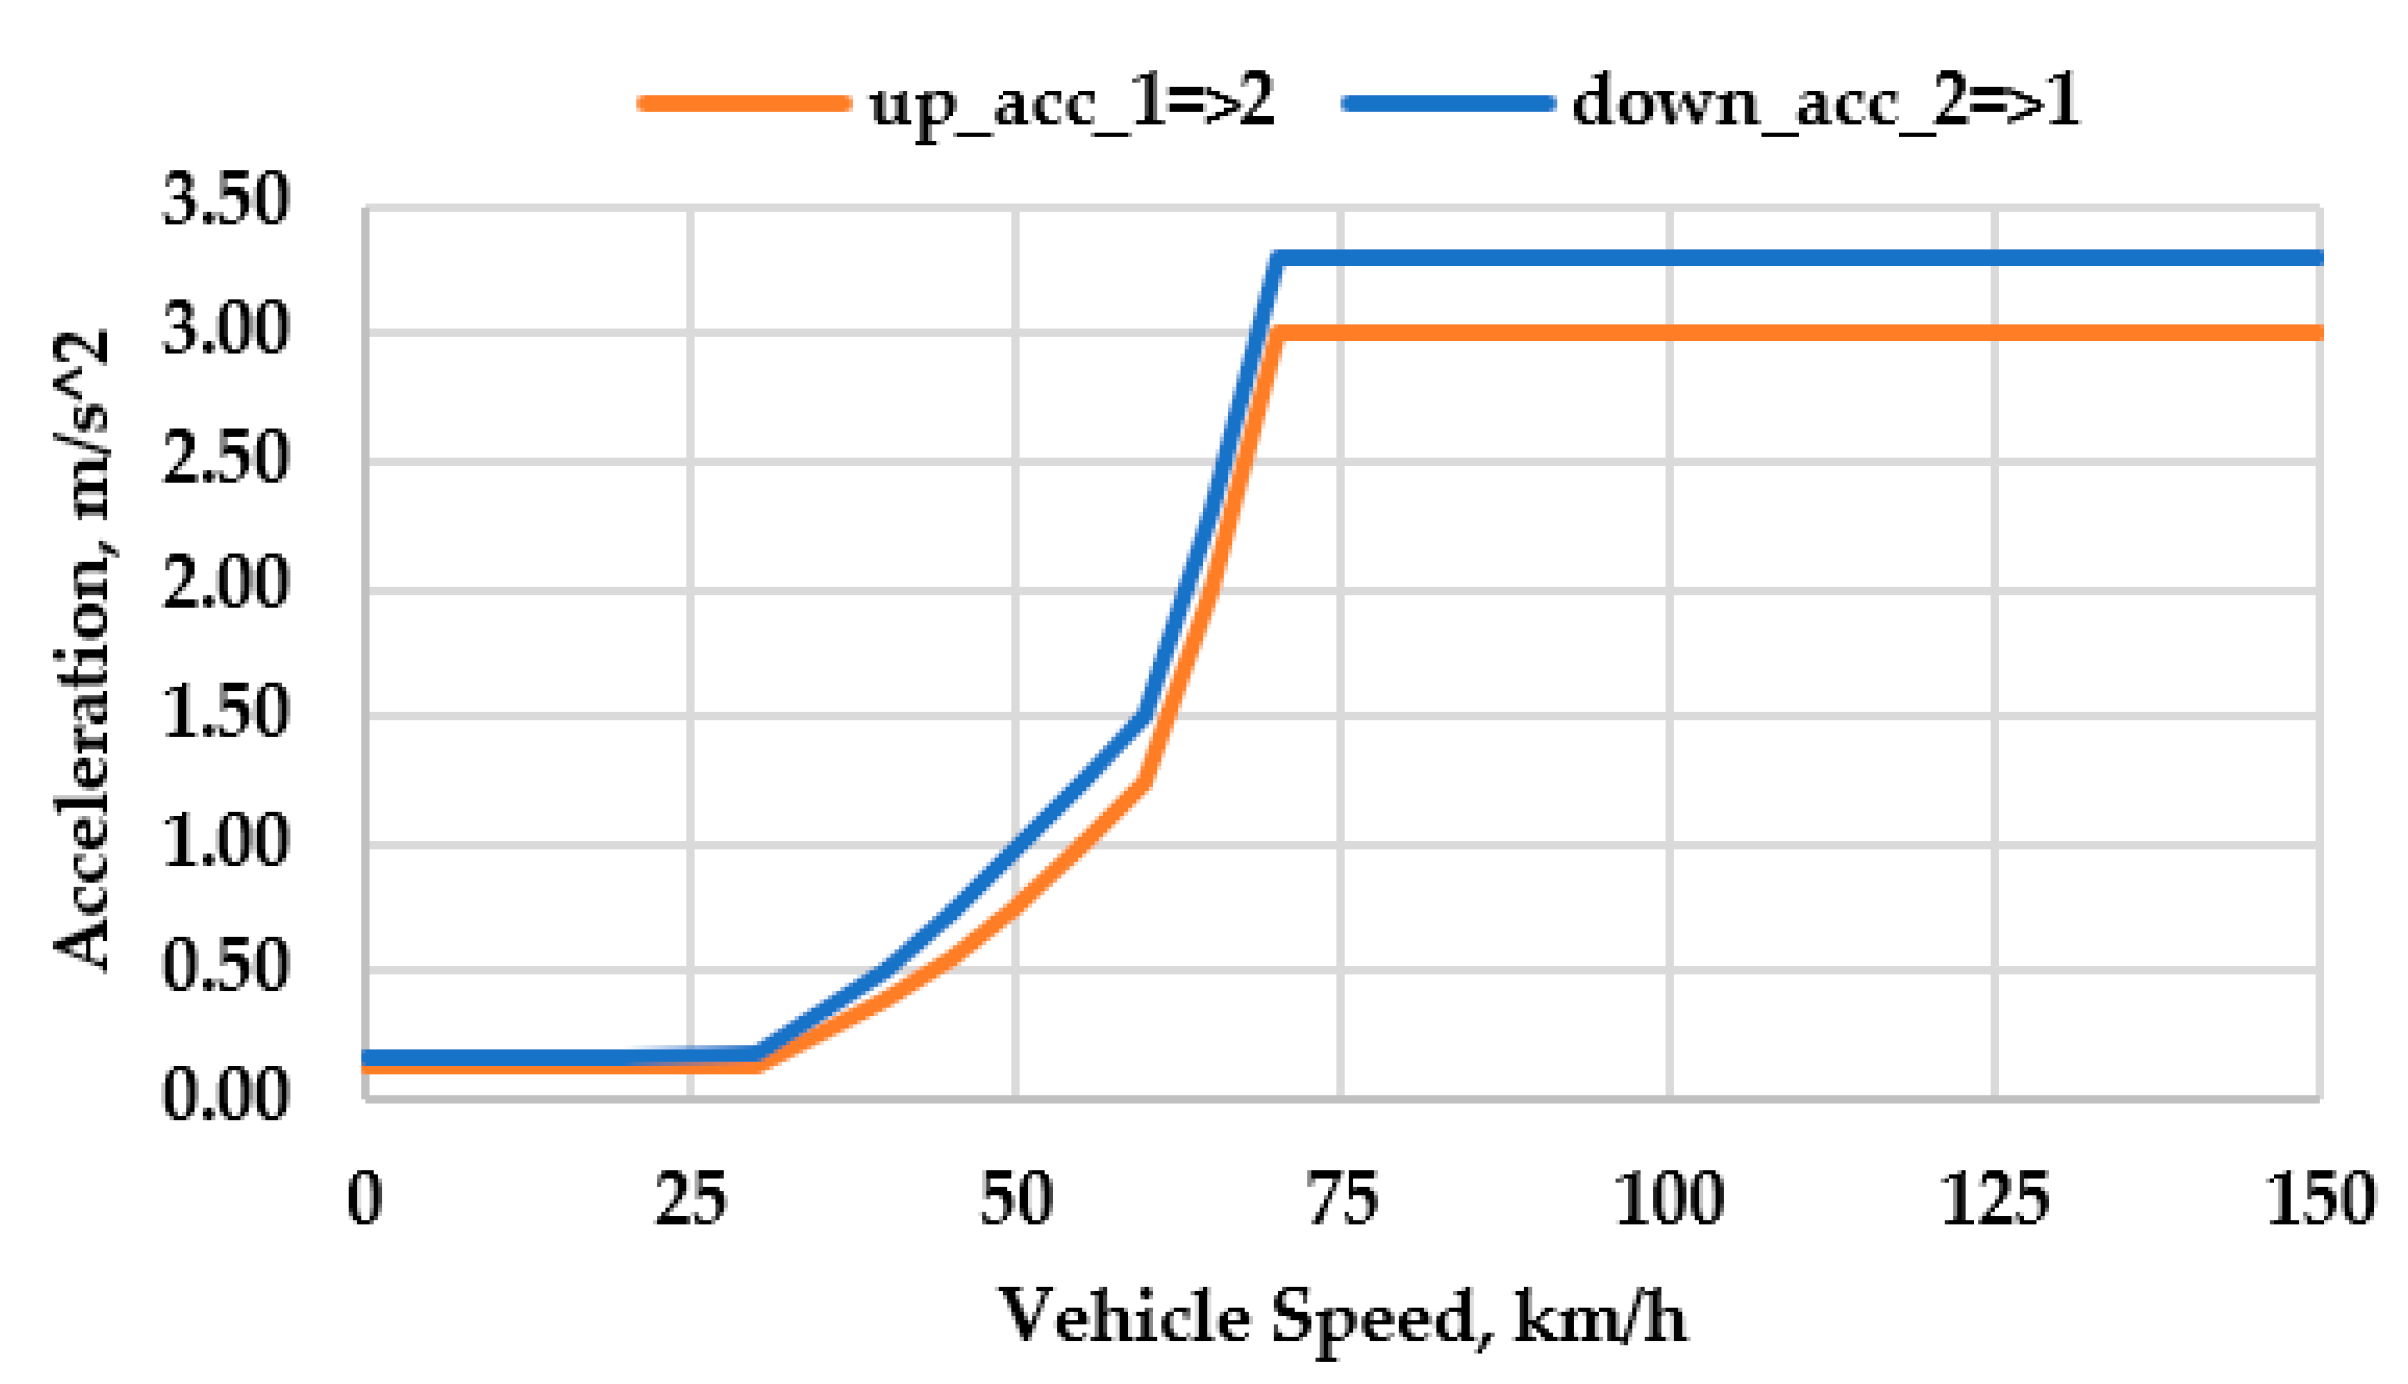
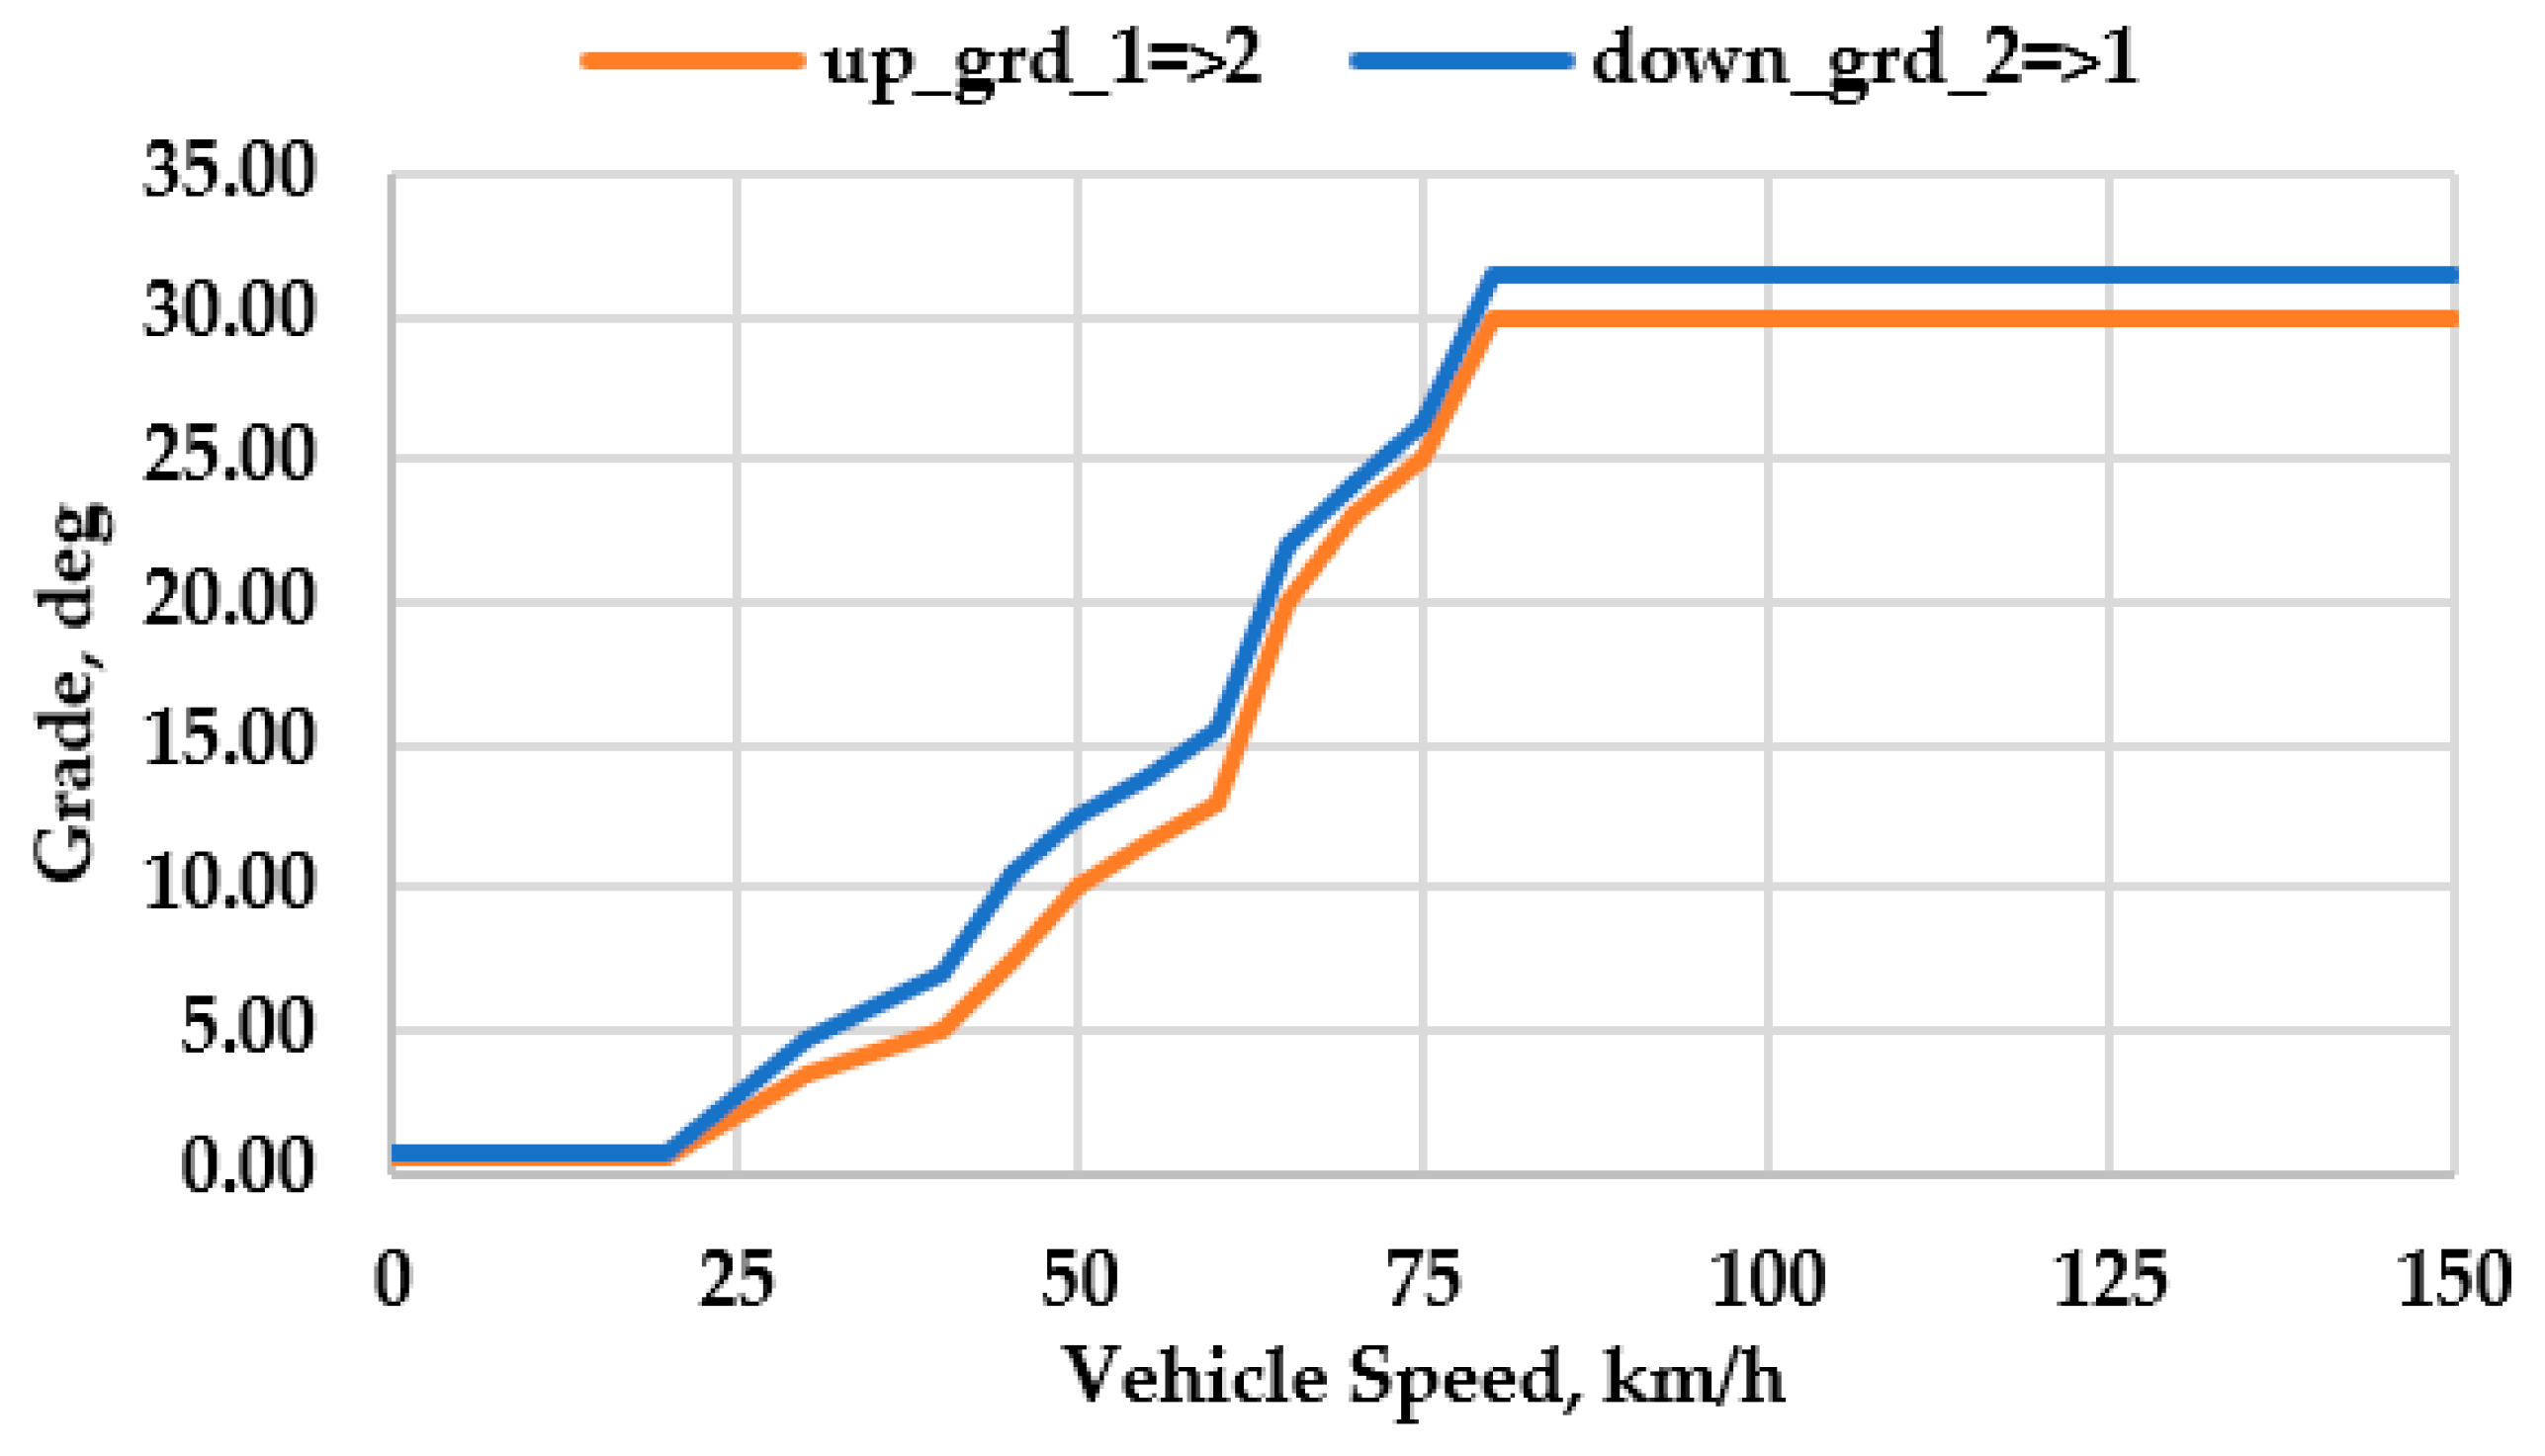
3.2. Gearshift Schedule Parameter–Road Grade and Vehicle Acceleration
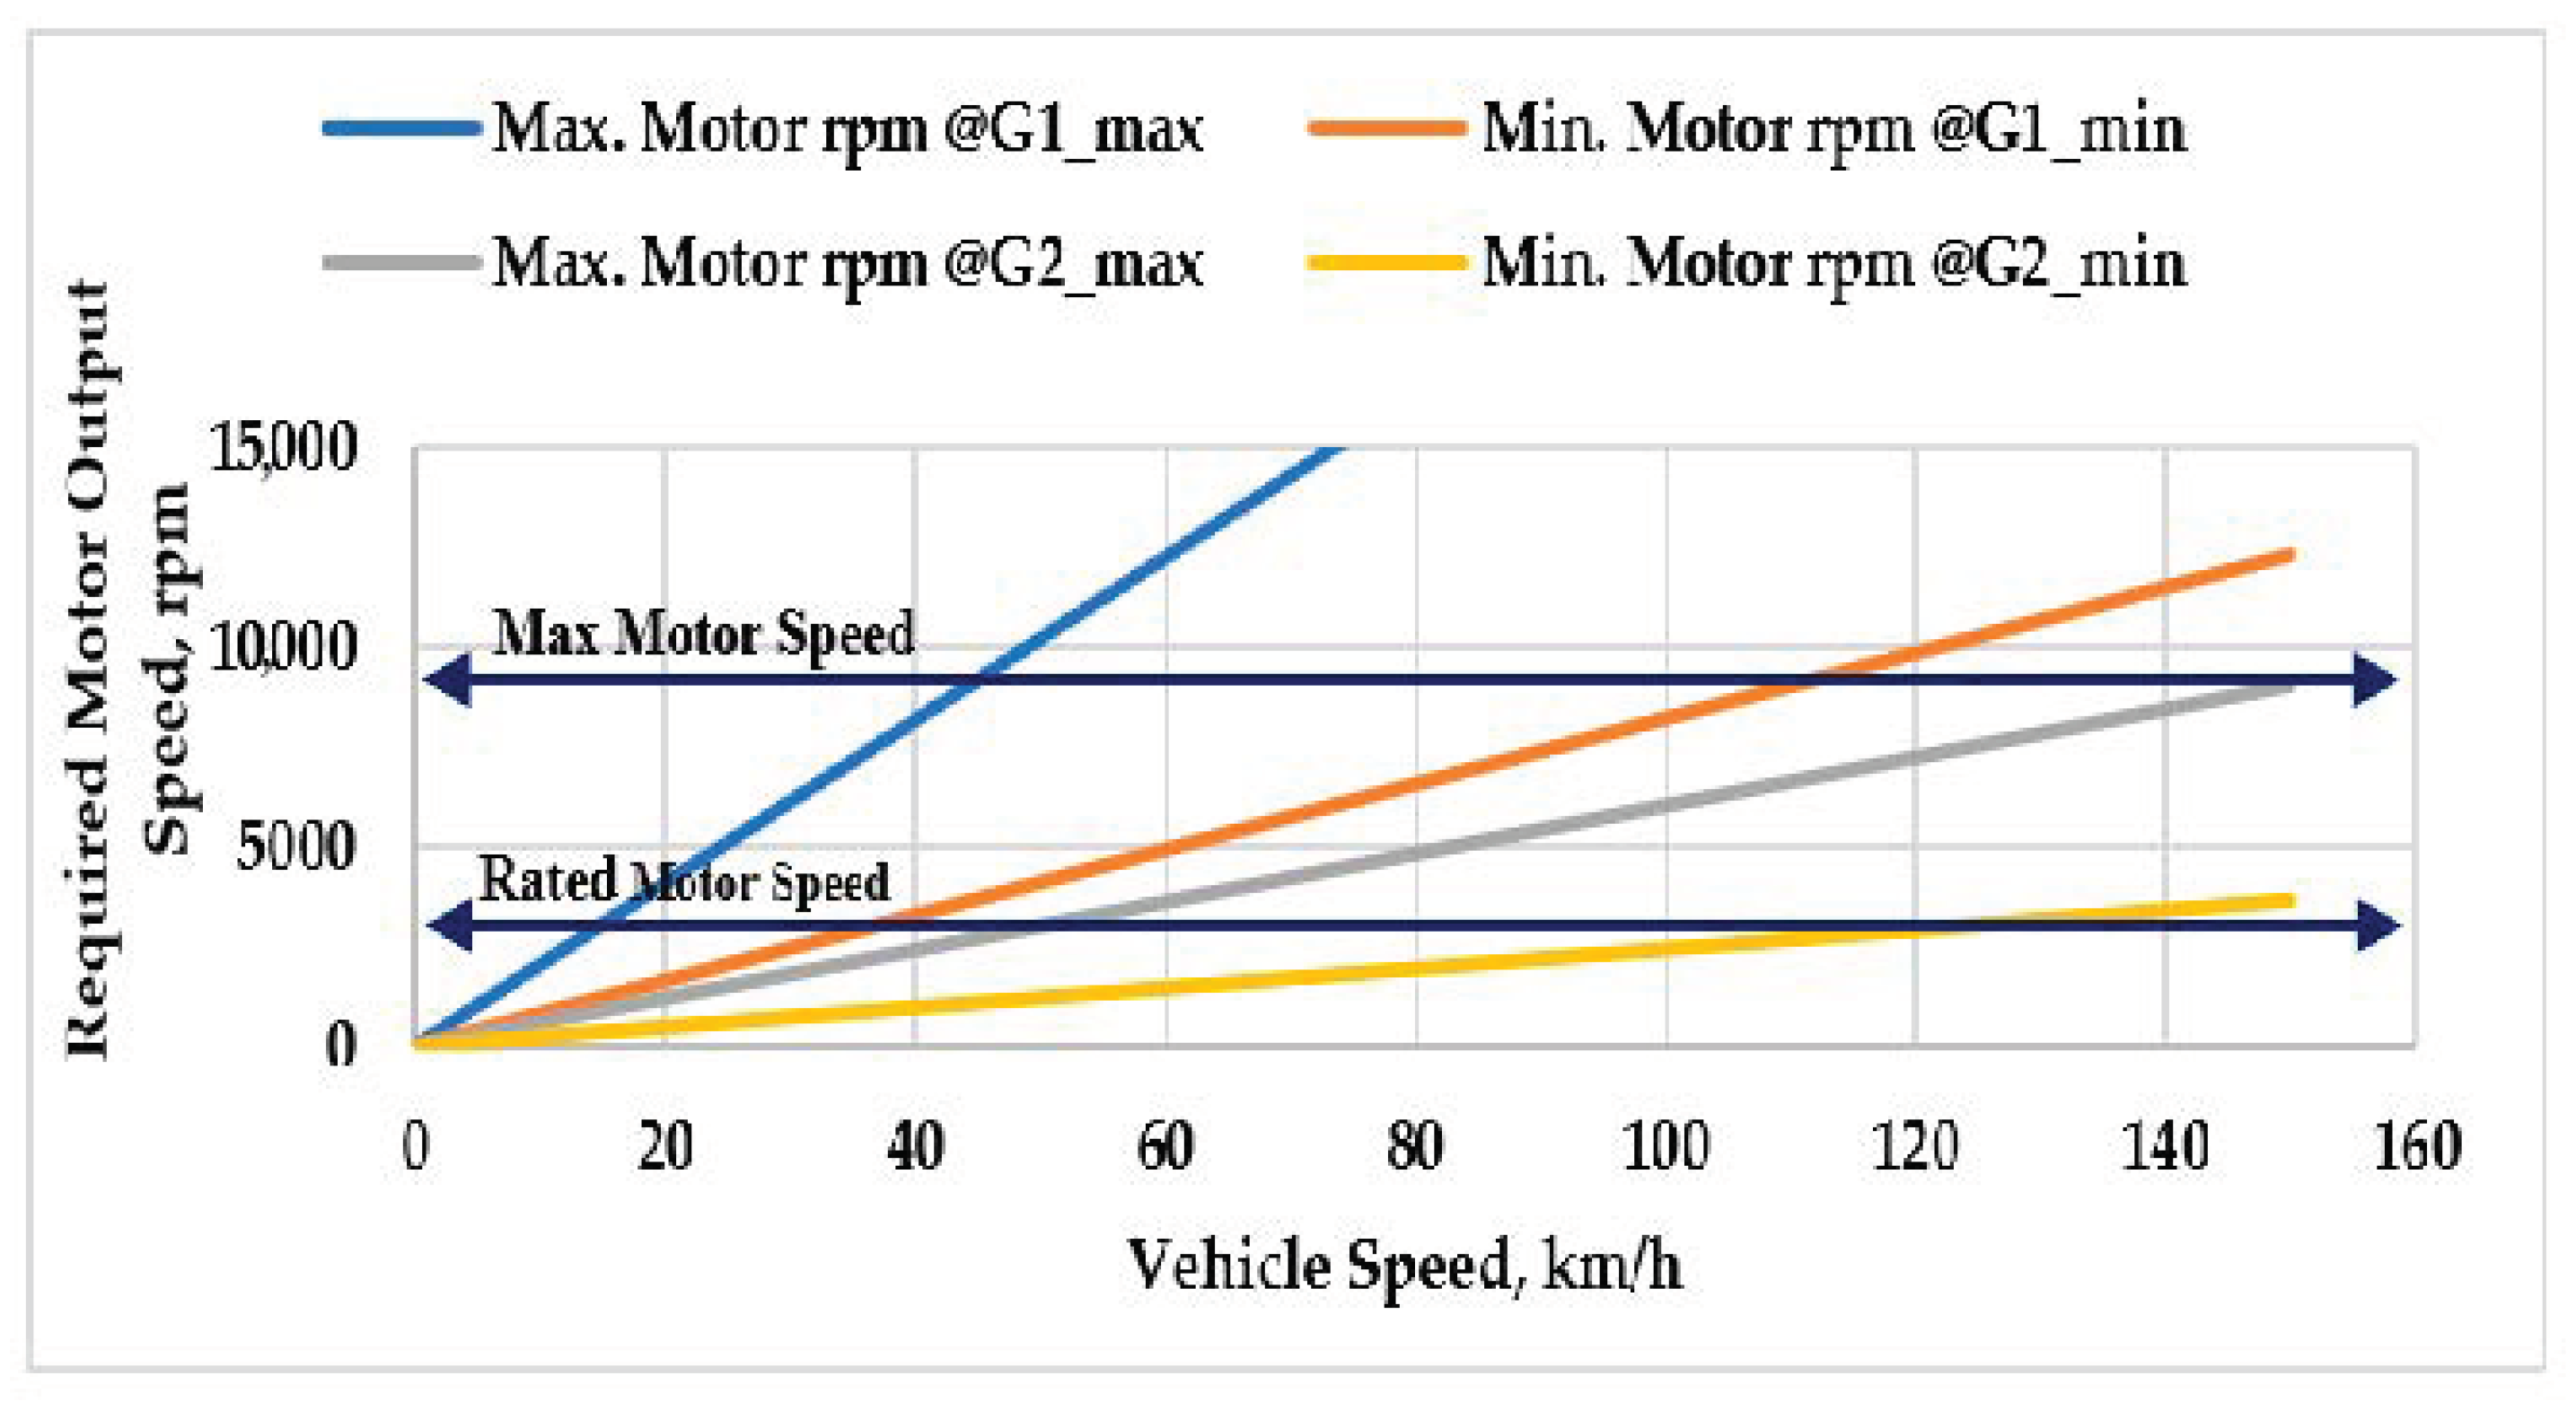
- Considering vehicle acceleration at different vehicle speed ranges and various road grades at different constant vehicle speeds, numerical analysis on the motor torque requirements has been conducted based on Equation (1). For any condition, there are three possible choices for a two-speed transmission system; i.e., the first is that only gear 1 can provide the required wheel torque at this vehicle speed, the second choice is only gear 2 can be the option, and the third is any gear can be chosen to supply the necessary torque and speed at the vehicle wheel. For the third scenario, the gear with the higher motor efficiency can be chosen to save energy consumption. Therefore, it is convenient to identify the three-speed regions such that each speed region can be associated with any of the above three choices as stated. At the low-speed region i.e., zero to approximately 20–25 km/h, gear 1 is an obvious option because of the high torque demand from the motor to meet up with the requirements at the initial vehicle acceleration or uphill driving scenario. Practically, gear 2 is not an option in this speed range, because the required motor output torque exceeds the maximum motor output torque limit in many cases or the motor operates at a very low efficiency region.
- Similarly, at a high-speed region i.e., 65–70 km/h or above, gear 1 cannot be selected, because the required motor speed goes over the maximum speed limit of the motor. Therefore, gear 2 can be set as the default selection in this speed range.
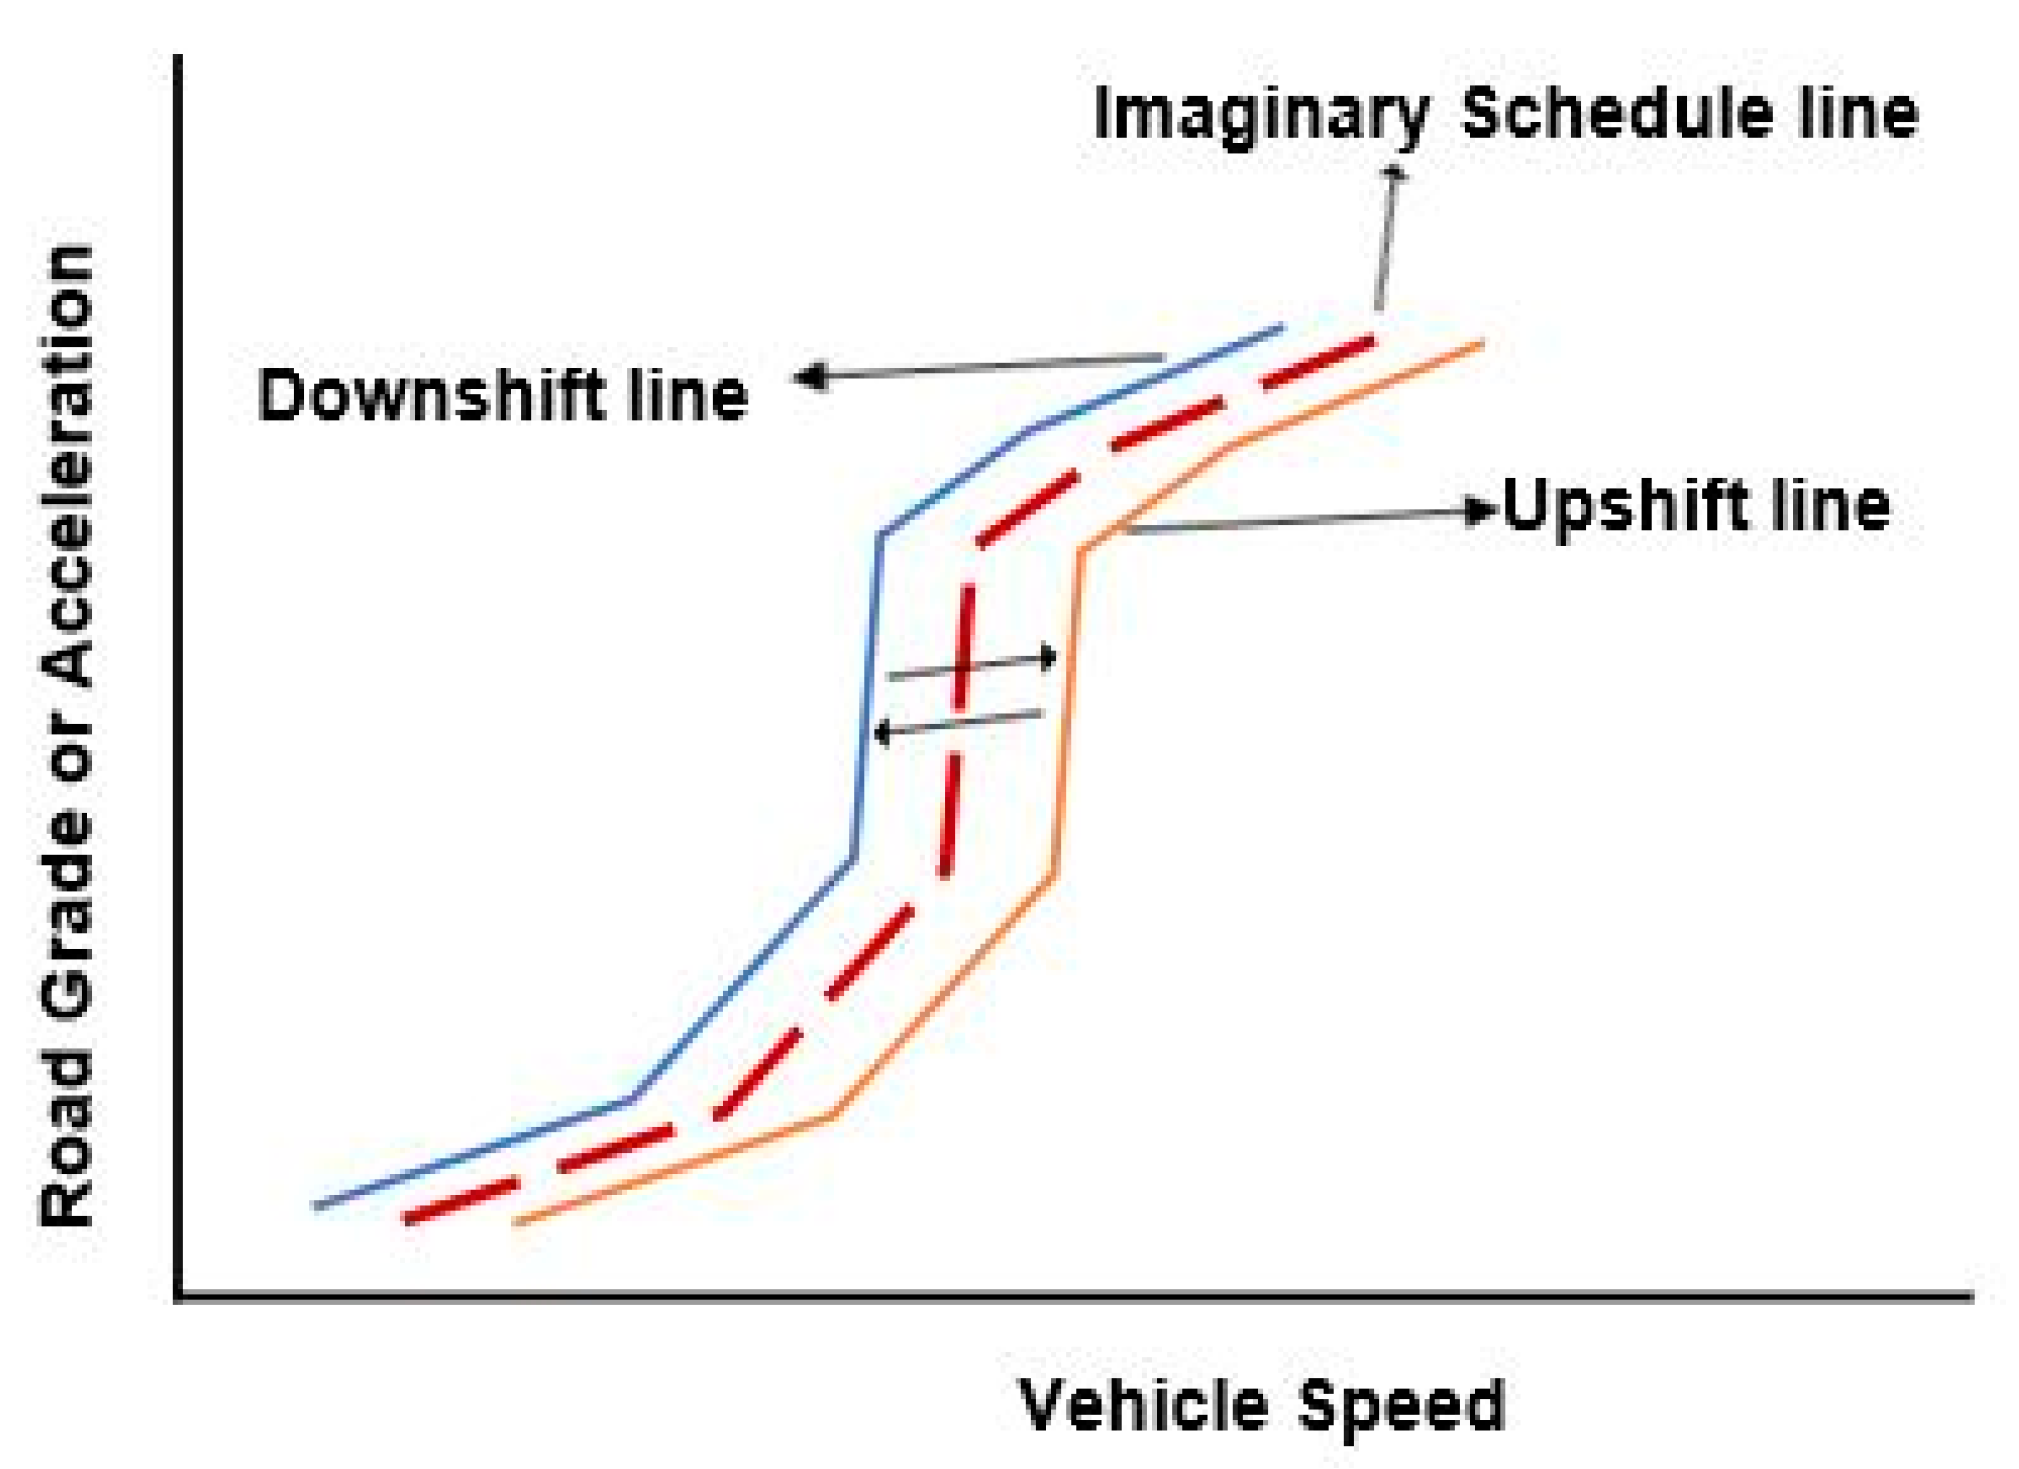
- Now, the gear selection problem can be narrowed down to the vehicle speed range between 20–25 km/h and 65–70 km/h where any gear could be a choice to meet up the requirements to run the vehicle. Here, the motor efficiency and rated motor capacity play the decision-making role for gear selection. Transition points for gear change are identified where the required motor output torque and speed at both gears are close to its rated capacity. Gear one is preferred at the vehicle speed below the speed corresponding to the transition points, and gear two is selected when the vehicle speed goes over the speed at the transition points. Next, the imaginary separation line can be achieved by connecting the transition points.
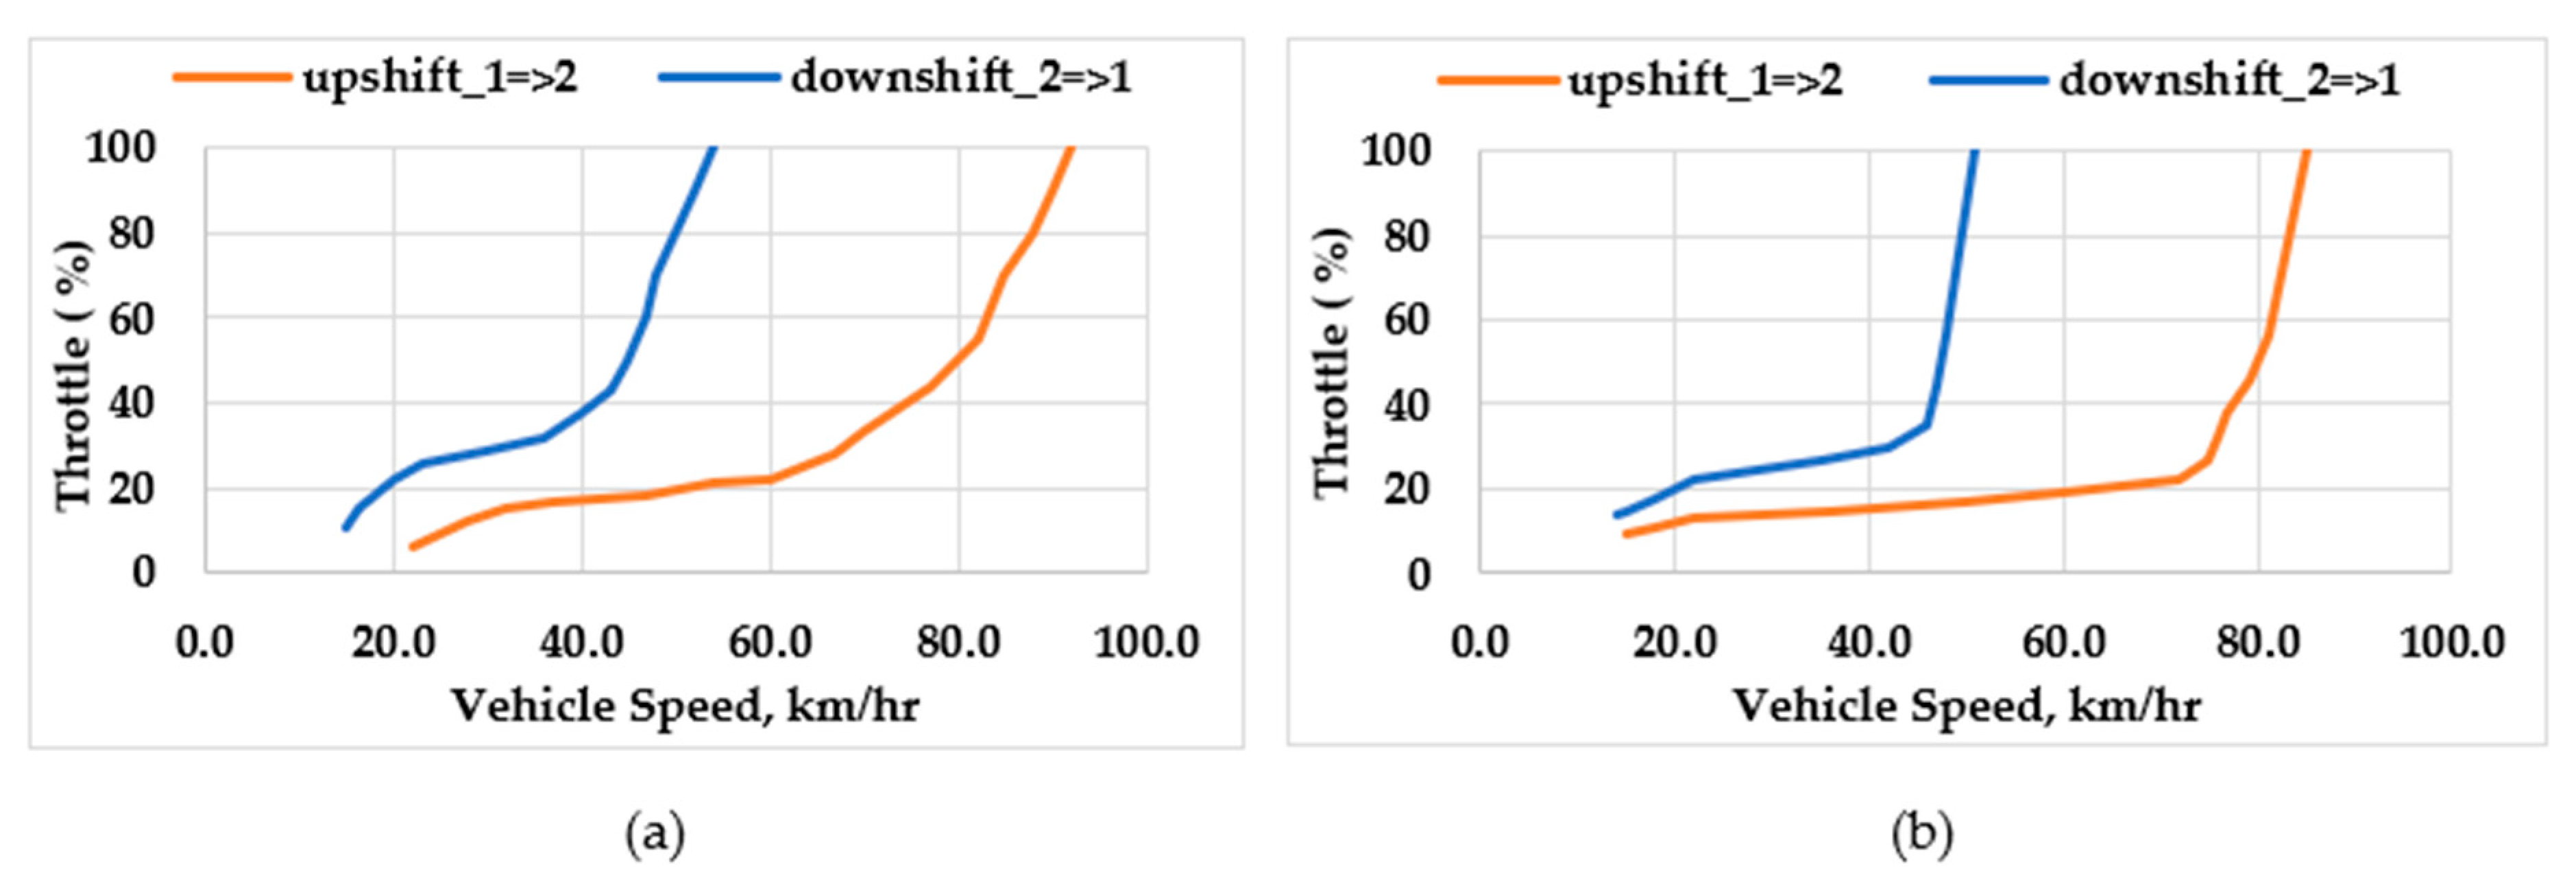
- An imaginary separation line needs to be split up into two lines i.e., upshift and downshift lines, to avoid frequent gearshift through applying an appropriate weighting factor. Zhang et al. [46] used a hysteresis strategy where the gearshift line is increased by 20% to set the upshift line and is decreased by 20% for the downshift line. Another common technique of implementing a weighting factor is to apply a penalty factor within the optimization algorithm to prevent the repeated gearshift [47,48]. Although these techniques are applied on throttle demand vs. vehicle speed-based gearshift schedule and cannot be directly linked to the proposed schedule in relation to road grade and vehicle acceleration, these could be considered as a general guideline. In this study, the weighting factor is set manually considering mainly two factors [49], i.e., avoiding frequent gearshift to ensure rider comfort and kick-downshifting during high acceleration demand. Therefore, the weighting factor is not necessarily the same at all vehicle speeds. However, a buffer zone of 10–40% has been maintained between the downshift line and upshift line that will be further optimized through applying an appropriate optimization method in the later part of this paper.
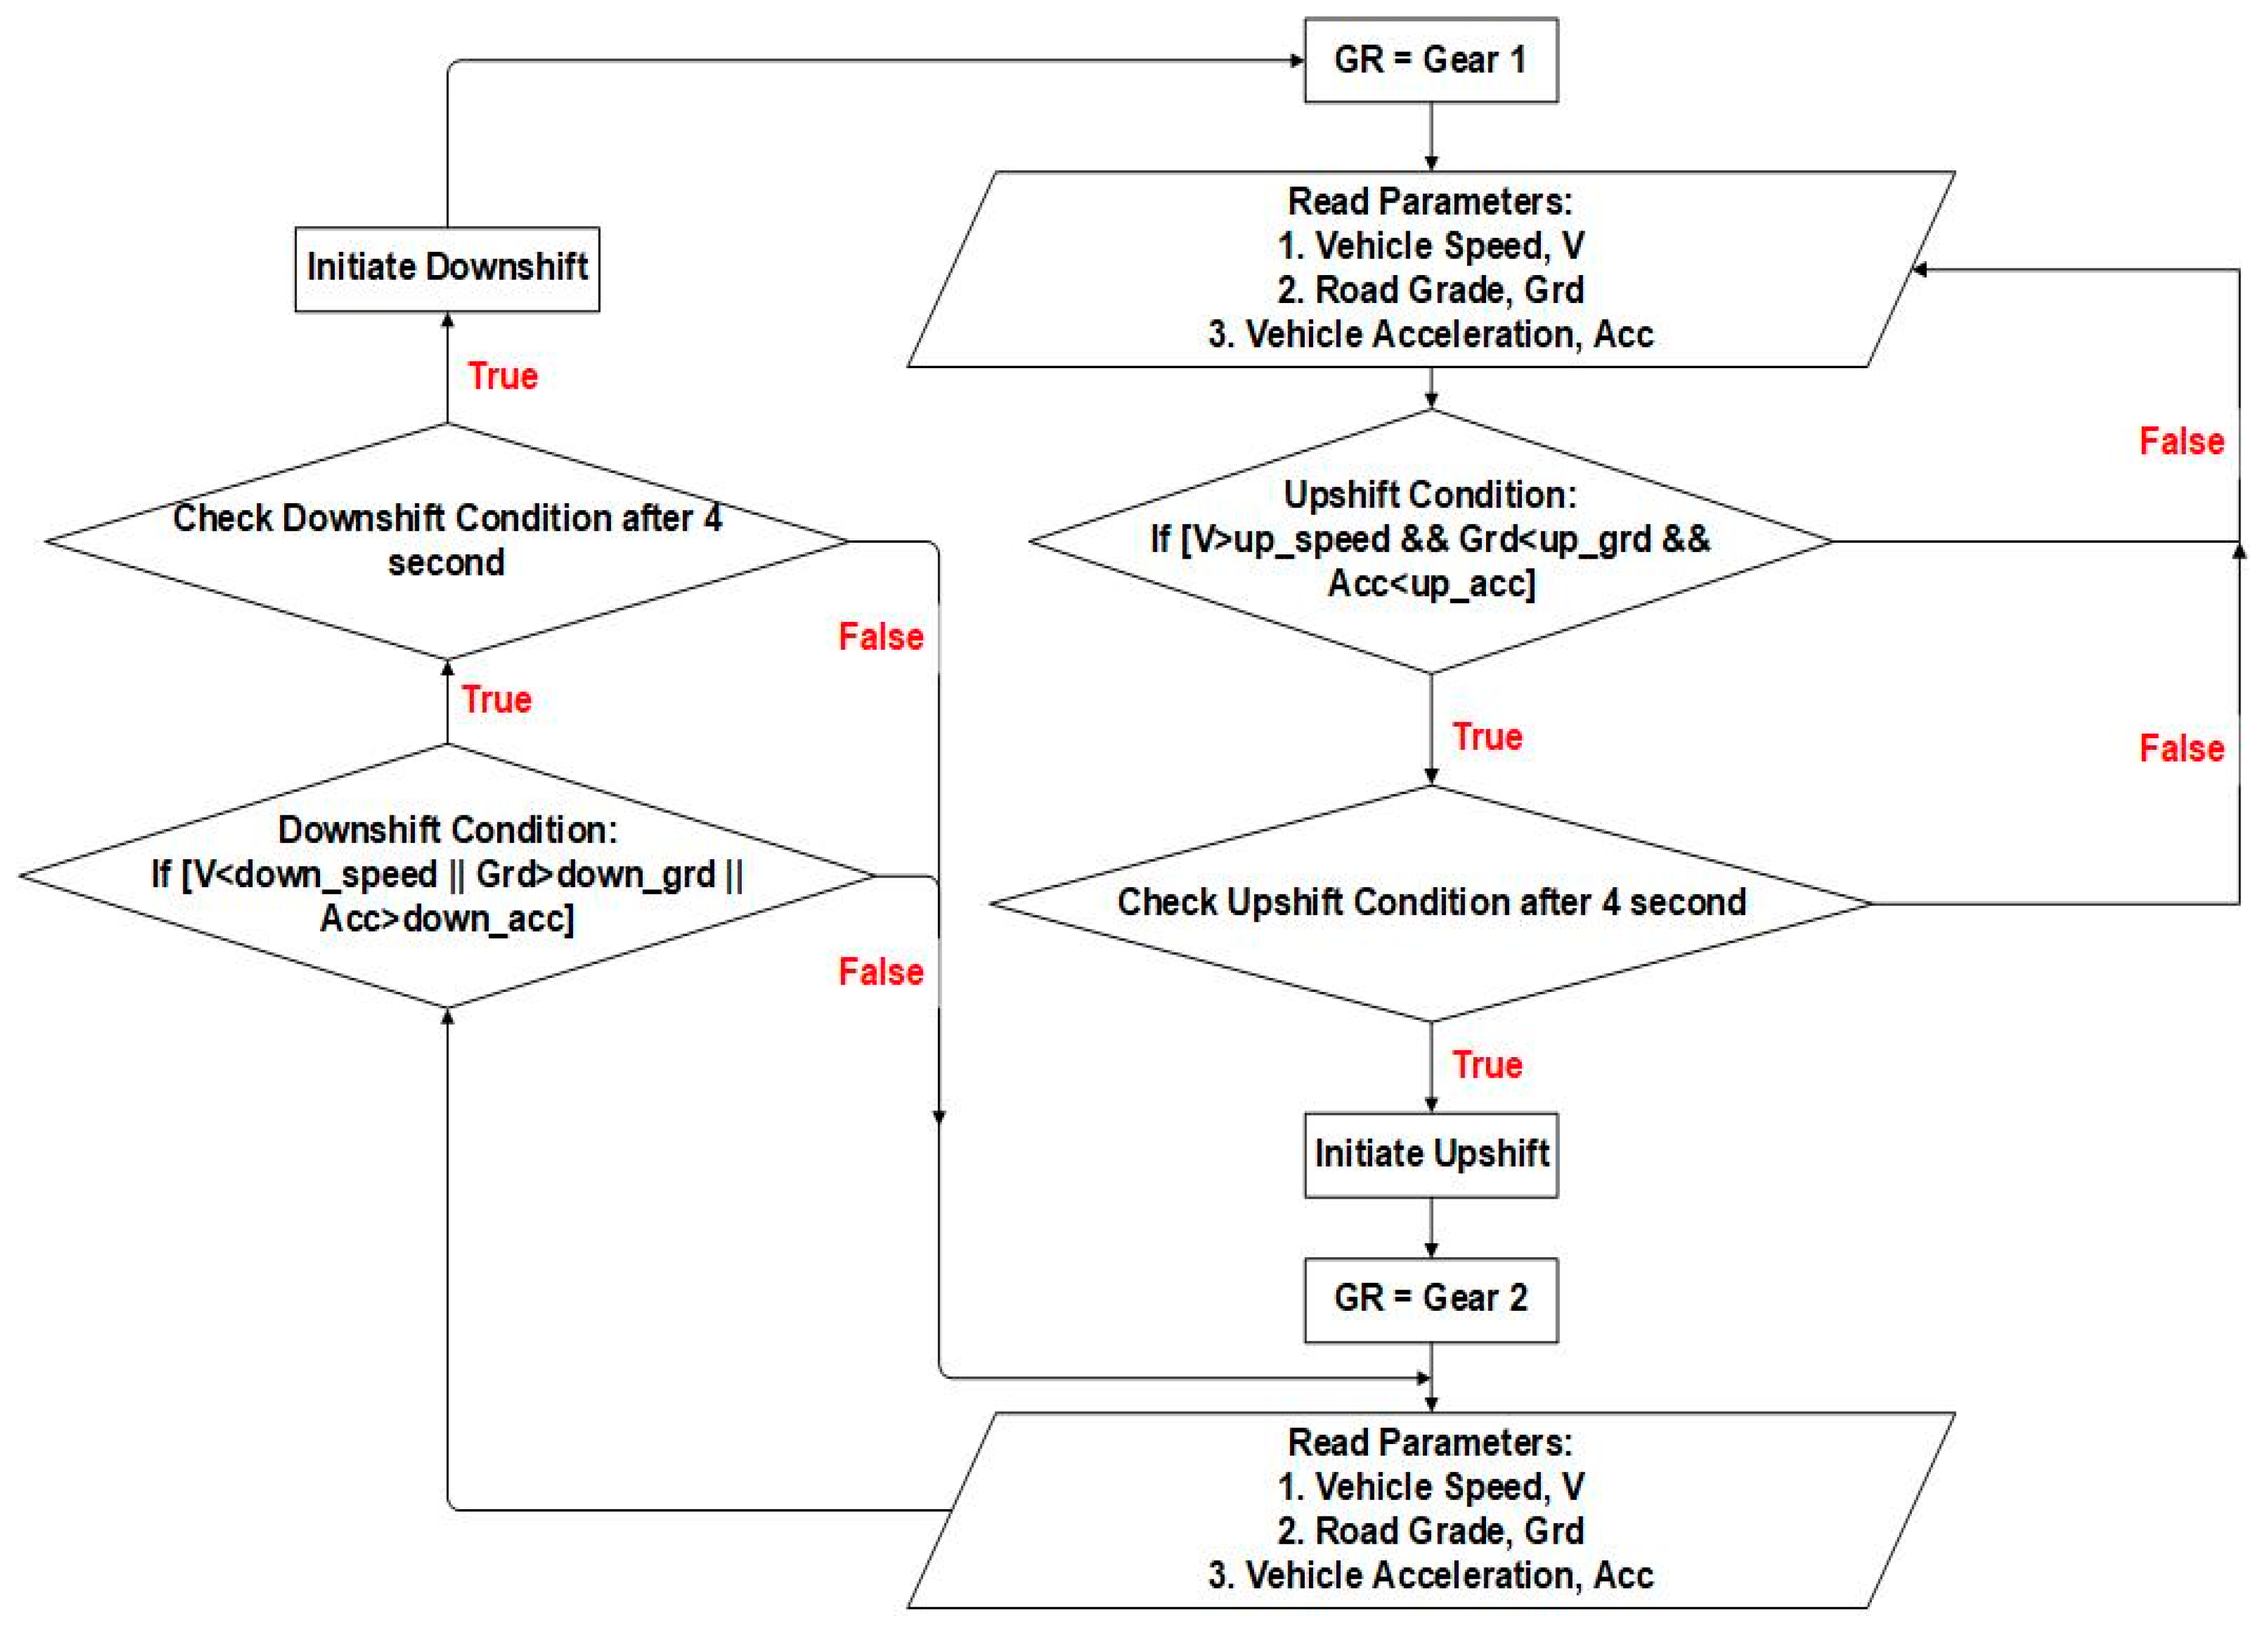
3.3. Gearshift Control
4. Optimization Method
4.1. Problem Formulation
4.2. Boundary Conditions and Constraints
5. Simulation and Result Analysis
5.1. Optimization of Gear Ratios and Gearshift Schedule for Vehicle Acceleration
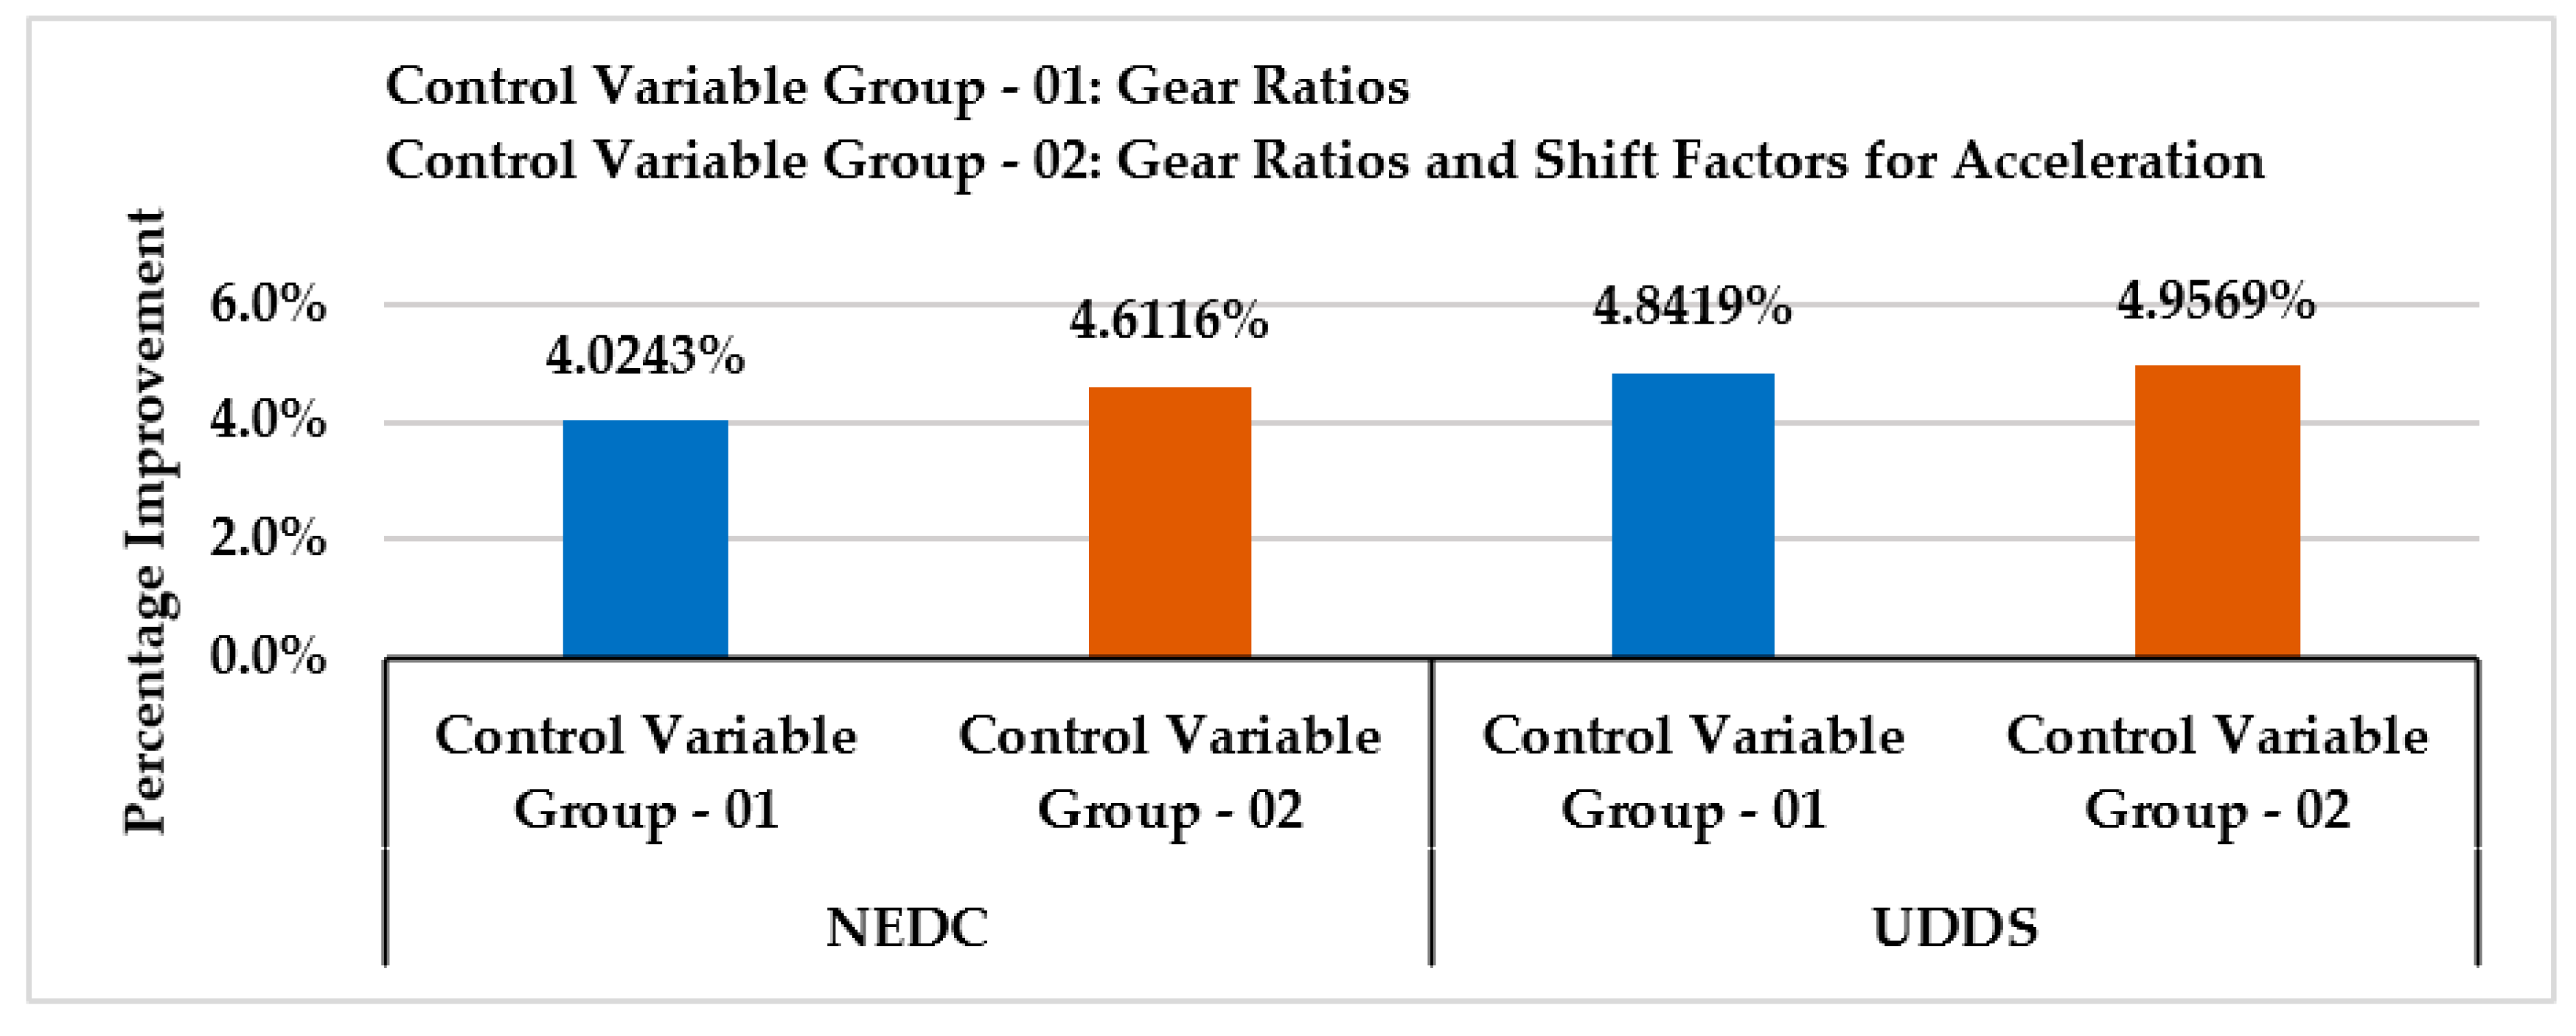
- After optimization, both GD and PS methods offer almost similar improvements in terms of energy consumption i.e., 4–5% less energy consumption depending on the driving scenarios i.e., NEDC or UDDS, as plotted in Figure 11. Another reflection from the results in Table 7 is that compared to the impact on the energy consumption by the shift factors of the shifting map for acceleration, gear ratios play more dominating roles on vehicle economic performance.
- For both driving scenarios i.e., NEDC and UDDS, optimized gear ratios achieved through both GD and PS methods are practically the same with little difference (approximately 0.02%) in the second gear ratio. To the other end, the shift factors of the gearshift map for vehicle acceleration are same for the GD methods on either driving conditions, while some difference can be noticed in the results through the PS method.
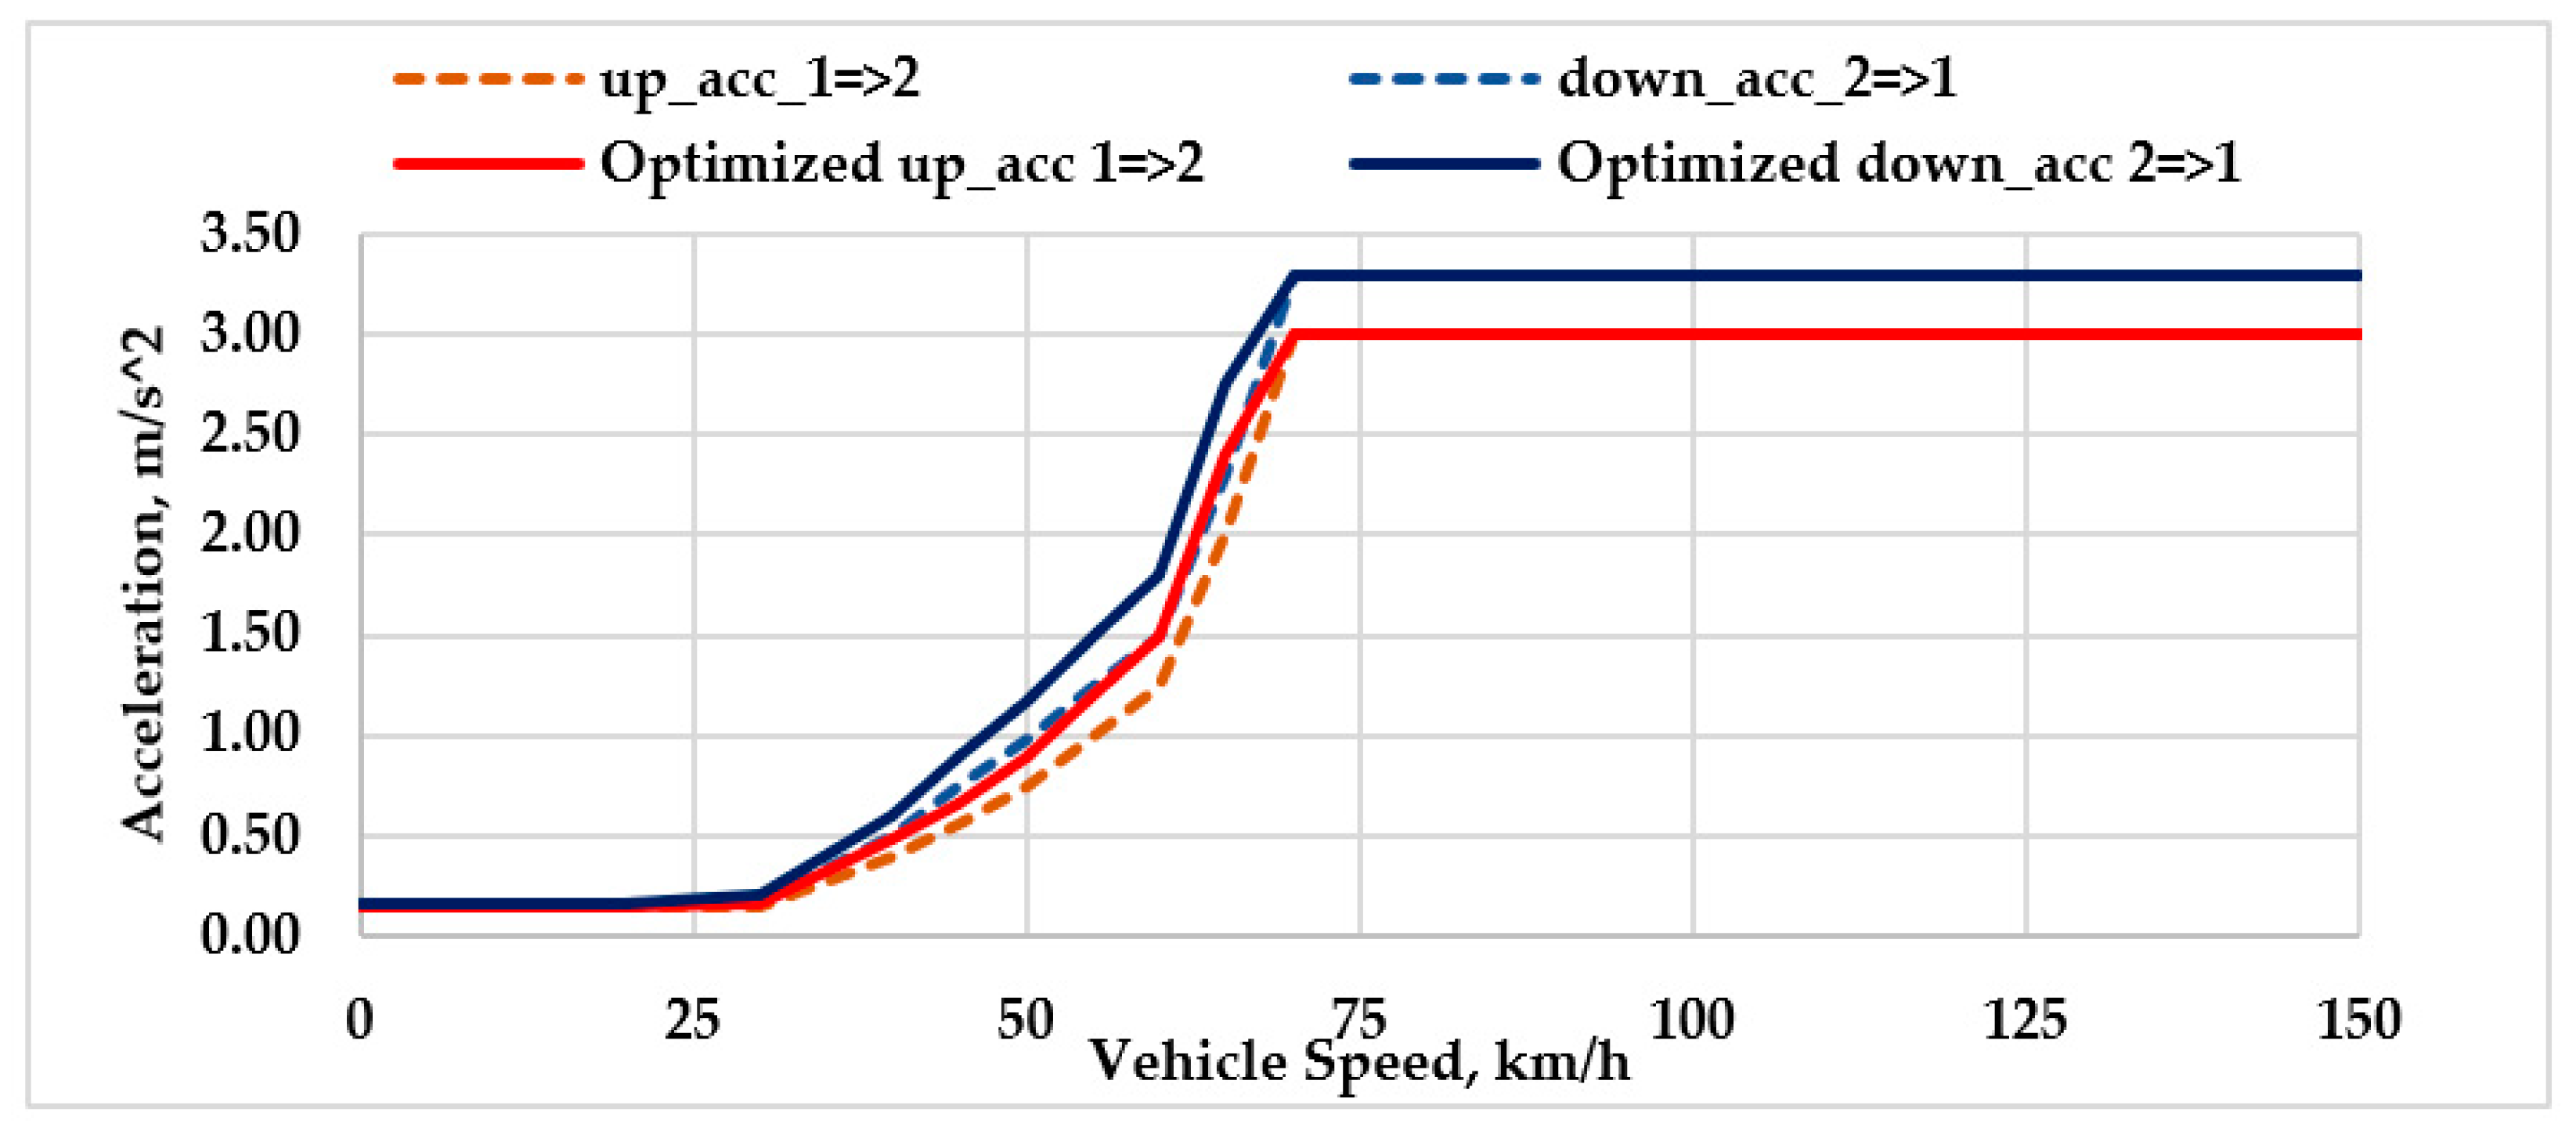
- A significant observation is that both optimization methods tried to move the gear ratios toward the lower bound of each gear ratio. This indicates that the lower value of gear ratios will contribute to economic driving. However, further lowering the value of gear ratios has been restricted by dynamic performance targets. Secondly, an upward move (20% for the GD method and nearly 15% for the PS method) based on the results in Table 7 of both upshift and downshift lines of the gearshift schedule for acceleration is experienced after optimization, while the buffer zone of primary gearshift schedule is maintained as illustrated in Figure 12. An exception with the PS method i.e., close to the primary gearshift schedule with a slightly wider buffer zone, is observed after optimization with the NEDC driving cycle. Although shift factors for vehicle acceleration have relatively less impact on energy consumption, the results could be viewed as a guideline to generate the primary gearshift schedule with more confidence.
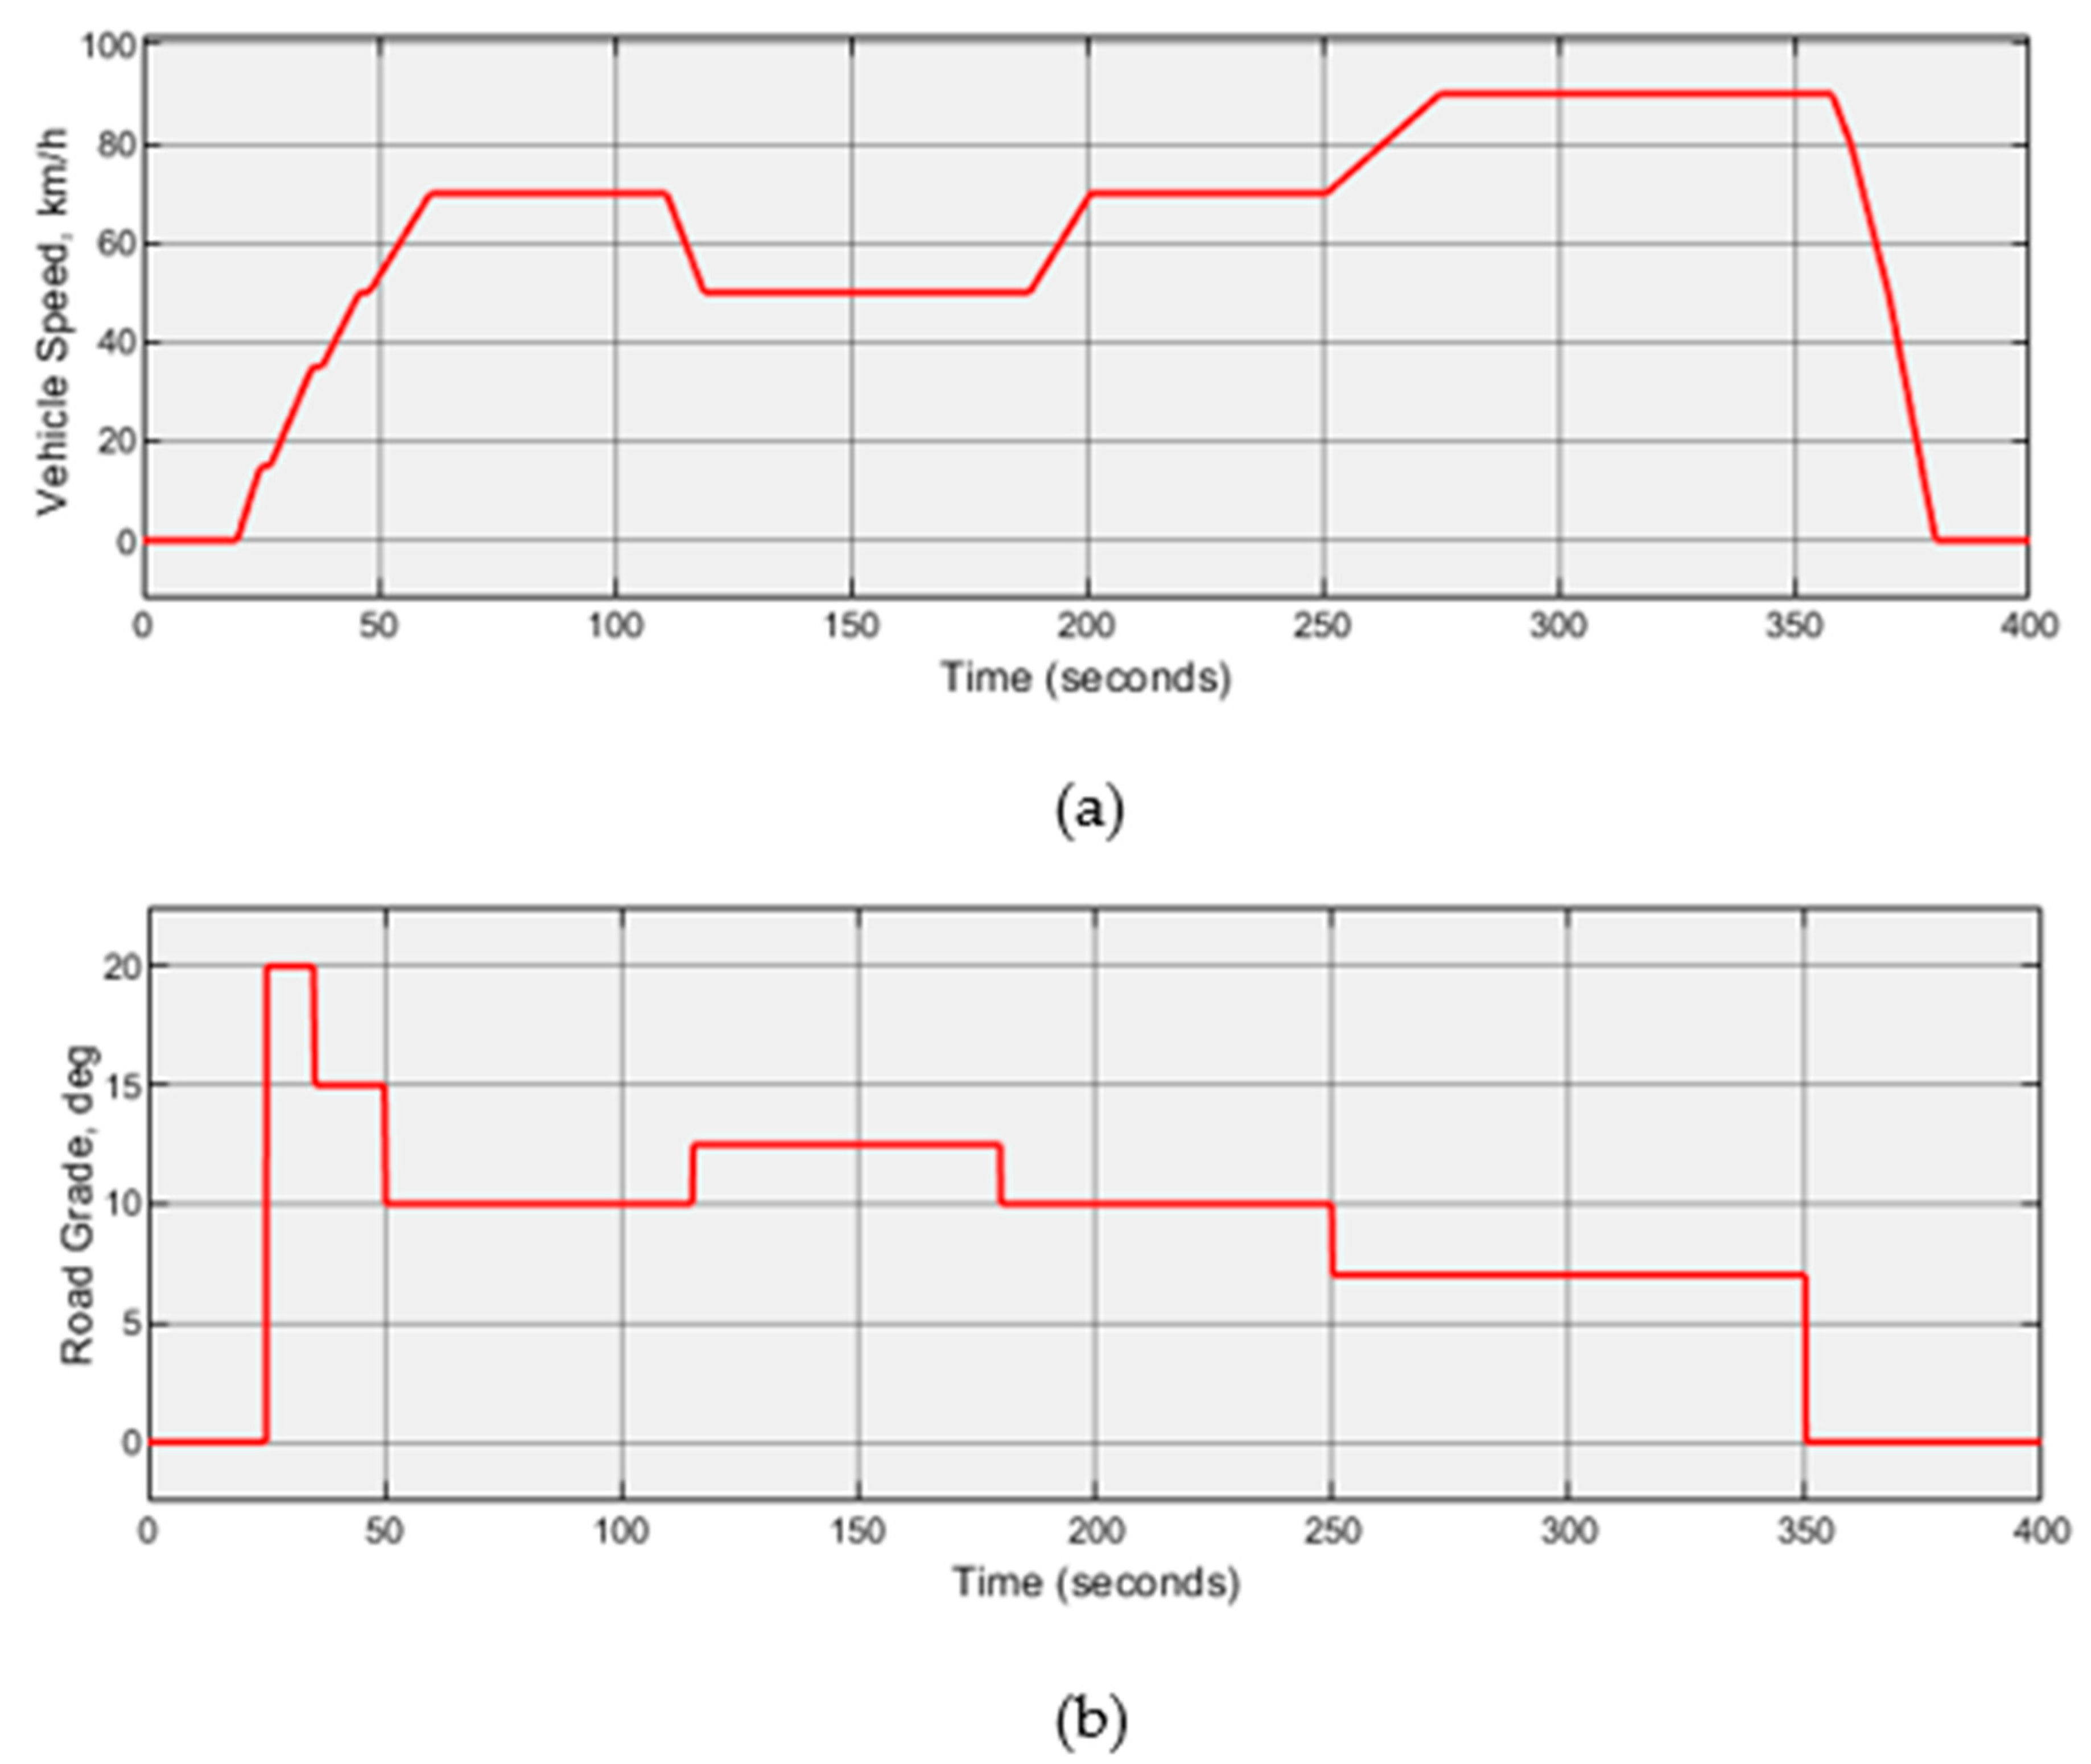
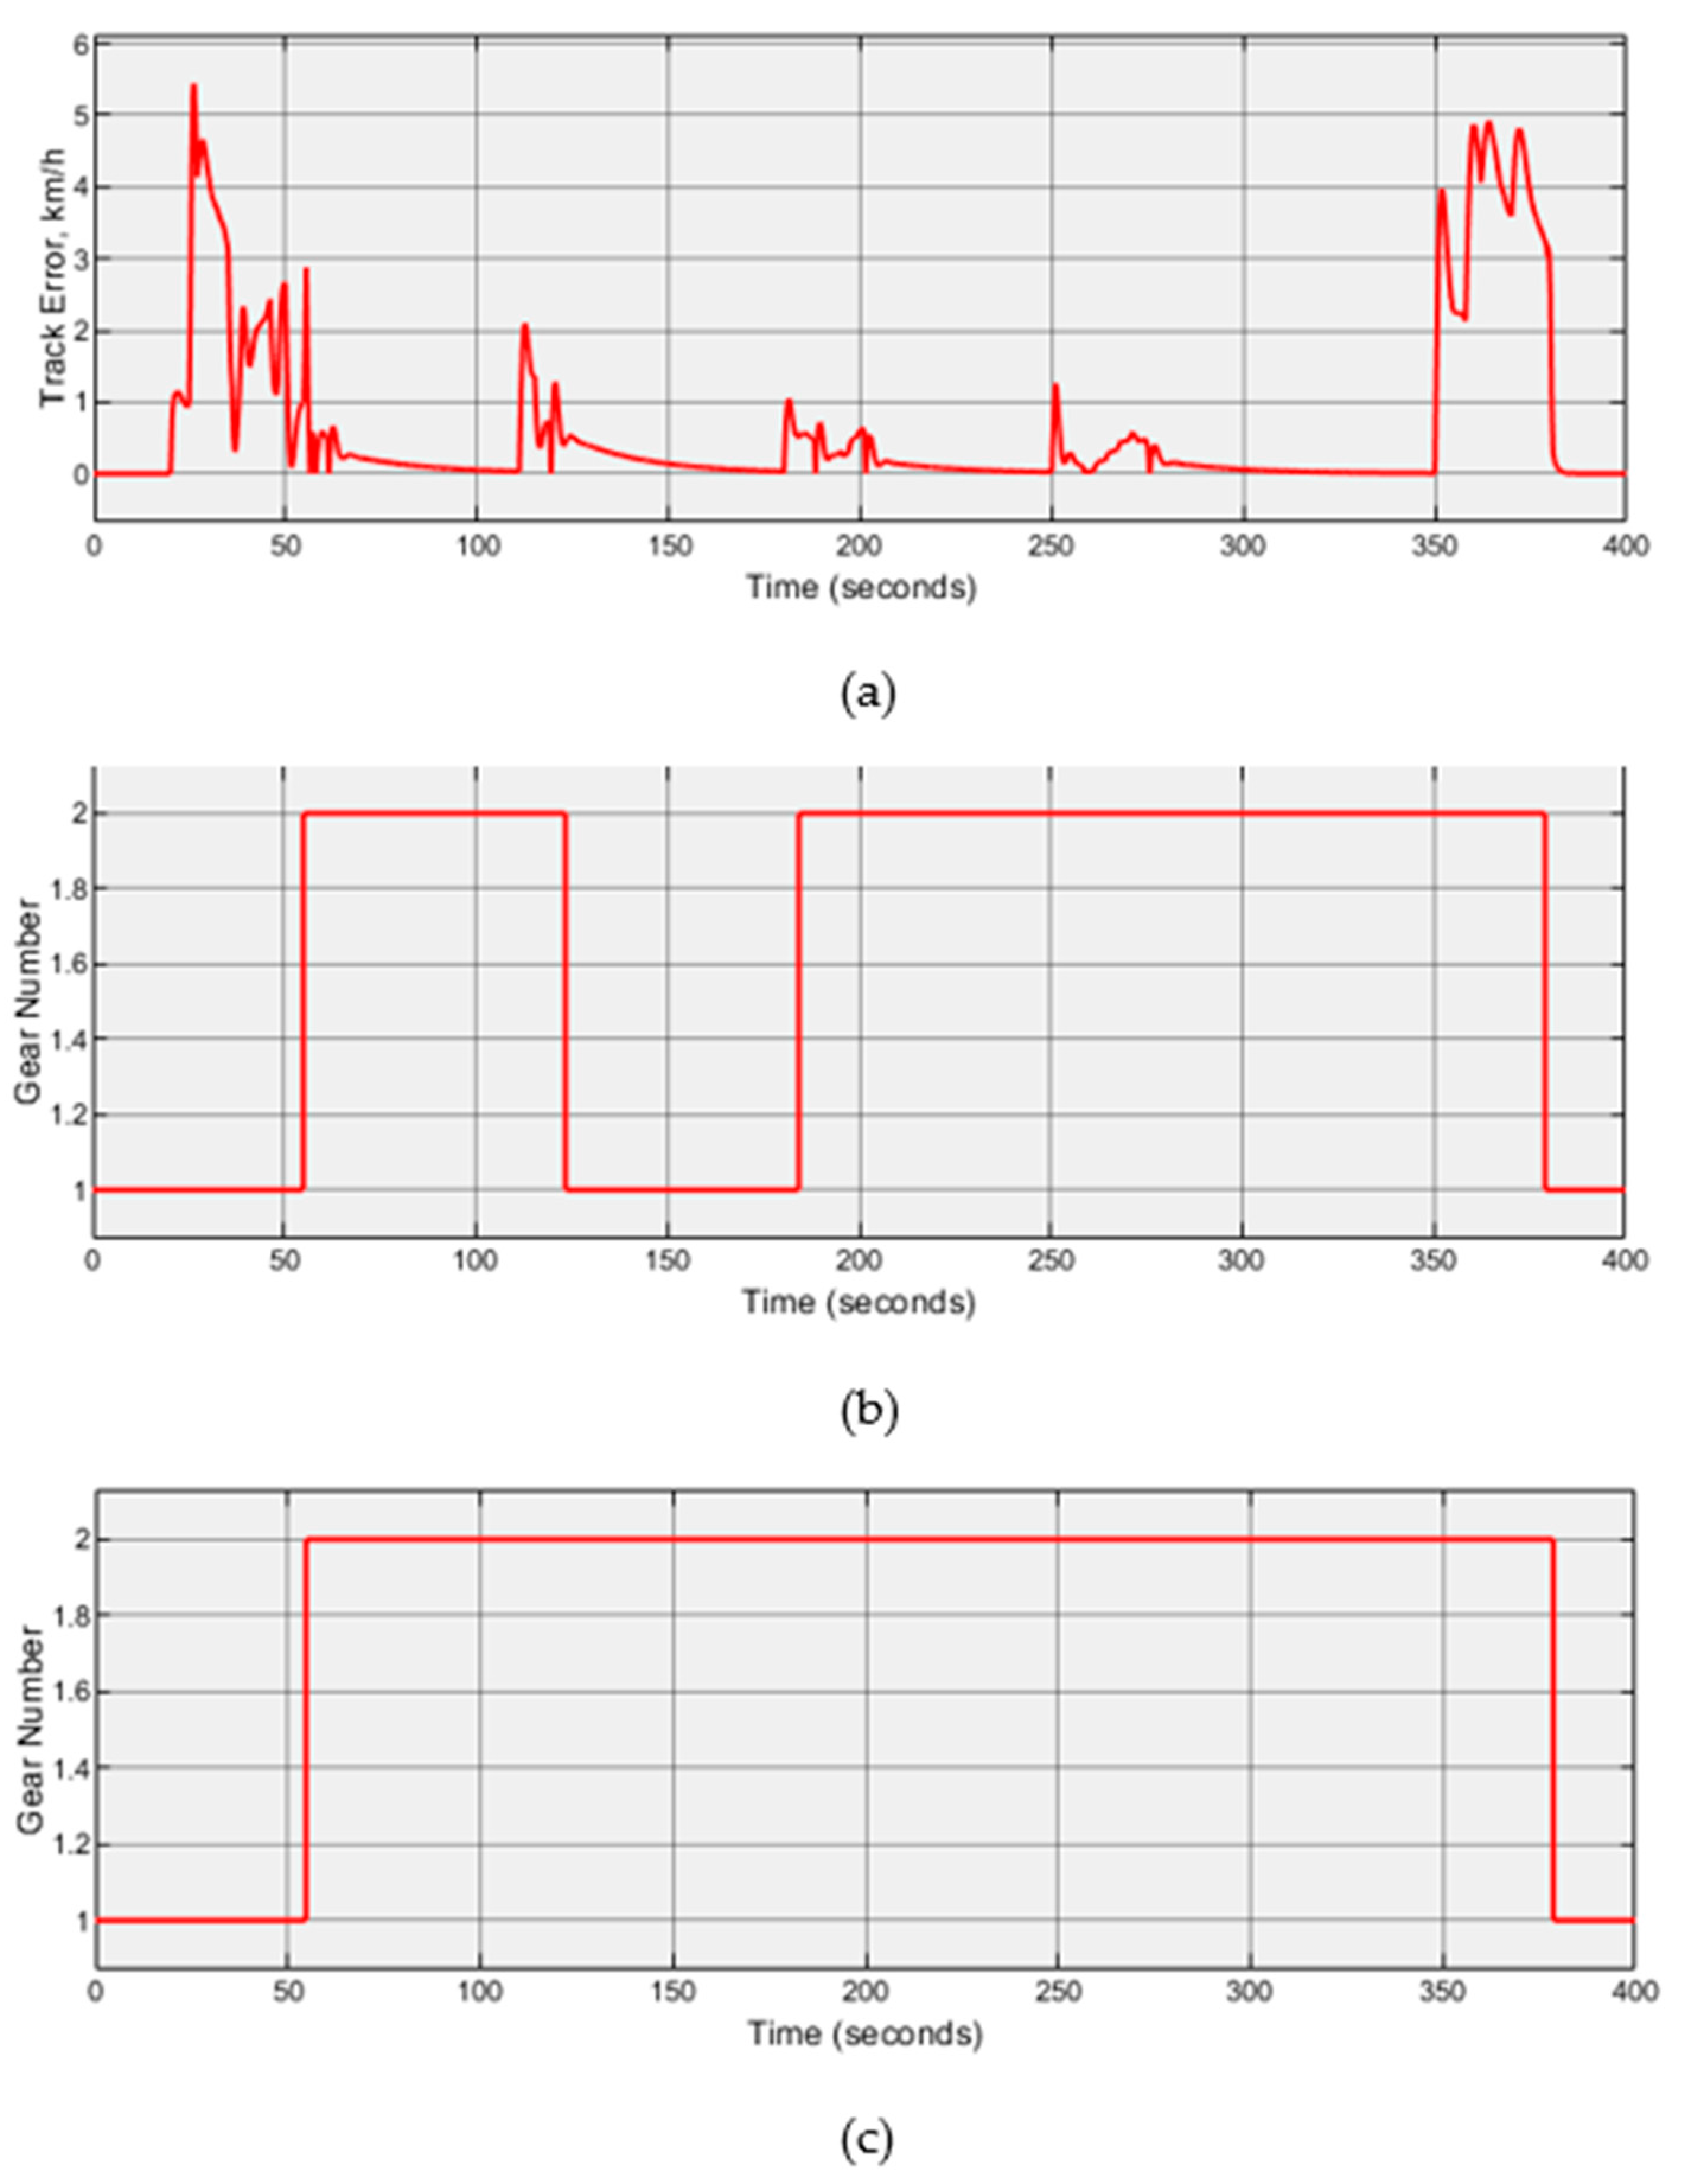
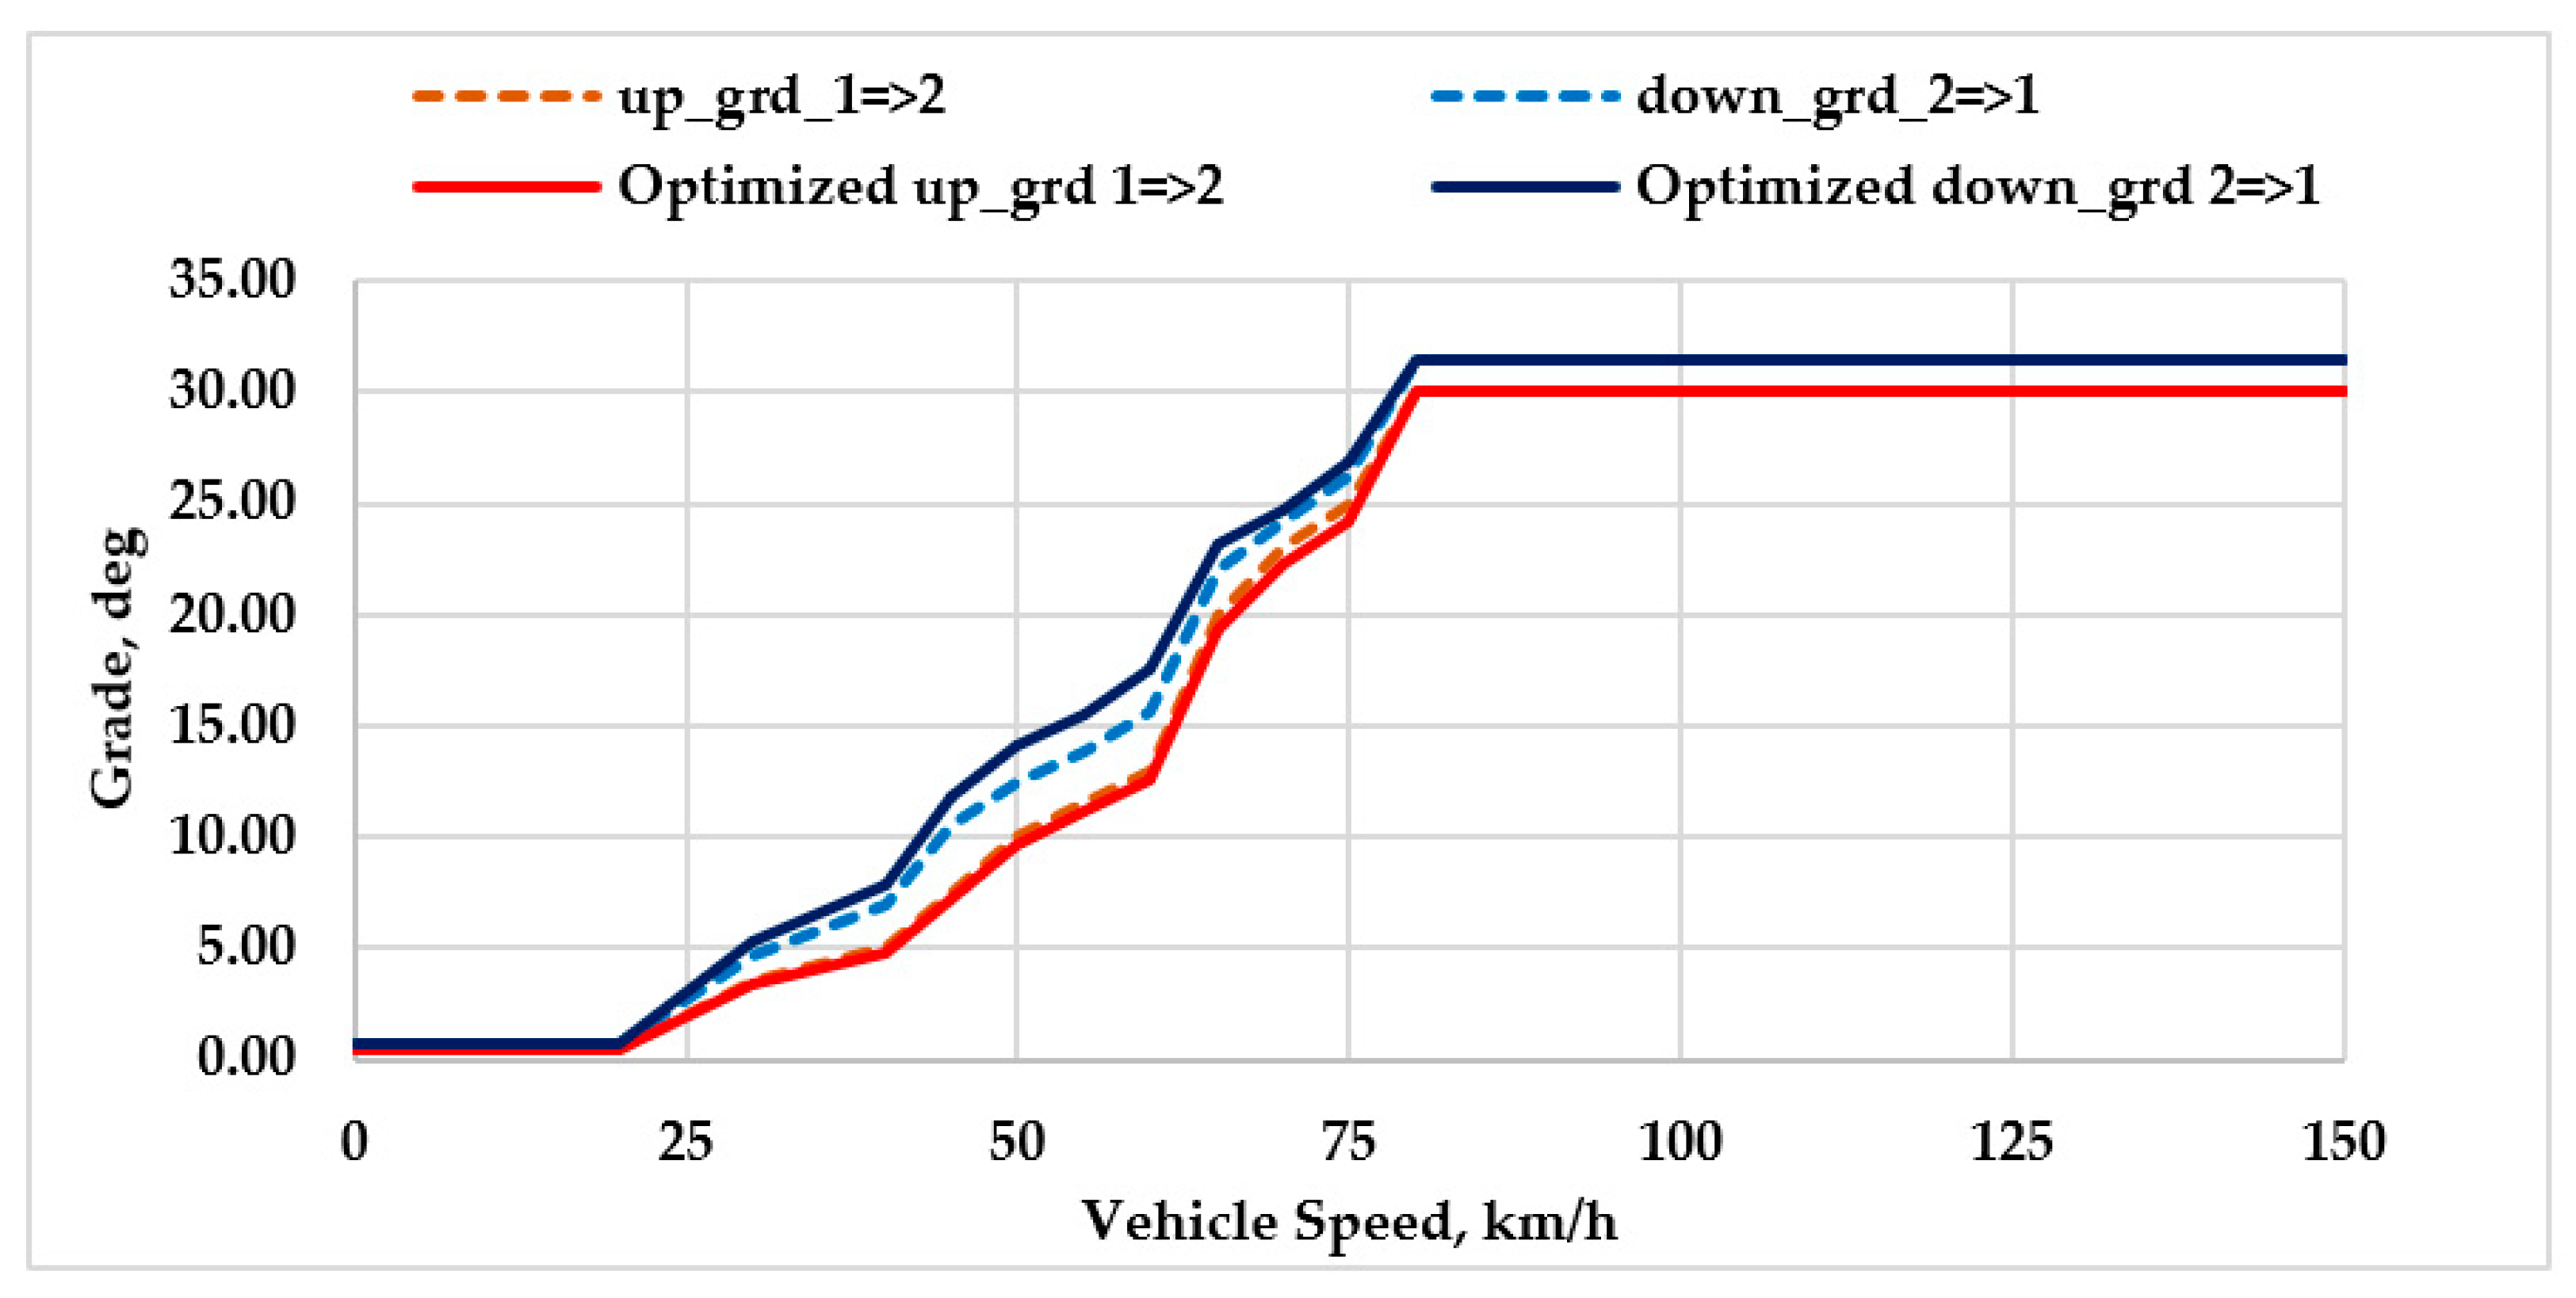
5.2. Optimization of Gearshift Schedule for Road Grade
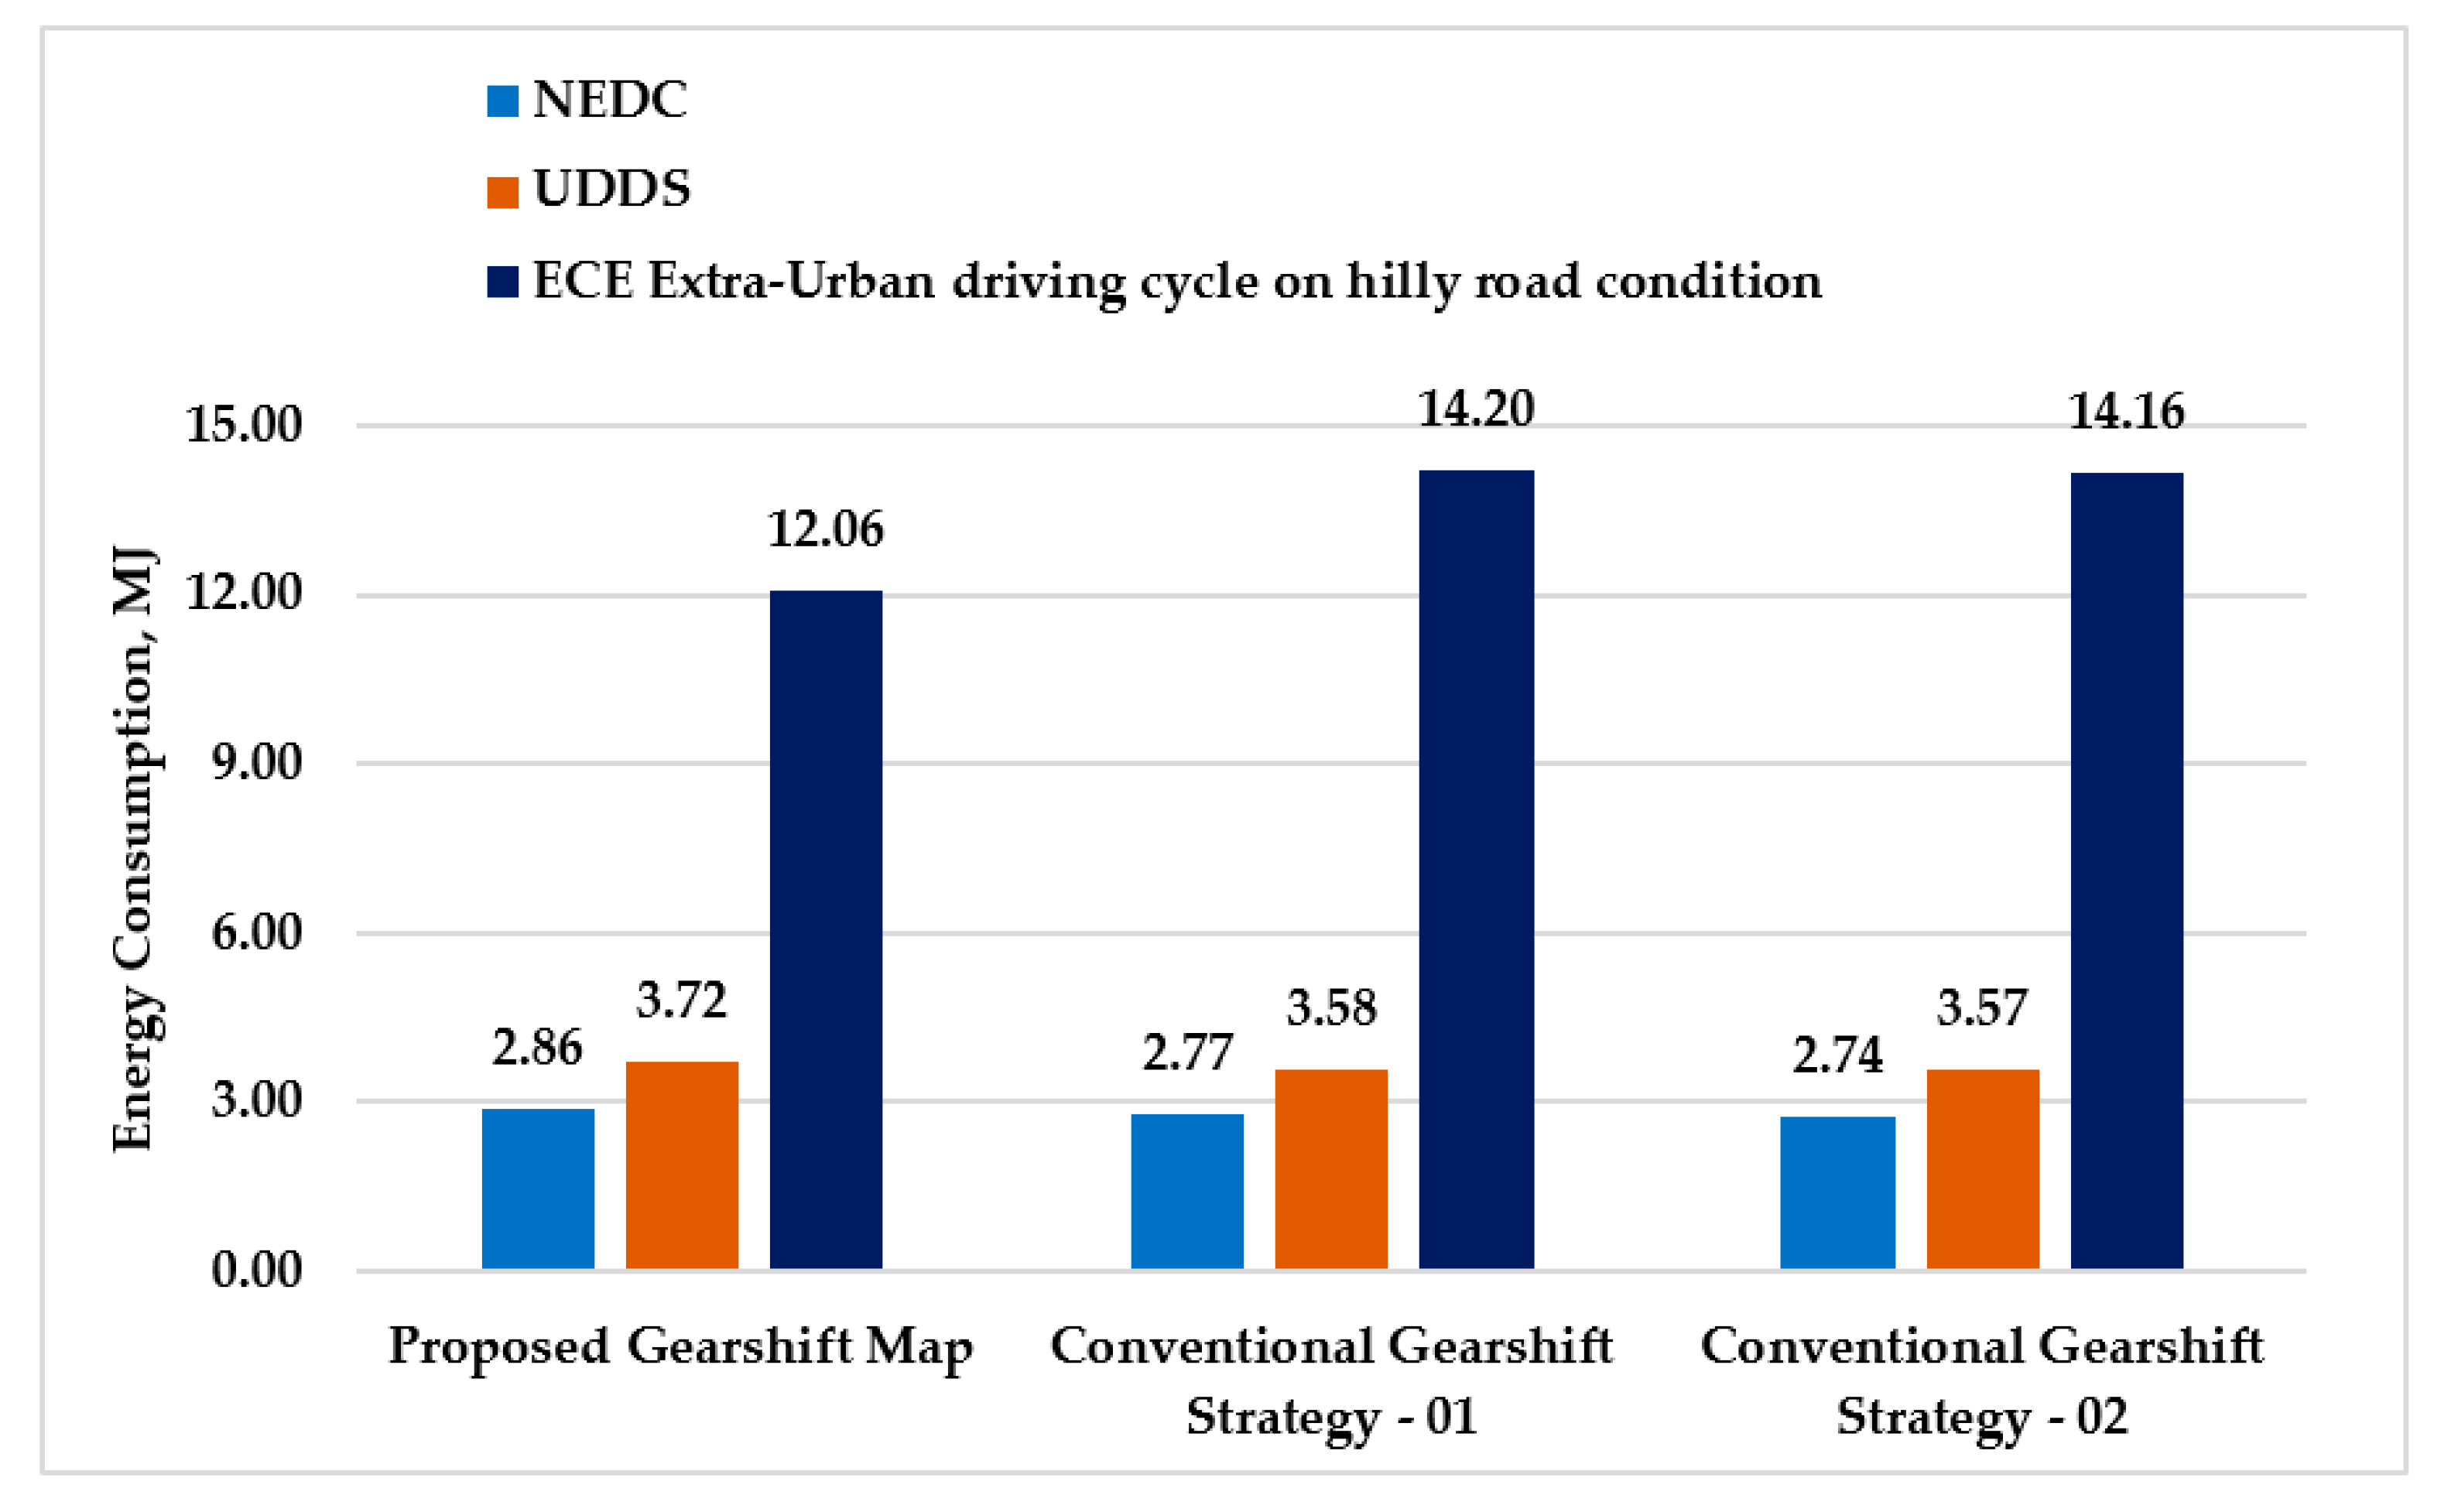
5.3. Comparison of Results with Conventional Approach
6. Conclusions
Author Contributions
Funding
Conflicts of Interest
Abbreviations
| AMT | Automatic Mechanical/Manual Transmission |
| GD | Gradient Descent |
| GR | Gear Ratio |
| ECE | Economic Commission for Europe |
| EV | Electric Vehicle |
| MJ | Mega-Joule |
| NEDC | New European Driving Cycle |
| PS | Pattern Search |
| SOC | State-of-Charge |
| UDDS | Urban Dynamometer Driving Schedule |
References
- Ahssan, M.R.; Ektesabi, M.M.; Gorji, S.A. Electric Vehicle with Multi-Speed Transmission: A Review on Performances and Complexities. SAE Int. J. Altern. Powertrains 2018, 7, 169–181. [Google Scholar] [CrossRef]
- Sorniotti, A.; Boscolo, M.; Turner, A.; Cavallino, C. Optimization of a Multi-Speed Electric Axle as a Function of the Electric Motor Properties. In Proceedings of the 2010 IEEE Vehicle Power and Propulsion Conference, Lille, France, 1–3 September 2010; pp. 1–6. [Google Scholar] [CrossRef]
- Sorniotti, A.; Subramanyan, S.; Turner, A.; Cavallino, C.; Viotto, F.; Bertolotto, S. Selection of the Optimal Gearbox Layout for an Electric Vehicle. SAE Int. J. Engines 2011, 4, 1267–1280. [Google Scholar] [CrossRef]
- Gao, B.; Liang, Q.; Xiang, Y.; Guo, L.; Chen, H. Gear Ratio Optimization and Shift Control of 2-Speed I-AMT in Electric Vehicle. Mech. Syst. Signal. Process. 2014, 50–51, 615–631. [Google Scholar] [CrossRef]
- Tian, S.; Wang, Y.; Wu, L. Parameters Matching and Effects of Different Powertrain on Vehicle: Performance for Pure Electric City Bus. In Proceedings of the SAE 2015 Commercial Vehicle Engineering Congress, Rosemont, IL, USA, 6–8 October 2015. [Google Scholar] [CrossRef]
- Zhou, X.X.; Walker, P.D.; Zhang, N.; Zhu, B.; Ding, F. The influence of transmission ratios selection on electric vehicle motor performance. In Proceedings of the ASME 2012 International Mechanical Engineering Congress and Exposition, Houston, TX, USA, 9–15 November 2012; pp. 289–296. [Google Scholar] [CrossRef]
- Morozov, A.; Humphries, K.; Zou, T.; Martins, S.; Angeles, J. Design and Optimization of a Drivetrain with Two-Speed Transmission for Electric Delivery Step Van. In Proceedings of the 2014 IEEE International Electric Vehicle Conference, Florence, Italy, 17–19 December 2014; pp. 1–8. [Google Scholar] [CrossRef]
- Zhu, B.; Zhang, N.; Walker, P.; Zhou, X.; Zhan, W.; Wei, Y.; Ke, N. Gear Shift Schedule Design for Multi-Speed Pure Electric Vehicles. Proc. Inst. Mech. Eng. Part. D Int. J. Automot. Mech. Eng. 2015, 229, 70–82. [Google Scholar] [CrossRef]
- Zhou, X.; Walker, P.; Zhang, N.; Zhu, B. Performance Improvement of a Two Speed EV through Combined Gear Ratio and Shift Schedule Optimization. In Proceedings of the SAE 2013 World Congress & Exhibition, Detroit, MI, USA, 16–18 April 2013. [Google Scholar] [CrossRef]
- Ruan, J.G.; Walker, P.D.; Wu, J.L.; Zhang, N.; Zhang, B.J. Development of Continuously Variable Transmission and Multi-Speed Dual-Clutch Transmission for Pure Electric Vehicle. Adv. Mech. Eng. 2018, 10, 1687814018758223. [Google Scholar] [CrossRef]
- Ruan, J.; Walker, P.; Zhang, N. A Comparative Study Energy Consumption and Costs of Battery Electric Vehicle Transmissions. Appl. Energy 2016, 165, 119–134. [Google Scholar] [CrossRef]
- Saini, V.; Singh, S.; Shivaram, N.V.; Jain, H. Genetic Algorithm Based Gear Shift Optimization for Electric Vehicles. SAE Int. J. Altern. Powertrains 2016, 5, 348–356. [Google Scholar] [CrossRef]
- Walker, P.D.; Rahman, S.A.; Zhu, B.; Zhang, N. Modelling, Simulations, and Optimisation of Electric Vehicles for Analysis of Transmission Ratio Selection. Adv. Mech. Eng. 2013, 5, 340435. [Google Scholar] [CrossRef]
- Yin, Q.; Wu, Z.; Rui, X. Parameter Design and Optimization of Electric Vehicle. In Proceedings of the 2014 IEEE Conference and Expo Transportation Electrification Asia-Pacific, Beijing, China, 31 August–3 September 2014; pp. 1–7. [Google Scholar] [CrossRef]
- Di Nicola, F.; Sorniotti, A.; Holdstock, T.; Viotto, F.; Bertolotto, S. Optimization of a Multiple-Speed Transmission for Downsizing the Motor of a Fully Electric Vehicle. SAE Int. J. Altern. Powertrains 2012, 1, 134–143. [Google Scholar] [CrossRef]
- Tan, S.; Yang, J.; Zhao, X.; Hai, T.; Zhang, W. Gear ratio optimization of a multi-speed transmission for electric dump truck operating on the structure route. Energies 2018, 11, 1324. [Google Scholar] [CrossRef]
- Han, K.; Wang, Y.; Filev, D.; Dai, E.; Kolmanovsky, I.; Girard, A. Optimized design of multi-speed transmissions for battery electric vehicles. In Proceedings of the 2019 American Control Conference (ACC), Philadelphia, PA, USA, 10–12 July 2019; IEEE: Piscataway, NJ, USA, 2019; pp. 816–821. [Google Scholar] [CrossRef]
- Li, Y.; Zhu, B.; Zhang, N.; Peng, H.; Chen, Y. Parameters optimization of two-speed powertrain of electric vehicle based on genetic algorithm. Adv. Mech. Eng. 2020, 12, 1687814020901652. [Google Scholar] [CrossRef]
- Lucente, G.; Montanari, M.; Rossi, C. Modelling of an Automated Manual Transmission System. Mechatronics 2007, 17, 73–91. [Google Scholar] [CrossRef]
- Mahmoudi, A.; Soong, W.L.; Pellegrino, G.; Armando, E. Efficiency maps of electrical machines. In Proceedings of the 2015 IEEE Energy Conversion Congress and Exposition (ECCE), Montreal, QC, Canada, 20–24 September 2015; pp. 2791–2799. [Google Scholar] [CrossRef]
- Ehsani, M.; Gao, Y.; Gay, S. Characterization of electric motor drives for traction applications. In Proceedings of the 29th Annual Conference of the IEEE Industrial Electronics Society (IEEE Cat. No.03CH37468), Roanoke, NC, USA, 2–6 November 2003; pp. 891–896. [Google Scholar] [CrossRef]
- Rahman, Z.; Ehsani, M.; Butler, K. An Investigation of Electric Motor Drive Characteristics for EV and HEV Propulsion Systems. In Proceedings of the Future Transportation Technology Conference & Exposition, Costa Mesa, CA, USA, 21–23 August 2000. [Google Scholar] [CrossRef]
- Ehsani, M.; Rahman, K.M.; Toliyat, H.A. Propulsion system design of electric and hybrid vehicles. IEEE Trans. Ind. Electron. 1997, 44, 19–27. [Google Scholar] [CrossRef]
- Raga, C.; Lázaro, A.; Barrado, A.; Martín-Lozano, A.; Quesada, I. Step-by-Step Small-Signal Modeling and Control of a Light Hybrid Electric Vehicle Propulsion System. Energies 2019, 12, 4082. [Google Scholar] [CrossRef]
- Makrygiorgou, J.J.; Alexandridis, A.T. Power electronic control design for stable EV motor and battery operation during a route. Energies 2019, 12, 1990. [Google Scholar] [CrossRef]
- Loncarski, J.; Leijon, M.; Srndovic, M.; Rossi, C.; Grandi, G. Comparison of output current ripple in single and dual three-phase inverters for electric vehicle motor drives. Energies 2015, 8, 3832–3848. [Google Scholar] [CrossRef]
- Shi, Y.; Wei, J.; Deng, Z.; Jian, L. A Novel Electric Vehicle Powertrain System Supporting Multi-Path Power Flows: Its Architecture, Parameter Determination and System Simulation. Energies 2017, 10, 216. [Google Scholar] [CrossRef]
- Zhu, B.; Zhang, N.; Walker, P.; Zhan, W.; Yueyuan, W.; Ke, N.; Zhou, X. Two motor two speed power-train system research of pure electric vehicle. In Proceedings of the SAE 2013 World Congress & Exhibition, Detroit, MI, USA, 16–18 April 2013. [Google Scholar] [CrossRef]
- Kim, H.; Wi, J.; Yoo, J.; Son, H.; Park, C.; Kim, H. A study on the fuel economy potential of parallel and power split type hybrid electric vehicles. Energies 2018, 11, 2103. [Google Scholar] [CrossRef]
- Roozegar, M.; Setiawan, Y.; Angeles, J. Design, modelling and estimation of a novel modular multi-speed transmission system for electric vehicles. Mechatronics 2017, 45, 119–129. [Google Scholar] [CrossRef]
- Roozegar, M.; Angeles, J. The optimal gear-shifting for a multi-speed transmission system for electric vehicles. Mech. Mach. Theory 2017, 116, 1–13. [Google Scholar] [CrossRef]
- Han, P.; Cheng, X.S.; Huang, Y.; Gu, Q.; Hu, H.B. Research on the shift schedule of dual clutch transmission for pure electric vehicle. Appl. Mech. Mater. 2014, 496–500, 1318–1321. [Google Scholar] [CrossRef]
- Zhu, B.; Zhang, N.; Walker, P.; Zhan, W.Z.; Zhou, X.X.; Ruan, J.G. Two-Speed DCT Electric Powertrain Shifting Control and Rig Testing. Adv. Mech. Eng. 2013, 5, 323917. [Google Scholar] [CrossRef]
- Liang, Q.; Tang, N.; Gao, B.; Chen, H. The seamless gear shifting control for pure electric vehicle with 2-speed inverse-AMT. IFAC Proc. Vol. 2013, 46, 507–511. [Google Scholar] [CrossRef]
- Fang, S.N.; Song, J.; Song, H.J.; Tai, Y.Z.; Li, F.; Nguyen, T.S. Design and control of a novel two-speed Uninterrupted Mechanical Transmission for electric vehicles. Mech. Syst. Signal. Process. 2016, 75, 473–493. [Google Scholar] [CrossRef]
- Chai, B.; Zhang, J.; Wu, S. Compound optimal control for shift processes of a two-speed automatic mechanical transmission in electric vehicles. Proc. Inst. Mech. Eng. Part. D Int. J. Automot. Mech. Eng. 2019, 233, 2213–2231. [Google Scholar] [CrossRef]
- Kim, Y.-K.; Kim, H.-W.; Lee, I.-S.; Park, S.-M.; Mok, H.-S. A speed control for the reduction of the shift shocks in electric vehicles with a two-speed AMT. J. Power Electron. 2016, 16, 1355–1366. [Google Scholar] [CrossRef]
- Zhou, X.; Walker, P.; Zhang, N.; Zhu, B.; Ruan, J. Numerical and experimental investigation of drag torque in a two-speed dual clutch transmission. Mech. Mach. Theory 2014, 79, 46–63. [Google Scholar] [CrossRef]
- Kidambi, N.; Harne, R.; Fujii, Y.; Pietron, G.M.; Wang, K. Methods in vehicle mass and road grade estimation. SAE Int. J. Passeng. Cars Mech. Syst. 2014, 7, 981–991. [Google Scholar] [CrossRef]
- Jauch, J.; Masino, J.; Staiger, T.; Gauterin, F. Road grade estimation with vehicle-based inertial measurement unit and orientation filter. IEEE Sens. J. 2018, 18, 781–789. [Google Scholar] [CrossRef]
- Jo, K.; Lee, M.; Sunwoo, M. Road slope aided vehicle position estimation system based on sensor fusion of GPS and automotive onboard sensors. IEEE Trans. Intell. Transp. Syst. 2015, 17, 250–263. [Google Scholar] [CrossRef]
- Karoshi, P.; Ager, M.; Schabauer, M.; Lex, C. Robust and numerically efficient estimation of vehicle mass and road grade. In Advanced Microsystems for Automotive Applications 2017; Zachäus, C., Müller, B., Meyer, G., Eds.; Springer: Cham, Switzerland, 2018; pp. 87–100. [Google Scholar] [CrossRef]
- Kim, S.; Shin, K.; Yoo, C.; Huh, K. Development of algorithms for commercial vehicle mass and road grade estimation. Int. J. Automot. Technol. 2017, 18, 1077–1083. [Google Scholar] [CrossRef]
- Liao, X.; Huang, Q.; Sun, D.; Liu, W.; Han, W. Real-time road slope estimation based on adaptive extended Kalman filter algorithm with in-vehicle data. In Proceedings of the 2017 29th Chinese Control and Decision Conference (CCDC), Chongqing, China, 28–30 May 2017; pp. 6889–6894. [Google Scholar] [CrossRef]
- Kidambi, N.; Pietron, G.M.; Boesch, M.; Fujii, Y.; Wang, K.-W. Accuracy and robustness of parallel vehicle mass and road grade estimation. SAE Int. J. Veh. Dyn. Stab. NVH 2017, 1, 317–325. [Google Scholar] [CrossRef]
- Zhang, Z.; Zuo, C.; Hao, W.; Zuo, Y.; Zhao, X.; Zhang, M. Three-speed transmission system for purely electric vehicles. Int. J. Automot. Technol. 2013, 14, 773–778. [Google Scholar] [CrossRef]
- Shen, W.; Yu, H.; Hu, Y.; Xi, J. Optimization of shift schedule for hybrid electric vehicle with automated manual transmission. Energies 2016, 9, 220. [Google Scholar] [CrossRef]
- Xiang, Y.; Guo, L.; Gao, B.; Chen, H. A study on gear shifting schedule for 2-speed electric vehicle using dynamic programming. In Proceedings of the 2013 25th Chinese Control and Decision Conference (CCDC), Guiyang, China, 25–27 May 2013; pp. 3805–3809. [Google Scholar] [CrossRef]
- Lin, C.; Zhao, M.; Pan, H.; Yi, J. Blending gear shift strategy design and comparison study for a battery electric city bus with AMT. Energy 2019, 185, 1–14. [Google Scholar] [CrossRef]
- Amari, S.I. Backpropagation and stochastic gradient descent method. Neurocomputing 1993, 5, 185–196. [Google Scholar] [CrossRef]
- Momma, M.; Bennett, K.P. A pattern search method for model selection of support vector regression. In Proceedings of the 2002 SIAM International Conference on Data Mining, Arlington, VA, USA, 11–13 April 2002; pp. 261–274. [Google Scholar] [CrossRef]


| EV Transmission Model | Gear Ratios | Shift Scheduling Parameters | Limitations of Shift Scheduling Strategy |
|---|---|---|---|
| 4-Speed [10] | 14.4/10.4/7.2/5.2 | Throttle Position Vehicle speed | Suitable for flat road and may not be suitable for all driving cycles simultaneously. It is ensured that a certain velocity will be achieved at maximum road gradient. However, appropriate gear selection during changing road gradient cannot be addressed. |
| 4-Speed [12] | 27.72/14.92/9.7/4.74 | Throttle Position Motor speed | |
| 2-Speed [7] | 5.9/3.11 | Throttle Position Motor speed | |
| 2-Speed [4] | 10.63/5.12 | Throttle opening Vehicle speed | |
| 2-Speed [9] | 9.39/4.83 | Throttle angle Vehicle speed | |
| 2-Speed [13] | 11.47/4.64 | Throttle angle Vehicle speed | |
| 2-Speed [14] | 9.8/3.56 | Accelerator opening Vehicle speed | |
| 2-Speed [2] | - | Driver demand Vehicle speed | |
| 2-Speed [15] | - | Driver demand Vehicle speed |
| Vehicle Parameter | Symbol | Value | Unit |
|---|---|---|---|
| Vehicle Mass | 1780 | kg | |
| Frontal Area | 2.2 | m2 | |
| Wheel Radius | 0.267 | m | |
| Final Drive Ratio | 4.0 | - | |
| Wind Velocity | 0 | Km/h | |
| Drag Coefficient | 0.28 | - | |
| Air Density | 1.27 | kg/m3 | |
| Rolling Coefficient | 0.016 | - | |
| Gravity | 9.81 | m/s2 | |
| Pi | 3.14159 | - | |
| Road Incline | θ | 0 | deg |
| 0 | rad |
| Battery Parameter | Symbol | Value | Unit |
|---|---|---|---|
| Voltage | 372 | Volt | |
| Capacity | 66 | Ah | |
| Energy | 24.55 | kWh |
| Traction Motor Parameter | Symbol | Value | Unit |
|---|---|---|---|
| Rated Power | 40 | kW | |
| Rated Torque | 127 | Nm | |
| Base Speed | 3000 | rpm | |
| Maximum Power | 80 | kW | |
| Maximum Torque | 255 | Nm | |
| Maximum Speed | 9000 | rpm |
| Vehicle Performances | Symbol | Target | Unit | |
|---|---|---|---|---|
| Maximum Gradeability | 23 | deg | ||
| 0.401587302 | rad | |||
| Velocity at Maximum Grade | 15 | km/h | ||
| Maximum Vehicle Velocity | 150 | km/h | ||
| Acceleration Time | 0–60 km/h | t0–60 | 5.5 | Sec |
| 60–80 km/h | t60–80 | 3.5 | ||
| 0–100 km/h | t0–100 | 13 | ||
| Optimization Method | Cost Function | Decision Variables | Constraints |
|---|---|---|---|
| Multi-Objective Genetic Algorithm [7] | Overall energy consumption Acceleration time, t0–100 sec | Gear ratios | Step ratio: 1.9 |
| Dynamic Programming [4] | Energy consumption in terms of | Gear ratios | Max. speed, Grade ability, Step ratio: 1.7–1.8 |
| Auto Search Method [9] | Driving range | Gear ratios and shift schedule | Step ratio: 3.4 |
| Genetic Algorithm [13] | Mean motor efficiency Driving range | Gear ratios and shift schedule | Max. speed, Grade ability, Acceleration time |
| Genetic Algorithm [14] | Energy consumption in terms of driving range | Gear ratios | Max. speed, Grade ability, Acceleration time |
| Brute Force Iterative Algorithm [2] | Acceleration time, Grade ability, Top speed, Energy consumption | Gear ratios | Step ratio, Max. speed, Grade ability, Acceleration time |
| Brute Force Iterative Algorithm [15] | Acceleration time, Grade ability, Top speed, Energy consumption | Gear ratios | Step ratio, Max. speed, Grade ability, Acceleration time |
| Drive Cycle | Optimization Method | Control Variables and Objective Function before/after Optimization | ||||||
|---|---|---|---|---|---|---|---|---|
| Gear Ratios | Shift Factor for Acceleration (Down/Up) | Energy Consumption, MJ | ||||||
| Before | After | Before | After | Before | After | Improvement | ||
| NEDC | Pattern Search | 10.00/5.20 | 8.24/4.9364 | 1.0/1.0 | - | 2.9968 | 2.8763 | 4.0210% |
| Gradient Descent | 8.24/4.9352 | - | 2.8762 | 4.0243% | ||||
| Pattern Search | 8.24/4.9364 | - | 1.0/1.0 | 1.0107/0.9337 | 2.8763 | 2.8755 | 0.0278% | |
| Gradient Descent | 10.00/5.20 | 8.24/4.9352 | 1.2/1.2 | 2.9968 | 2.8586 | 4.6116% | ||
| UDDS | Pattern Search | 10.00/5.20 | 8.24/4.9364 | 1.0/1.0 | - | 3.9117 | 3.7224 | 4.8393% |
| Gradient Descent | 8.24/4.9352 | - | 3.7223 | 4.8419% | ||||
| Pattern Search | 8.24/4.9364 | - | 1.0/1.0 | 1.1494/1.1480 | 3.7224 | 3.7191 | 0.0887% | |
| Gradient Descent | 10.00/5.20 | 8.24/4.9352 | 1.2/1.2 | 3.9117 | 3.7178 | 4.9569% | ||
| Drive Cycle | Optimization Method | Control Variables and Objective Functions before/after Optimization | ||||||||
|---|---|---|---|---|---|---|---|---|---|---|
| Gear Ratios | Shift Factor for Acceleration (Down/Up) | Shift Factor for Grade (Down/Up) | Energy Consumption, MJ | |||||||
| Before | After | Before | After | Before | After | Before | After | Improvement | ||
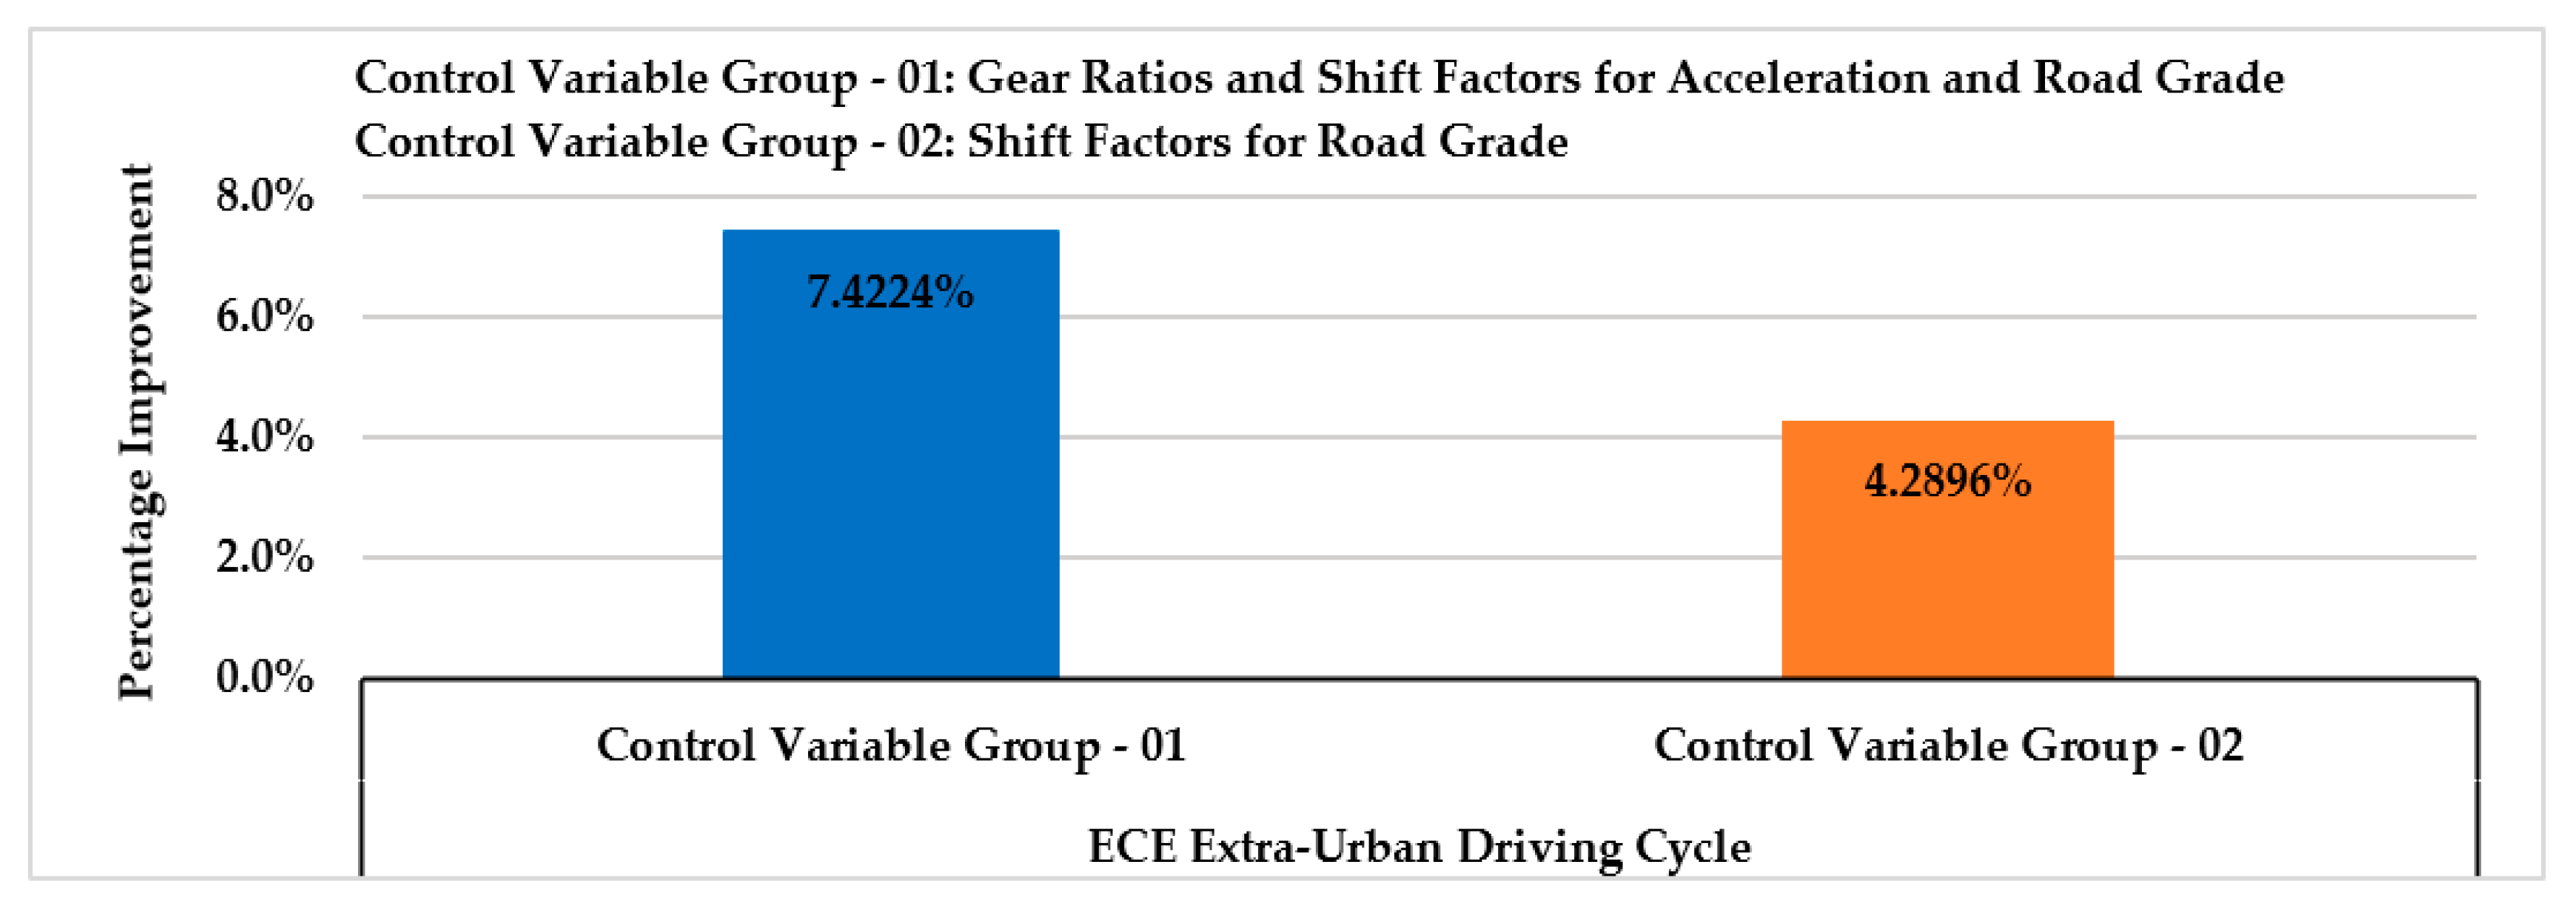
| ECE Extra-Urban Driving Cycle | Pattern Search | 10.00/5.20 | 9.887/6.04 | 1.0/1.0 | - | 1.0/1.0 | - | 13.024 | 13.115 | −0.700% |
| Gradient Descent | 8.24/4.935 | 1.2/1.2 | 1.195/1.195 | 12.057 | 7.422% | |||||
| Pattern Search | 8.24/4.935 | - | 1.0/1.0 | 1.127/1.113 | 1.0/1.0 | - | 12.601 | 12.601 | 0.00% | |
| Pattern Search | 8.24/4.935 | - | 1.2/1.2 | - | 1.0/1.0 | 1.127/0.966 | 12.598 | 12.057 | 4.290% | |
| Gradient Descent | - | - | 1.2/1.2 | 12.057 | 4.290% | |||||
© 2020 by the authors. Licensee MDPI, Basel, Switzerland. This article is an open access article distributed under the terms and conditions of the Creative Commons Attribution (CC BY) license (http://creativecommons.org/licenses/by/4.0/).
Share and Cite
Ahssan, M.R.; Ektesabi, M.; Gorji, S. Gear Ratio Optimization along with a Novel Gearshift Scheduling Strategy for a Two-Speed Transmission System in Electric Vehicle. Energies 2020, 13, 5073. https://doi.org/10.3390/en13195073
Ahssan MR, Ektesabi M, Gorji S. Gear Ratio Optimization along with a Novel Gearshift Scheduling Strategy for a Two-Speed Transmission System in Electric Vehicle. Energies. 2020; 13(19):5073. https://doi.org/10.3390/en13195073
Chicago/Turabian StyleAhssan, Md Ragib, Mehran Ektesabi, and Saman Gorji. 2020. "Gear Ratio Optimization along with a Novel Gearshift Scheduling Strategy for a Two-Speed Transmission System in Electric Vehicle" Energies 13, no. 19: 5073. https://doi.org/10.3390/en13195073
APA StyleAhssan, M. R., Ektesabi, M., & Gorji, S. (2020). Gear Ratio Optimization along with a Novel Gearshift Scheduling Strategy for a Two-Speed Transmission System in Electric Vehicle. Energies, 13(19), 5073. https://doi.org/10.3390/en13195073