Article

Plasma Assisted Combustion as a Cost-Effective Way for Balancing of Intermittent Sources: Techno-Economic Assessment for 200 MWel Power Unit

by
Tadeusz Mączka
1,
Halina Pawlak-Kruczek
2,*,
Lukasz Niedzwiecki
2,
Edward Ziaja
1 and
Artur Chorążyczewski
3
1
Institute of Power Systems Automation, ul. Wystawowa 1, 51-618 Wrocław, Poland
2
Department of Mechanics, Machines, Devices and Energy Processes, Faculty of Mechanical and Power Engineering, Wrocław University of Science and Technology, Wybrzeże Wyspiańskiego 27, 50-370 Wrocław, Poland
3
Department of Automatic Control, Faculty of Electronics, Mechatronics and Control Systems, Wrocław University of Science and Technology, Wybrzeże Wyspiańskiego 27, 50-370 Wrocław, Poland
*
Author to whom correspondence should be addressed.
Energies 2020, 13(19), 5056; https://doi.org/10.3390/en13195056
Submission received: 15 June 2020 / Revised: 24 August 2020 / Accepted: 19 September 2020 / Published: 25 September 2020

Abstract

:
Due to the increasing installed power of the intermittent renewable energy sources in the European Union, increasing the operation flexibility of the generating units in the system is necessary. This is particularly important for systems with relatively large installed power of wind and solar. Plasma technologies can be used for that purpose. Nonetheless, the wide implementation of such technology should be economically justified. This paper shows that the use of plasma systems for increasing the flexibility of power units can be economically feasible, based on the results of a net present value analysis. The cost of the installation itself had a marginal effect on the results of the net present value analysis. Based on the performed analysis, the ability to lower the technical minimum of the power unit and the relationship between such a technical minimum and the installed power of a plasma system can be considered decisive factors influencing the economics of the investment for such an installation. Further research on better means of prediction of the minimum attainable load, which would allow determining the influence of implementation of a plasma system, is recommended. This will be the decisive factor behind future decisions regarding investing in such systems.

1. Introduction

Due to the concerns regarding the impact of anthropogenic CO2 emissions on the climate, renewable energy sources are becoming increasing popular. Different types of renewable energy sources can be associated with different thermo-ecological costs [1,2,3] and varying influence on the energy supply systems [4,5,6,7,8,9]. Currently, because of the increasing installed capacity of the intermittent renewable energy sources (RES) connected to the electric power systems in European Union countries (including Poland), it seems necessary to increase the flexibility of operation of the generating units in the system and thereby minimize the necessity of their frequent shutdowns. This is particularly important when due to the inflow of large quantities of wind and solar energy, a power generation unit would have to operate below its technical minimum, creating serious electric energy supply reliability problems [10]. This is especially relevant as a large number of these units belong to the distributed generation (DG), and distribution systems were not originally designed to accommodate such amounts of DG units [11].
One can distinguish three principal types of energy sources:
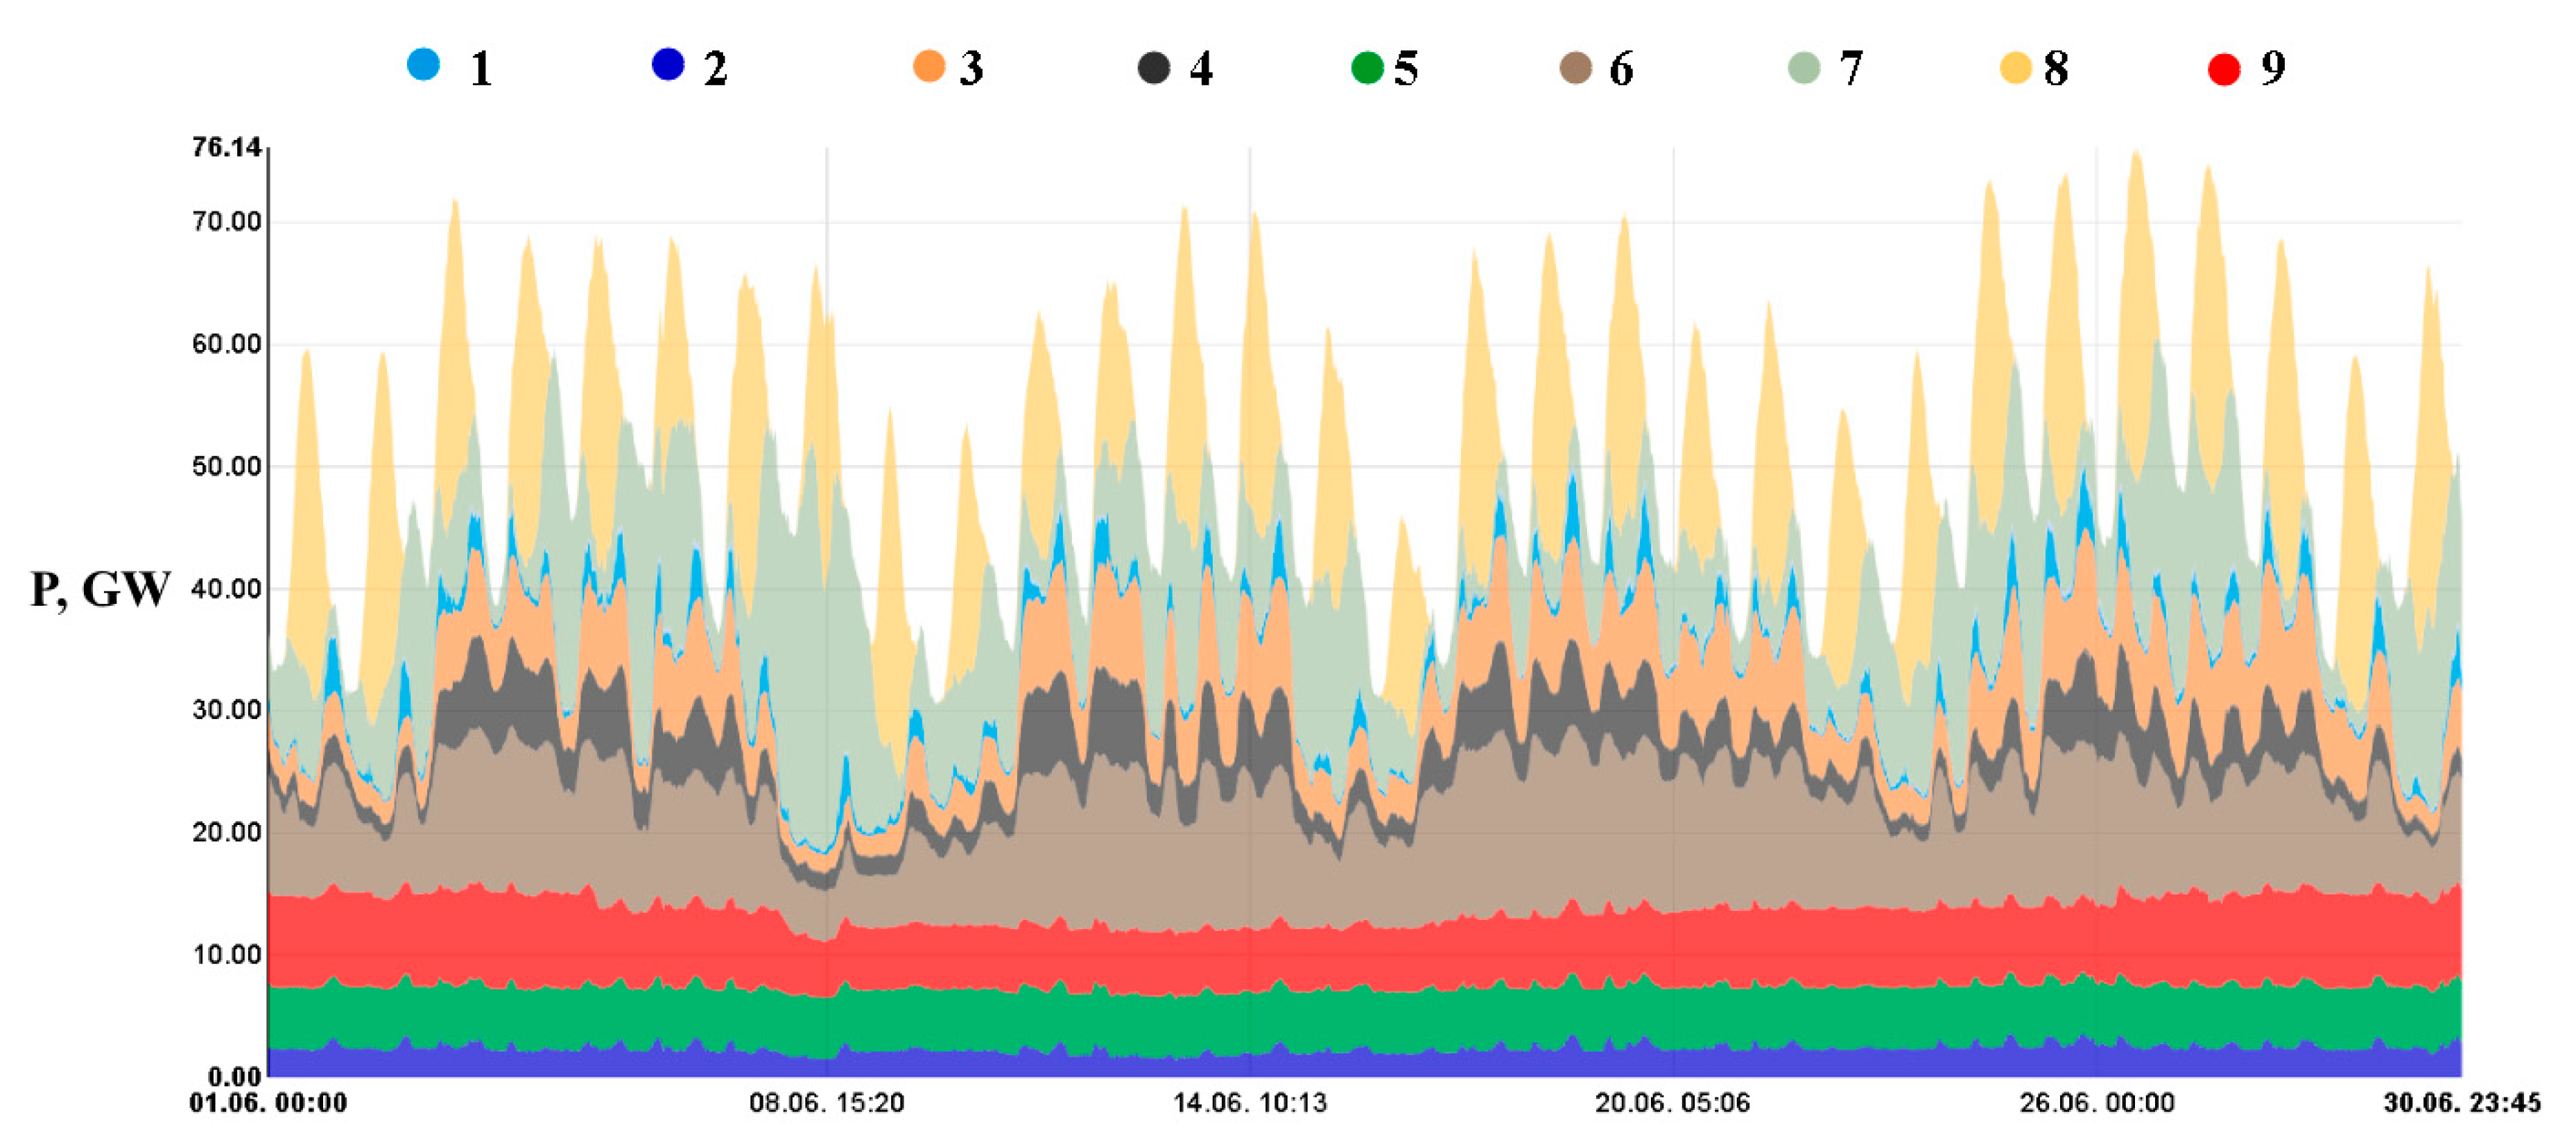
  • Intermittent—the energy supply is not controlled, or a such control is severely limited;
  • Controllable, inflexible—the energy supply can be controlled, but due to the low flexibility of the sources they cannot be used to balance variations in the energy supply from uncontrollable sources;
  • Controllable, flexible—it is possible to flexibly respond to changes in electricity demand and supply in the electric power system, thereby guaranteeing energy supply security.
The aim of this paper is to determine if the use of plasma systems for increasing the flexibility of power units can be economically feasible. This feasibility can be determined based on established methods, such as net present value (NPV) analysis.
The most common types of power plants (PPs) based on intermittent energy sources are wind and solar power plants. A good example of power plants using inflexible controllable energy sources are nuclear power plants, which are usually baseload PPs, i.e., their load can be changed only to a limited extent. In order to meet the peak load demand, they often need to operate in conjunction with flexible sources.
For example, in the French electric power system, most of the installed RES capacity comes from hydroelectric power plants, i.e., pumped-storage power PPs or weekly- and daily-regulation (pondage) water storage PPs [12]. An example of the growing share of installed RES capacity in the electric power system (and the resulting problems) is the German market, where currently this capacity is comparable with the installed capacity based on conventional sources [13].
The character of the operation of the sources varies greatly (Figure 1). Controllable energy sources (sources in which electricity production can be adjusted can be regarded as controllable [4]) differing in their flexibility predominate in conventional energy generation. In the case of intermittent energy sources, due to their character, production adjustment is very limited, since they are unable to meet the demand on their own and thus have to rely on flexible sources balancing the grid load (natural gas, hydroelectric, hard coal, and lignite, as shown in Figure 1) [14].
Nowadays, there seems to be no single best way to deal with the influence of intermittent RES, and intensive development is focused both on energy storage [7,15] and on new ways of increasing the flexibility of existing power units [16,17]. It seems absolutely vital to find a solution enabling the quick changing of loads of power boilers and reducing their technical minimum in order to minimize costly start-ups and shutdowns of power generation units.

2. Potential of Plasma Technologies for Increasing the Flexibility of Power Units

Plasma is a medium that consists of positively and negatively charged particles, which is produced when atoms in a gas become ionized [18,19]. Some call plasma the fourth state of matter [20]. Plasma techniques have a multitude of different applications in the field of energy and power engineering [21,22,23,24,25]. Plasma technologies seem to be promising in terms of their potential regarding increasing the flexibility of power units in energy systems with a relatively high installed power of intermittent RES. This claim is based on both technical potential and on the fact that in a system with a high share of intermittent RES, energy price is substantially low in the times of its greatest abundance. In some of the cases, it implies negative energy prices [26] during the times when the plasma system would consume it.
Plasma generated using air as a carrier gas can stabilize the flame and enhance the ignition [27,28], which can be attributed not only to the thermal effect but also to the production of O atoms [29,30], different radicals, and the effect of ionic wind [31]. The response of the flame for the introduction of non-thermal plasma can be achieved even for the equivalence ratio of 0.95 [32]. Moreover, it has been shown that the use of the nanosecond repetitively pulsed plasma discharges can accelerate a propagating turbulent flame [33]. The thermal effect is also important, as reported by Messerle et al. [34]. The use of plasma technologies can significantly reduce the technical minimum of solid fuel-fired power boilers [35,36,37,38,39]. Successful trials of plasma torches aiding the operation of power boilers (27 boilers in Russia, Kazakhstan, South Korea, the Ukraine, Mongolia, and China) were reported in the literature [40]. Successful trial start-ups (without the use of heavy fuel oil and air preheating) were performed on the BKZ-420 power boiler in the generating unit of the Almaty Power Plant in Kazakhstan [41]. The trials were carried out using Ekibastuz coal with a high ash content (40% when dry) and a low calorific value (16.6 MJ/kg) [41]. Industry journals give examples of hard coal-fired “oil-free” power generation units (2 × 600 MW) in Zetes (Turkey) [42]. The successful start-ups of the boilers were conducted for a total of 168 h [42]. According to Karpenko et al., it is possible to sustain and stabilize the combustion of pulverized coal with a relatively low volatile matter content at the power of plasma torches amounting to about 2.5% of the burner’s rated power [40]. Research on the application of the plasma technology in energy generation, including the direct starting of utility pulverized fuel boilers, was also conducted in Poland [35,36,43,44,45,46,47,48]. These laboratory and pilot studies were carried out on the pulverized coal boiler OP 130 in the Czechnica Combined Heat and Power Station [43,44,46,47]. The studies have shown the viability of thermal plasma application for the ignition and stabilization of the fuel-air mixture in pulverized-fired burners.

3. Capacity Market

It is hard to imagine that any technological solution can be practically implemented without proving its economic viability. The capacity market makes it possible to trade in the volume of generated electric energy, but the price on this market does not in any way reflect the costs involved in securing energy supplies. Furthermore, at periodically high energy production by renewable energy sources, the market price of the energy can fall sharply—there have been cases of a negative price of electric energy on the spot markets (corresponding to the day-ahead market at the Polish power exchange) in Western European countries due to the oversupply of energy from wind farms and photovoltaic installations [26,38]. As a result, controllable and flexible conventional energy sources are squeezed out of the market. For example, in the years 2012–2013, the income of the gas–steam power stations in Germany and France was close to, and sometimes lower than, the costs of maintaining the facilities in operation [49].
The way in which electric power sectors in the world are organized varies greatly, but in each case, the aim is to assure the continuity of energy supplies and reduce the risk of blackout. Such an assurance requires strategic reserves, e.g., in the form of a hot reserve [49]. An increasingly number of countries have introduced a capacity market, where instead of energy, “readiness to satisfy the demand” is sold. The capacity market exists in such countries as Great Britain and the USA [50]. In Great Britain, the capacity market is based on a system of auctions, where entities offer their readiness to assure the satisfaction of the needs arising from the grid load [51,52]. In practice, this can be done through generating unit operation under less than a full load within the so-called hot reserve. This entails certain costs, and the idea behind capacity markets is to optimize the costs. For example, in Great Britain, auctions for over 50.5 GW in the years 2016–2017 resulted in the price of 8.40 GBP for assuring 1 kW/year [53].
In Germany, in July 2016 the parliament passed a capacity market law and two other Acts concerning the creation of a strategic reserve to be used only in cases when the power bought on the capacity market is insufficient to balance the system [54]. The strategic reserve (German Kapazitätsreserve) is to amount to 4.4 GW, and according to forecasts, is to entail costs ranging from 130 and 260 million euro per annum [54]. In addition, there is to be a reserve of 2.7 GW from older lignite-fired generating units that are to be operated in this way until their complete shutdown in 2020 [54]. In return for this, the owners (power plants) will receive compensation for the potentially lost revenues, in an amount estimated at 230 million euros [54]. Intensive work on the creation of a capacity market, with a special focus on the demand side response, is underway in the Scandinavian countries [55,56]. In the future, the activity of both small consumers [57,58] and prosumers [58,59] can acquire significance, but in the nearest future, it clearly seems that older units, with full amortisation of the investments, will perform best on the capacity market.
In Poland, the capacity market has been introduced only recently on the basis of the Capacity Market Act of 8 December 2017 and the Market Rules [60]. The market has already been approved by the European Commission [60]. The model of the capacity market in Poland is similar to the British one and is based on auctions [52]. Auction parameters, such as capacity volume for a given period, are specified through an Energy Minister order [60]. The auction conducted for 2021 resulted in the sale of capacity obligations amounting to nearly 22.5 GW at the closing price of 240.32 PLN for the assurance of 1 kW/year [60]. The planned power demand for 2022 is to amount to about 10.5 GW at the starting price of 366.00 PLN/kW/year. For the year 2023, an auction for about 10.8 GW is planned [60].
In general, intensive work is being performed to build a common European market, allowing the exchange of balancing resources and the activation of a replacement reserve with a new centralized platform called LIBRA [61].

4. Method of the Analysis
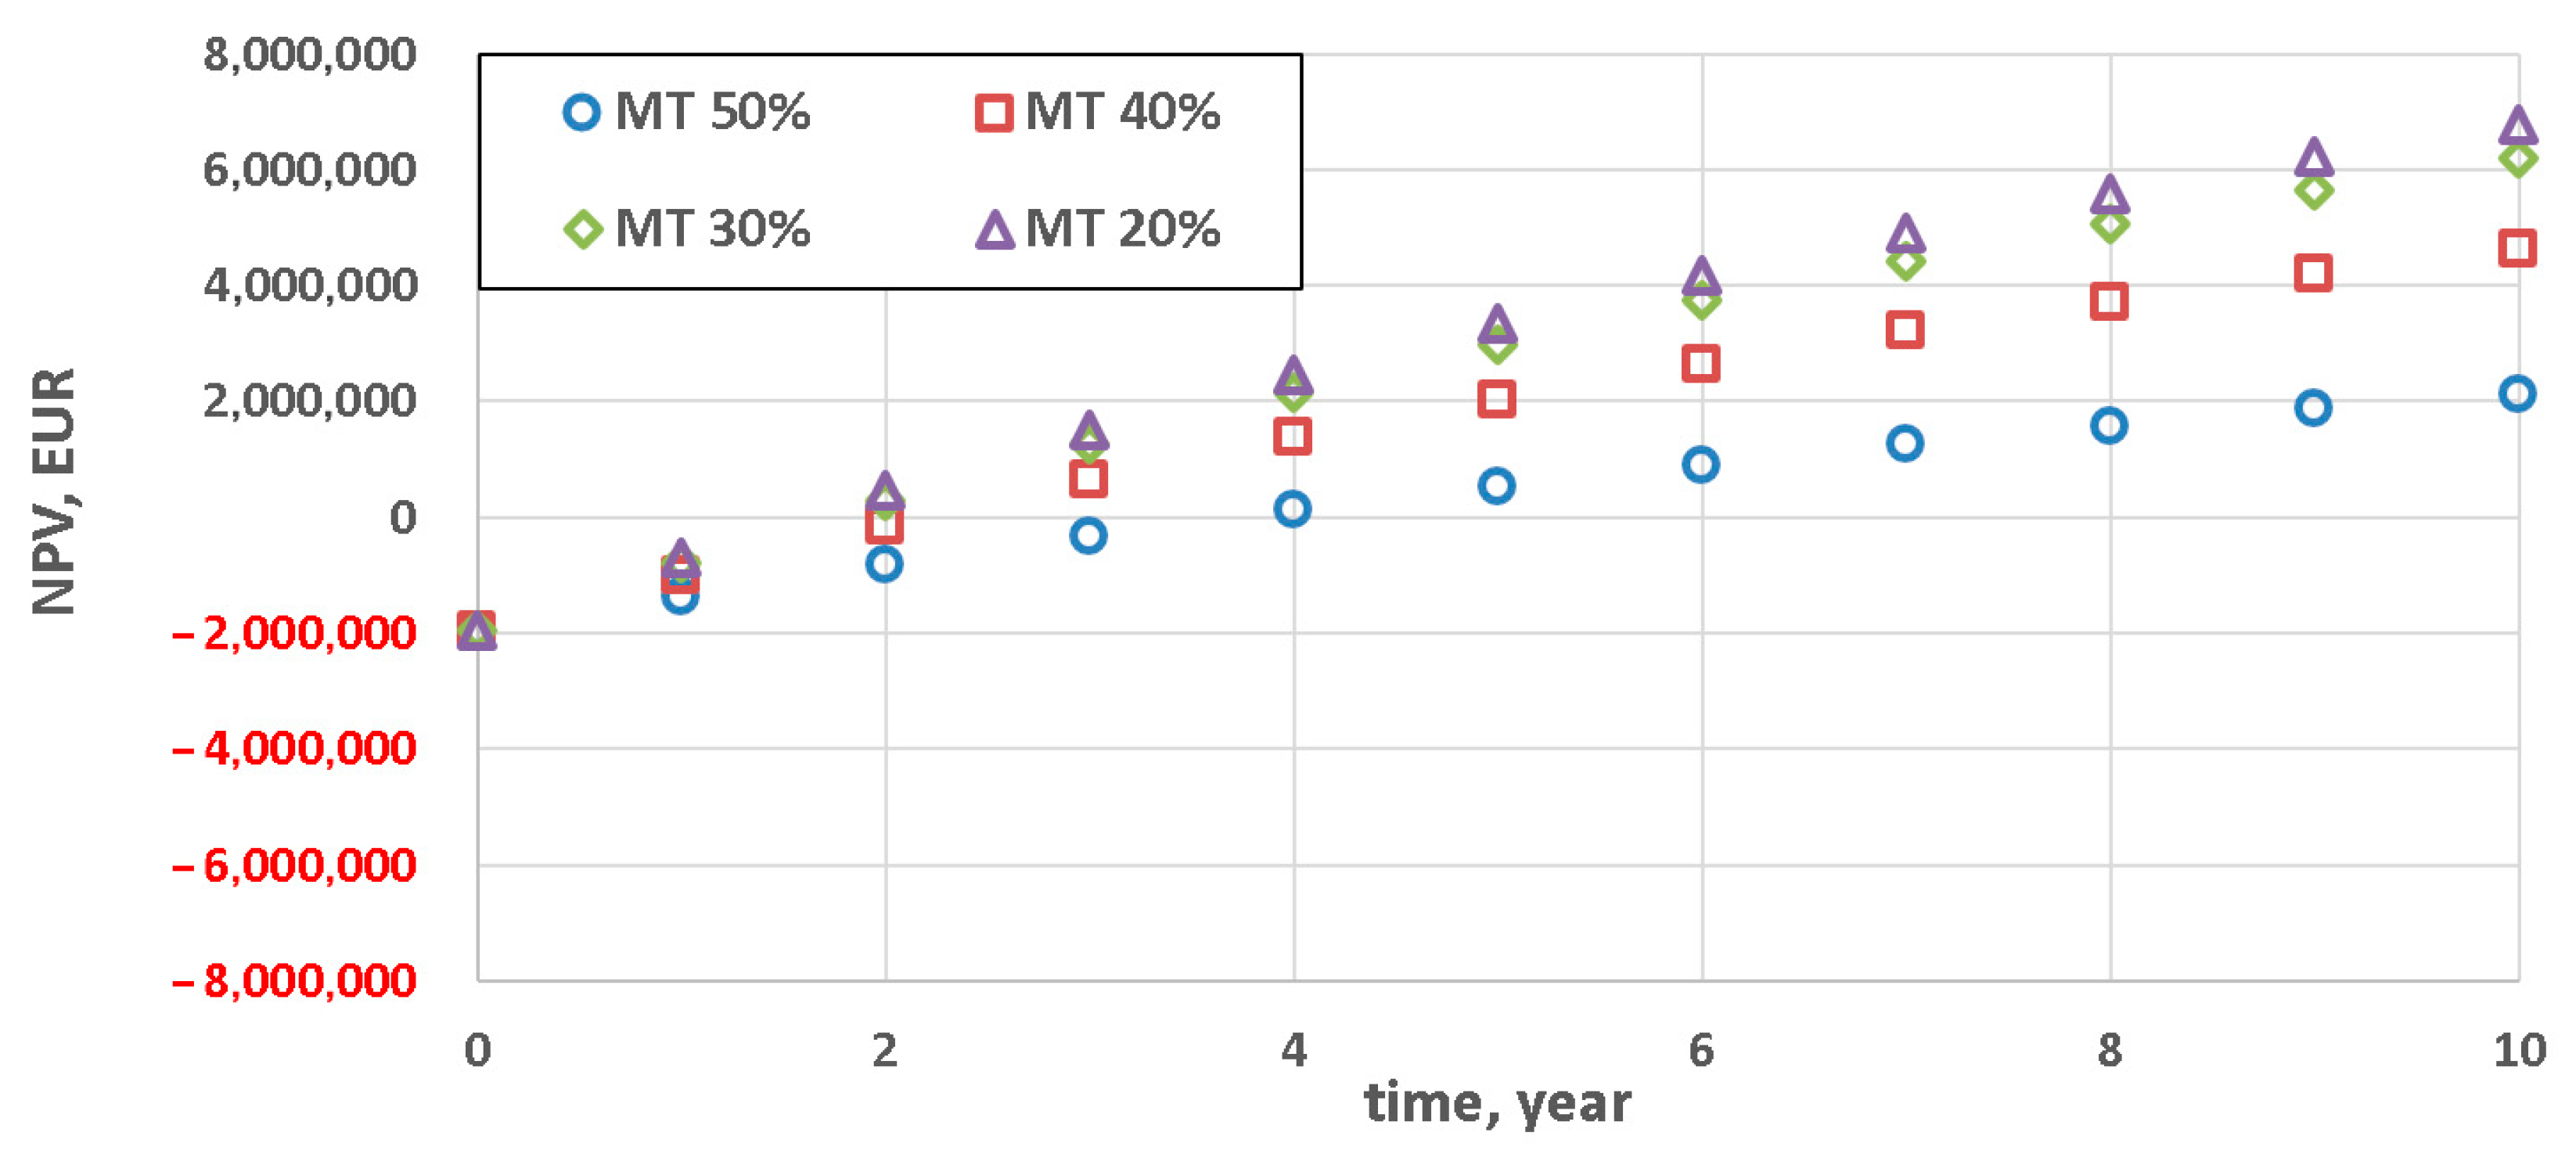
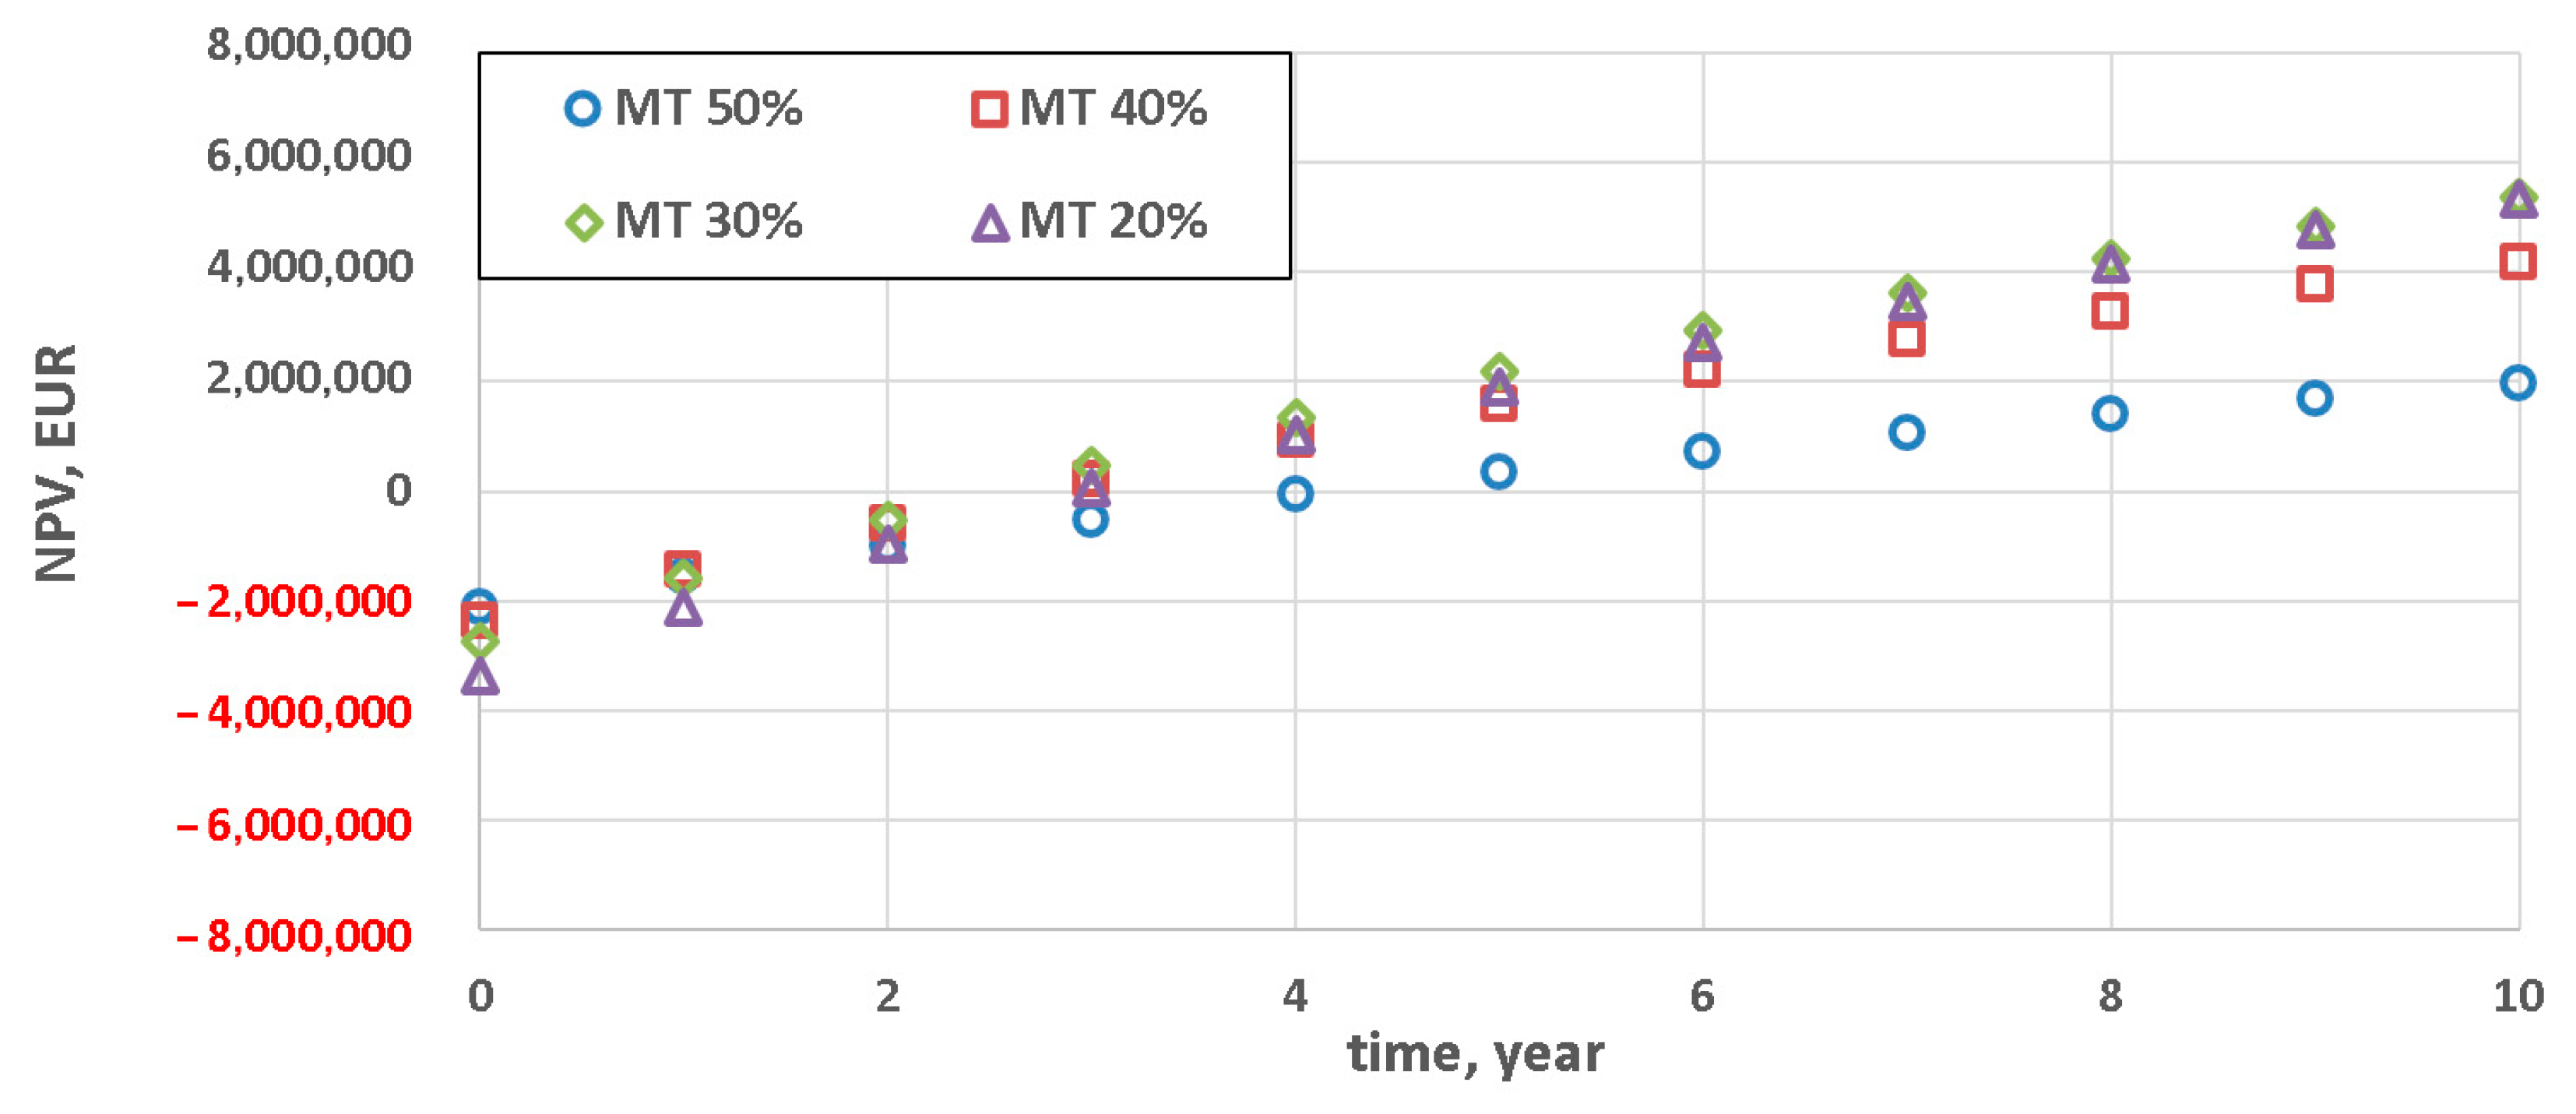
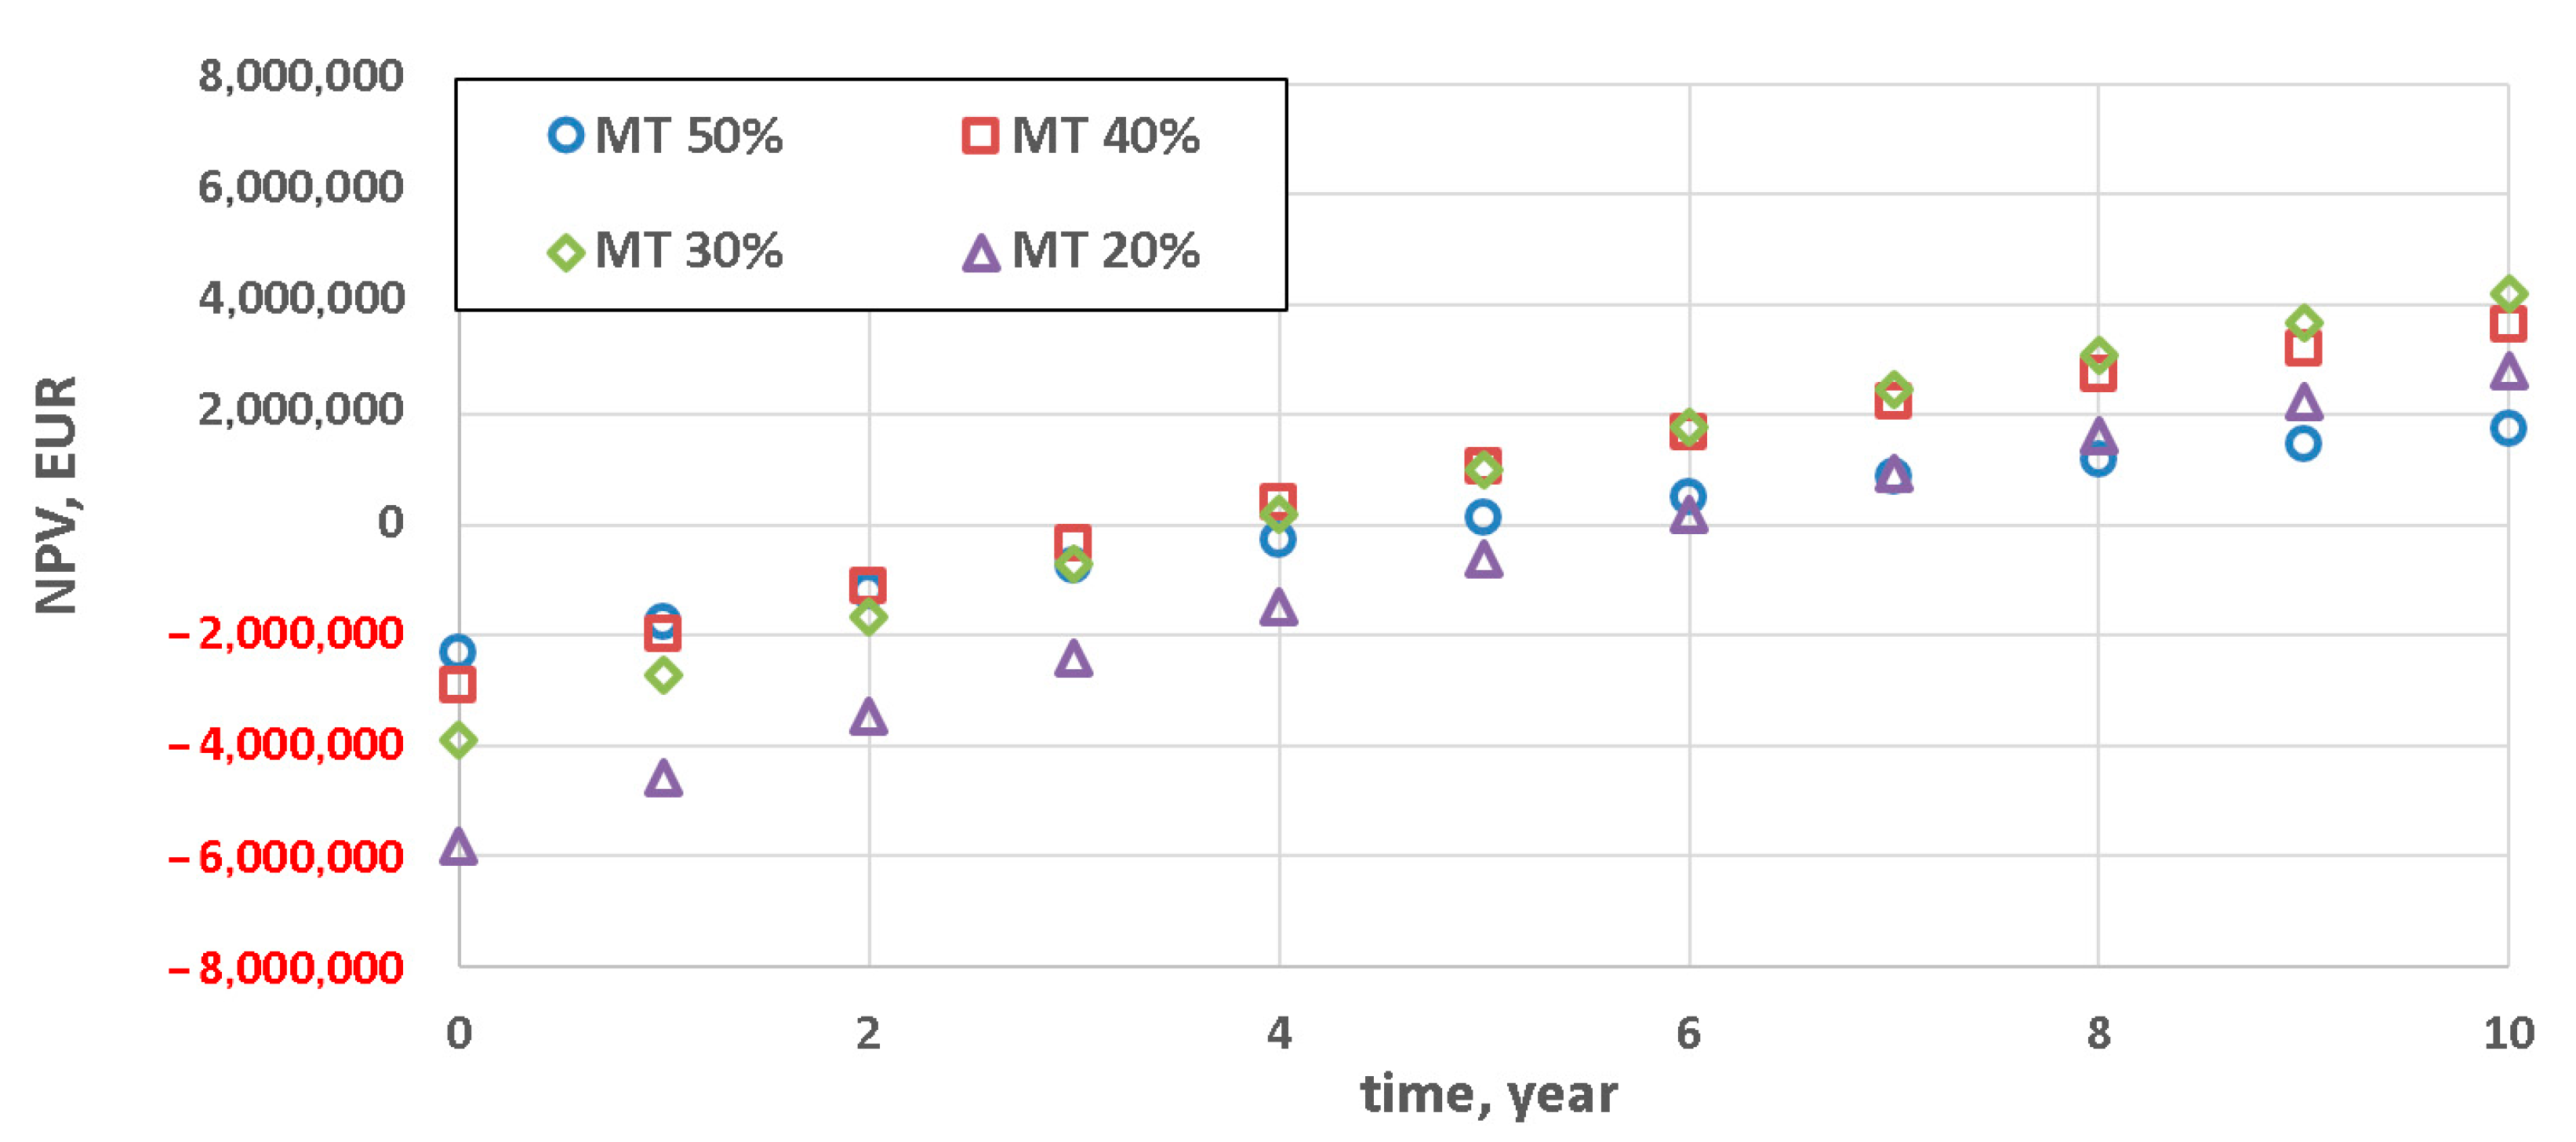
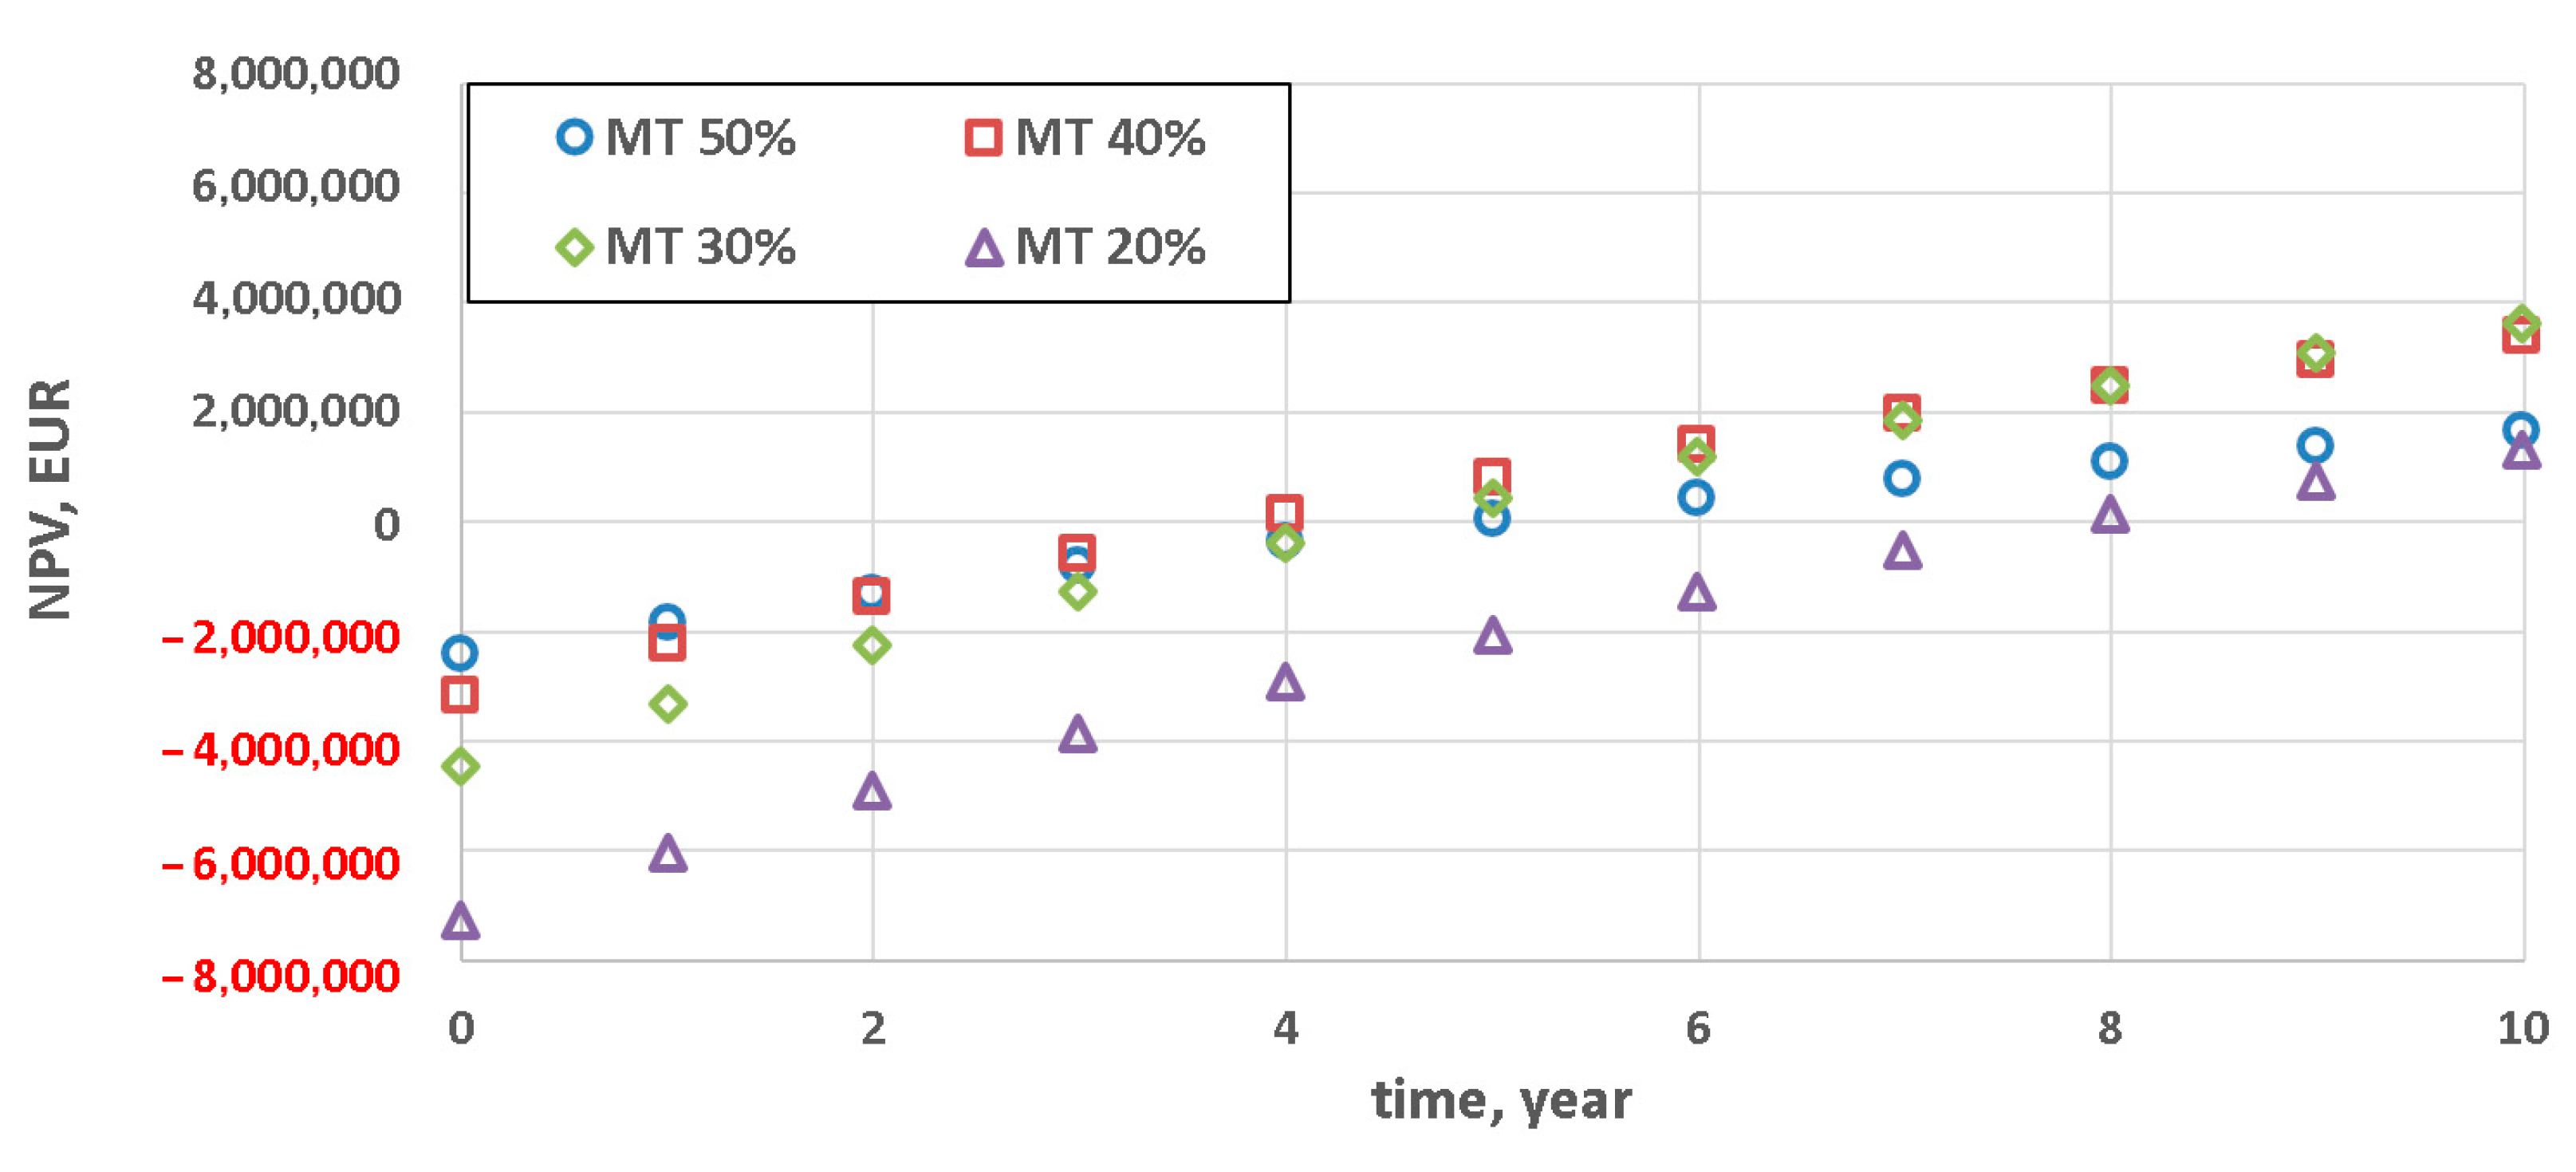
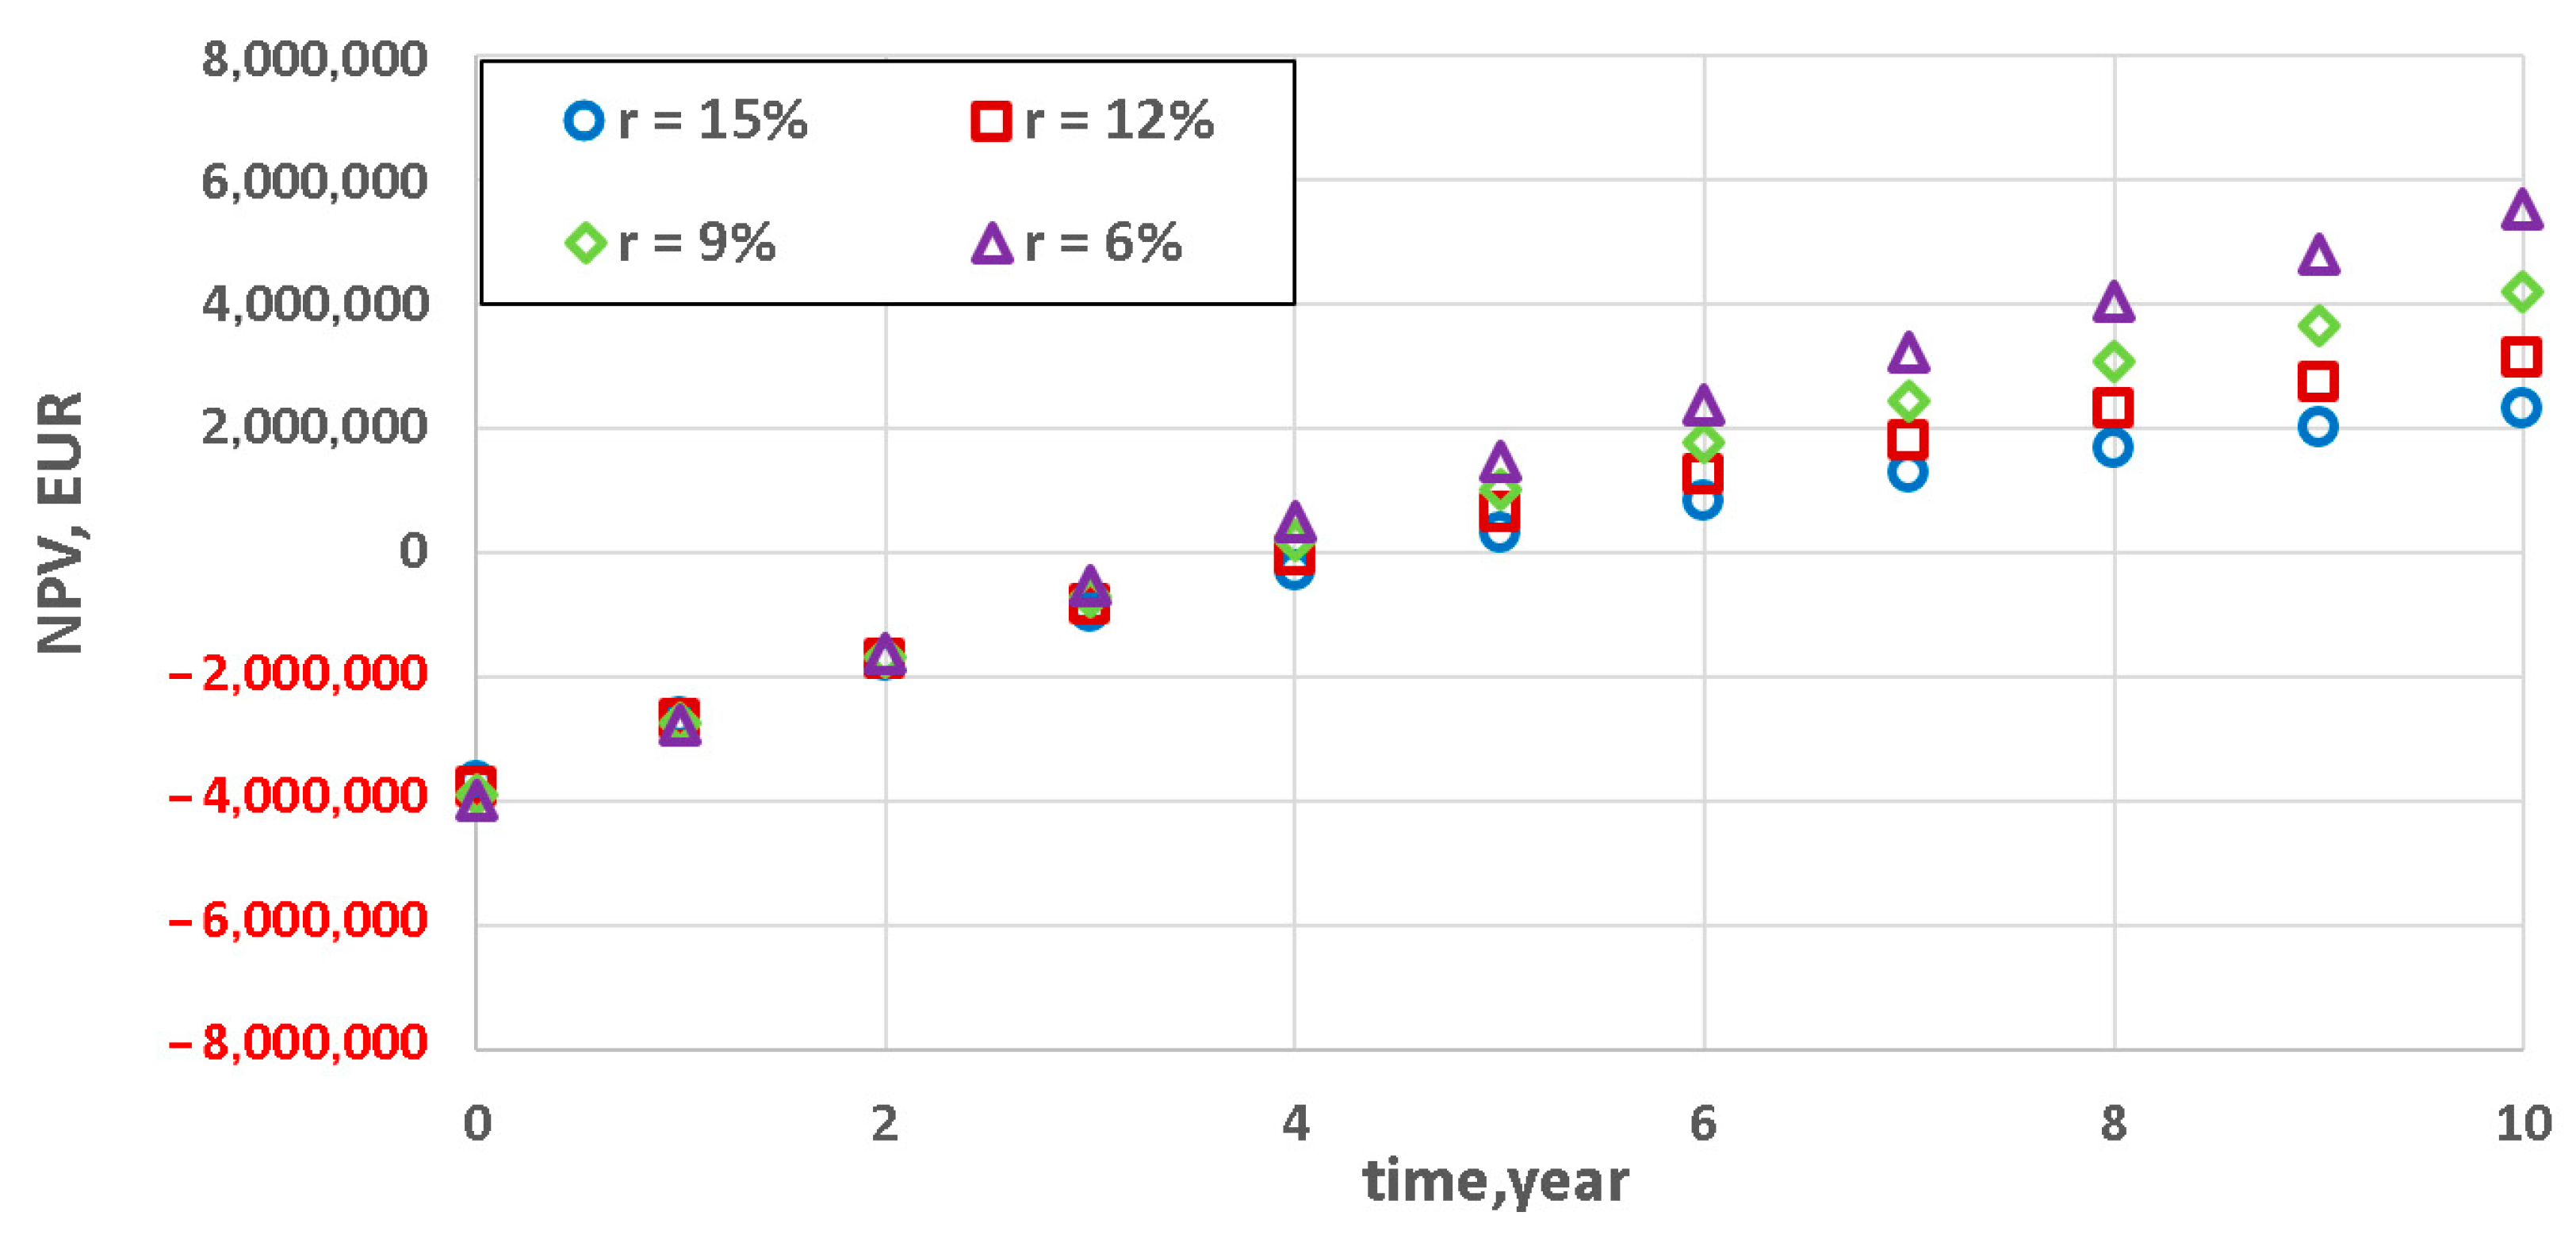
In this study, the net present value (NPV) method was used to analyze the cost-effectiveness of a plasma system for improving power boiler flexibility. This method is often used to assess the profitability of projects in the energy sector [62].

4.1. NPV Method

The net present value method is a discount method for evaluating the cost-effectiveness of projects [63]. NPV is a sum of money flows from a project, from which the initial capital outlays are then deducted. This method enables one to compare the expenditures to be incurred to carry out a project with all the money flows that the project can generate during its realization. Therefore, when calculating NPV, one takes into account the current value of each of the flows [63]. Thus this method is based on the theory of the time value of money. Discounting allows estimating the present value of a money flow that the project owner expects in the future. It takes into account the potential possibilities of using the capital of a given value through the selection of a discount rate for the calculations. The selection of a discount rate reflects the investor’s wishes, whereas in the case of cost–benefit analyses the selection of a rate of return based on feasible rates of return on safe investments seems to be sensible and realistic.
The result of the analysis is relatively easy to interpret. When the result is greater than or equal to zero (NPV ≥ 0), the project should be realized since it meets the investor’s expectations [64]. Otherwise, from the investor’s point of view, the realization of the project in the considered time horizon is unprofitable.
NPV is calculated using the following equation [63,65,66,67]:
NPV = i = 0 n CF i ( 1 + r ) n
where:
  • CFi—cash flow in the i-th period;
  • n—number of periods;
  • r—expected rate of return.
As regards money flows, all the expected flows that will be generated by the project in the future are taken into consideration. The values of the future money flows are substituted into the formula. The time interval between the flows should be constant, but the flows need not be the same in each of the periods. The analysis can be limited to a certain number of periods constituting the investor’s investment horizon.
The expected rate of return can reflect the project investors’ expectations concerning the capital raising costs or their profit expectations. The expected rate of return always applies to a single period in which a money flow occurs.

4.2. Assumptions Made Prior to the Analysis

For the purposes of this study, several technical and financial assumptions were made. It was assumed that the plasma system would be installed on a pulverized coal (PC) boiler, producing steam for a 200 MWel power unit. Simulation data for this boiler were based on IASE (Institute of Power Systems Automation) inhouse operational research and the WUST (Wrocław University of Science and Technology) authors’ experimental research. It was assumed that plasma units would be installed on two opposite burners (half the number of burners on a level) on each of the first three levels (altogether six burners). In the literature on the subject, similar configurations can be found for boilers BKZ 160 [41] and BKZ 640-140 [40]. Plasma-assisted pulverized coal burners can be configured differently, but this can affect only the uniformity of temperature distribution in the chamber volume and has no bearing on the installation costs. Therefore a specific configuration should be adopted for a considered particular case.
The rated power of 31.7 MW was assumed for the boilers. Since no relevant data were available, different ratios of the power of the plasma torch to the thermal power of the burner on which the former was to be installed, depending on the expected technical minimum level, were assumed. The literature specifies the power supplied to plasma torches as approx. 2.5% of the burner’s thermal power, but there is no information about the technical minimum at which this value was achieved [40]. The authors’ own research showed that a microwave plasma lance with power as low as 0.1% of the pulverized fuel burner, integrated with the latter, could be used to maintain combustion at a technical minimum. The minimum level of the power of a microwave antenna, assumed in this work, was 0.3% of the pulverized fuel burner. The power used for calculations was higher for some of the cases, as it was assumed that the power of the plasma torch would depend on the required technical minimum to be achieved in accordance with the following equation:
P p l a s m a = P 0 · ( P min t e c h   n o m P min t e c h   p l a s m ) Y
where:
  • P 0 
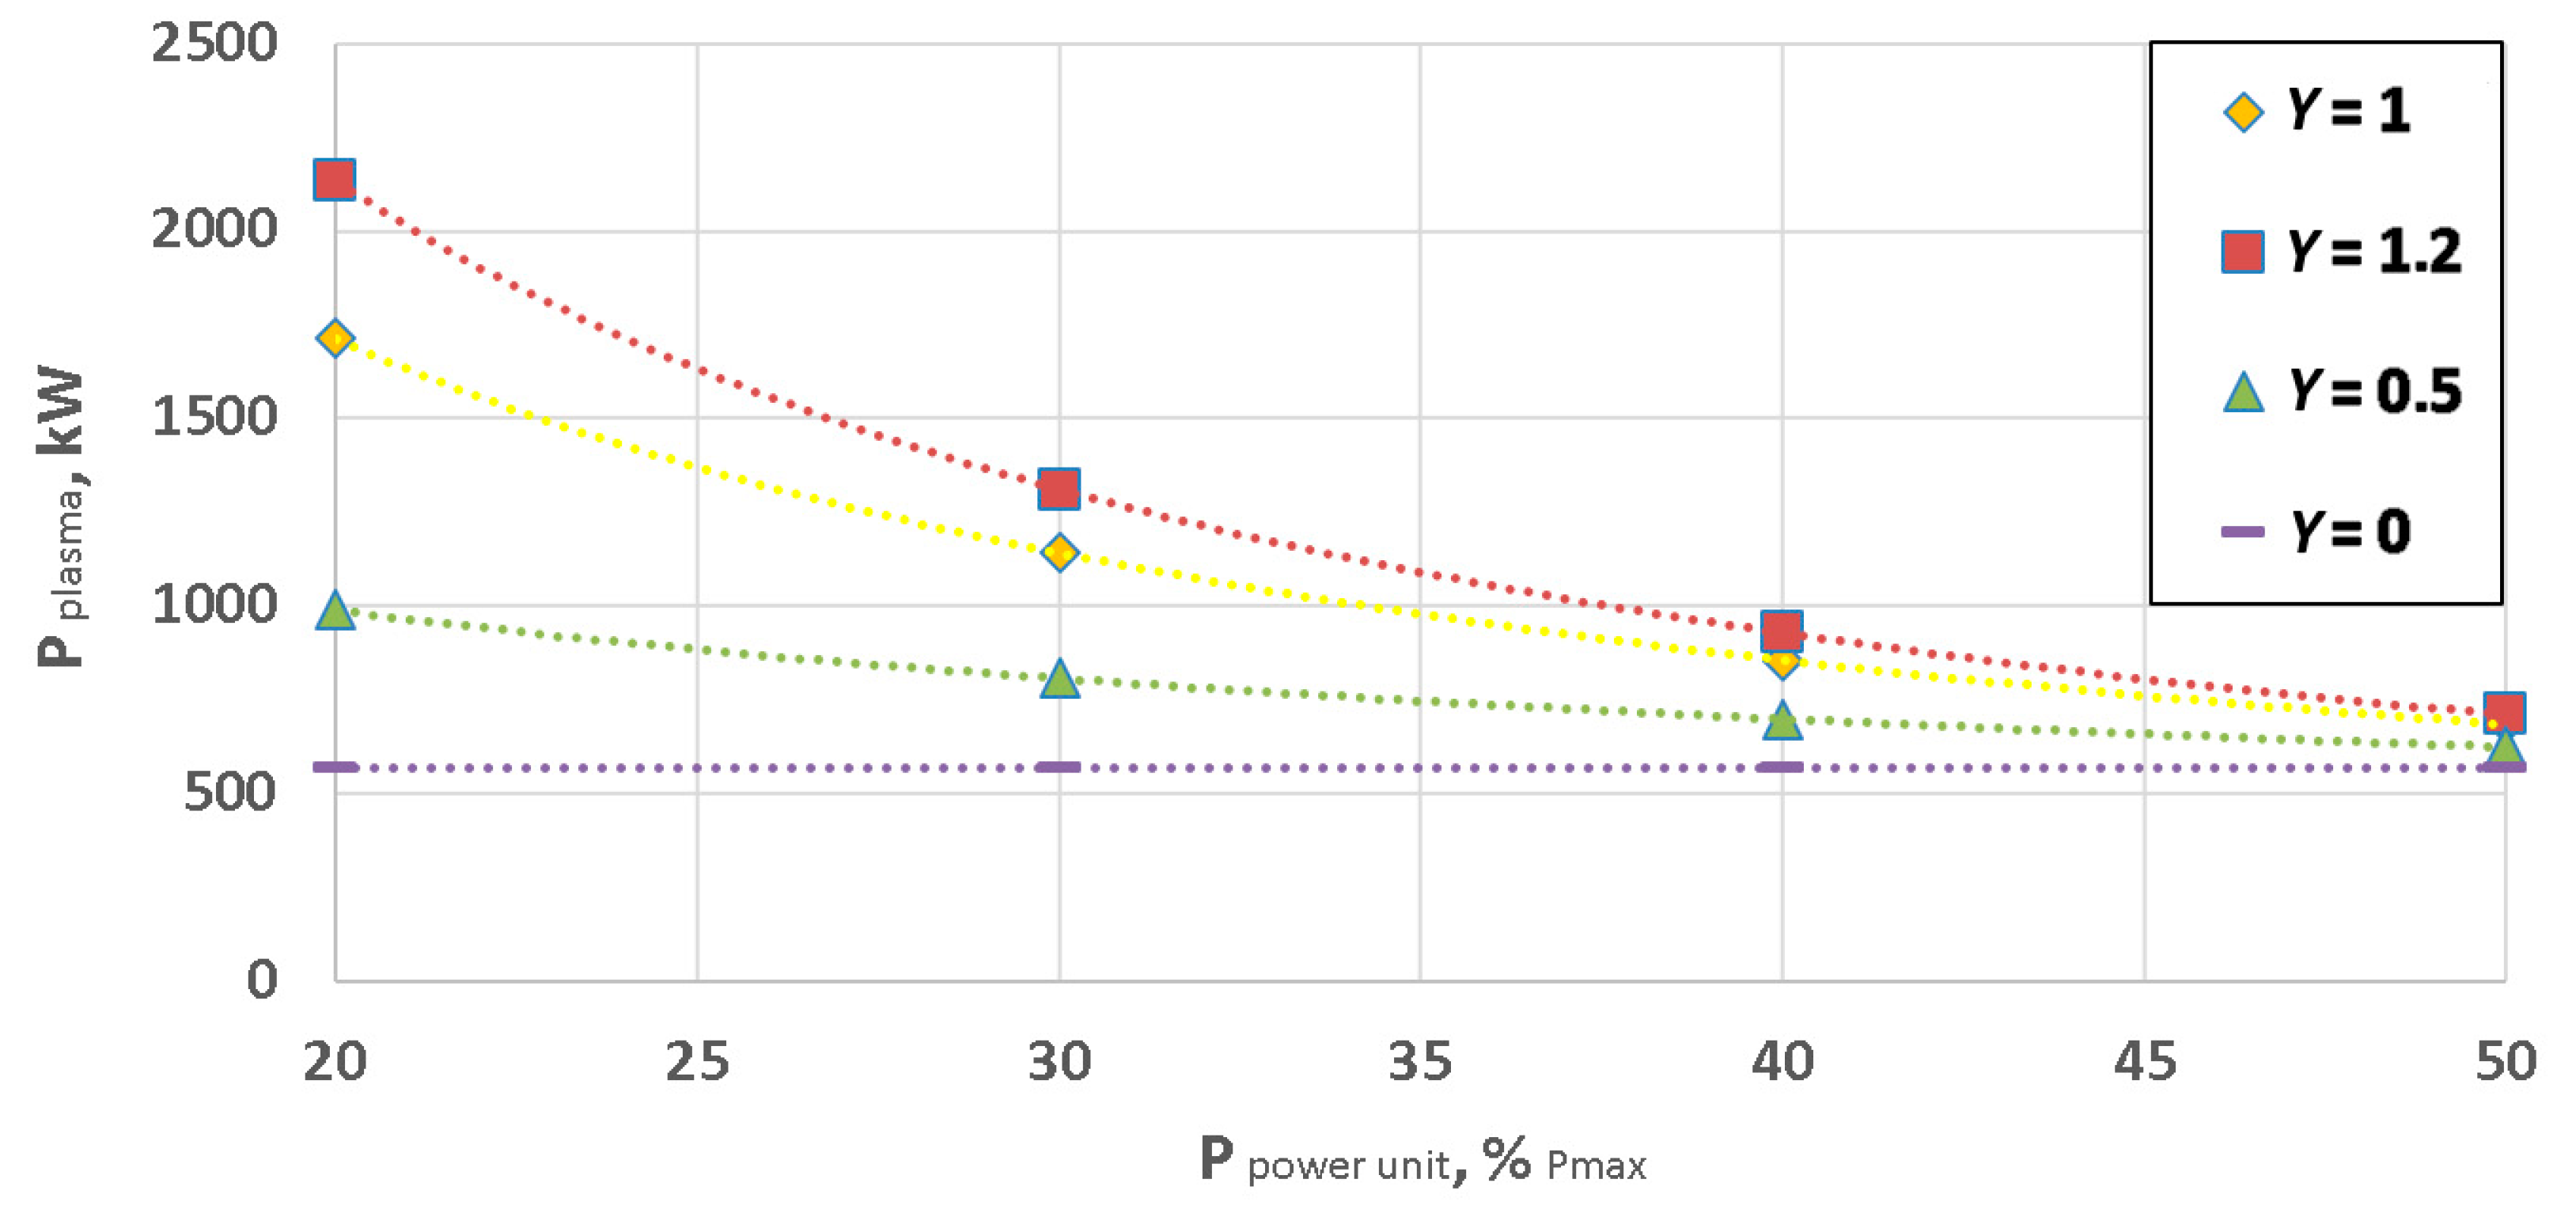
—assumed relative power of the plasma torch used to stabilize combustion, as % the burner’s thermal power;
  • P min t e c h   n o m —current boiler/generating unit technical minimum, as % of the rated boiler/generating unit power;
  • P min t e c h   p l a s m —assumed boiler/generating unit technical minimum achievable with plasma assistance, as % of the rated boiler/generating unit power;
  • P p l a s m a —required relative power of the plasma torch installed on the burner, as % of the burner’s thermal power.
The technical minimum of the power unit was assumed to amount to 60% of the rated power, which is a typical value for PC boilers of this class (the Polish OP650 being an example). It was also assumed that by reducing the technical minimum of a boiler, shutdowns would be avoided, which would translate into savings resulting from the avoidance of the costs associated with the later re-starting of the boiler. In practice, boiler starting costs differ depending on the boiler’s thermal state, i.e., the temperature to which it was cooled down. Moreover, hot start-ups occur more frequently than cold start-ups. On the basis of the experience relating to boilers of this type, it was assumed that owing to the use of the plasma system, 20 start-ups per year would be avoided. The average cost (whose principal component is the cost of the used-up heavy fuel oil) of such a start-up was assumed to amount to 9500 EUR.
Moreover, it was assumed that by avoiding a power generation unit shutdown through operation at a reduced technical minimum additional revenue from the sale of the energy generated during this time would be obtained. The average shutdown time of 24 h, which for 20 start-ups gives 480 operating hours per annum, was assumed. For each of the technical minimum variants, the corresponding electric energy generation level was calculated, deducting the auxiliaries associated with electricity consumption by the plasma system. The price of the electricity was assumed to be 0.05 EUR/kWh, based on the average value of the wholesale prices at the beginning of 2018 [68].
Furthermore, it was assumed that owing to the possibility of reducing the technical minimum, the installation would bring in additional revenues from the capacity market, where the offered power volume (kW/year) would be equal to the difference between the presently achievable technical minimum and the new technical minimum achievable after the installation of the plasma system. On the basis of the closing price at the first auctions for the year 2021, the capacity assurance obligation price of 9.30 EUR/kW/year was assumed, based on the relatively low results of British auctions [53]—i.e., it was assumed that the prices would tend to go down with the development of the markets. As there is an obvious and positive correlation between the prices of the capacity assurance and economic performance of plasma-assisted combustion system, we believe this assumption is rather conservative and could be treated as the worst-case scenario.
For the different variants mentioned above, analyses were carried out assuming the investment cost of 370,000 EUR/100 kW of the plasma system power. A breakdown of the investment cost is shown in Table 1. Moreover, for a selected technical minimum variant (30%), an NPV analysis was carried out for different investment cost levels: from 370,000 to 260,000 EUR/100 kW of the plasma system power.
The costs estimations (Table 1) for each of the subsystems were based on the experience of authors. Moreover, it was assumed that installation and start-up at the power unit will take 600 man-hours, optimization of work will take 500 man-hours, and subsequent training of the power unit operators will take 250 man-hours.
The cost of a single man hour was estimated to be 100 EUR on average, which is fairly typical for an experienced engineer in Western European countries. Overheads were assumed to be 30% of the sum of all the other costs. Additionally, the fixed annual operational costs were assumed, i.e., 41,280 EUR of labor and 20,000 EUR of consumable spare parts. The period of one year was assumed in all of the NPV analyses. The latter were made for the investment horizon of 10 years. The expected return rate of 9% was assumed in all of the NPV analyses. Additionally, the effect of the expected return rate on NPV was examined for the variant with the technical minimum of 30% and Y = 1.

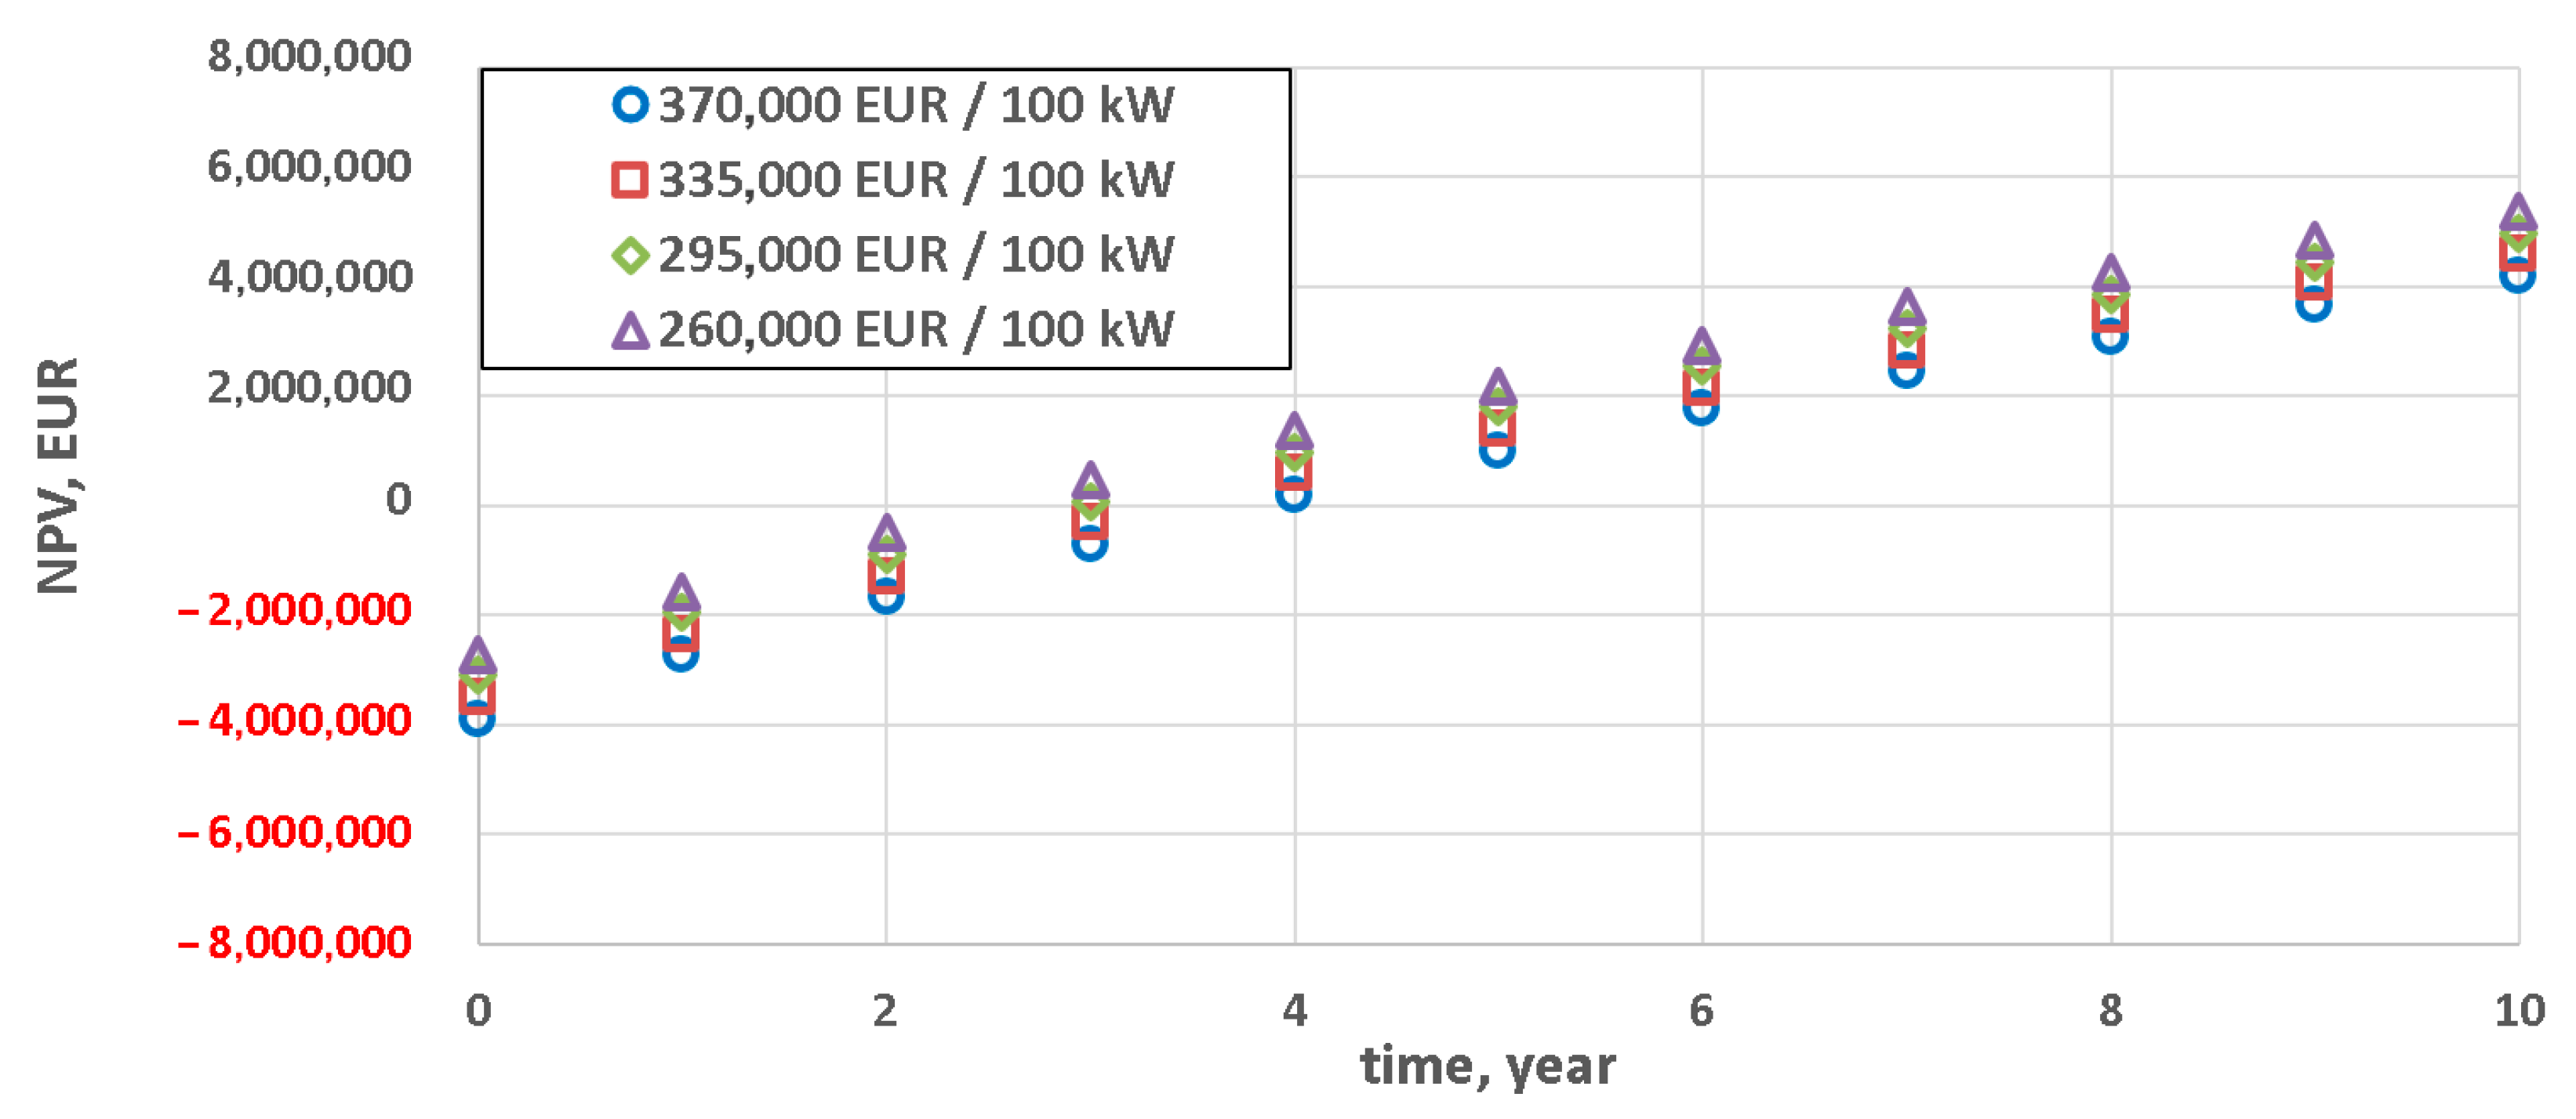
5. Results and Discussion

5.1. Results of Performed Analysis

At the moment there are no data that would allow one to definitely specify the technical minimum achievable using plasma assistance. For this reason, several different variants of the demand for plasma torch power at different technical minimum values were taken into account in the analysis.
Since at present there is no information concerning the minimal power of a plasma torch needed to obtain ignition at different technical minimum values, the analysis was carried out for different values of coefficient Y. As Figure 2 shows, the different assumed values of coefficient Y translate into different values of the plasma torch’s power needed to sustain the combustion process at the reduced technical minimum. In the case of NPV calculations, this would significantly affect the obtained results because of the assumed constant investment costs per 100 kW of the power of the plasma torch.
Regardless of the achieved technical minimum, the variant with the lowest technical minimum yielded decidedly the best result for the same power of plasma torch (Figure 3)—a positive NPV was reached already in the second year after the investment for the least lucrative variant (technical minimum of 50%). This is due to the fact that in the case of the lowest technical minimum, the same level of outlays in the zero year brings in the largest revenues from the capacity market. For the same investment outlays (Y = 0) the stream of revenues is the deciding factor.
In the case of the NPV analysis carried out for different capital expenditures, where coefficient Y = 0.5 can be used as a measure of the difference between the expenditures, the results (Figure 4) were similar to the ones obtained for coefficient Y = 0 (Figure 3). The best cost performance characterized the variant in which a technical minimum of 20% was achievable. However, the differences between the NPVs for the particular variants were not highly significant due to the higher investment costs stemming from the assumed higher plasma system power.
At coefficient Y = 1 the results were slightly different (Figure 5), i.e., the least promising results were for the variant with the lowest technical minimum (MT 20%) and for the variant permitting a relatively small technical minimum reduction (MT 50%). In the case of MT 20%, because of the relatively high capital expenses (for Y = 1), this variant becomes profitable (NPV > 0) as late as after seven years. Variant MT 50%, despite the substantially lower capital expenditures, becomes profitable towards the end of the considered investment horizon (10 years). Also in the case of coefficient Y = 1.2, the two extreme values of the achievable technical minimum resulted in the lowest cost-effectiveness (Figure 6), but the difference between them and variants MT 40% and MT 30% was slightly more distinct.
If plasma solutions become more widespread, the unit costs of such installations (EUR/100 kW), will go down. Furthermore, the simultaneous retrofitting of several power generation units in a given power plant would also improve the negotiation position of this entity in price negotiations. The effect of a reduction in the investment cost of plasma installations for aiding boiler operation is shown in Figure 7. Thanks to a reduction in the investment cost by about 35%, the period in which the project can reach NPV = 0 can be shortened from about five to about three years.
Figure 8 shows the effect of the expected return rate on project NPV. For the considered case (the power unit technical minimum amounting to 30% of the rated power, Y = 1) the project becomes profitable (NPV > 0) two years earlier when the expected rate of return is changed from 15% to 6%. In the considered 10 year investment horizon, the project can be regarded as economically viable even if a return rate of 15% is assumed. The effect of the price of 1 kW obtainable at capacity market auctions on project NPV is shown in Figure 9. This effect is considerable within the assumed 10 year investment horizon.

5.2. Non-Technical Risks of Investment in Plasma-Assisted Combustion Solution and Risk Mitigation Strategies

Non-technical risks should not be overlooked in any decision process when an investment is to be made in the energy sector. This is especially true for system power plants, which are supposed to be responsible for the security of energy supply. One of the non-technical risks is the possibility to be excluded from participation in the capacity mechanisms. In the European Union, only units that emit 550 g of CO2 of fossil fuel origin per kWh of electricity can take part in the capacity market [69]. Moreover, such units cannot emit more than 350 kg of CO2 of fossil fuel origin on average per year per 1 kWel of installed power [69]. Both limits are calculated based on net efficiency at nominal capacity under the relevant standards provided for by the International Organization for Standardization [69]. A simple calculation shows that a unit with an emission of 550 g of CO2 of fossil fuel origin per kWh of electricity can operate for a maximum of 636 h per year. Consequently, an emission factor lower than 44 g of CO2 of fossil fuel origin per kWh of electricity is needed to operate for approximately 8000 h per year (Figure 10).
Coal-fired power plants achieve much higher values [70]. Nonetheless, EU regulations do not exclude biomass [69,71] as long as sustainability requirements are maintained across the supply chain [71,72]. Co-firing of coal with large shares of raw biomass is technically difficult [73,74]. However, the use of torrefied biomass can be used to remediate this deficiency [73,74,75,76,77,78,79], as fuel properties can be significantly improved by valorization through torrefaction [80,81,82,83]. Li et al. [70] reported that it is possible to achieve net CO2 emissions that are lower than 400 g/kWh with a co-firing ratio of 50% [70]. Boylan et al. [84] reported successful co-firing trials, using a 40 MW PC boiler with a single mill operation. Co-firing ratios ranged from 20% to 75% (by mass) and operation on 100% of torrefied fuel was also possible [84]. Li et al. [85] performed simulations of co-firing of torrefied biomass in a 220 MWel power unit when using a part of the heat for torrefaction [85]. For this scenario, a slight loss of efficiency was observed, with a maximum value of approx. 1% for a substitution ratio of 100% and a torrefaction temperature of 300 °C [85]. However, the use of the torrefaction closer to the source of the biomass may be more beneficial along the complete supply chain [86]. Furthermore, the sizes of the technologies being market-ready or close to that stage also seem to favor this solution [87]. Pulverized torrefied fuel is considered to be more reactive in comparison to coal [88,89]. Thus it could be reasonably expected that its use might help in the additional lowering of the technical minimum of the unit.
Overall, many different concepts exist currently with the potential to lower the technical minimum [16], thus increasing the benefits of participating in the capacity markets. However, these solutions should not be considered as a competition for plasma-assisted combustion, but rather as complementary solutions that could lead to a synergetic effect, thus maximizing the profitability. Further research on the extent of that synergetic effect is recommended.

6. Conclusions

The NPV analysis has shown that the use of a plasma assistance system in order to reduce the technical minimum of 200 MWel power generation units can be economically viable. Many factors of technical and economic nature have a bearing on the economic viability of such a project. The price of 1 kW on the capacity market and the expected return rate are meaningful in the long term. Since this market is not fully mature, one can expect that the prices of power will gradually go down, especially considering the prices achieved on similarly structured mature markets (e.g., in Great Britain). On the other hand, the decline in prices will undoubtedly be limited by the supply of new power generation units on the capacity market and the forecasted increase in electric energy demand, engaging increasingly greater generation capacities. Moreover, the increase in the installed capacity of uncontrollable energy sources should naturally stimulate demand on the capacity market. Taking into account the above factors, the use of plasma systems sustaining combustion and making it possible to reduce the technical minimum of a boiler (and, consequently, of the power unit) seems to be worth considering. The wider use of such systems will inevitably lead in the future to a reduction in the necessary capital expenditures. Furthermore, the use of such systems in newly built units will result in project cost savings owing to the elimination of the costs associated with the installation of the lighting-up heavy fuel oil burners.
The cost of the installation itself had a marginal effect on the NPV. The obtained results indicate that the ability to lower the technical minimum of the boiler is a decisive factor influencing the economics of the investment for such an installation. In order to optimize such projects cost-wise, further research on the plasma system’s minimal power (relative to the burner’s power) enabling ignition at different technical minimum levels is needed. Further research is also needed in the field of modeling and simulation of power boilers to confirm the possibility of reducing the technical minimum (for given units) with regard to heat transfer in the boiler’s convection part at a reduced flue gas flow. Further research is also needed on the effect of a leaner powdered fuel–air mixture on chimney loss. Owing to the minimization of plasma power needed to sustain the combustion process, the capital expenditures will be reduced, whereas the greater ability to reduce the technical minimum should significantly increase the stream of capacity market revenues obtained by a power generation unit. Moreover, the effect of scale was not taken into account in this assessment of the economics of such installations. Therefore, results may be even better for power units of greater power, which nowadays are becoming more common in modern power systems.

Author Contributions

Conceptualization: T.M., H.P.-K. and L.N.; methodology: L.N.; validation: T.M., H.P.-K. and E.Z.; formal analysis: L.N.; investigation: T.M. and L.N.; resources: T.M., H.P.-K. and E.Z.; writing—original draft preparation: L.N.; writing—review and editing: T.M., H.P.-K and A.C.; visualization: A.C. and L.N.; supervision: T.M., E.Z. and H.P.-K. All authors have read and agreed to the published version of the manuscript.

Funding

This research received no external funding.

Conflicts of Interest

The authors declare no conflict of interest.

References

  1. Stanek, W.; Czarnowska, L.; Gazda, W.; Simla, T. Thermo-ecological cost of electricity from renewable energy sources. Renew. Energy 2018, 115, 87–96. [Google Scholar] [CrossRef]
  2. Gazda, W.; Stanek, W. Energy and environmental assessment of integrated biogas trigeneration and photovoltaic plant as more sustainable industrial system. Appl. Energy 2016, 169, 138–149. [Google Scholar] [CrossRef]
  3. Stanek, W.; Simla, T.; Gazda, W. Exergetic and thermo-ecological assessment of heat pump supported by electricity from renewable sources. Renew. Energy 2019, 131, 404–412. [Google Scholar] [CrossRef]
  4. Baum, Z.; Palatnik, R.R.; Ayalon, O.; Elmakis, D.; Frant, S. Harnessing households to mitigate renewables intermittency in the smart grid. Renew. Energy 2019, 132, 1216–1229. [Google Scholar] [CrossRef]
  5. Mesfun, S.; Sanchez, D.L.; Leduc, S.; Wetterlund, E.; Lundgren, J.; Biberacher, M.; Kraxner, F. Power-to-gas and power-to-liquid for managing renewable electricity intermittency in the Alpine Region. Renew. Energy 2017, 107, 361–372. [Google Scholar] [CrossRef] [Green Version]
  6. Tarroja, B.; Mueller, F.; Eichman, J.D.; Brouwer, J.; Samuelsen, S. Spatial and temporal analysis of electric wind generation intermittency and dynamics. Renew. Energy 2011, 36, 3424–3432. [Google Scholar] [CrossRef] [Green Version]
  7. Xia, S.; Chan, K.W.; Luo, X.; Bu, S.; Ding, Z.; Zhou, B. Optimal sizing of energy storage system and its cost-benefit analysis for power grid planning with intermittent wind generation. Renew. Energy 2018, 122, 472–486. [Google Scholar] [CrossRef]
  8. Jacobson, M.Z.; Delucchi, M.A.; Cameron, M.A.; Mathiesen, B.V. Matching demand with supply at low cost in 139 countries among 20 world regions with 100% intermittent wind, water, and sunlight (WWS) for all purposes. Renew. Energy 2018, 123, 236–248. [Google Scholar] [CrossRef]
  9. Fiedler, T. Simulation of a power system with large renewable penetration. Renew. Energy 2019, 130, 319–328. [Google Scholar] [CrossRef]
  10. Stein-Brzozowska, G.; Bergins, C. The Current Trends in Conventional Power Plant Technology on Two Continents from the Perspective of Engineering, Procurement, and Construction Contractor and Original Equipment Manufacturer. J. Energy Resour. Technol. 2016, 138. [Google Scholar] [CrossRef]
  11. Bakr, H.M.; Shaaban, M.F.; Osman, A.H.; Sindi, H.F. Optimal Allocation of Distributed Generation Considering Protection. Energies 2020, 13, 2402. [Google Scholar] [CrossRef]
  12. Installed Capacity of Units above 1 MW, Aggregated per Production Type—RTE Services Portal. Available online: https://www.services-rte.com/en/view-data-published-by-rte/production-installed-capacity.html (accessed on 31 August 2019).
  13. Installed Power|Energy Charts. Available online: https://www.energy-charts.de/power_inst.htm (accessed on 31 August 2019).
  14. Electricity Production|Energy Charts. Available online: https://energy-charts.de/power.htm (accessed on 31 August 2019).
  15. Simla, T.; Stanek, W. Reducing the impact of wind farms on the electric power system by the use of energy storage. Renew. Energy 2020, 145, 772–782. [Google Scholar] [CrossRef]
  16. Pawlak-Kruczek, H.; Niedźwiecki, Ł.; Ostrycharczyk, M.; Czerep, M.; Plutecki, Z. Potential and methods for increasing the flexibility and efficiency of the lignite fired power unit, using integrated lignite drying. Energy 2019, 181, 1142–1151. [Google Scholar] [CrossRef]
  17. Avagianos, I.; Atsonios, K.; Nikolopoulos, N.; Grammelis, P.; Polonidis, N.; Papapavlou, C.; Kakaras, E. Predictive method for low load off-design operation of a lignite fired power plant. Fuel 2017, 209, 685–693. [Google Scholar] [CrossRef]
  18. Ju, Y.; Sun, W. Plasma assisted combustion: Dynamics and chemistry. Prog. Energy Combust. Sci. 2015, 48, 21–83. [Google Scholar] [CrossRef]
  19. Wnukowski, M. Decomposition of tars in microwave plasma - preliminary results. J. Ecol. Eng. 2014, 15, 23–28. [Google Scholar] [CrossRef]
  20. Hwang, J.; Bae, C.; Park, J.; Choe, W.; Cha, J.; Woo, S. Microwave-assisted plasma ignition in a constant volume combustion chamber. Combust. Flame 2016, 167, 86–96. [Google Scholar] [CrossRef]
  21. Askari, O. Thermodynamic Properties of Pure and Mixed Thermal Plasmas Over a Wide Range of Temperature and Pressure. J. Energy Resour. Technol. Trans. ASME 2018, 140. [Google Scholar] [CrossRef] [Green Version]
  22. Taki, H.; Asai, H.; Kitagawa, K.; Oyama, H.; Gupta, A.K. Laser-induced plasma spectrometry with chemical seeding and application to flow mixing analysis in methane-air flames. J. Energy Resour. Technol. Trans. ASME 2015, 137. [Google Scholar] [CrossRef]
  23. Kim, K.; Askari, O. Understanding the Effect of Capacitive Discharge Ignition on Plasma Formation and Flame Propagation of Air-Propane Mixture. J. Energy Resour. Technol. Trans. ASME 2019, 141. [Google Scholar] [CrossRef]
  24. Jamróz, P.; Kordylewski, W.; Wnukowski, M. Microwave plasma application in decomposition and steam reforming of model tar compounds. Fuel Process. Technol. 2018, 169, 1–14. [Google Scholar] [CrossRef]
  25. Wnukowski, M.; Jamróz, P. Microwave plasma treatment of simulated biomass syngas: Interactions between the permanent syngas compounds and their influence on the model tar compound conversion. Fuel Process. Technol. 2018, 173, 229–242. [Google Scholar] [CrossRef]
  26. Fernandes, C.; Frías, P.; Reneses, J. Participation of intermittent renewable generators in balancing mechanisms: A closer look into the Spanish market design. Renew. Energy 2016, 89, 305–316. [Google Scholar] [CrossRef]
  27. Zigan, L. Overview of electric field applications in energy and process engineering. Energies 2018, 11, 1361. [Google Scholar] [CrossRef] [Green Version]
  28. Leonov, S. Electrically Driven Supersonic Combustion. Energies 2018, 11, 1733. [Google Scholar] [CrossRef] [Green Version]
  29. Tholin, F.; Lacoste, D.A.; Bourdon, A. Influence of fast-heating processes and O atom production by a nanosecond spark discharge on the ignition of a lean H2-air premixed flame. Combust. Flame 2014, 161, 1235–1246. [Google Scholar] [CrossRef]
  30. Zare, S.; Lo, H.W.; Askari, O. Flame Stability in Inverse Coaxial Injector using Repetitive Nanosecond Pulsed Plasma. J. Energy Resour. Technol. 2020, 142, 1–10. [Google Scholar] [CrossRef]
  31. Starikovskiy, A.; Aleksandrov, N. Plasma-assisted ignition and combustion. Prog. Energy Combust. Sci. 2013, 39, 61–110. [Google Scholar] [CrossRef] [Green Version]
  32. Lacoste, D.A.; Moeck, J.P.; Roberts, W.L.; Chung, S.H.; Cha, M.S. Analysis of the step responses of laminar premixed flames to forcing by non-thermal plasma. Proc. Combust. Inst. 2017, 36, 4145–4153. [Google Scholar] [CrossRef] [Green Version]
  33. Gray, J.A.T.; Lacoste, D.A. Enhancement of the transition to detonation of a turbulent hydrogen–air flame by nanosecond repetitively pulsed plasma discharges. Combust. Flame 2019, 199, 258–266. [Google Scholar] [CrossRef]
  34. Messerle, V.E.; Karpenko, E.I.; Ustimenko, A.B.; Lavrichshev, O.A. Plasma preparation of coal to combustion in power boilers. Fuel Process. Technol. 2013, 107, 93–98. [Google Scholar] [CrossRef]
  35. Kobel, P.; Kordylewski, W. Zastosowanie plazmotronu zasilanego powietrzem do stabilizacji płomienia pyłowego. Arch. Spal. 2008, 8, 55–62. [Google Scholar]
  36. Bukowski, P.; Kobel, P.; Kordylewski, W.; Mączka, T. Use of cavity plasmatron in pulverized coal muffle burner for start-up of a boiler. Rynek Energii 2010, 86, 132–136. [Google Scholar] [CrossRef]
  37. Kobel, P. Systemy wykorzystujące plazmę jako alternatywna metoda rozruchu kotłów pyłowych. In Interdyscyplinarność Badań Naukowych; Szrek, J., Ed.; Oficyna Wydawnicza Politechniki Wrocławskiej: Wrocław, Poland, 2010; ISBN 9788374935203. [Google Scholar]
  38. Pawlak-Kruczek, H.; Niedźwiecki, Ł. Stabilnie w zmiennych warunkach. Problem stabilności kotłów energetycznych w warunkach zmiennych obciążeń. Nowe wyzwania—wzrost mocy zainstalowanej w niesterowalnych OZE. Energetyka Cieplna i Zawodowa 2017, 6, 46–52. Available online: http://yadda.icm.edu.pl/yadda/element/bwmeta1.element.baztech-1e49d8ec-94a5-4e67-bf6c-29b68784af4a (accessed on 31 August 2019).
  39. Messerle, V.E.; Askarova, A.S.; Bolegenova, S.A.; Yu Maximov, V.; Nugymanova, A.O. 3D-modelling of Kazakhstan low-grade coal burning in power boilers of thermal power plant with application of plasma gasification and stabilisation technologies. J. Phys. Conf. Ser. 2019, 1261. [Google Scholar] [CrossRef]
  40. Karpenko, E.I.; Messerle, V.E.; Ustimenko, A.B. Plasma-aided solid fuel combustion. Proc. Combust. Inst. 2007, 31, 3353–3360. [Google Scholar] [CrossRef]
  41. Messerle, V.E.; Karpenko, E.I.; Ustimenko, A.B. Plasma assisted power coal combustion in the furnace of utility boiler: Numerical modeling and full-scale test. Fuel 2014, 126, 294–300. [Google Scholar] [CrossRef]
  42. Ke, Z.; Lin, L.; Schröder, H.; Guoqing, F. Plasma ignition system for oil free power plant Zetes in Turkey and its advantages fort the changed circumstance of energy market. VGB PowerTech. 2017, 7, 77–81. [Google Scholar]
  43. Kobel, P.; Mączka, T. Plasma-assisted kindling of pulverized coal fired boilers. In XXI International Symposium on Combustion Processes; Wydawnictwo Uczelniane Zachodniopomorskiego Uniwersytetu Technologicznego: Międzyzdroje, Poland, 2010; pp. 33–34. [Google Scholar]
  44. Kobel, P.; Kordylewski, W.; Mączka, T.; Kordas, R.; Milewicz, R.; Modrzejewski, M. Zastosowanie plazmotronu wnękowego w muflonowym palniku pyłowym do rozruchu kotła energetycznego. In Aktualne Problemy Budowy i Eksploatacji Kotłów: Jubileuszowa Konferencja Kotłowa 2009 z Okazji 60-lecia Fabryki Kotłów RAFAKO SA; Instytut Maszyn i Urządzeń Energetycznych—Politechnika Śląska: Szczyrk, Poland, 2009; pp. 33–46. [Google Scholar]
  45. Kordylewski, W.; Kobel, P.; Mączka, T.; Kordas, R. Eliminacja zakłóceń elektromagnetycznych podczas plazmowego rozruchu kotłów. In Systemy, Technologie i Urządzenia Energetyczne: Praca Zbiorowa. T. 1; Wydawnictwo Politechniki Krakowskiej: Kraków, Poland, 2010; pp. 235–244. [Google Scholar]
  46. Kordylewski, W.; Mączka, T.; Kordas, R. Urządzenia rozruchowe plazmotronu dużej mocy. Przegląd Elektrotech. 2009, 85, 116–119. [Google Scholar]
  47. Kordylewski, W.; Kobel, P.; Mączka, T.; Bukowski, P. Plazmowy rozruch i stabilizacja spalania w kotłach pyłowych. In XII Międzynarodowa Konferencja Naukowo-Techniczna: Forum Energetyków GRE; Oficyna Wydawnicza Politechniki Opolskiej: Szczyrk, Poland, 2010. [Google Scholar]
  48. Maczka, T. Technologia Plazmowego Zgazowania Biomasy i Odpadów Organicznych dla Wytwarzania Paliw Płynnych; Wydawnictwo Książkowe Instytutu Elektrotechniki: Warszawa, Poland, 2014; ISBN 978-83-61956-32-7. [Google Scholar]
  49. Coibion, A.; Pickett, J.; Capacity mechanisms. Reigniting Europe’s energy markets. Linklaters. 2014. Available online: https://www.linklaters.com/pdfs/mkt/london/6883_LIN_Capacity_Markets_Global_Web_Single_Final_1.pdf (accessed on 31 August 2019).
  50. Komar, D. Rynek mocy na każdy mix elektroenergetyczny. Energetyka Cieplna i Zawodowa 2017, 5, 158–160. Available online: http://yadda.icm.edu.pl/yadda/element/bwmeta1.element.baztech-73c20c67-9fdb-48d7-8690-45d1493f01a4 (accessed on 31 August 2019).
  51. UK Office of Gas and Electricity Markets (OFGEM). Consolidated Version of the Capacity Market Rules. 2018. Available online: https://www.ofgem.gov.uk/system/files/docs/2018/07/consolidated_capacity_market_rules.pdf (accessed on 31 August 2019).
  52. Benalcazar, P.; Nalepka, P. The Polish capacity market proposal vs. the British model. Polityka Energ. Energy Policy J. 2017, 20, 59–72. [Google Scholar]
  53. UK Department of Energy and Climate Change. Provisional Auction Results: T-4Capacity Market Auction. 2018. Available online: https://www.emrdeliverybody.com/Capacity%20Markets%20Document%20Library/Provisional%20T-4%20Results%20DY%202021-22.pdf (accessed on 31 August 2019).
  54. Sören, A. Kerstine Appunn Germany’s New Power Market Design|Clean Energy Wire. Available online: https://www.cleanenergywire.org/factsheets/germanys-new-power-market-design (accessed on 9 September 2018).
  55. Forsström, J.; Koreneff, G.; Similä, L. Electricity Market Designs and Flexibility; Research Report VTT-R-04621-1; VTT Technical Research Centre of Finland Ltd.: Espoo, Finland, 2016. [Google Scholar]
  56. Nordic Council of Ministers. Demand Side Flexibility in the Nordic Electricity Market; Nordic Council of Ministers Publication Unit: Copenhagen, Denmark, 2017. [Google Scholar]
  57. Oluleye, G.; Allison, J.; Hawker, G.; Kelly, N.; Hawkes, A.D. A two-step optimisation model for quantifying the flexibility potential of power-to-heat systems in dwellings. Appl. Energy 2018, 228, 215–228. [Google Scholar] [CrossRef]
  58. Oualmakran, Y.; Espeche, J.M.; Sisinni, M.; Messervey, T.; Lennard, Z. Residential Electricity Tariffs in Europe: Current Situation, Evolution and Impact on Residential Flexibility Markets. Proceedings 2017, 1, 1104. [Google Scholar] [CrossRef] [Green Version]
  59. Olivella-Rosell, P.; Lloret-Gallego, P.; Munné-Collado, Í.; Villafafila-Robles, R.; Sumper, A.; Ottessen, S.Ø.; Rajasekharan, J.; Bremdal, B.A. Local flexibility market design for aggregators providing multiple flexibility services at distribution network level. Energies 2018, 11, 822. [Google Scholar] [CrossRef] [Green Version]
  60. Chojnacki, I. Na 2021 Rok w Rynku Mocy Zakontraktowane Ponad 22 tys. MW—Energetyka. Available online: https://energetyka.wnp.pl/na-2021-rok-w-rynku-mocy-zakontraktowane-ponad-22-tys-mw,335173_1_0_0.html (accessed on 1 December 2018).
  61. Caprabianca, M.; Falvo, M.C.; Papi, L.; Promutico, L.; Rossetti, V.; Quaglia, F. Replacement Reserve for the Italian Power System and Electricity Market. Energies 2020, 13, 2916. [Google Scholar] [CrossRef]
  62. Skorek, J.; Kalina, J. Gazowe Układy Kogeneracyjne; Wydawnictwo Naukowo-Techniczne WNT: Warsaw, Poland, 2005; ISBN 83-204-3103-4. [Google Scholar]
  63. Nikolopoulos, N.; Agraniotis, M.; Violidakis, I.; Karampinis, E.; Nikolopoulos, A.; Grammelis, P.; Papapavlou, C.; Tzivenis, S.; Kakaras, E. Parametric investigation of a renewable alternative for utilities adopting the co-firing lignite/biomass concept. Fuel 2013, 113, 873–897. [Google Scholar] [CrossRef]
  64. Vera, D.; Jurado, F.; Margaritis, N.K.; Grammelis, P. Experimental and economic study of a gasification plant fuelled with olive industry wastes. Energy Sustain. Dev. 2014, 23, 247–257. [Google Scholar] [CrossRef]
  65. Cui, Y.; Zhu, J.; Meng, F.; Zoras, S.; McKechnie, J.; Chu, J. Energy assessment and economic sensitivity analysis of a grid-connected photovoltaic system. Renew. Energy 2020, 150, 101–115. [Google Scholar] [CrossRef]
  66. Zografidou, E.; Petridis, K.; Petridis, N.E.; Arabatzis, G. A financial approach to renewable energy production in Greece using goal programming. Renew. Energy 2017, 108, 37–51. [Google Scholar] [CrossRef] [Green Version]
  67. Heine, K.; Thatte, A.; Tabares-Velasco, P.C. A simulation approach to sizing batteries for integration with net-zero energy residential buildings. Renew. Energy 2019, 139, 176–185. [Google Scholar] [CrossRef]
  68. European Commission. Energy Prices and Costs in Europe; European Commission: Brussels, Belgium, 2019. [Google Scholar]
  69. European Parliament and Council. Regulation (EU) 2019/943 of 5 June 2019 on the Internal Market for Electricity; European Parliament and Council: Brussels, Belgium, 2019; Volume 158, pp. 54–124. [Google Scholar]
  70. Li, J.; Brzdekiewicz, A.; Yang, W.; Blasiak, W. Co-firing based on biomass torrefaction in a pulverised coal boiler with aim of 100% fuel switching. Appl. Energy 2012, 99, 344–354. [Google Scholar] [CrossRef]
  71. European Union Agency for Cooperation of Energy Regulators. Opinion No 22/2019 of European Union Agency for Cooperation of Energy Regulators of 17 December 2019 on the Calculation of the Values of CO2 Emission Limits Referred to in the First Subparagraph of Article 22(4) of Regulation (EU) 2019/943 of 5 June 2019; European Parliament and Council: Brussels, Belgium, 2019. [Google Scholar]
  72. European Parliament and Council. Directive (EU) 2018/2001 of the European Parliament and of the Council on the Promotion of the Use of Energy from Renewable Sources; European Parliament and Council: Brussels, Belgium, 2018; Volume 328, pp. 82–209. [Google Scholar]
  73. Moscicki, K.J.; Niedzwiecki, L.; Owczarek, P.; Wnukowski, M. Commoditization of biomass: Dry torrefaction and pelletisation-a review. J. Power Technol. 2014, 94, 233–249. [Google Scholar]
  74. Nunes, L.J.R.; Matias, J.C.O.; Catalao, J.P.S. A review on torrefied biomass pellets as a sustainable alternative to coal in power generation. Renew. Sustain. Energy Rev. 2014, 40, 153–160. [Google Scholar] [CrossRef]
  75. Hasan, M.; Haseli, Y. An Oxyfuel Combustion-Based Torrefaction Process: Technoeconomic Analysis. J. Energy Resour. Technol. 2020, 142. [Google Scholar] [CrossRef]
  76. Jagodzińska, K.; Czerep, M.; Kudlek, E.; Wnukowski, M.; Pronobis, M.; Yang, W. Torrefaction of Agricultural Residues: Effect of Temperature and Residence Time on the Process Products Properties. J. Energy Resour. Technol. 2020, 142, 1–8. [Google Scholar] [CrossRef] [Green Version]
  77. Sun, M.; Yang, Y.; Zhang, M. A Temperature Model for Synchronized Ultrasonic Torrefaction and Pelleting of Biomass for Bioenergy Production. J. Energy Resour. Technol. 2019, 141, 102205. [Google Scholar] [CrossRef]
  78. Rokni, E.; Liu, Y.; Ren, X.; Levendis, Y.A. Nitrogen-Bearing Emissions from Burning Corn Straw in a Fixed-Bed Reactor: Effects of Fuel Moisture, Torrefaction, and Air Flowrate. J. Energy Resour. Technol. 2019, 141, 082202. [Google Scholar] [CrossRef]
  79. Akinyemi, O.S.; Jiang, L.; Buchireddy, P.R.; Barskov, S.O.; Guillory, J.L.; Holmes, W. Investigation of Effect of Biomass Torrefaction Temperature on Volatile Energy Recovery Through Combustion. J. Energy Resour. Technol. 2018, 140. [Google Scholar] [CrossRef]
  80. Khalsa, J.H.A.; Leistner, D.; Weller, N.; Darvell, L.I.; Dooley, B. Torrefied biomass pellets—Comparing grindability in different laboratory mills. Energies 2016, 9, 794. [Google Scholar] [CrossRef] [Green Version]
  81. Park, S.; Kim, S.J.; Oh, K.C.; Cho, L.H.; Kim, M.J.; Jeong, I.S.; Lee, C.G.; Kim, D.H. Characteristic analysis of torrefied pellets: Determining optimal torrefaction conditions for agri-byproduct. Energies 2020, 13, 423. [Google Scholar] [CrossRef] [Green Version]
  82. Bajcar, M.; Zaguła, G.; Saletnik, B.; Tarapatskyy, M.; Puchalski, C. Relationship between torrefaction parameters and physicochemical properties of torrefied products obtained from selected plant biomass. Energies 2018, 11, 2919. [Google Scholar] [CrossRef] [Green Version]
  83. Dyjakon, A.; Noszczyk, T.; Smȩdzik, M. The influence of torrefaction temperature on hydrophobic properties of waste biomass from food processing. Energies 2019, 12, 4609. [Google Scholar] [CrossRef] [Green Version]
  84. Boylan, D.M.; Roberts, G.K.; Zemo, B.R.; Wilson, J.L. Torrefied Wood Field Tests at a Coal-Fired Power Plant. IEEE Trans. Ind. Appl. 2016, 52, 751–757. [Google Scholar] [CrossRef]
  85. Li, J.; Zhang, X.; Pawlak-Kruczek, H.; Yang, W.; Kruczek, P.; Blasiak, W. Process simulation of co-firing torrefied biomass in a 220 MWe coal-fired power plant. Energy Convers. Manag. 2014, 84, 503–511. [Google Scholar] [CrossRef] [Green Version]
  86. Batidzirai, B.; Mignot, A.P.R.; Schakel, W.B.; Junginger, H.M.; Faaij, A.P.C. Biomass torrefaction technology: Techno-economic status and future prospects. Energy 2013, 62, 196–214. [Google Scholar] [CrossRef]
  87. Thran, D.; Witt, J.; Schaubach, K.; Kiel, J.; Carbo, M.; Maier, J.; Ndibe, C.; Koppejan, J.; Alakangas, E.; Majer, S.; et al. Moving torrefaction towards market introduction—Technical improvements and economic-environmental assessment along the overall torrefaction supply chain through the SECTOR project. Biomass Bioenergy 2015, 89, 184–200. [Google Scholar] [CrossRef] [Green Version]
  88. Huéscar Medina, C.; Maccoitir, B.; Sattar, H.; Slatter, D.J.F.; Phylaktou, H.N.; Andrews, G.E.; Gibbs, B.M. Comparison of the explosion characteristics and flame speeds of pulverised coals and biomass in the ISO standard 1 m3 dust explosion equipment. Fuel 2015, 151, 91–101. [Google Scholar] [CrossRef]
  89. Huéscar Medina, C.; Sattar, H.; Phylaktou, H.N.; Andrews, G.E.; Gibbs, B.M. Explosion reactivity characterisation of pulverised torrefied spruce wood. J. Loss Prev. Process Ind. 2015, 36, 287–295. [Google Scholar] [CrossRef]
Figure 1. Generation of electric energy in the German electric power system, with division into sources, as of June 2019 (1—pumped-storage hydroelectric; 2—hydroelectric; 3—natural gas; 4—hard coal; 5—biomass; 6—lignite; 7—wind; 8—photovoltaic; 9—nuclear) [14].
Energies 13 05056 g001
Figure 2. The required power of plasma torches as a function of the relative power of the assumed case of 200 MWel power unit, depending on the assumed Y coefficient.
Energies 13 05056 g002
Figure 3. Results of Net Present Value analysis for different variants of achievable power unit technical minimum (MT) at coefficient Y = 0 (identical power of plasma torches assumed for all technical minimum levels).
Energies 13 05056 g003
Figure 4. Results of NPV analysis for different variants of achievable power unit technical minimum (MT) at coefficient Y = 0.5 (identical power of plasma torches assumed for all technical minimum levels).
Energies 13 05056 g004
Figure 5. Results of NPV analysis for different variants of achievable power unit technical minimum (MT) at coefficient Y = 1 (identical power of plasma torches assumed for all technical minimum levels).
Energies 13 05056 g005
Figure 6. Results of NPV analysis for different variants of achievable power unit technical minimum (MT) at coefficient Y = 1.2 (identical power of plasma torches assumed for all technical minimum levels).
Energies 13 05056 g006
Figure 7. Results of NPV analysis for different capital expenditure levels per 100 kW of plasma torch power (at a power unit technical minimum amounting to 30% of the rated power, Y = 1, r = 9%).
Energies 13 05056 g007
Figure 8. Results of NPV analysis for different values of the expected rate of return (for power unit technical minimum amounting to 30% of the rated power, Y = 1).
Energies 13 05056 g008
Figure 9. Results of NPV analysis for different prices of 1 kW/year on the capacity market (for technical minimum amounting to 30% of the rated power, Y = 1, r = 9%).
Energies 13 05056 g009
Figure 10. Annual operation time of a power unit taking part in a capacity support mechanism, depending on the emission factor (gCO2/kWh).
Energies 13 05056 g010
Table 1. Breakdown of the investment cost of the plasma installation for assisted combustion in a boiler, working with a 200 MWel power unit.
CategoryCost, EUR
Power supply (incl. wires)99,100.00
Plasma source (100 kW)15,000.00
Control system12,000.00
Torch cooling system18,000.00
Air supply system5500.00
Labor cost135,000.00
Overheads85,380.00
Total369,980.00

