Article

Impact of Powertrain Components Size and Degradation Level on the Energy Management of a Hybrid Industrial Self-Guided Vehicle

Hydrogen Research Institute, Université du Québec à Trois-Rivières, Trois-Rivières, QC G9A 5H7, Canada
*
Authors to whom correspondence should be addressed.
Energies 2020, 13(19), 5041; https://doi.org/10.3390/en13195041
Submission received: 18 August 2020 / Revised: 15 September 2020 / Accepted: 19 September 2020 / Published: 24 September 2020
(This article belongs to the Special Issue Electric Vehicle Efficient Power and Propulsion Systems)

Abstract

:
This paper deals with the design of an energy management strategy (EMS) for an industrial hybrid self-guided vehicle (SGV), considering the size of a fuel cell (FC) stack and degradation of a battery pack. In this context, first, a realistic energy model of the SGV was proposed and validated, based on experiments. This model provided a basis for individual components analysis, estimating energy requirements, component sizing, and testing various EMSs, prior to practical implementation. Second, the performance of the developed FC/battery SGV powertrain was validated under three EMS modes. Each mode was studied by considering four different FC sizes and three battery degradation levels. The final results showed that a small FC as a range extender is recommended, to reduce system cost. It is also important to maintain the FC in its high efficiency zones with a minimum ON/OFF cycle, leading to efficiency and lifetime enhancement of FC system. Battery SOC have to be kept at a high level during SGV operation, to support the FC during SGV acceleration. In order to improve the SGV’s overall autonomy, it is also important to minimize the stop and go and rotational SGV motion with appropriate acceleration and deceleration rate.

1. Introduction

In the context of industry 4.0, the issue of indoor material handling and transportation by low-speed vehicles, such as mobile robots, is a frequently discussed topic [1]. Such vehicles can play an important role by providing mobility and reducing the cost of production and material transport [2]. Vehicle-based transport systems using self-guided vehicles (SGVs) are widely used in facilities such as manufacturing plants, warehouses, distribution centers, and transshipment terminals. Differential drive mobile robots (DDMRs) are the most common and popular way to drive SGVs, due to their simplicity and zero-radius turning [3]. In this context, the electric powertrains and especially the battery based powertrains were proposed to replace the internal combustion engines (ICEs) in industrial vehicle applications [4]. However, limited autonomy, as well as the time-consuming process of recharging the batteries, are still challenging. To extend the autonomy, a primary method is to choose a bigger battery in terms of capacity, which in turn would increase the cost and the recharge time. Another notable drawback of the battery is its limited life cycle. For instance, the lifespan of a lithium battery varies from 500 to 1500 charge/discharge cycles, depending on the utilization pattern [5]. Another solution is to extend the SGV autonomy by adding a second power source like a proton exchange membrane fuel cell (PEMFC) system. Unlike the batteries, a PEMFC can be charged in just a few minutes and has the potential to provide power over a long period of time [6]. In addition, PEMFC has a high operating efficiency (around 50–70%) compared to ICEs [7]. The PEMFC has been proposed for various robotic applications, such as unmanned underwater vehicle [6,8], humanoid robot [9], and construction machinery [10,11]. Regarding the indoor industry hybrid vehicles, some progress has been made in case of forklifts [12,13], however, other types of indoor vehicles have not been considered as such.
These studies showed promising results in terms of autonomy enhancement of an industrial SGV, by employing a hybrid fuel cell/battery powertrain. However, the PEMFC has some fundamental problems, such as slow dynamics and hydrogen storage issues, for practical robotic applications [14,15]. The slow dynamic characteristic of the PEMFC causes a problem for a DDMR application, where the power requirements can vary considerably during a mission [6,8]. These variable power peaks might degrade the fuel cell (FC) and reduce its efficiency [16]. Concerning the hydrogen storage problem, it is important to note that SGVs are characterized by their mobility and compactness because of the importance of transferability in small spaces. Thus, this can lead to a challenge in the hybridization, due to the limited available space for components of an industrial SGV. For example, the size of the FC stack in terms of power, and the size of the hydrogen tank in terms of capacity and volume should be appropriate to avoid oversizing.
In this respect, when vehicle power sources are hybridized by using big batteries and small PEMFCs as a range extender, the size of the PEMFC stack can be reduced and power transients become negligible as they are absorbed by the battery pack. This enables both capital and volume savings in a vehicle design process. Moreover, the less cyclic operation of the PEMFC increases its lifetime and reduces the system control challenges [17]. Therefore, an energy management strategy (EMS) is needed to satisfy the energy needs of the SGV, the dynamic response of the system, the state of charge (SOC) of the battery, the level of hydrogen, and the energy efficiency of the system [18,19,20]. The fuel economy and performance of a hybrid SGV can be affected by the component size, EMS, etc. [21]. Nevertheless, based on the author’s knowledge, there is no standard method for analyzing the energy and components sizing of such applications, and it has not been discussed in the literature. Therefore, the design process of an EMS for a hybrid SGV system is a challenging task, given the limited durability and energy efficiency of FC and batteries, as well as the operational constraints of the SGV.
Typically, model-based design is a technique that is applied to design an embedded software by engineers in different applications. However, there is a lack of a well-defined energy model that can act as a real-world indoor vehicle. In [22], a simplified energy equation for a DDMR is derived in terms of the robot’s velocity vector. In [23], various motion profiles for automatic floor cleaning mobile robots are presented and their efficiency is discussed. However, a solid energy model is not yet presented. The work presented in [24] is the first step towards the construction of a realistic energetic model, but it does not include the losses within the DC motors. In addition, in [25], the design and efficiency mapping of an electric drive are investigated for a mobile robotic container platform used in industrial halls. However, it is based on a basic battery model that can negatively affect the accuracy of the energetic model.
This paper proposes an EMS for an SGV, by taking the FC size and battery pack degradation into account. In light of the above-discussed papers, modeling of energy sources (batteries and FC) is essential for the design of a hybrid powertrain, which is not thoroughly inspected in the literature. Therefore, a detailed model, including the vehicle dynamic, battery, FC, and motors, is developed in the first place. An appropriate energy model is worthwhile for tuning the EMS and component sizing, before the implementation in a real platform. By using a realistic energy model, it is possible to calculate how much energy is needed to work in a given path or for a specific period (e.g., during an 8 h working shift). Consequently, the range-extender capacity (required power and fuel tank capacity) can be sized by considering the available energy of the onboard battery and the EMS. Subsequently, an EMS composed of three modes is proposed for the studied SGV. The EMS between the battery and the secondary source (FC) might affect the battery lifespan and the overall energy efficiency of the hybrid DDMR. Hence, the objective of this study was the evaluation of the impact of the FC sizing and battery degradation on an industrial SGV to operate for an entire 8 h shift time.
The rest of this paper proceeds as follows. The project background, modeling, developed method, and EMS are described in Section 2. In Section 3, real-world tests are described; Section 4 presents the simulation results and their experimental validation by empirical data. Finally, the conclusions are drawn in Section 5.

2. Materials and Methods

2.1. Project Background

In this research, an industrial battery-powered SGV was considered as a case study for developing an FC/battery hybrid electric SGV (Figure 1) for warehouse applications. The driving speed was limited to 1.8 m s−1 to avoid dangerous collisions between the mobile vehicle and staff. The DDMR powertrain consists of the two electric motors with single-speed gearboxes for each driven wheel. The nominal power range of each motor was between zero and 180 W. In this context, the manufacturer neglects the regenerative braking system due to the low-speed application. Based on the experimental tests, the maximum operation time of the SGV without load was around 3.5 h at 1 m s−1 average speed. The SGV is equipped with two lasers sensors, two encoders, and an inertial measurement unit (IMU) for autonomous navigation. In addition, an onboard industrial computer was utilized to compute localization and navigation algorithms.
Different levels of modeling such as physical models, lookup table data, and efficiency maps were considered to model the battery pack, the FC, the electric machines, etc. Each model was based on the manufacturer’s datasheets and the experimental test results. The methodology for each component modeling is described in the following sections.

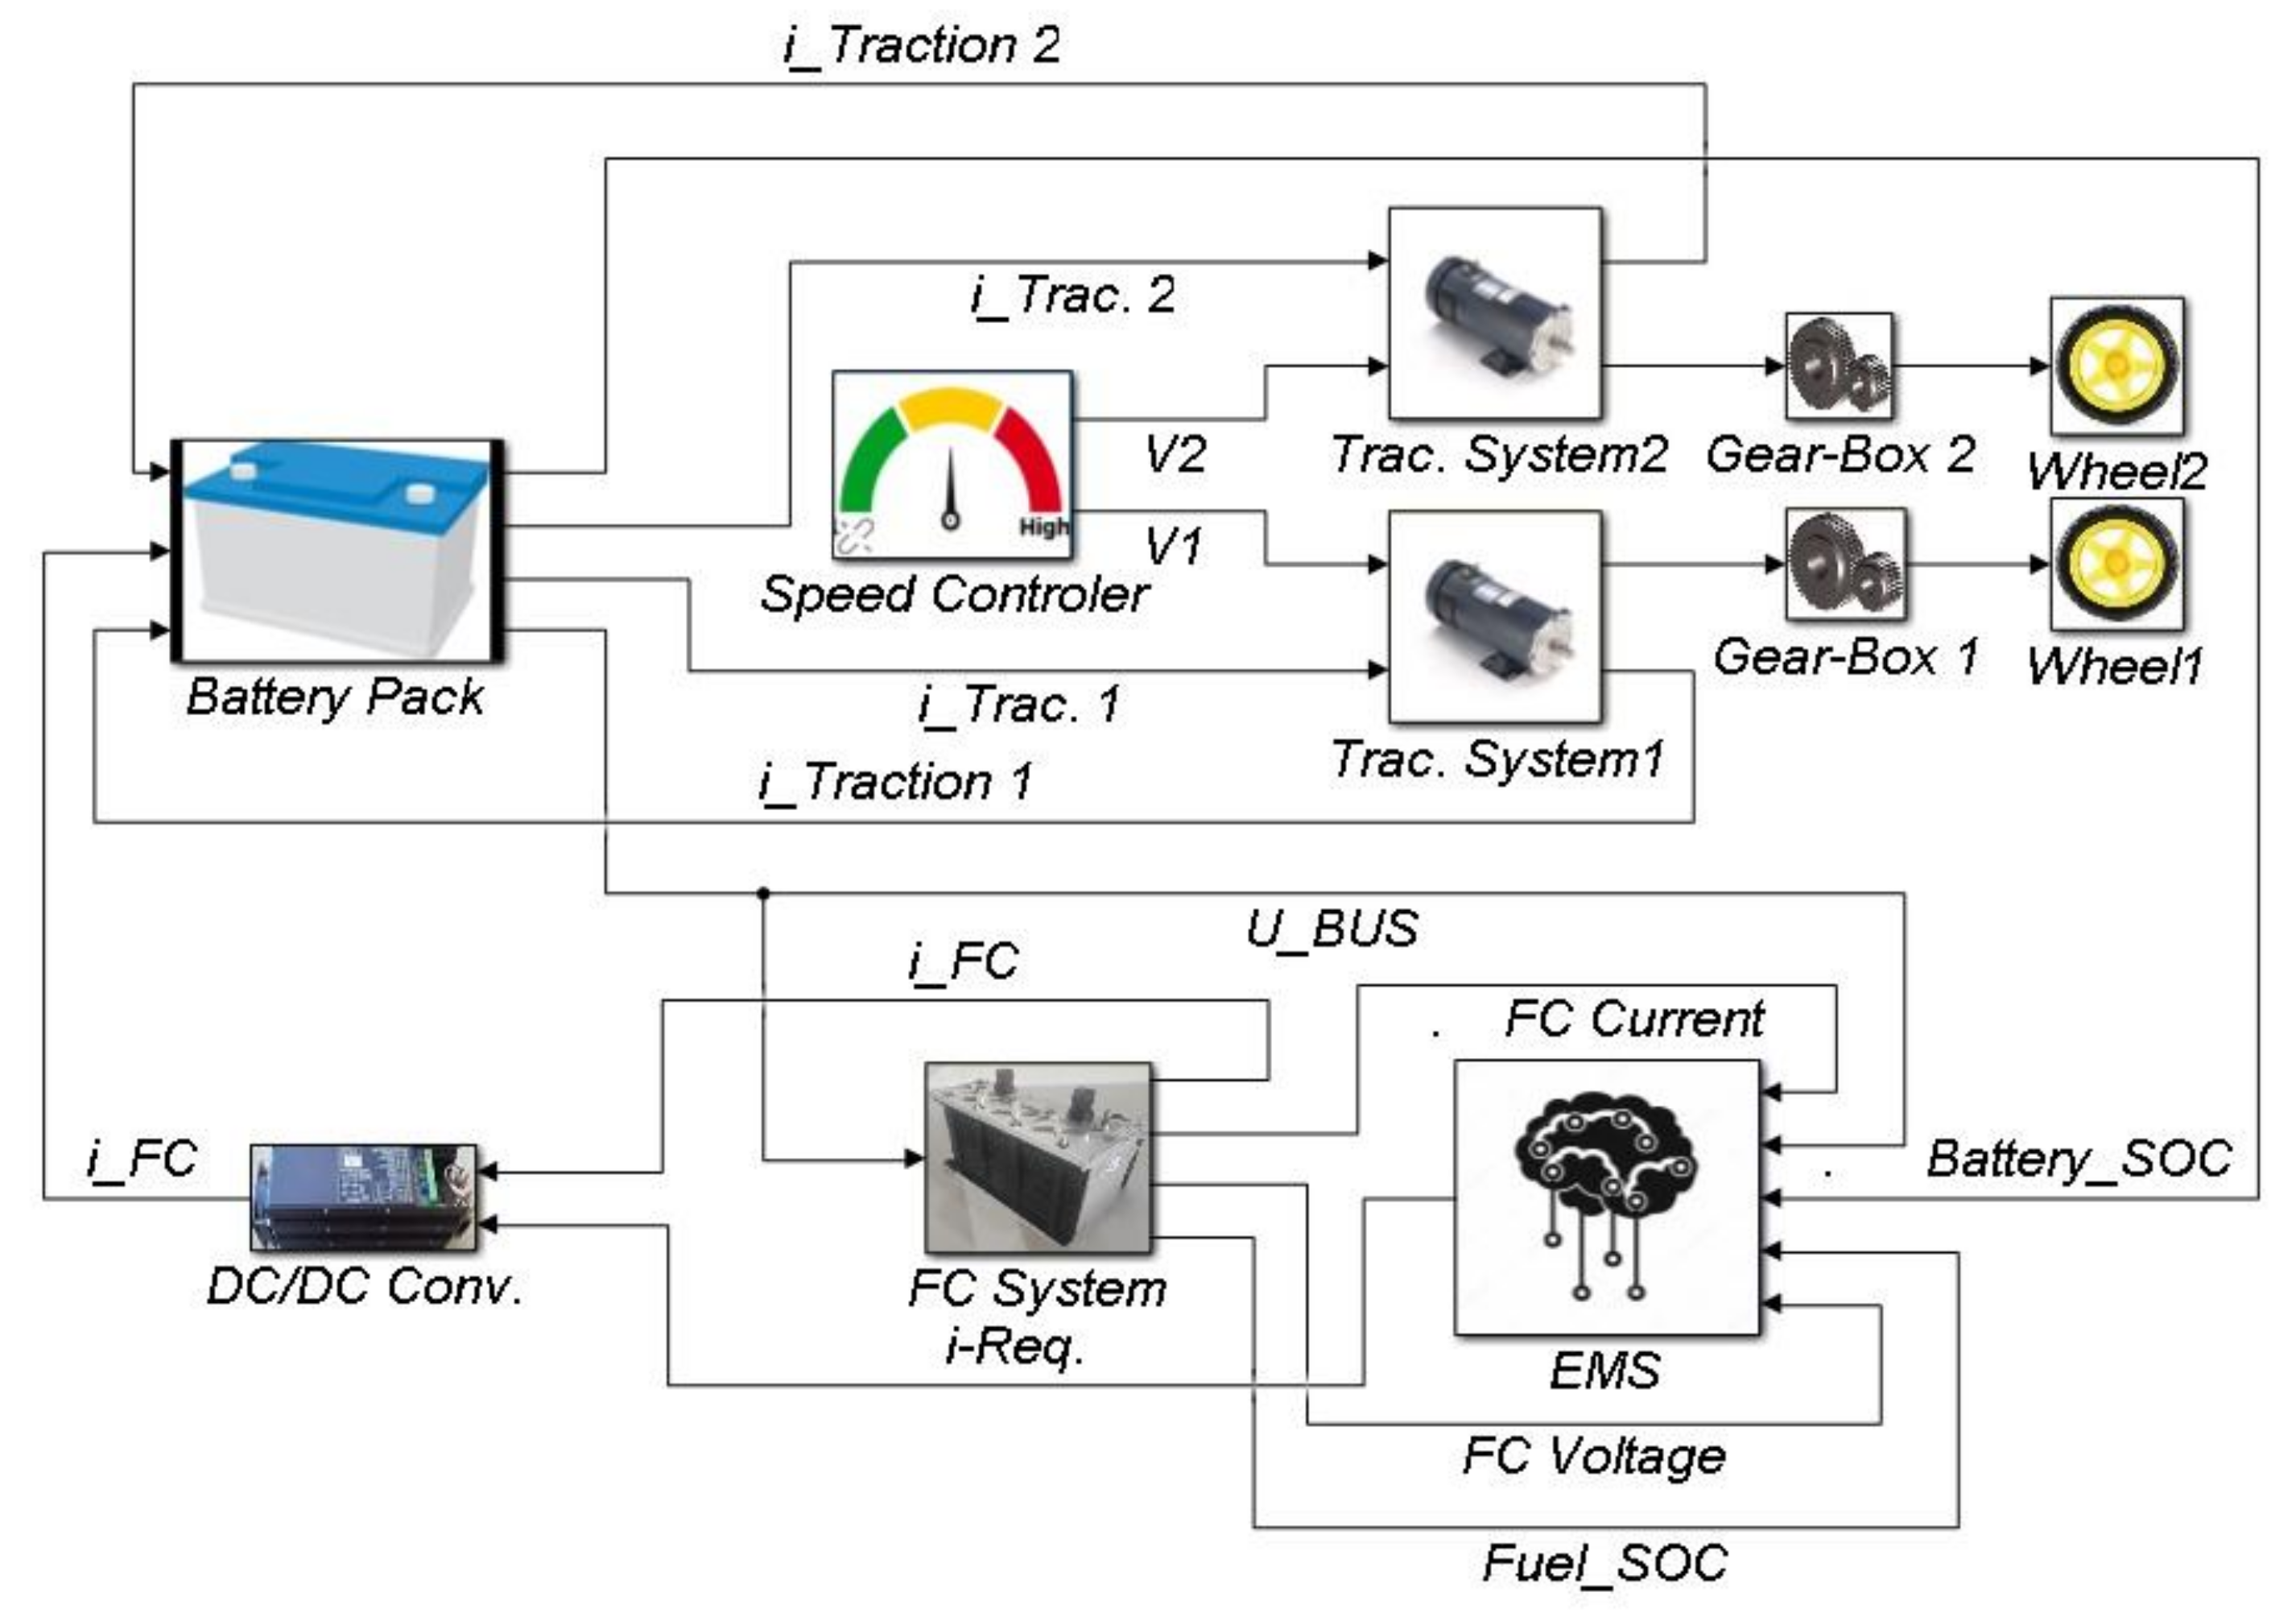
2.2. The DDMR Powertrain Modeling

Figure 2 shows a schematic view of DDMR with two drive wheels and four castors that were added for balance. Each drive wheel could independently be driven either forward or backward. Subsequently, the robot’s trajectories could be varied by applying different speeds on the drive wheels.
Regarding Figure 2, ωr and ωL present the rotational velocities of the right and left wheels, respectively, which were related to the linear v, and rotational ω velocities of the robot, by the following equations:
v =   R ω r +   ω l 2
ω =   R ω r   ω l L
where R represents the wheel’s radius, and L symbolizes the distance between the two wheels. The total energy consumption (ETot.) related to the DDMR motion could be formulated as the following equations:
ETot. = EKin. + Eroll + EOthers,
where EKin., Eroll, and EOthers denote the energy needed to overcome the kinetic, rolling resistance losses, and other accessories, such as sensors consumption energies, respectively. The kinetic energy equation was obtained by [24]:
E K i n . =   t 0 t f 1 2   m v t 2 +   1 2   I   ω t 2   d t
where v(t) and ω(t) represent the linear and angular velocities of the robot from initial time (t0) to a final time (tf), m is the robot mass, I signifies the moment of inertia of the robot. Rolling resistance, which is caused by the slight deformation of the ground or the wheels at the contact point with the ground, depends on the weight of the robot (m) and the coefficient of rolling friction (µ). The Eroll is expressed by:
E R o l l =   t 0 t f 1 2   μ   m   g   r ω R t + 1 2   μ   m   g   r ω L t   d t ,
In order to estimate the rolling resistance coefficient, the coast-down method is commonly used in vehicle applications [26]. According to this technique, the DC motors are disengaged from the wheels, then the robot is freely rolled with an initial velocity of 1 m s−1. The robot slowly comes to rest, which takes almost five seconds.
μ =   v i g t
where g represents gravity acceleration. Accordingly, µ is estimated to be 0.02, which makes sense, since the robot was moved on a flat cement surface.
In order to model the DDMR movement, an equivalent total mass Mtot (mass of the vehicle and the equivalent mass of the rotating parts) was considered. The vehicle velocity vev was obtained using Newton’s second law of motion, with the traction and resistive forces, Ftr and Fres:
M t o t .   d d t   v e v =   F t r   F r e s
F r e s = C r o l l M t o t . g   c o s   α + 0.5   ρ   C d   A   v e v +   v w   +   M t o t .   g   s i n   α
where Croll denotes the rolling resistance coefficient, g is the acceleration due to gravity, α is the slope angle, Cd is the air drag coefficient, A represents the frontal area of the vehicle. However, the air drag coefficient and wind velocity (vw) are considered to be zero due to the low-speed indoor application of the DDMR. The main parameters of the case study DDMR are listed in Table 1. These parameters were defined based on experimental tests and components datasheet from the manufacturer. Furthermore, the main subsystem models of the hybrid DDMR are described in the following sections.
The total efficiency (ηtot) of the DDMR powertrain could be calculated as the ratio between the total net kinematic energy (EKin.) from Equation (4) and the vehicle total energy (ETot.) from Equation (3). Thus, the ηTot is expressed as follows:
η t o t =   E K i n . E T o t .   × 100

2.3. Traction Subsystem

In the case of the DDMR, there are two similar motors that were independently modeled in the current study. Considering the speed (vev) and the required traction force (Ftr), the vehicle requested power (Pm) from the electric motor side could be expressed as:
P m =   F t r   v e v η m η t ,
where ηm and ηt denote the motor and transmission efficiency, respectively. For simplification purposes, a static model was considered for the traction subsystem, according to the efficiency map. The electric machines and power electronic components, such as converters and motor drives, were modeled based on the experimental lookup table data provided by the manufacturer. The look-up table determined the electric motor torque, speed, and related efficiency.
Demanded current (ITS) by the traction system was related to the traction force Ftr from the wheels speed (vwheel), which could be derived from the following expression:
I T S =   F t r   v w h e e l   V B a t t .   η t r k   W i t h   k   = 1   i f   P t r > 0 1   i f   P t r < 0
where VBatt. and ηtr denote battery voltage and traction system efficiency, respectively. k is the coefficient that is influenced by traction power depending on the vehicle acceleration or deceleration.

2.4. Energy Storage Subsystem (Battery)

SOC is one of the most important battery parameters. This parameter needs to be carefully monitored to avoid damaging the battery pack, owing to overcharging/discharging. Several studies were done to estimate the battery SOC level [27,28,29]. Among the various methods, coulomb counting based on current integration remains one of the most commonly used methods, due to its reasonable accuracy and implementation simplicity [28,30]. The SOC of the battery (SOCBatt.) was calculated by the following expression:
S O C B a t t = S O C I n i t .   100 3600   Q B a t t .   0 t I B a t t .   d t
where SOCInit. is the initial SOC of the battery, QBatt. and IBatt. denote battery capacity and currents, respectively.
The battery was modeled using an open-circuit voltage VOC with a series resistance (RS), and a parallel combination of resistance capacitance (Rc Cc), as presented by the following equation [31].
I B a t t . =   V O C   R S . I B a t t .   V B a t t . R C +   C c   d d t   V O C R S I B a t t .   V B a t t .
Battery total power (PBatt.) was determined by using resistance (RBatt.) and open-circuit voltage (VOC) from the following equation [32]:
P B a t t . =   V O C . I B a t .   I B a t . 2   .   R B a t t .
According to a recent research on battery degradation, reported in reference [5], the SOH level of a lithium-ion battery reached a low of 75 percent after 1500 charging and discharging cycles at standard conditions. Therefore, a battery degradation model from [5] was considered to be a typical reference for the battery SOH level in this study. A summary of battery specifications is listed in Table 2.

2.5. Fuel Cell as Range Extender

The FC is considered to be a voltage source, using its static polarization curve, based on a semi-empirical model that was developed by Squadrito et al. [34]. The cell voltage (Vcell) was determined by subtracting activation ( ξ a c t . ), Ohmic ( ξ O h m . ), and concentration ( ξ c o n c . ) overvoltage from the reversible cell potential ( E n e r n s t ). The detailed explanation of the PEMFC model could be found in [35]:
V F C =   E n e r n s t   ξ a c t   ξ o h m     ξ c o n c
V F C =   V 0 b l o g i f c   r i f c + α   i f c k   l o g 1 β i f c  
where V0 denotes the thermodynamic voltage of the FC. The activation overvoltage is the sum of the cathode and anode overvoltage presented by blog (ifc). The Ohmic overvoltage, indicated by rifc, is characterized as the resistance of the membrane and the electrodes. It mainly depends on the resistance of the internal membrane (r) and the FC current. The concentration overvoltage occurs when the FC is faced with a high current density. α and k variables are the parameters related to the diffusion process and the dimensionless number related to the phenomenon of water flooding, respectively. β is the inverse of the limiting density current [35]. In addition, a static characteristic represents the hydrogen (H2) mass flow versus the current linear function that describes the FC system consumption. The hydrogen flow was determined on the basis of experimental data, by a first-order function approximation, where a and b represent fitting parameters [36].
m ˙ H 2 = a + b i f c
In order to take into account the added onboard energy source, the SOC of the H2 tank (SOCTank) was calculated by the following equation:
S O C   T a n k =   m H 2 i n i t   m ˙ H 2 i f c m H 2 i n i t
where mH2-init is the initial mass of H2 [g], m ˙ H2 is the H2 mass flow [g s−1], and ifc is the FC current. H2 consumption is supposed to have a constant rate when the FC is turned ON. The FC system is composed of the DC–DC converter, a smoothing inductor, and a boost chopper for its current control [37]. Nevertheless, their energetic performances are included in the FC static characteristics. The following equations are used for the converter unit model:
L d d t   I f c =   V f c   V h f c   r L I f c
V h f c =   m h f c V b a t I h f c =   m h f c I f c   η h f c   W i t h   k   = 1   i f   P > 0 1   i f   P < 0
where L is the converter inductance, Vfc is the output voltage of FC, Vhfc is the input voltage in the chopper, rL is the converter resistance, mhfc is the modulation ratio, and ηhfc = 95% is the average efficiency of the converter.
The power of the FC (PFC) as a range extender could be computed from the H2 lower heating value (LHVH2), as follows:
P F C = L H V H 2   .   m ˙ H 2   .   η F C
It should be noted that the SGV system has other components such as onboard electronics, sensors, microcontrollers, which are the accessory parts of the hybrid SGV powertrain. These components are extremely efficient nowadays, but they still consume a portion of the battery’s current. Therefore, the current loss due to the electronics was presented as IOthers.
The Kirchhoff’s current law used to model the parallel connection between the battery pack, traction motors (ITS), FC (IFC), and IOthers is given by Equation (22):
IBatt. = ITS − IFC + IOthers

2.6. Energy Management Strategy (EMS)

An EMS with three modes of operation is proposed in this study (Figure 3). The first mode is known as charge-sustaining (CS), which maintains the battery SOC at the desired level such that the FC starts to supply its maximum power when the battery SOC drops to the minimum threshold of 40%. For the second mode, called charge-depleting (CD), the battery is the main power source until the FC starts providing its maximum power as the battery SOC reaches its minimum threshold (20%). The third mode is called charge-blending (CB), which emphasizes the FC efficiency by turning ON the FC when the battery SOC reaches the threshold value of 60%. For the CB mode, the FC supplies constant power corresponding to its maximum efficiency. For the three modes, the FC is turned OFF when the battery SOC reaches 85%. Since each strategy employs the FC within a certain range, it is important to size energy resources appropriately, to avoid energy shortages. The following design considerations are established for the proposed EMS:
(a) According to [38], the minimum battery degradation can be achieved if the SOC is maintained over 40%.
(b) When the SOCTank is less than 10%, the tank does not have enough pressure to provide H2 to the FC.
A MATLAB Simulink (Version 2017, MathWorks company, Massachusetts, USA) model was developed to present the mathematical models of the different SGV components. The MATLAB Simulink model, presented in Figure 4, includes the different subsystems such as the SGV powertrain, traction system, battery pack, fuel cell, and energy management strategies.

3. Experimental Tests

Figure 5 presents the studied SGV. For measuring the actual required power and energy consumption, the SGV was moved using different velocity profiles, including the pure transition in the X-direction, forward and backward, trapezoid speed profile, circular movement, and rotation around the center of gravity, as demonstrated in Table 3.
Each motion test was conducted for 11 s and repeated three times in the same condition at flat cement surface. In addition, each experiment included three sections, acceleration from stationary, constant velocities, and deceleration to stationary. For example, in the trapezoidal velocity profile scenario, maximum linear velocity was considered to be 1.4 m s−1, to achieve the high efficiency of the electric motors. Similarly, the average linear acceleration from rest to maximum speed and vice versa was adjusted to 0.7 m s−2, to prevent high mechanical and electrical stresses. The maximum linear acceleration for forward, backward, and circular pathway were fixed to 0.9 m s−2.
Moreover, in the industrial environment, the SGVs were usually employed in stop-and-go loop working conditions. Therefore, a typical pathway was designed by considering the mixture of transitional and rotational movements, as shown in Figure 6. Measured data from this pathway was used to evaluate the SGV model. In this context, the battery voltage and current, motor power, and the velocity of the wheels were recorded by the developed data logger with a 0.1 s sample rate.

4. Result and Discussions

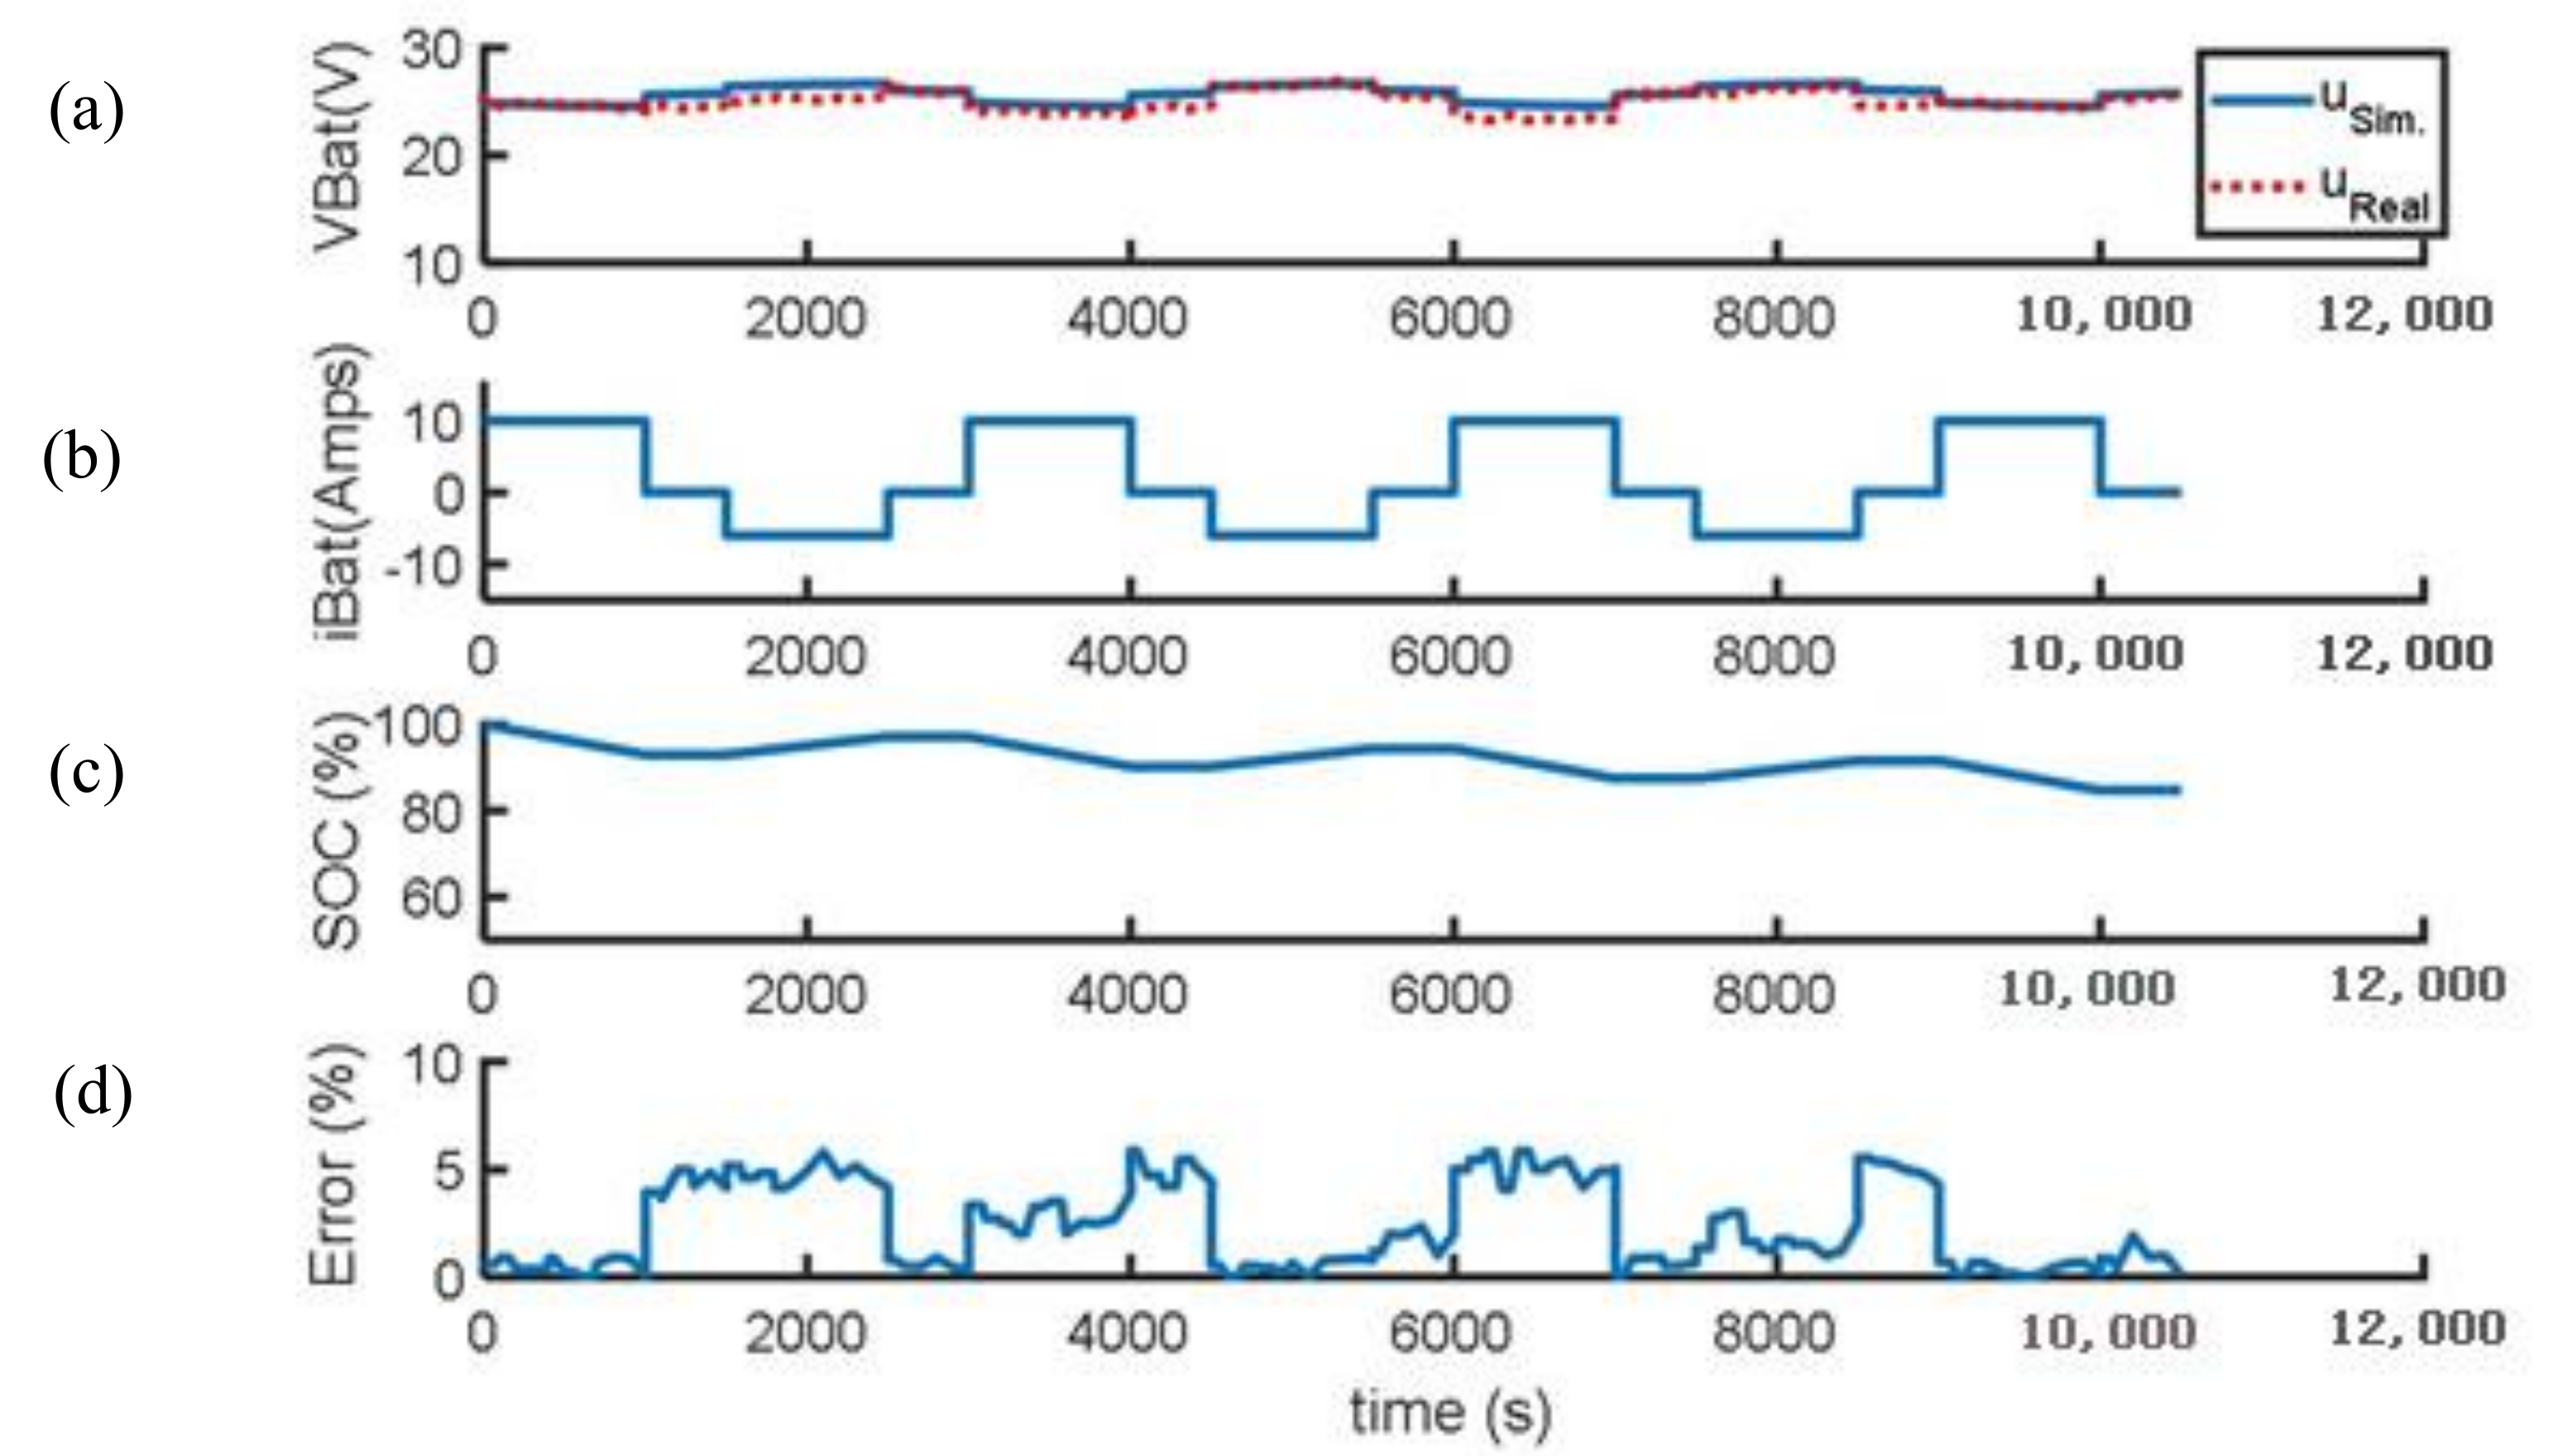
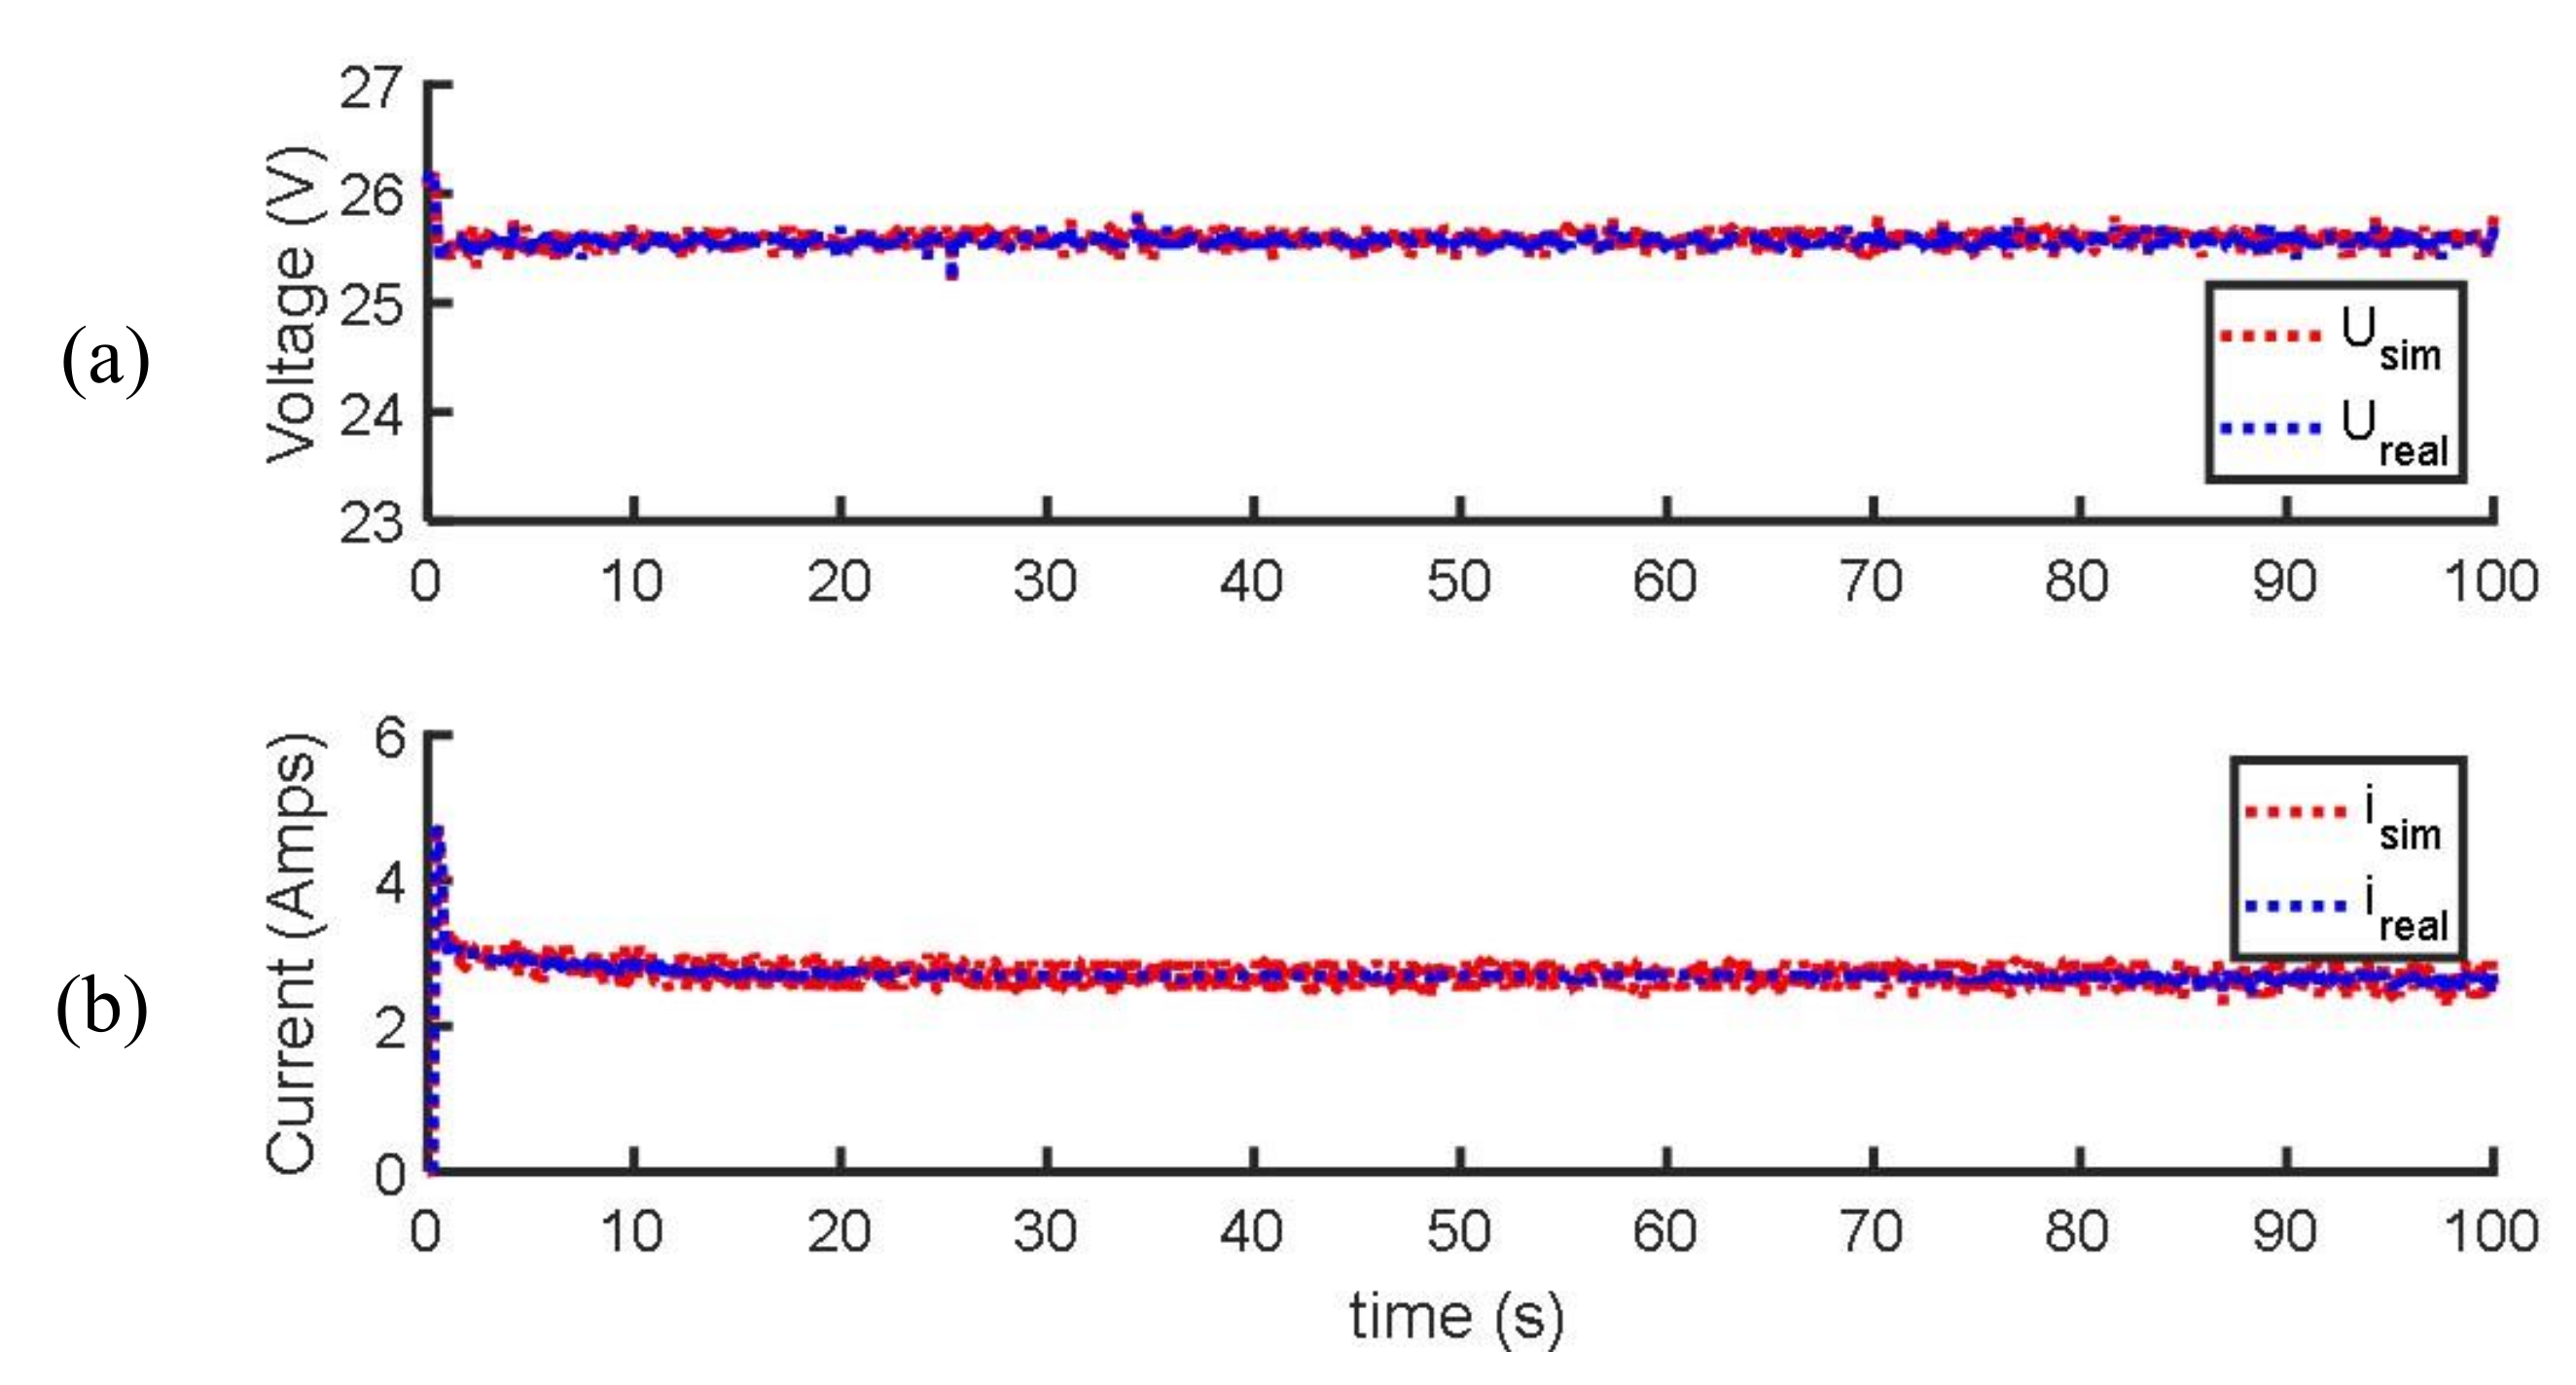
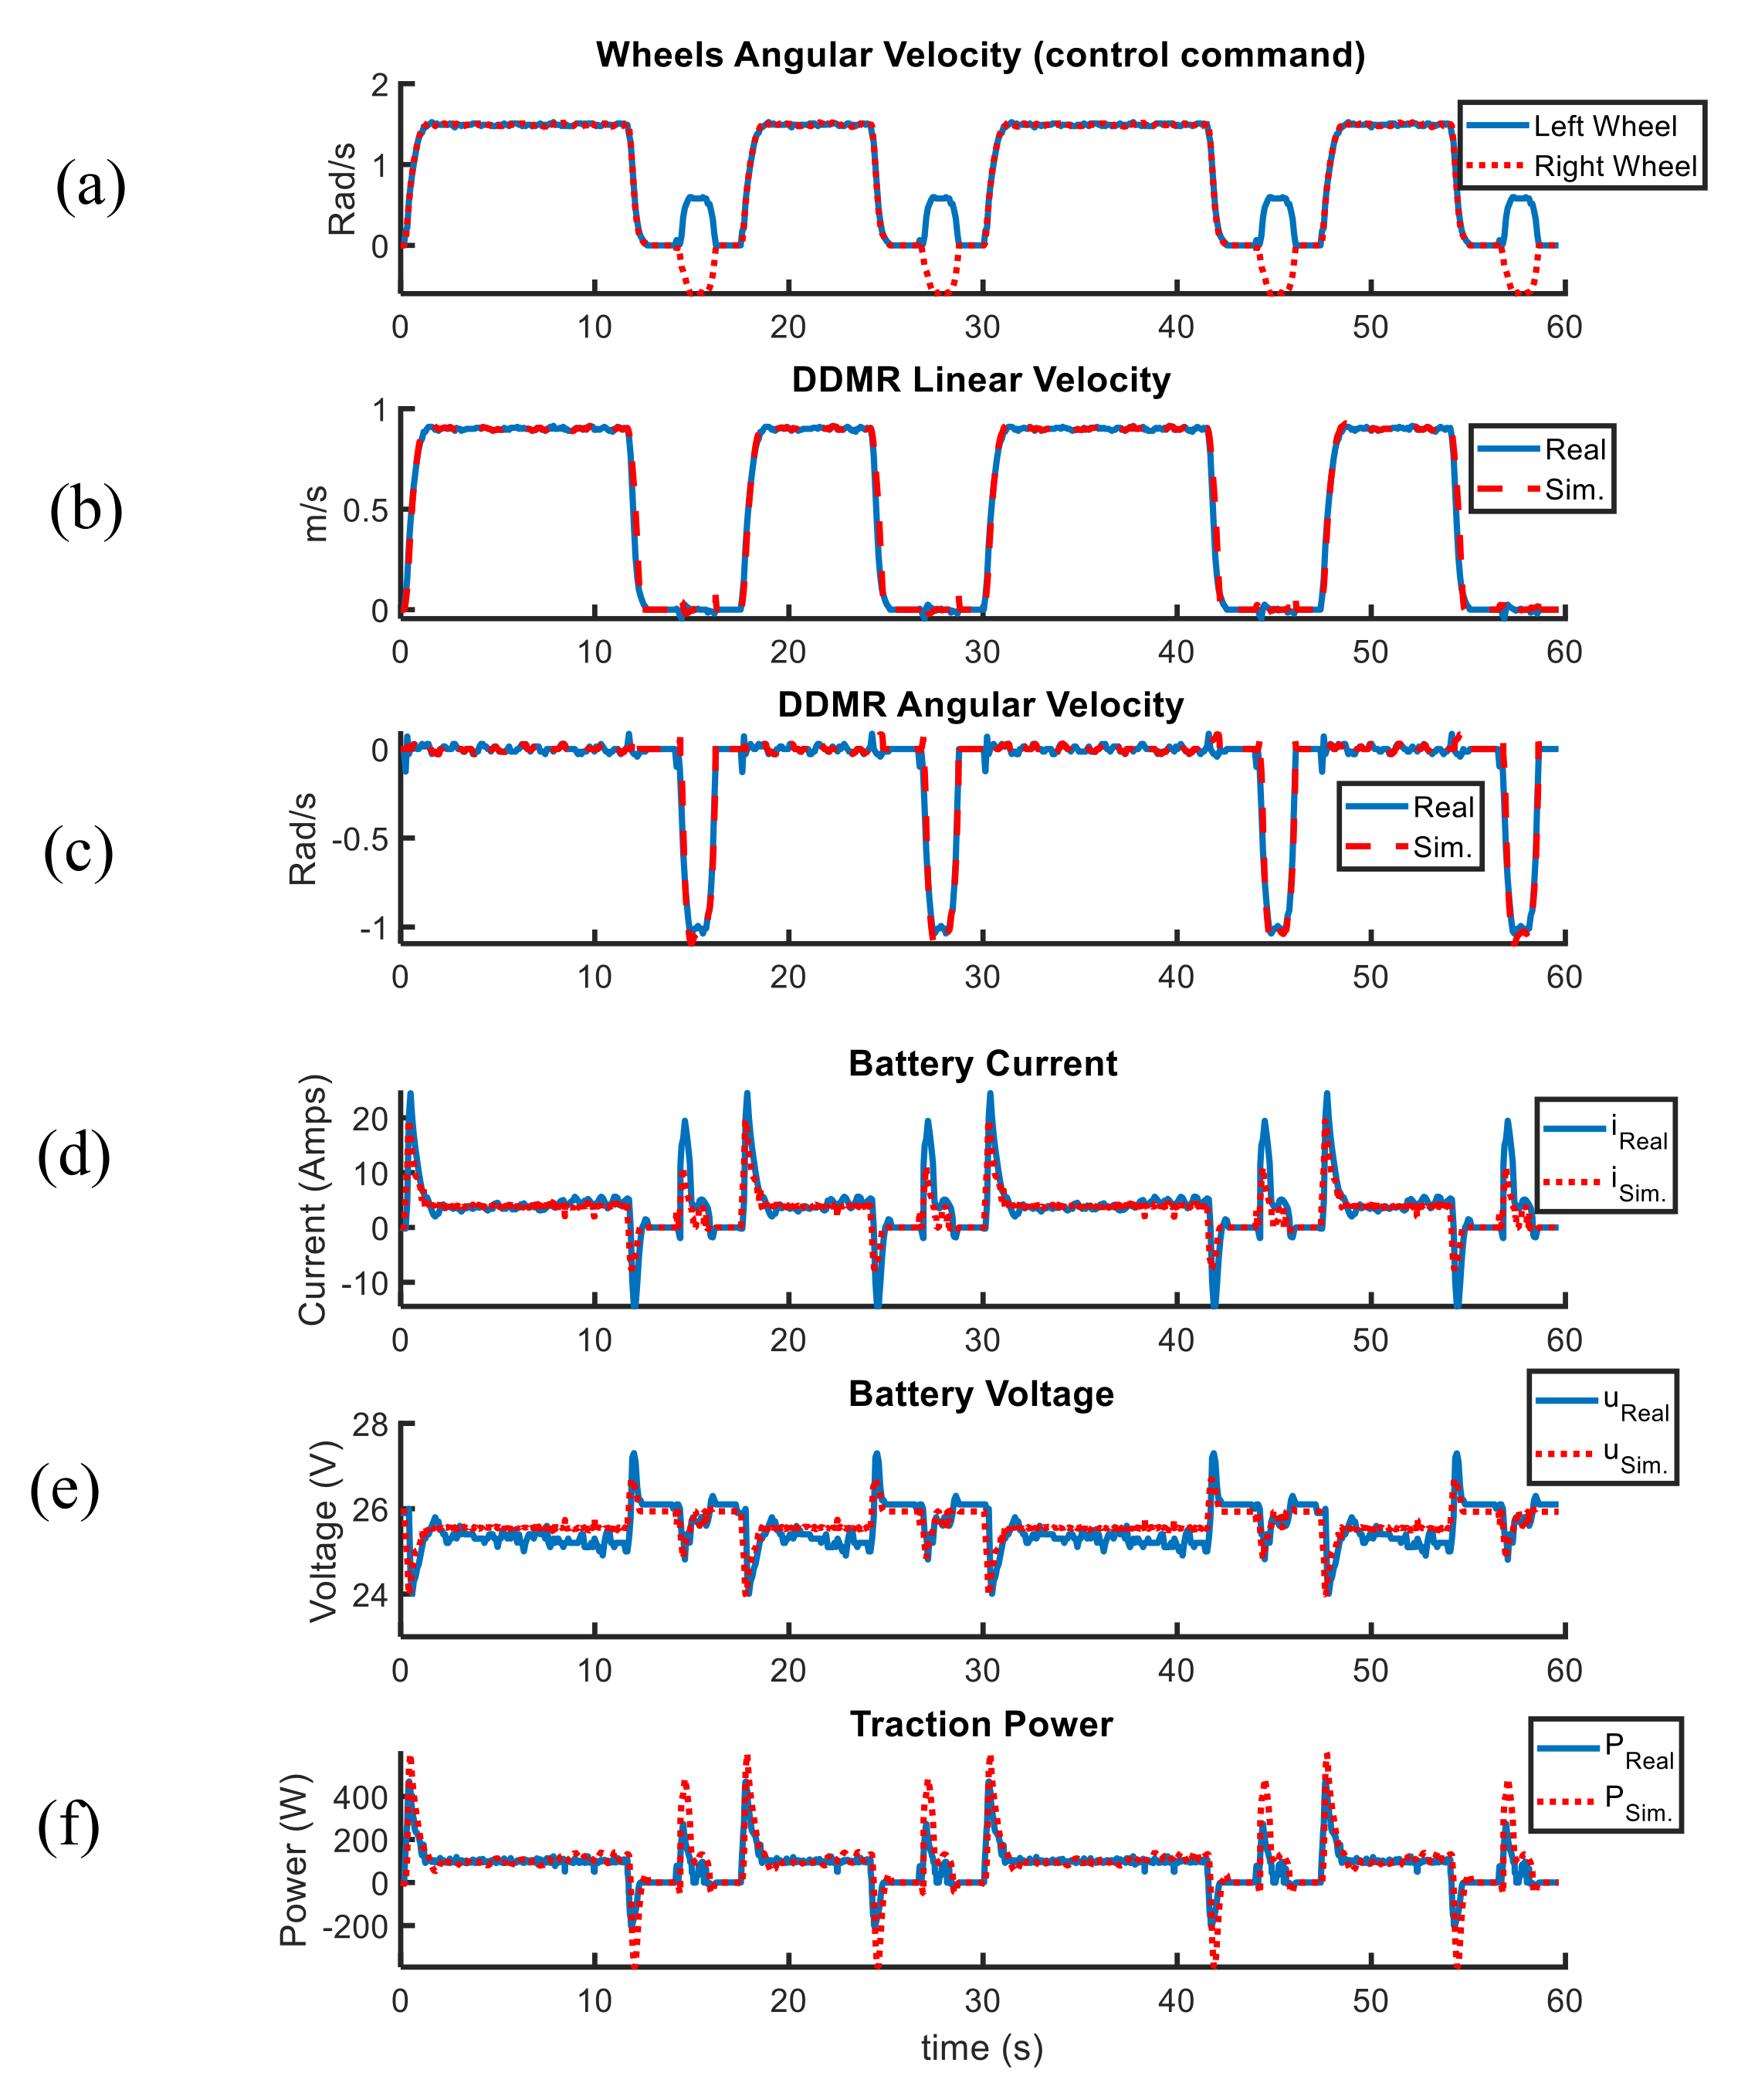
4.1. Model Validation

The proposed FC model was experimentally validated in our previous work [36,39,40]. The performance of the Squadrito model was thoroughly investigated with regards to the estimation of the polarization curve for different FCs, under various operating temperatures [36]. A current profile was applied to the FCs, and the measured data (current, temperature, and voltage) were transferred to an online identification algorithm to tune the parameters of the models in real-time, by minimizing the error between the estimated voltage and the measured one. Once the parameters of the model were estimated, the model was used for predicting the polarization curve of the stack. The conducted study showed that the proposed semi-empirical FC model was accurate regarding the polarization curve prediction for different nominal power FC in the above and below zero temperature conditions [36,39].
In order to validate the dynamic battery model, a test bench was developed at the UQTR Hydrogen Research Institute (Figure 7). The test bench was composed mainly of a 24 V Lithium battery. The charging/discharging process and the acquisition of data (temperature, current, voltage) were performed through an embedded computer NI CompactRIO 9022 (Version 2017, National Instruments, Texas, USA). A charger and a programmable load were used in order to charge and discharge the battery. The battery being tested was placed inside an environmental chamber, which was used to set the ambient temperature.
The proposed test bench was used to validate the dynamic battery model by comparing experimental and simulation results during the charging and discharging process. Figure 8 presents battery voltage, charging/discharging current, battery SOC, and error between experimental and simulation data. Results showed that the proposed battery model was accurate regarding the charging and discharging curves.
To evaluate the overall SGV model, a comparative study was performed between the simulation results and the extracted experimental data. In a first step, the SGV was tested without a load while the wheels were off the ground. The experimental data and simulation results are shown in Figure 9. Figure 9a compares the battery voltage from the real-world test and simulation, and Figure 9b compares the consumed current by the motors. These results confirmed a good synergy between the energy storage system model and the real battery-powered SGV performance.
Table 4 presents the experimental and simulation results for the different proposed motion (trapezoid, backward, forward, rotation around the center, and circular pathway). Table 4 shows that the average requested power, maximum demanded power, consumed energy, and average efficiency calculated by the SGV energetic model agreed with the experimental results. Consequently, the highest requested power (509.5 W) was obtained for the backward and forward movements caused by the high acceleration rate of 0.9 m s−2. However, the lowest requested power (235.1 W) was obtained for the trapezoid movement scenario, which was due to the low acceleration rate. Therefore, the acceleration rate affected the requested power and subsequently the size of the energy source.
On the other hand, the highest energy consumption (1.159 Wh) was related to the circular movement, compared to the trapezoid movement scenario with the lowest energy consumption (0.282 Wh), which might happen because of the combined transitional and rotational movements and variation of electric motors’ efficiency in different speeds. The comparison of results between the rotation around the center of gravity and the transitional movements showed that the rotational movement required almost two times more average power than the transitional one. From these results, it could be concluded that the use of the SGV in the range of the operating speed with the maximum efficiency of the electric motors is important. It also highlights the importance of component sizing and optimal path planning of the SGV, which can affect the overall efficiency of the energy system. Hence, it is important to provide a practical working cycle to estimate the required energy and power for selecting an appropriate FC range extender.

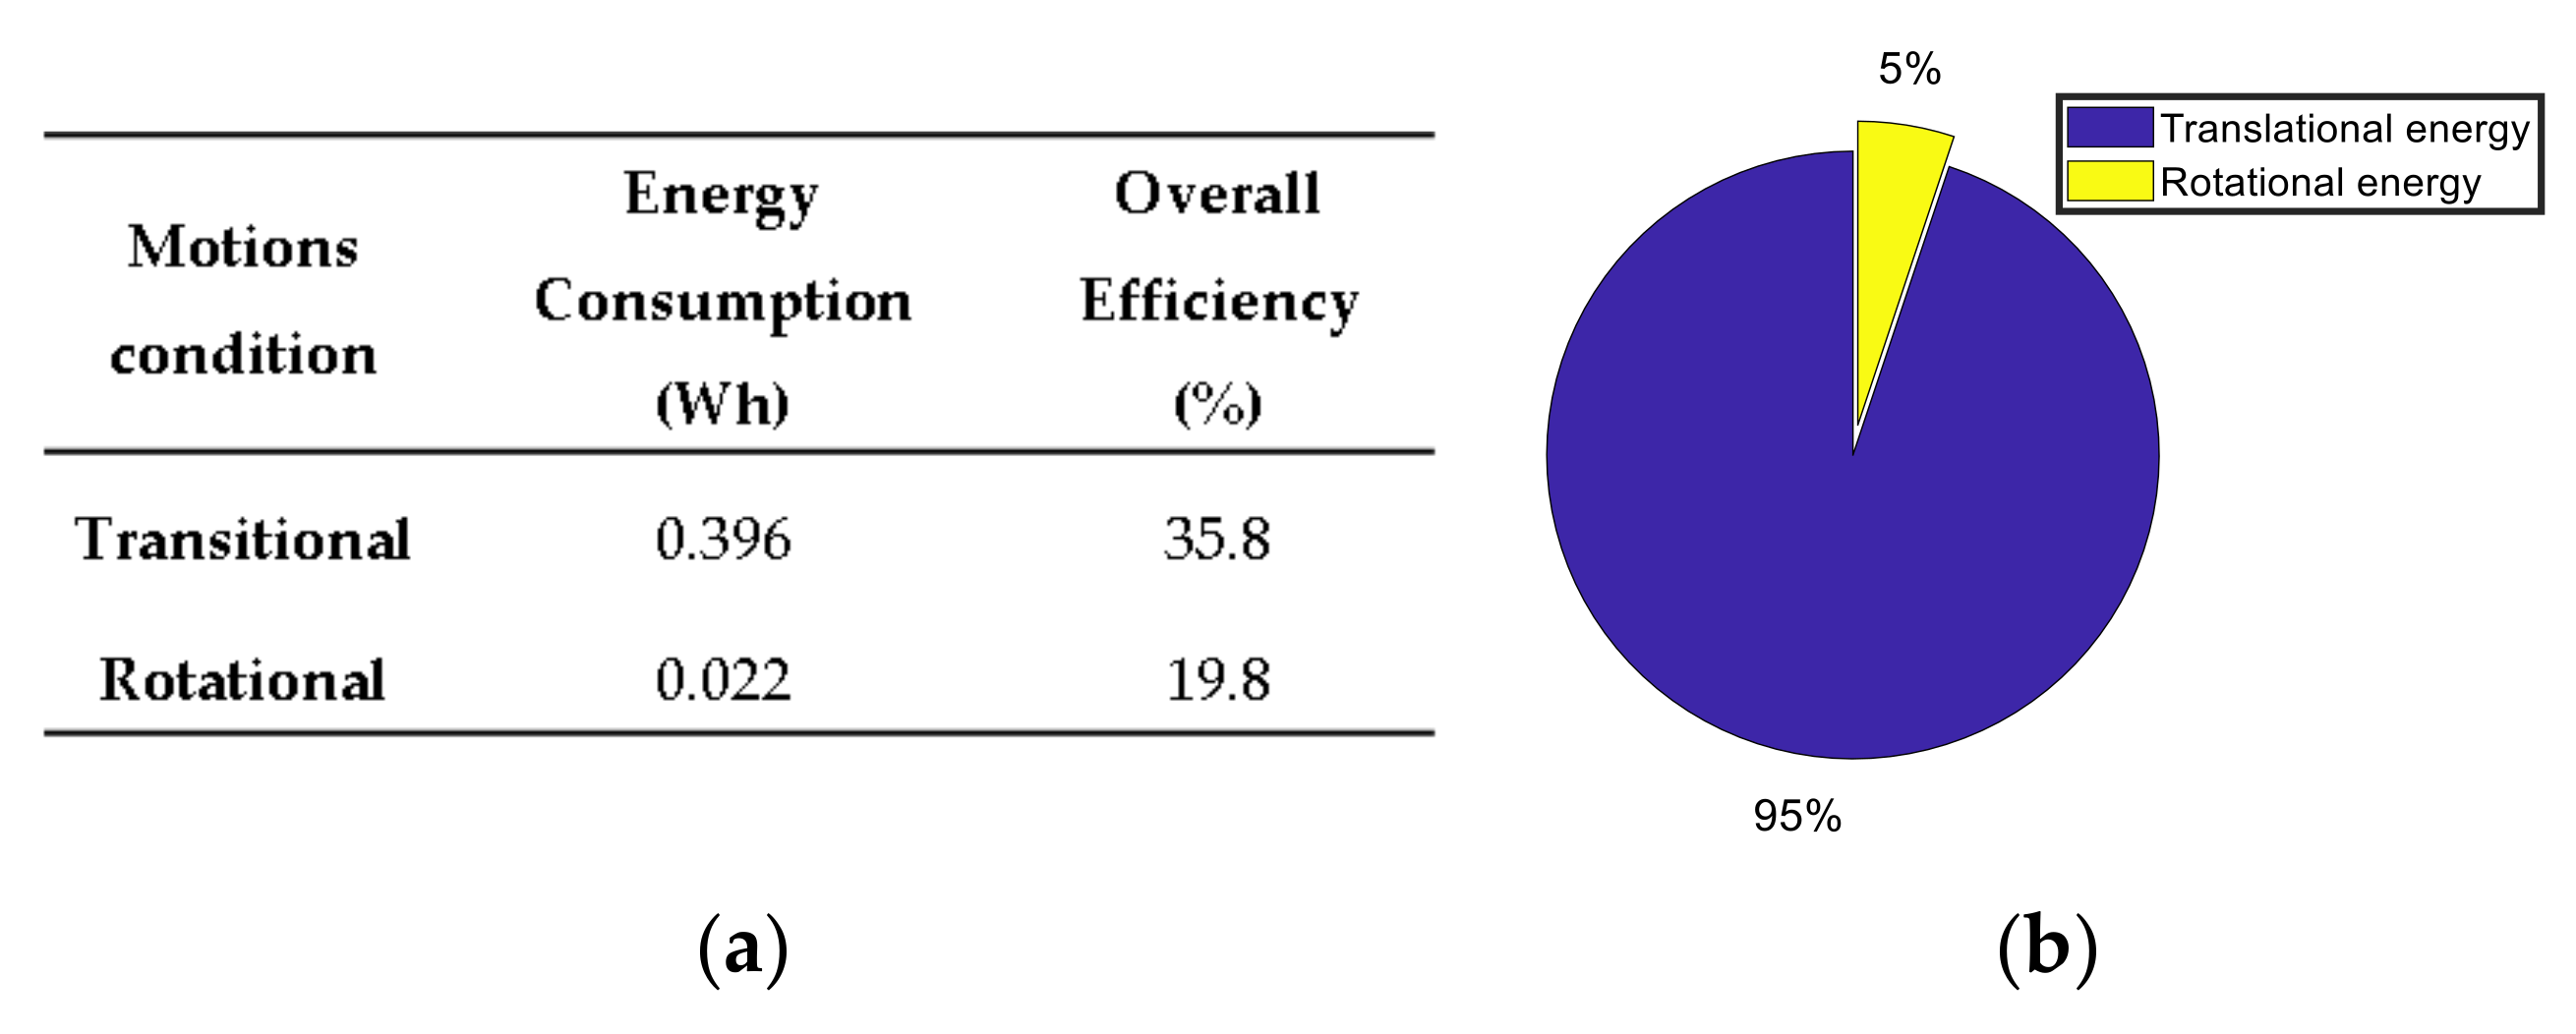
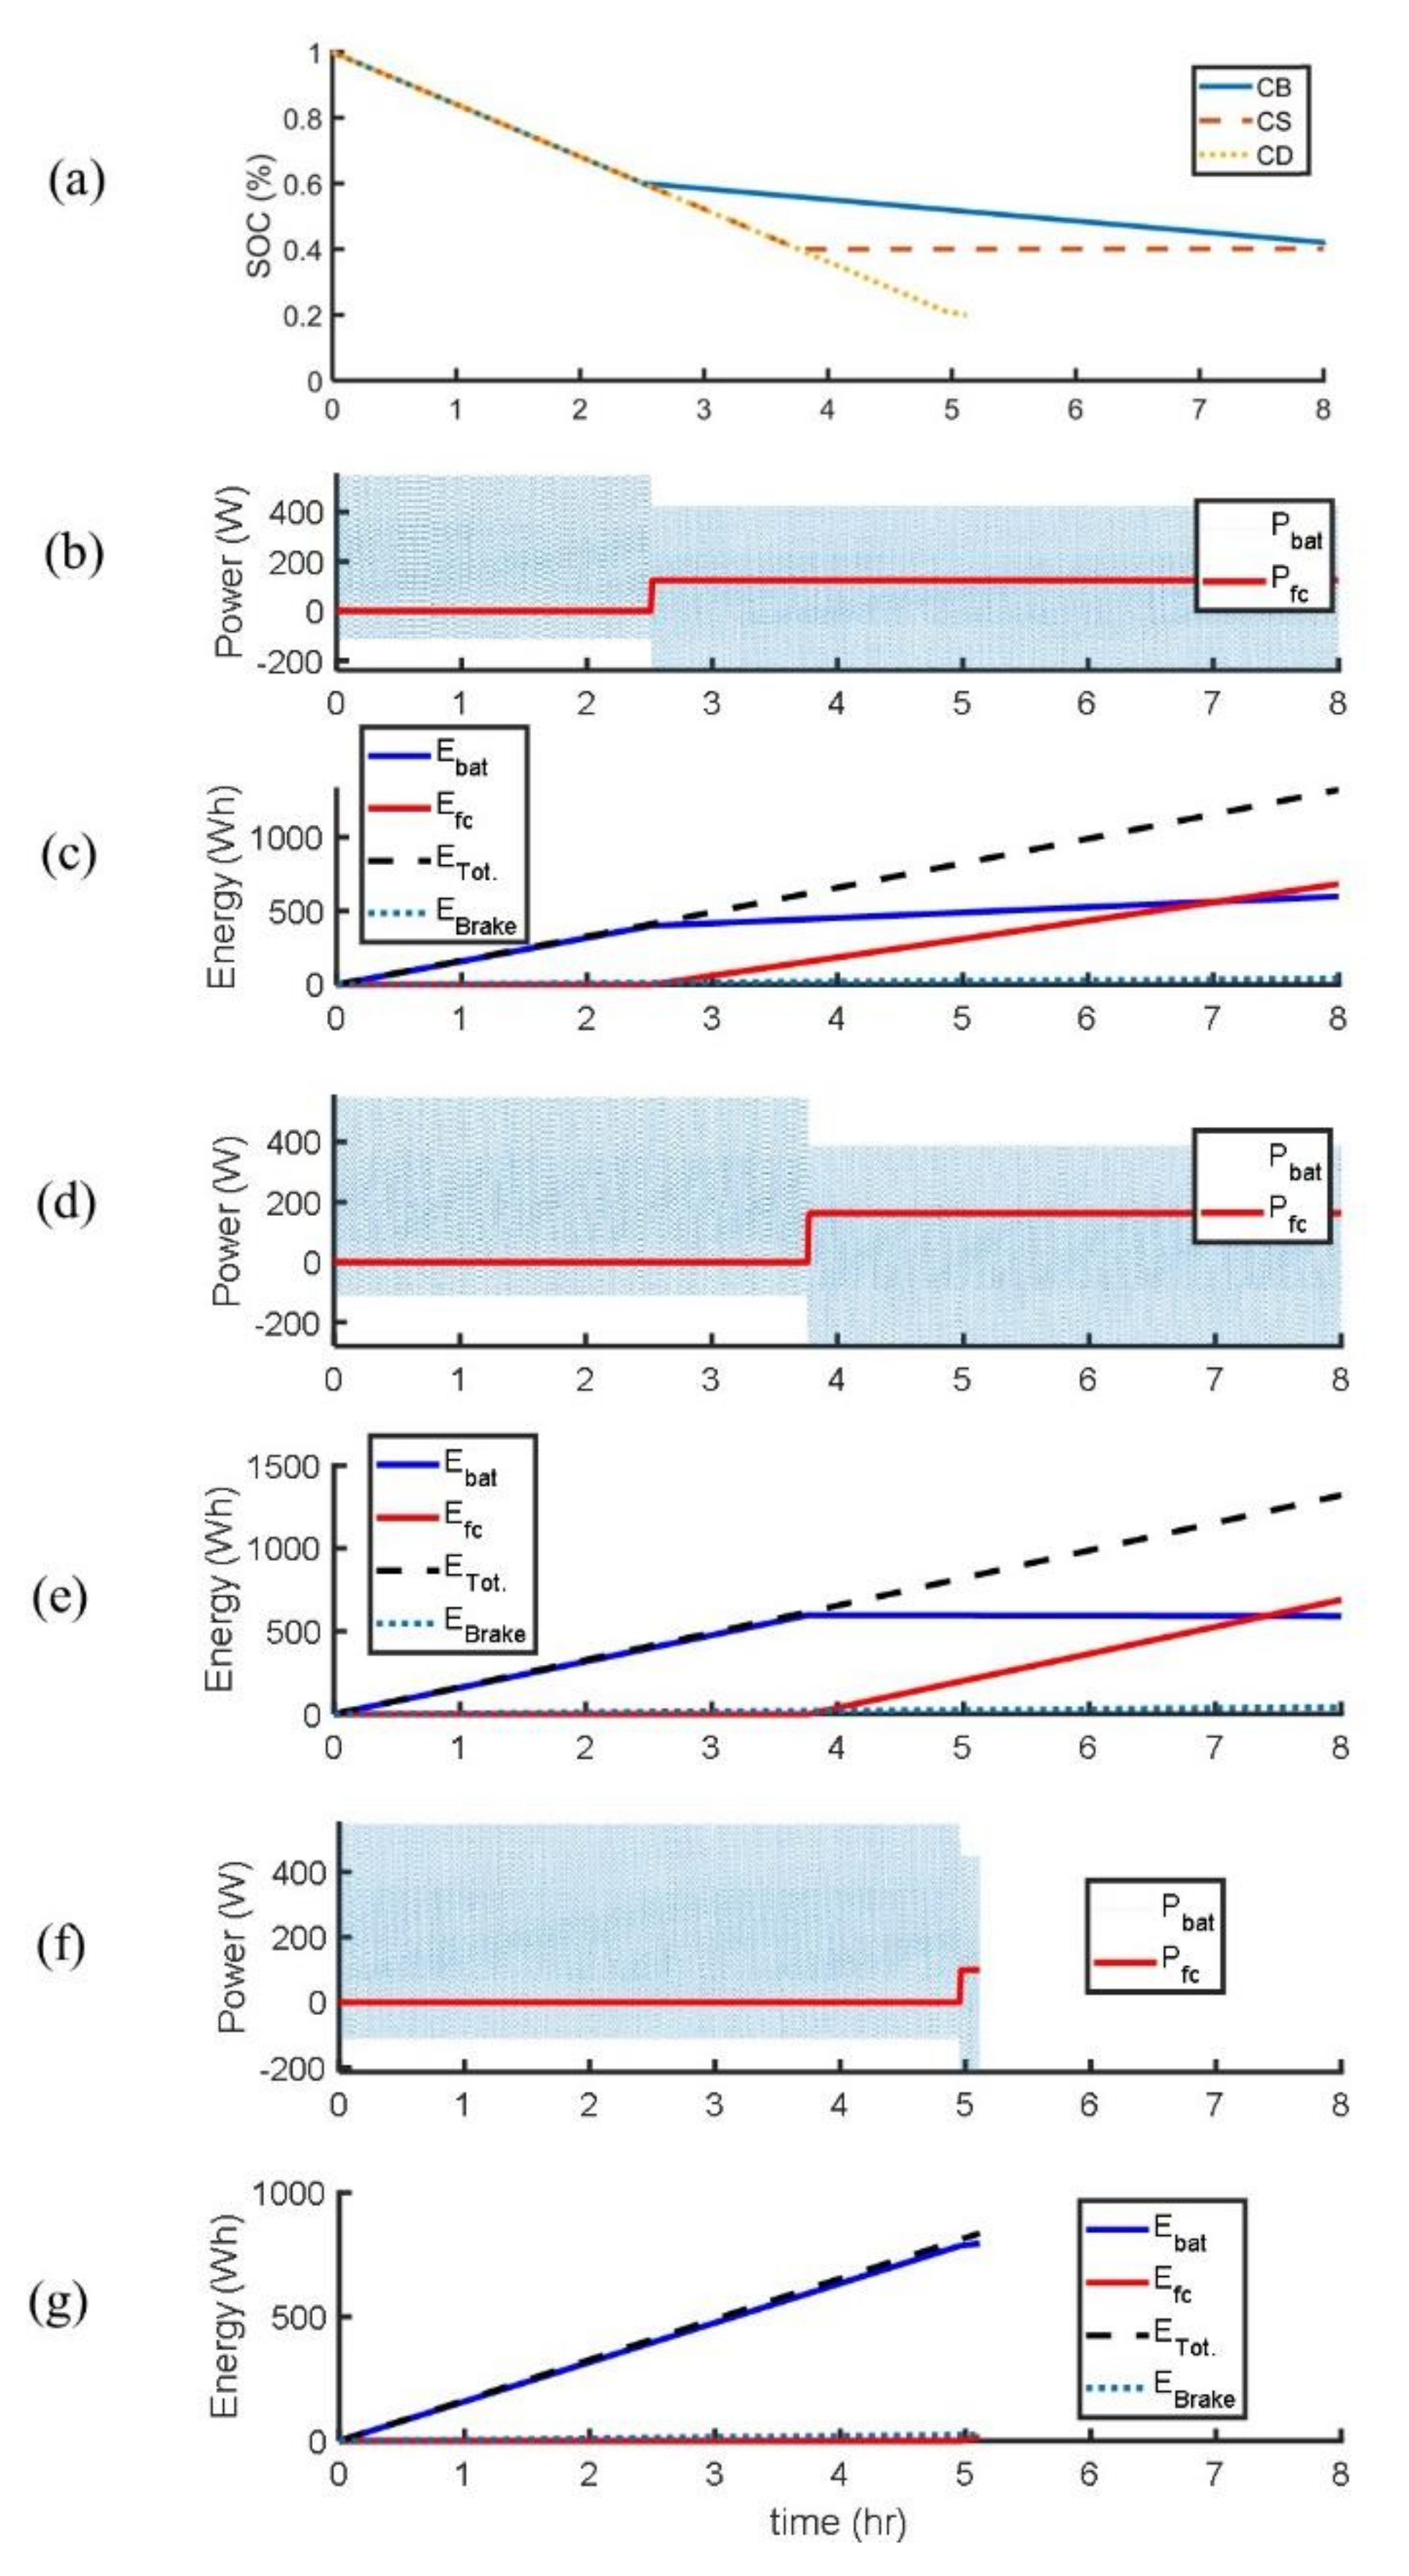
4.2. Mixed Working Cycle Analysis

In order to evaluate the performance of the SGV in a more realistic condition, the mixed working cycle was analyzed in this section. The measured wheel speed from the experiment, which was used as input of the SGV model, is shown in Figure 10a. In this regard, the linear velocity and the angular speed, battery voltage, battery current, and traction power of the developed model of the vehicle were compared to the experimental results, as shown in Figure 10b–f. Hence, the validity of the developed model was investigated by an adequate accuracy between the measured values and the simulation results.
Furthermore, the traction power from the experimental working cycle (Figure 10f) showed that the power peak (+470 W) was reached during acceleration from 0 to 0.9 m s−1, while the average requested power was around 160 W. In fact, the demanded power of the SGV to accelerate from 0 to 0.9 m s−1 mainly corresponded to the high starting currents by the electric motors. It was obvious that due to acceleration, the maximum required current (+23 Amps) was obtained in the bingeing, which was around five times higher than the constant speed. Moreover, in the brake mode, a reverse current was generated (sent back to the battery), which might be wasted if it was higher than the battery charging current (Table 2). Therefore, the movement pattern (stop and go) could affect the powertrain efficiency of the SGV. As a result, considering the minimum stop and go situation along with appropriate acceleration and deceleration rate, is recommended, to decrease SGV power requirement while designing the working cycle for an industrial application.
Furthermore, Figure 11 illustrates the comparison results between the transitional and rotational movement of the mixed work cycles. Figure 11a,b show that the amount of 0.396 Wh (94,73%) and 0.022 Wh (5.26%) were consumed for the transitional and rotational movements, respectively. It was found that a significant portion of the vehicle’s stored energy was spent for one working cycle with only 360-degree rotational movement. The rotational movement might be increased in crowded working environments where humans and SGVs work together. In fact, the vehicle will need more alternate rotation and stop-and-go mode to avoid obstacles, by finding an appropriate path to reach the desired position. It is important to note that the overall rotational efficiency was around 20% compared to 33% of transitional motion (Figure 11a). Therefore, in order to increase the system’s overall autonomy, it was important to minimize SGV rotational motion.
Regarding the limited autonomy of the battery-powered system, the FC was suggested as a range extender. The selection of an appropriate FC in terms of the nominal power size and onboard hydrogen tank capacity are important. For instance, if the FC nominal power selected was smaller than the requirement, the system might face a lack of energy. On the other hand, a system with an oversized FC might lead to a higher system cost and fuel consumption. Moreover, the EMS might affect the size and lifetime of the energy sources.

4.3. Impact of FC Sizing and Battery Degradation on EMS Performance

Industrial SGVs usually work on a relatively specific path in a controlled indoor environment, which makes energy consumption estimation possible by employing a realistic model during the specified work hours. Therefore, by knowing the required power and energy and considering the available energy from the battery, the requisite energy from the range extender could be calculated. In addition, the FC system lifetime was enhanced if its load fluctuations were reduced and if frequent starts and stops of the FC were avoided [41].
In order to evaluate the impact of FC sizing on EMS performance, the mixed working cycle was repeated many times to reach an 8 h working shift. In this context, the measured velocity profile for the mixed working cycle was imposed to the proposed model as an input. After this, the performance of the proposed FC/battery SGV powertrain was validated under the three EMS modes, including the CD, CS, and CB. Then, each EMS mode was investigated by considering four different nominal FC power (300 W, 200 W, 160 W, and 100 W).
For instance, Figure 12a indicates the impact of different EMS modes on the SOC of the battery with a 160 W FC as a range extender. Figure 12b,d,f show the power distribution between power sources in the CB, CS, and CD modes (respectively) with a 160 W FC for the entire 8 h work shift under the mixed working cycles. Furthermore, Figure 12c,e,g present the total supplied energy from each source for the entire working shift in the CB, CS, and CD modes, respectively.
Results show that the suggested hybrid system would fail in the CD mode. As mentioned before, in the CD mode, the battery pack supplies the required power without the assistance of the FC until the battery SOC reaches the low battery threshold level (20%). Therefore, the system failure occurs after 5 h in the CD mode, due to the insufficient available power of the battery and FC, which cannot alone support the power peak requirement of the SGV (+470 W). This meant that an FC system with a higher power (i.e., 500 W) was needed to satisfy the power peak of the SGV during the acceleration with the CD mode, to accomplish the 8 h working shift.
On the other hand, in the CS mode, the FC was turned ON at its maximum power when the battery SOC was around 40%, to ensure battery SOC sustenance until the end of work. Indeed, CS strategy acted similar to the CD mode in the beginning, if the battery was fully charged. Nevertheless, due to the higher battery SOC threshold level, the CD mode kept the battery SOC higher than the minimum authorized SOC (20%) during the 8 h working shift, to supply the required peak power. It was important to note that when the FC was ON, it charged the battery during low power demand periods. Since the FC operates at its maximum power rate during the CD and CS modes, it leads to high fuel consumption and FC degradation.
In the CB mode, when the SOC reaches the threshold value of 60%, the FC supplies a constant power while the battery supplies the required peak power. Accordingly, the CB strategy allows turning ON the FC stack in its maximum fuel efficiency with a minimum ON/OFF cycle, to minimize hydrogen consumption. Moreover, it prevents the battery SOC to reach the minimum threshold before the end of the working shift and avoids frequent power source fluctuations that could affect the FC lifespan. Therefore, it might increase the battery and FC lifetime by reducing their degradation. It should be noted that if a regenerative braking system is considered, up to 45 Wh of energy could be recovered (around 3.5% of the total consumed energy).
As a general outcome, Table 5 lists the comparison results for each EMS with the four different nominal FC power and three battery charge and discharge cycles (0, 750, and 1500), in terms of the working time, H2 consumption, energy provided by sources, and final SOC of the battery. These results showed that the system could not meet an 8 h working shift in the CD mode with different FC power sizes, due to the insufficient power supplied by both energy sources for the power peak requirement (+470 W). Moreover, an FC with 100 W nominal power was not able to supply the energy needed to operate the SGV for the entire 8 h shift, with all the proposed EMSs.
For the CD strategy, the proposed FC power needs to be greater than the SGV power picks during acceleration, to reach 8 h of working time. However, for the CS and CB strategies, an FC with a minimum nominal power of 160 W is mandatory to attain 8 h of working time with minimum hydrogen consumption. A lower FC nominal power could be a good choice if the objective was to reduce system cost and energy cost because hydrogen energy is costly, compared to the battery charging station energy. It is also important to note that FC presents a lower efficiency (around 55%) compared to battery efficiency (around 90%) and the slow dynamic characteristics of the FC cause a problem for an SGV application, where the power requirements can vary considerably during a mission. In order to increase the system efficiency and to reduce hydrogen consumption, it is better to consider an EMS that uses the FC at its maximum efficiency similar to the CB mode, instead of using the FC at its maximum power as the CS and CD modes. As shown in Table 5, the simulation result illustrates a difference of around 26% in hydrogen consumption for the same provided energy by the 160 W FC system, during the typical 8 h shift working cycles between the CS and CB modes.
Furthermore, Table 5 confirms that it is necessary to consider a higher nominal power of the FC system if the objective is to minimize the energy provided by the battery, in order to reduce battery degradation and battery charging time. In addition, the FC system tank unlike the batteries could be filled in a few minutes and has the potential to provide power over long periods of time, as required for long-term missions.
The battery degradation should be considered by the EMS because it can affect the FC sizing. Accordingly, three battery charge and discharge cycles (0, 750, and 1500) are considered, as shown in Table 5. Results showed that battery degradation affected the capabilities of the EMS, as well as vehicle performance, by reducing the energy storage system capacity. By comparing the results, it could be seen that a 200 W FC system in the CB mode was able to maintain the battery SOC at the desired level (40%), even until the end of the useful life of the battery (up to 1500 battery charge and discharge cycles). Moreover, the results showed that battery degradation impact on the vehicle performance was more drastic in the system with a smaller secondary power source because the final SOC was usually lower than the desired level. However, it should also be noted that in a system with a larger range extender, a part of the generated power by the FC system might be wasted due to the insufficient capacity of the energy storage system at the end of its useful life. For instance, in a hybrid system with a 300 W FC and the CB mode strategy, around 121 Wh of the generated energy might be wasted (3.14 g of H2) due to battery aging. Therefore, a tradeoff between FC size and battery capacity, which was affected by the degradation, must be considered on EMS design. To summarize, the FC and hydrogen tank sizing of the hybrid SGV strongly depended on the EMS and the desired autonomy. It was also important to consider the degradation of power sources and the maximum load that could be transported by the SGV during the FC and hydrogen tank sizing.

5. Conclusions

This study analyzed the performance of an industrial SGV EMS for different FC sizes and battery degradation levels. In this regard, a realistic energy model, which was the core of the proposed analysis, was developed for the studied SGV. Different levels of modeling such as physical models, lookup table data, and efficiency maps were considered to model the battery pack, the FC, and the electric machines, etc. The validity of the developed model was confirmed by an adequate accuracy between the measured values from the real-world tests and the simulation results during a specific working cycle. The proposed model was then used to investigate the effect of three EMS modes (CD, CS, and CB) on FC sizing, by considering different nominal FC power (300 W, 200 W, 160 W, and 100 W) and different battery degradation levels.
In industrial environment like warehouses, the SGV execute a predefined cycle with known velocity. Therefore, it is possible to accurately estimate the size of the FC system as a range extender, depending on the EMS and the desired working shift. It is important that the EMS of a hybrid SGV system considers the cost, the limited durability, and energy efficiency of FC and batteries, as well as the operational constraints of the SGV. In this context, it is recommended to avoid oversized sources by considering a small FC as a range extender, to reduce system cost and to maintain the FC in its high efficiency zones with a minimum ON/OFF cycle, leading to efficiency and lifetime enhancement of FC system. Battery SOC have to be kept at a high level during SGV operation, to support the FC during SGV acceleration. In order to improve the SGV’s overall autonomy, it is also important to minimize the stop and go and rotational SGV motion with appropriate acceleration and deceleration rate.
Some prospects for extending the scope of this study remain as follows:
  • Exploring the effect of FC degradation on EMS performance and FC sizing.
  • Proposing an online EMS, based on the online identification of the maximum efficiency of the fuel cell system that changes over time and an online battery management system.

Author Contributions

Conceptualization, A.G.; Data curation, A.G. and L.Z.; Formal analysis, A.G.; Funding acquisition, S.K.; Investigation, A.G.; Methodology, A.G., A.A.; Project administration, S.K.; Resources, A.A. and S.K.; Software, A.G.; Supervision, S.K., N.Z. and A.A.; Validation, A.G., A.A., S.K. and N.Z.; Visualization, A.G.; Writing–original draft, A.G.; Writing–review & editing, A.A. and N.Z. All authors have read and agreed to the published version of the manuscript.

Funding

This research received no external funding.

Acknowledgments

The authors would like to thank the Noovelia Research Chair on the Development of Intelligent Navigation Systems for Industrial Guided Vehicles, the Natural Sciences and Engineering Research Council of Canada and the Fondation de l’Université du Québec à Trois-Rivières for their supports.

Conflicts of Interest

The authors declare no conflict of interest.

References

  1. Hermann, M.; Pentek, T.; Otto, B. Design principles for industrie 4.0 scenarios. In Proceedings of the 2016 IEEE 49th Hawaii International Conference on System Sciences (HICSS), Koloa, HI, USA, 5–8 January 2016; pp. 3928–3937. [Google Scholar]
  2. Watzenig, D.; Horn, M. Automated Driving: Safer and More Efficient Future Driving; Springer: Berlin/Heidelberg, Germany, 2016. [Google Scholar]
  3. Martins, F.N.; Sarcinelli-Filho, M.; Carelli, R. A velocity-based dynamic model and its properties for differential drive mobile robots. J. Intell. Robot. Syst. 2017, 85, 277–292. [Google Scholar] [CrossRef]
  4. Ehsani, M.; Gao, Y.; Longo, S.; Ebrahimi, K. Modern Electric, Hybrid Electric, and Fuel Cell Vehicles; CRC Press: Boca Raton, FL, USA, 2018. [Google Scholar]
  5. Li, X.; Wang, Z.; Zhang, L.; Zou, C.; Dorrell, D. State-of-health estimation for Li-ion batteries by combing the incremental capacity analysis method with grey relational analysis. J. Power Sources 2019, 410, 106–114. [Google Scholar] [CrossRef]
  6. Thangavelautham, J.; Strawser, D.; Cheung, M.Y.; Dubowsky, S. Lithium hydride powered PEM fuel cells for long-duration small mobile robotic missions. In Proceedings of the 2012 IEEE International Conference on Robotics and Automation, Saint Paul, MN, USA, 14–18 May 2012; pp. 415–422. [Google Scholar]
  7. Eriksson, E.; Gray, E.M. Optimization and integration of hybrid renewable energy hydrogen fuel cell energy systems–A critical review. Appl. Energy 2017, 202, 348–364. [Google Scholar] [CrossRef]
  8. Thangavelautham, J.; Gallardo, D.; Strawser, D.; Dubowsky, S. Hybrid fuel cell power for long duration robot missions in field environments. In Field Robotics; World Scientifi: Singapore, 2012; pp. 471–478. [Google Scholar]
  9. Joh, H.-I.; Ha, T.J.; Hwang, S.Y.; Kim, J.-H.; Chae, S.-H.; Cho, J.H.; Prabhuram, J.; Kim, S.-K.; Lim, T.-H.; Cho, B.-K.; et al. A direct methanol fuel cell system to power a humanoid robot. J. Power Sources 2010, 195, 293–298. [Google Scholar] [CrossRef]
  10. Kesner, S.B.; Plante, J.-S.; Boston, P.J.; Fabian, T.; Dubowsky, S. Mobility and power feasibility of a microbot team system for extraterrestrial cave exploration. In Proceedings of the 2007 IEEE International Conference on Robotics and Automation, Roma, Italy, 10–14 April 2007; pp. 4893–4898. [Google Scholar]
  11. Lee, S.-Y.; Min, I.-G.; Kim, H.-J.; Nam, S.W.; Lee, J.; Kim, S.J.; Jang, J.H.; Cho, E.; Song, K.H.; Hong, S.-A.; et al. Development of a 600 w proton exchange membrane fuel cell power system for the hazardous mission robot. J. Fuel Cell Sci. Technol. 2010, 7, 3. [Google Scholar] [CrossRef]
  12. He, X.; Jiang, Y. Review of hybrid electric systems for construction machinery. Autom. Constr. 2018, 92, 286–296. [Google Scholar] [CrossRef]
  13. Hosseinzadeh, E.; Rokni, M.; Advani, S.G.; Prasad, A.K. Performance simulation and analysis of a fuel cell/battery hybrid forklift truck. Int. J. Hydrog. Energy 2013, 38, 4241–4249. [Google Scholar] [CrossRef]
  14. Amamou, A.A.; Kelouwani, S.; Boulon, L.; Agbossou, K. A comprehensive review of solutions and strategies for cold start of automotive proton exchange membrane fuel cells. IEEE Access 2016, 4, 4989–5002. [Google Scholar] [CrossRef]
  15. Vivas, F.; de las Heras, A.; Segura, F.; Andújar, J. A review of energy management strategies for renewable hybrid energy systems with hydrogen backup. Renew. Sustain. Energy Rev. 2018, 82, 126–155. [Google Scholar] [CrossRef]
  16. Lü, X.; Qu, Y.; Wang, Y.; Qin, C.; Liu, G. A comprehensive review on hybrid power system for PEMFC-HEV: Issues and strategies. Energy Convers. Manag. 2018, 171, 1273–1291. [Google Scholar] [CrossRef]
  17. Hannan, M.; Azidin, F.; Mohamed, A. Hybrid electric vehicles and their challenges: A review. Renew. Sustain. Energy Rev. 2014, 29, 135–150. [Google Scholar] [CrossRef]
  18. Garcia, P.; Fernandez, L.M.; Garcia, C.A.; Jurado, F. Energy management system of fuel-cell-battery hybrid tramway. IEEE Trans. Ind. Electron. 2009, 57, 4013–4023. [Google Scholar] [CrossRef]
  19. Jiang, W.; Fahimi, B. Active Current Sharing and Source Management in Fuel Cell–Battery Hybrid Power System. IEEE Trans. Ind. Electron. 2010, 57, 752–761. [Google Scholar] [CrossRef]
  20. Segura, F.; Andújar, J.M.; Durán, E. Analog current control techniques for power control in PEM fuel-cell hybrid systems: A critical review and a practical application. IEEE Trans. Ind. Electron. 2010, 58, 1171–1184. [Google Scholar] [CrossRef]
  21. Torres, J.; Gonzalez, R.; Gimenez, A.; Lopez, J. Energy management strategy for plug-in hybrid electric vehicles. A comparative study. Appl. Energy 2014, 113, 816–824. [Google Scholar] [CrossRef]
  22. Kim, C.H.; Kim, B.K. Minimum-energy translational trajectory generation for differential-driven wheeled mobile robots. J. Intell. Robot. Syst. 2007, 49, 367–383. [Google Scholar] [CrossRef]
  23. Mei, Y.; Lu, Y.-H.; Hu, Y.C.; Lee, C.G. Energy-efficient motion planning for mobile robots. In Proceedings of the IEEE International Conference on Robotics and Automation, ICRA’04, New Orleans, LA, USA, 26 April–1 May 2004; Volume 5, pp. 4344–4349. [Google Scholar]
  24. Liu, S.; Sun, D. Minimizing energy consumption of wheeled mobile robots via optimal motion planning. IEEE/ASME Trans. Mechatron. 2013, 19, 401–411. [Google Scholar] [CrossRef]
  25. Krcmar, L.; Mach, O.; Cernohorsky, J. Design and Efficiency Mapping of an Electric Drive for Mobile Robotic Container Platform for Use in Industrial Halls. In Proceedings of the 2018 IEEE International Symposium on Power Electronics, Electrical Drives, Automation and Motion (SPEEDAM), Amalfi, Italy, 20–22 June 2018; pp. 963–967. [Google Scholar]
  26. Andersen, L.G.; Larsen, J.K.; Fraser, E.S.; Schmidt, B.; Dyre, J.C. Rolling resistance measurement and model development. J. Transp. Eng. 2014, 141, 04014075. [Google Scholar] [CrossRef]
  27. Hannan, M.A.; Lipu, M.H.; Hussain, A.; Mohamed, A. A review of lithium-ion battery state of charge estimation and management system in electric vehicle applications: Challenges and recommendations. Renew. Sustain. Energy Rev. 2017, 78, 834–854. [Google Scholar] [CrossRef]
  28. Xiong, R.; Cao, J.; Yu, Q.; He, H.; Sun, F. Critical review on the battery state of charge estimation methods for electric vehicles. IEEE Access 2017, 6, 1832–1843. [Google Scholar] [CrossRef]
  29. Sone, Y.; Ooto, H.; Eguro, T.; Yoshida, T.; Kubota, M.; Yoshida, H.; Yamamoto, M.; Sakai, S.; Ogawa, K.; Takeda, Y.; et al. Charge and discharge performance of over-discharged lithium-ion secondary battery—Lessons learned from the operation of the interplanetary spacecraft HAYABUSA. Electrochemistry 2007, 75, 950–957. [Google Scholar]
  30. Ng, K.S.; Moo, C.-S.; Chen, Y.-P.; Hsieh, Y.-C. Enhanced coulomb counting method for estimating state-of-charge and state-of-health of lithium-ion batteries. Appl. Energy 2009, 86, 1506–1511. [Google Scholar]
  31. Thirugnanam, K.; TP, E.R.J.; Singh, M.; Kumar, P. Mathematical modeling of Li-ion battery using genetic algorithm approach for V2G applications. IEEE Trans. Energy Convers. 2014, 29, 332–343. [Google Scholar]
  32. Dhameja, S. Electric Vehicle Battery Systems; Elsevier: Amsterdam, The Netherlands, 2001. [Google Scholar]
  33. Power, B. Bioenno Power Lithium Iron Phosphate (LiFePO4) Battery Model BLF-2440A. Bioenno Power Co. Available online: https://www.bioennopower.com/products/24v-40ah-lfp-battery-pvc-blf-2440a (accessed on 27 July 2020).
  34. Squadrito, G.; Maggio, G.; Passalacqua, E.; Lufrano, F.; Patti, A. An empirical equation for polymer electrolyte fuel cell (PEFC) behaviour. J. Appl. Electrochem. 1999, 29, 1449–1455. [Google Scholar] [CrossRef]
  35. Amamou, A.; Kandidayeni, M.; Boulon, L.; Kelouwani, S. Real time adaptive efficient cold start strategy for proton exchange membrane fuel cells. Appl. Energy 2018, 216, 21–30. [Google Scholar] [CrossRef] [Green Version]
  36. Ettihir, K.; Boulon, L.; Agbossou, K. Optimization-based energy management strategy for a fuel cell/battery hybrid power system. Appl. Energy 2016, 163, 142–153. [Google Scholar] [CrossRef]
  37. Delarue, P.; Bouscayrol, A.; Semail, E. Generic control method of multileg voltage-source-converters for fast practical implementation. IEEE Trans. Power Electron. 2003, 18, 517–526. [Google Scholar]
  38. Young, K.; Wang, C.; Wang, L.Y.; Strunz, K. Electric vehicle battery technologies. In Electric Vehicle Integration into Modern Power Networks; Springer: Berlin/Heidelberg, Germany, 2013; pp. 15–56. [Google Scholar]
  39. Amamou, A.; Kandidayeni, M.; Boulon, L.; Kelouwani, S.; Macia, A. Efficient Model Selection for Real-Time Adaptive Strategy of a Fuel Cell System on Vehicular Applications. Int. J. Hydrog. Energy 2020, 45, 19664–19675. [Google Scholar]
  40. Kandidayeni, M.; Macias, A.; Amamou, A.A.; Boulon, L.; Kelouwani, S.; Chaoui, H. Overview and benchmark analysis of fuel cell parameters estimation for energy management purposes. J. Power Sources 2018, 380, 92–104. [Google Scholar] [CrossRef] [Green Version]
  41. Keränen, T.; Karimäki, H.; Viitakangas, J.; Vallet, J.; Ihonen, J.; Hyötylä, P.; Uusalo, H.; Tingelöf, T. Development of integrated fuel cell hybrid power source for electric forklift. J. Power Sources 2011, 196, 9058–9068. [Google Scholar] [CrossRef]
Figure 1. Hybrid self-guided vehicle (SGV) schematic diagram.
Energies 13 05041 g001
Figure 2. Kinematic model of a differential drive mobile robot (DDMR).
Energies 13 05041 g002
Figure 3. Flow chart of the proposed energy management strategy (EMS).
Energies 13 05041 g003
Figure 4. The overall Matlab Simulink model of the SGV.
Energies 13 05041 g004
Figure 5. The studied SGV.
Energies 13 05041 g005
Figure 6. The real-world mixed working cycle pathways.
Energies 13 05041 g006
Figure 7. Battery test bench.
Energies 13 05041 g007
Figure 8. Battery model validation during the charging and discharging process. (a) battery voltage; (b) battery current; (c) battery SOC; (d) calculated error between measured data and simulation.
Energies 13 05041 g008
Figure 9. Comparison results between experimental data and simulations: (a) Battery voltage, and (b) current by traction motors.
Energies 13 05041 g009
Figure 10. Comparison results of experimental data from physical DDMR versus the model. (a) Wheels speed (b) linear speed, (c) angular speed, (d) battery voltage, (e) battery current, and (f) traction power.
Energies 13 05041 g010
Figure 11. (a) Comparison of the transitional and rotational movement using experimental data. (b) Percentage of consumed energy for transitional and rotational movement.
Energies 13 05041 g011
Figure 12. (a) Battery SOC levels with the three strategies, (b) battery and FC power in the CB strategy, (c) provided energy by each energy sources during CB strategy, (d) battery and FC power in the CS strategy, (e) provided energy by each energy sources during CS strategy, (f) battery and FC power in the CD strategy, and (g) provided energy by each energy sources during the CD strategy.
Energies 13 05041 g012
Table 1. The simulation parameters of the main components.
ParameterSymbolValue
Rolling resistance coefficientCroll0.02
Drive wheel radiusR0.197 m
WheelbaseL0.72 m
Total massm100 kg
Moment of inertia for motor’s rotorI0.3 kg m2
Linear accelerationa1 m s−2
Rotational accelerationω1 Rad. s−2
Table 2. Summary of battery specifications [33].
ParameterValue
Battery nominal voltage and capacity25.6 V, 40 Ah
Charging Voltage29.2 VDC
Charging Current4–8 A
Open Circuit Voltage Range29.2 VDC
Maximum Continuous Discharge Current40 A
Maximum Peak Discharge80 A (3 Sec.)
Operating Temperature−10 °C to 60 °C
Table 3. Experimental working cycle parameters.
Measured ParametersMotion Type
Transition in the X-DirectionRotational
TrapezoidBackwardForwardRotation Around the CenterCircular Pathway
Energies 13 05041 i001 Energies 13 05041 i002 Energies 13 05041 i003 Energies 13 05041 i004 Energies 13 05041 i005
Wheels speed profile
(Solid line: right wheel speed
Dashed line: left wheel speed)
Energies 13 05041 i006 Energies 13 05041 i007 Energies 13 05041 i008 Energies 13 05041 i009 Energies 13 05041 i010
Average speed of the right wheel (Rad s−1)1.41.51.50.571.3
Average speed of left wheel (Rad s−1)1.41.51.5−0.572
Average linear speed (m s−1)0.850.90.900.32
Average linear acceleration
(m s−2)
0.7−0.90.900.9
Average rotational velocity of the vehicle (Rad s−1)0000.310.19
Table 4. Average value of the experimental and simulation results of the defined scenarios.
Motions ConditionMovement TypeAve. Demanded Power (W)Max. Demanded Power (W) Energy Consumption (Wh)Overall Efficiency (%)
Transitional in X-directionForward292.7 *508.8 *0.322 *34.3 *
283.5 **497.3 **0.312 **33.5 **
Backward293.6 *509.5 *0.323 *33.9 *
283.6 **498.5 **0.312 **32.4 **
Trapezoid speed profile256.3 *235.1 *0.282 *37.4 *
246.1 **242.2 **0.271 **35.9 **
RotationalRotation around the center 531.8 *264.4 *0.585 *19.3 *
509.7 **274.8 **0.561 **20.2 **
Circular pathway1053.6 *457.7 *1.159 *38.07 *
1088.1 **450.3 **1.069 **36.9 **
* Experimental results. ** Simulation results.
Table 5. Comparison results of energy sources with different EMS and battery lifetime.
EMS ModeFC Nominal Power (Max Power) (W)Battery Charge and Discharge CycleWorking Time (s) (h)H2 Cons. (gr.)Provided Energy by FC (Wh)Provided Energy by Battery (Wh)Batt. SOH (%)Batt. Final SOC (%)
Charge Depleting (CD)1000 a18,411 (5.114)+0.571679610020
75016,040 (4.455)+0.57166919020
150012,767 (3.546)+0.56153477520
160018,615 (5.120)+0.722679810020
75016,125 (4.459)+0.71256939020
150012,753 (3.548)+0.68243527520
200018,658 (5.128)+1.033380210020
75016,153 (4.467)+0.98326979020
150012,823 (3.555)+0.86303557520
300018,658 (5.132)+1.535081010020
75016,153 (4.477)+1.46487039020
150012,823 (3.562)+1.29453597520
Charge sustaining (CS)100025,460 (7.072)+1233079810020
75023,088 (6.413)+123306939020
150019.813 (5.505)+123303497520
160028,800 (8)+2468959110039.5
75028,800 (8)+287805029038.5
150028,800 (8)+339253597538.3
200028,800 (8)+3084444010054.7
75028,800 (8)+359753109056.9
150028,800 (8)+4411561327560.1
300028,800 (8)+42118610510085.5
75028,800 (8)+4211841069075.2
150028,800 (8)+4211851047560.7
Charge Blending (CB)100026,629 (7.396)+1038180010020
75024,258 (6.738)+103806959020
150020,986 (5.829)+103825517520
160028,800 (8)+1968359810040
75028,800 (8)+228454229037.6
150028,800 (8)+268784067534.3
200028,800 (8)+2385343010056.3
75028,800 (8)+269553299059.9
150028,800 (8)+329423427540
300028,800 (8)+28103224510072.1
75028,800 (8)+31.51192969077.1
150028,800 (8)+36.71414−1217584
(a means new battery).

