Abstract
This paper investigates the influence of the spectral irradiance variation and the spectral response (SR) on the production of energy by photovoltaic cells. To determine the impact of SR and spectral irradiance on m-Si and perovskite cells, experimental tests were conducted outdoors, used optical filters to select different zones of the spectrum. For the computational simulations of the different photovoltaic modules, when subjected to a certain spectral irradiance, a model with spectral factor (SF) was implemented. The SF model accurately simulated the experiments performed for the high-pass filters. The highest relative errors for certain irradiation bands occurred due to the input variables used in the model, which did not fully describe the reality of the experiments performed. The effect of the SR and the spectral irradiance for each of them were observed through the simulations for the m-Si, a-Si, CdTe, and copper indium selenide (CIS) modules. The CIS technology presented a better overall result in the near infrared zone, producing about half of the energy produced by the CdTe technology in the visible zone. The SF, spectral incompatibility factor (MM), and spectral effective responsivity (SEF) parameters were verified to be important for studying the photovoltaic energy production.
1. Introduction
The quest to satisfy the demand for energy is one of the main causes of global warming which is increasing the amount of gases in the atmosphere [1], and therefore causing a significant environmental impact, unbalancing the ecosystems, and affecting human activity in their lifestyle and economically [2]. With this negative impact, global policies have been developed to minimize environmental impacts, and one of most immediate measures is the use of renewable energy sources [3]. The International Energy Agency (IEA) forecasts that renewable energy will account for two thirds of global investment in power plants by 2040. It is also predicted that solar energy will be the one with the greatest growth in electricity production with 74 GW by 2040. Recent studies have concluded that the variation of the spectral irradiance Figure 1 as well as the spectral response (SR) Figure 2 are important aspects in the performance of the photovoltaic devices [4]. Figure 1 also shows a representation of the blackbody spectrum at 5800 K which is an approximation of the sun spectrum radiation.

Figure 1.
Plot of the direct normal spectral irradiance, AM1.5 (___); global total spectral irradiance on a 37° tilted sun-facing surface, AM1.5 (___); the extraterrestrial spectrum, AM0 (___); and the blackbody irradiation spectrum at 5500 K (___) [10,11].

Figure 2.
Spectral response for various technologies [6].
The Earth’s atmosphere behaves like a protective filter against the action of the harmful extraterrestrial radiation that arrives at our planet and like a thermal regulator of the Earth, allowing conditions necessary to life. The radiation that passes through the atmosphere interacts with the atmospheric components, making the terrestrial spectrum different from the extraterrestrial spectrum (Figure 1). The intensity of these processes depends on the distance traveled by the radiation in the atmosphere. Under these conditions, ASTM, with the aim of standardizing a single reference solar spectrum, established a standard spectrum. The currently adopted spectrum is indicated in the norm ASTM G173-03 [5,6].
Another general conclusion is that the spectral impact depends on the location in terms of latitude, climate, rural or urban environment, among others [7] Despite the advances made in the study of the influence of irradiance on photovoltaic energy production [8], models that consider the influence of spectral effects on the field are not readily available, contrary to what happens for the influence of temperature and irradiance [9].
This paper focuses on the study of the impact of spectral irradiance on different photovoltaic cells, as well as the influence of the SR on its photovoltaic energy production. The study is done for m-Si, a-Si, CdTe, and copper indium selenide (CIS). This has been an important research topic. In [10], the kesterite-structured Cu2ZnSnSe4(CZTSe) material has been studied for photovoltaic applications, considering its response to different irradiation wavelengths. In [11], the influence of ultra-high irradiance levels on multi-junction solar cells were tested, under different temperatures, to study the impact on its efficiency, considering its spectral response. In [12] the performance of an Al0.3Ga0.7As/InP/Ge multijunction solar cell was analyzed under different spectral irradiance and temperatures. These studies show the importance of the spectral irradiance impact on the operation of different photovoltaic cells.
To accomplish with the impact study of the spectral irradiance on m-Si, a-Si, CdTe, and copper indium selenide (CIS), first a mathematical model is developed. It is intended to validate a mathematical model that allows the analysis of the impact of spectral irradiance and SR for a photovoltaic cell exposed to a given spectral irradiance. To validate the spectral factor, SF model (a parameter that quantify the spectral gains or losses that a PV module can experience under the actual spectrum as compared with the standard AM 1.5-G), a comparison of the experimental tests is performed with model simulations for the m-Si and organic with perovskite cells. After the validation of the model, simulations were performed for photovoltaic modules of m-Si, a-Si, CdTe, and copper indium selenide (CIS). The novelty of this paper is the validation of the theoretical model with experimental results using several spectral filters.
We also intend to confirm the hypothesis of producing photovoltaic energy without visible light, making use of infrared light.
2. Solar and Photovoltaic Energy
The sun is mainly responsible for the available energy on Earth, giving rise to multiple resources available in the Earth such as hydropower, wind energy, photovoltaic energy, and even the energy present in fossil fuels from organic life previously nourished by the sun.
The solar spectrum consists of radiation with different levels of energy, this spectrum is divided into several regions as follows: rays, X rays, ultraviolet (UV), visible; infrared (IR), microwave; radio waves, and long waves [13].
A photovoltaic cell is a device capable of convert light energy that comes from any light source directly into electricity, throughout a process denominated photovoltaic effect. In other words, a current is generated due to the incidence of photons, which are light beams and packages of electromagnetic radiation or energy that can be absorbed by a solar cell [14]. When the incoming light has a proper wavelength, the energy of the photons is transferred to the electrons which jump to a higher level of energy, known as conduction band, and a hole is originated and dropped on the valence band, creating two charge carriers, i.e., an electron-hole pair. In this excited state, electrons are free to move on the material. Since a photovoltaic cell is composed of semiconductor materials of N and P types that form a P-N junction, an electrical field is originated which causes electrons and holes move in opposite directions, which is the process that creates an electrical current in the cell [15].
A PV cell can be modeled by a current source in parallel with a diode both in parallel with a resistance and a series resistance, which leads to its current, I, voltage, V, given by Equation (5), where I, IS, and Iph are the current at the output of the cell, IS is the saturation current of the diode, RSH is a shunt resistance, RS is a leekedge resistance, Iph, the photogenerated current, the V and VT are the voltage to the cell terminals and the thermal voltage, respectively, n is the diode’s ideality factor.
In an ideal solar cell RSH → ∞ and RS → 0.
3. Influence of External Parameters
The irradiance influences the value of the short-circuit current, since it is directly proportional to this, Equation (2), where Isc and G are the short-circuit current and the irradiance, respectively, and G* are the short-circuit current and the irradiance, both under standard test condition (STC), respectively [16].
The temperature influences the open circuit voltage, since it decreases with the increasing of the temperature. This occurs because the gap energy is affected by the increase of the temperature, which affects the saturation current of the diode [15].
The SR is the ratio between the generated current of the photovoltaic cell and the irradiance on the solar cell plane for a given wavelength. Indicating how the photons of different wavelengths contribute to the generated current [17]. In this work the SR of four photovoltaics technologies are considered, m-Si, a-Si, CdTe, and CIS, which are represented in Figure 2.
The spectral factor (SF) of a non-concentrating PV device is defined as, [6]:
where the SR(λ) is the SR of the device when it is at the reference temperature as a function of the wavelength respectively, and are the spectral irradiance that effectively reaches the cell and under STC as a function of the wavelength. From Equation (3), when SF assumes values higher than one, it has spectral power gains, whereas when this is less than one, it has losses, this in relation to the STC. The short-circuit current of a photovoltaic module is proportional to the product of the spectral irradiance and the integrated SR along the wavelength [6]:
Therefore, SF can still be rewritten as [6]:
The spectral effective responsivity (SEF) is defined as [18]:
where is the wavelength corresponding to the band gap energy of the material. The index expresses in units of A/W the ratio between the short-circuit current only accounting for irradiance and spectral effects and the spectrum power available for the photovoltaic conversion [16].
The spectral mismatch factor (MM) is defined in the IEC 60904-7 standard [19] as a way of quantifying the relative spectral impact between a sample PV device and a reference PV device by means of:
where SRsample(λ) represents the spectral response of the sample PV device and SRref(λ) the spectral response of the reference PV device, both at the reference cell temperature. From this definition, MMsample/ref accounts for spectral gains if greater than one or spectral losses if lower than one, for the sample PV device with respect to the reference PV device [20].
4. Methods and Procedures
The objective of this experiment is to determine the I-V and P-V characteristics of solar cells, with and without wavelength selective filters, for different conditions of irradiance. The current and voltage were measured outside laboratory conditions.
The experimental tests were carried out with the main objective of obtaining the characteristic curves of m-Si and organic perovskite solar cells, under real solar radiation, in order to observe the impact of the spectral irradiance and the SR of the cell in the production of electric energy and also to validate the SF model. For this, several optical filters were used to select the specific zones of the spectrum. With this, a structure was constructed that maintained the cells directed toward the sun and supported the optical filters used Figure 3.

Figure 3.
Open structure, with m-Si cell.
To measure the irradiation that reached the solar cell, an irradiation detector was placed behind the filter and was subsequently removed before the experimental procedure started. The detector that was used to measure the irradiance was a Sciencetech SOL-METER (TES-1333), a digital meter with a solar calibrated detector with an accuracy angle, cosine corrected <5% for angles <60°. The meter converts detector measurements to a Sun value. It has a handheld meter that is compact, has a sturdy design, and is appropriate for indoor or outdoor applications.
The Sciencetech reference detector, which is an integral part of solar simulator calibration and solar cell I-V characterization, consists of a calibrated solar detector made of silicon. The reference detector comes with calibration data taken by Sciencetech, calibrating it to a NIST-certified solar cell, on an accompanying certificate. It reads solar simulator irradiance in “sun” units; one sun is equal to 1000 W/m2, at 25 degrees Celsius and air mass 1.5 global.
In addition to the structure, high-pass (HP) (Table 1) and band-pass (BP) (Table 2) optic filters, a variable resistance, a voltmeter, and an ammeter are used, as can be seen in the scheme of Figure 4 and in the experimental set up Figure 5. The value of the irradiance outside the structure was obtained by using an irradiation meter.

Table 1.
High-pass filter characteristics.
Table 2.
Characteristics of bandpass filters.

Figure 4.
Scheme of the assemblies of the experiments.
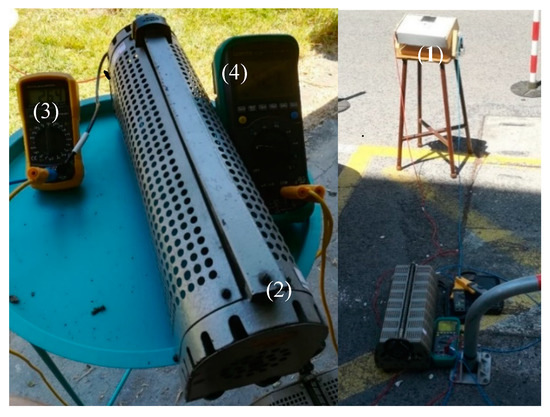
Figure 5.
Experimental assembly. (1) Structure; (2) variable resistance; (3) ammeter and (4) voltmeter.
The experiments performed for the m-Si cell have as an objective to analyze the impact of the spectral irradiance and the SR of the cell in the production of electric energy by comparing the experimental data obtained with those generated by the SF model for this cell. The perovskite organic cell is used because it is a little studied technology which aims to analyze the impact of the spectral irradiance in the production of electric energy and to have an idea of its possible SR.
The tests without HP filters (Figure 6a) for the m-Si cell were performed in order to obtain the mean value of the short-circuit current when the m-Si cell is exposed to the standard spectral irradiance. This value was used in the validation of the SF model for HP filters.

Figure 6.
Structure. (a) No high-pass (HP) filters; (b) with HP filters.
The tests for the HP filters (Figure 6b) were designed to observe the impact on the variation of the incident spectrum filtered by these filters in obtaining the characteristic curves of m-Si and perovskite organic cells.
The tests without the BP filters (Figure 7a) were performed in order to obtain the mean value of the short-circuit current, when the m-Si cell was exposed to the standard spectral irradiance, since this value was used in validation of the SF model.

Figure 7.
Structure. (a) No band-pass (BP) filters; (b) with BP filters. (1) BP filter.
The BP filters allow selection of a specific zone of the spectrum and the tests carried out with these (Figure 7b) had the objective of observing the impact of the spectral irradiance and the SR on the photovoltaic energy production in the m-Si and perovskite organic cells used.
The SF model was developed in Matlab with the objective of simulating and studying the performance of several solar technologies when exposed to a given local spectral irradiance. To accomplish this it was necessary to validate the model, comparing the experimental results obtained for the m-Si cell with the data generated by the model.
The model makes use of Equations (7) and (9) to determine SF of the cell and the short-circuit current when it is exposed to a given spectral irradiance. The simulation model was performed in Simulink. With this model it was possible to simulate a certain solar cell technology when exposed to a given irradiation and solar spectrum.
The Icc is calculated taking into account the spectral irradiance that effectively reaches the solar cell and the SR of the cell technology under study.
The SF model was used to simulate different solar modules, i.e., Si-m, Si-a, CeTd, and CIS. To analyze how these technologies responded to different zones of the solar spectrum (namely to the UV, visible, and near-IR) SF, SEF, and MM are calculated for each technology using Equations (3), (6) and (7).
The SR values used for the different technologies are shown in Figure 2. The module specifications were taken from the datasheets of each module, as shown in Table 3.
Table 3.
Specifications of m-Si, a-Si, CdTe, and copper indium selenide (CIS) modules.
5. Experimental Results
5.1. Experimental Tests with High-Pass Filters
This section present sand compares the experimental data obtained for the experiments performed without the HP filters and the experiments carried out with the HP filters, Table 1, in order to analyze the impact of the variation of the incident spectrum caused by these filters, and the obtained characteristic curves of m-Si and organic perovskite cells.
5.1.1. M-Si Cell
Several tests without HP filters were performed on unfiltered m-Si cells from 14 to 21 May 2018, between 11:00 a.m. and 4:00 p.m. The HP filter tests were performed between 15 and 19 June 15 and on 21 May 21 2018, between 11:00 a.m. and 4:00 p.m., and a total of six assays were performed for each filter.
Because the filters do not allow the passage of a part of the solar spectrum, the irradiance that reaches the solar cell is smaller. Therefore, the experimental results without filters obtain higher short-circuit current and maximum power values, as expected, and for the open circuit voltage there are no large variations, Table 4.
Table 4.
Values of open circuit voltage, maximum power, and respective variations for different tests with and without HP filters for m-Si cell for an irradiance of 910 W/m2.
Analyzing Figure 8 and the remaining data, it is observed that the short-circuit current for the OG 515 filter is higher than that of the OG 550 filter, on average 13.33 mA above (corresponding to 7.00% deviation). This is due to the radiance difference transmitted by the filters, and also by the spectral response of the m-Si cell.

Figure 8.
Experiments performed on 21 May 2018: without filters (—), with filter OG 515 (—), and filter OG 550 (—) for m-Si cell. (a) Voltage-current curves and (b) voltage-power curves. Both curves were acquired for G = 910 W/m2.
5.1.2. Perovskite Organic Cell
Tests were carried out on perovskite organic cells on 7 August 2018 at 3:45 p.m. and 4:30 p.m., with one test being performed without a filter and one for each HP filter.
Analyzing the results obtained in Figure 9, it is observed that the voltage-current characteristic curves for this technology have an approximately linear shape. The value of the open circuit voltages varies greatly depending on the filter that is used, Table 5, in contrast to the m-Si cell.

Figure 9.
Tests carried out on 7 August 2018: without filters (—), with filter OG 515 (—), and those with filter OG 550 (—) for perovskite organic cell. (a) Voltage-current curves and (b) voltage-power curves. Both curves were acquired for G = 1000 W/m2.
Table 5.
Values of open circuit voltage, maximum power, and respective variations for different tests with and without HP filters for perovskite organic cell for an irradiance of 1000 W/m2.
5.2. Experimental Tests with Band-Pass Filters
In this section, we compare the results of the assays performed with BP filters, Table 2, for m-Si and perovskite organic cells. As previously mentioned, these filters have a very narrow bandwidth which allows passage to very specific zones of the solar spectrum. This leads to the cells receiving low levels of irradiance, which in turn induces short-circuit currents lower than those observed in the tests without the filters.
These experimental results provide the data for the analyses of the influence of the SR of each of the technologies and the spectral irradiance on the energy production.
5.2.1. M-Si Cell
By analyzing Figure 10 which showing the evolution of the characteristic curves of the cells with the BP filters, together with Table 6, we can conclude that the response to the 500 nm and 700 nm filters is that there is a higher maximum power.

Figure 10.
Tests performed with BP filters on August 21 2018 for the m-Si cell. (a) Voltage-current curves and (b) voltage-power curves.
Table 6.
Values of open circuit voltage, short-circuit current, maximum power, and respective variations for the tests with and without BP filters of m-Si cell for an irradiance of 1000 W/m2.
However, it is worth remembering that the 1000 nm filter contains a bandwidth of 25 nm, leading to lower power values (0.465 mW). Thus, the maximum power for a 1000 nm filter with a bandwidth of 50 nm is expected to be approximately double which is approximately 0.93 mW, and is the highest value of the BP filters.
5.2.2. Perovskite Organic Cell
Similar to the results discussed in Section 5.2.1, the results obtained for perovskite organic cell, Figure 11, reinforce the hypothesis that the characteristic curve of this technology can be described by a linear equation.

Figure 11.
Tests performed with BP filters on 7 August 2018 for the perovskita organic cell. (a) Voltage-current curvesa and (b) voltage-power curves.
The results, shown in Figure 11 and in Table 7, show that the 500 nm and 550 nm filters are those with the highest peak power values. Since the 1000 nm filter has half the bandwidth of the rest it is expected that a BP filter of 1000 nm with 50 nm bandwidth will have a maximum power of approximately 5.36 µW, exceeding the values reached in the remaining filters.
Table 7.
Values of open circuit voltage, short-circuit current, maximum power, and respective variations for the tests with and without BP filters of perovskite organic cell.
Figure 12 shows the values of the spectral irradiance and the maximum power normalized to their respective maximum values. From an analysis of this information, it is possible to hypothesize that the perovskite organic cell used in this work will have a better SR in the visible zone up to 550 nm and increase again near 1000 nm. Therefore, we conclude that this cell has good use of the irradiance in this zone of the near-IR. Since no information is available between 750 nm and 950 nm, nothing can be completed in this range.

Figure 12.
Normalized maximum power for BP filters for perovskite organic cell, in blue. Spectral irradiance normalized, in orange.
6. Simulation Results
In this section, we validate the SF model, by comparing the results obtained from the simulation with the experimental ones for the m-Si cell and for the different optical filters used. After the validation of the model, we apply it to four different technologies, i.e., m-Si, a-Si, CdTe, and CIS, to analyze the behavior of these technologies when irradiated for different zones of the solar spectrum.
Table 8 shows the mean values of the short-circuit currents adapted for an irradiance of 1000 W/m2, for the tests with the aperture for HP filters and BP filters, since these apertures have different dimensions.
Table 8.
Average values of the short-circuit current under STC for the experiments performed with the aperture for filters used.
6.1. Simulation for High-Pass Filters
This section presents some of the results of the simulations performed to validate the model, comparing these with the experimental results obtained with High Pass filters for the m-Si cell.
For 21 May 2018, the results for the OG 515 filter with an irradiance of 915 W/m2 are shown in Figure 13, and Figure 14 shows the OG 550 filter with a 910 W/m2. The curves that are closest to the experimental data are shown in red, and the simulated characteristic curves are shown in yellow. It is possible to observe that the characteristic curves are close to each other.

Figure 13.
Experimental data acquired (x), characteristic curve that approaches the experimental data (---), and simulated characteristic curve (---), for the OG 515 filter.

Figure 14.
Experimental data acquired (x), characteristic curve that approaches the experimental data (---), and simulated characteristic curve (---), for the OG 550 filter.
Table 9 presents the values of the short-circuit currents, the curves that approximate the experimental data, the curves obtained by simulation using the SF model and calculated by the method without SF using Equation (6) for the irradiance incident on the solar cell, as well as the values of the relative errors for both models.
Table 9.
Values of short-circuit current and their respective relative errors for HP filters.
These filters have low relative error values which propitiate a good approximation of the SF model. However, the variation of the relative error for the different simulations could possibly be related to the variation of the spectral irradiance throughout the days. Another possible explanation is the variation of the SR of the cell with the temperature changing the amount of solar energy converted into electric energy.
6.2. Simulation for Band Pass Filters
This section presents some of the results of the simulations performed to validate the model, comparing these with the experimental results obtained with Band Pass filters for the m-Si cell.
Simulations were performed for the filters indicated in Table 2. However, in this paper, we only present the simulations for the 650 nm filter, Figure 15, where the SF model generates a good approximation and for the 400 nm filter, Figure 16, which obtains the highest relative error values.

Figure 15.
Experimental data acquired (x), characteristic curve that approaches the experimental data (---), and simulated characteristic curve (---), for the 650 nm filter.

Figure 16.
Experimental data acquired (x), characteristic curve that approaches the experimental data (---), and simulated characteristic curve (---), for the 400 nm filter.
Although the SF model has high values of relative errors for certain irradiation bands, Table 10, these errors can be justified by the input variables used by the SF model, which do not fully describe the reality of the experiments performed. For the spectral irradiance variation in these spectrum ranges, the m-Si cell has a SR different from that used to describe it, or a variation of the bandwidth of the BP filters. A small variation of these variables causes a considerable variation in the irradiance value that effectively reaches the solar cell, causing a large variation of the values of the short-circuit current within the order of magnitude of this one.
Table 10.
Values of short-circuit current and their respective relative errors for BP filters.
It should be noted that the SF model obtained an average relative error of 33.07%, which could decrease with the use of the appropriate variables as compared with 38.39% obtained for the model without SF.
6.3. Simulation for Band Pass Filters for Different Technologies
In this section, we use the model developed to simulate four solar modules of the m-Si, a-Si, CIS, and CdTe technologies, and the SR for each technology is shown in Figure 2.
Figure 17 shows the spectral irradiance converted by the different modules. It is possible to observe the impact of SF of each technology and the spectral irradiance that is effectively converted into electric energy by each technology.

Figure 17.
Spectral irradiance that is effectively converted into electrical energy by m-Si, a-Si, CdTe, and CIS technologies.
The simulations are carried out considering that the incident spectral irradiance is equal to the reference spectral irradiance, for three different zones of the spectrum, namely UV, visible, and IR, in order to analyze the influence of each of these zones on the production of photovoltaic energy.
Observing Figure 18, with the data in the Table 11, it is possible to conclude that in the UV zone the maximum power values obtained are reduced, the a-Si technology has the best SF and a better use of irradiation. For the visible zone, although the a-Si module obtains the highest SF value, the CdTe module presents the best maximum power values per module area. Finally, for the IV zone the CIS technology presents better use of the spectral irradiance and performance, generating about half of the energy produced by the CdTe technology in the visible zone.

Figure 18.
Simulated voltage-power curves for the m-Si, a-Si, CdTe, and CIS modules. (a) ultraviolet (UV) zone, 250–380 nm; (b) visible zone, 380–750 nm; and (c) infrared (IR) zone, >750 nm.
Table 11.
Values of spectral factor (SF), spectral incompatibility factor (MM), spectral effective responsivity (SEF), and maximum power per area of each module of m-Si, a-Si, CdTe, and CIS for the UV, visible, and IR zones.
7. Conclusions and Recommended Works
The main objectives of this work are the study of the impact of spectral irradiance and spectral response (SR) on the photovoltaic energy production of the solar technologies used throughout this work.
We found that the m-Si cell and the perovskite organic cell respond differently to the various filters used, when exposed to the same spectral irradiance. It was also observed that the perovskite organic cell has a good SR in the visible zone up to 550 nm, and then near 1000 nm. Additionally, it was found that this cell generates voltage-current characteristic curves with an approximately linear shape.
Although the spector factor (SF) model has high relative error values for certain irradiation bands, these errors were justified based on the input variables used in the model, which did not fully describe the reality of the simulated experiments performed. More detailed development of this model is necessary, considering the possible deviations of the observed conditions.
The simulations performed with the SF model for the m-Si, a-Si, CdTe, and CIS modules allowed us to observe the effect of SR and the spectral irradiance for each of them, since they have performances and exploitations for different areas of the spectrum.
Finally, it was concluded that the SF, the spectral mismatch factor (MM), and the spectral effective responsivity (SEF) are important and necessary factors for the study of photovoltaic energy production. However, they are not enough, and the knowledge of the internal characteristics of the solar modules is also necessary.
The existing potential in the IV zone should also be noted, with a significant impact on the production of photovoltaic energy, not only in the experimental tests performed, but also in the simulations performed for the SF model. Thus, the hypothesis of producing electric energy without the presence of visible light was validated.
In relation to the study of the impact of spectral irradiance and SR on photoelectric energy production we suggest that the following works should be carried out:
- Study the spectral response, efficiency, and energy efficiency of the transparent luminescent solar concentrator technology for a building for one year;
- Study in more depth the various independent spectral indices and dependent PV devices;
- Perform experimental tests with concentrator panels and compare the results with simulations for the model using SF for HCPV;
- Perform experimental tests with multiple junction solar cells and compare the results with simulations for the model using the spectral matching ratio;
- Perform experimental tests in a dark environment and on cloudy days with PV devices directed to a body that emitted infrared radiation, for CIS, CISG and m-Si technologies.
- To study the effect of temperature on the production of photovoltaic energy as a function of the incident wavelength in a solar cell, the following are proposed:
- Study the SR variation with the temperature variation for a fixed spectral irradiance, preferably constant along the wavelength;
- Study the SR variation with the temperature variation with the parameters already used in the prediction of the temperature impact in a solar cell.
- To be able to analyze the efficiency of any solar cell using the simulation for any operating condition, the following is suggested:
- Develop a model capable of simulating any type of solar technology, for any operating condition, making use of the various spectral indices.
Author Contributions
Conceptualization, D.L., J.P.N.T. and J.F.P.F.; methodology, D.L., J.P.N.T. and J.F.P.F.; software, D.L.; validation, J.P.N.T. and J.F.P.F.; formal analysis, D.L., J.P.N.T. and J.F.P.F.; investigation, D.L.; data curation, D.L.; writing—original draft preparation, D.L.; writing—review and editing, J.P.N.T. and J.F.P.F.; supervision, J.P.N.T. and J.F.P.F.; funding acquisition, J.P.N.T. All authors have read and agreed to the published version of the manuscript.
Funding
This work is financed by national funds through FCT - Foundation for Science and Technology, I.P., through IDMEC, under LAETA, project UIDB/50022/2020 and under IT, project UIDB50008/2020.
Conflicts of Interest
The authors declare no conflict of interest.
References
- Alves, P.; Fernandes, J.F.P.; Torres, J.P.N.; Branco, P.J.C.; Fernandes, C.; Gomes, J. From Sweden to Portugal: The effect of very distinct climate zones on energy efficiency of a concentrating photovoltaic/thermal system (CPV/T). Sol. Energy 2019, 188, 96–110. [Google Scholar] [CrossRef]
- Steffen, W.; Rockström, J.; Richardson, K.; Lenton, T.M.; Folke, C.; Liverman, D.; Summerhayes, C.P.; Barnosky, A.D.; Cornell, S.E.; Crucifix, M.; et al. Trajectories of the Earth System in the Anthropocene. Proc. Natl. Acad. Sci. USA 2018, 115, 8252–8259. [Google Scholar] [CrossRef] [PubMed]
- Campos, C.S.; Torres, J.P.N.; Fernandes, J.F.P. Effects of the Heat Transfer Fluid Selection on the Efficiency of a Hybrid Concentrated Photovoltaic and Thermal Collector. Energies 2019, 12, 1814. [Google Scholar] [CrossRef]
- Romero-Fiances, I.; Muñoz-Cerón, E.; Espinoza-Paredes, R.; Nofuentes, G.; De la Casa, J. Analysis of the Performance of Various PV Module Technologies in Peru. Energies 2019, 12, 186. [Google Scholar] [CrossRef]
- ASTM G173-03. Standard Tables for Reference Solar Spectral Irradiances: Direct Normal and Hemispherical on 37° Tilted Surface; ASTM International: West Conshohocken, PA, USA, 2012. [Google Scholar]
- ASTM E490-00a. Standard Solar Constant and Zero Air Mass Solar Spectral Irradiance Tables; ASTM Internationa: West Conshohocken, PA, USA, 2014. [Google Scholar]
- Gouvêa, E.C.; Sobrinho, P.M.; Souza, T.M. Spectral Response of Polycrystalline Silicon Photovoltaic Cells under Real-Use Conditions. Energies 2017, 10, 1178. [Google Scholar] [CrossRef]
- Hofmann, M.; Seckmeyer, G. Influence of Various Irradiance Models and Their Combination on Simulation Results of Photovoltaic Systems. Energies 2017, 10, 1495. [Google Scholar] [CrossRef]
- Kaplanis, S.; Kaplani, E. A New Dynamic Model to Predict Transient and Steady State PV Temperatures Taking into Account the Environmental Conditions. Energies 2019, 12, 2. [Google Scholar] [CrossRef]
- Rehan, M.; Jeon, H.; Cho, Y.; Cho, A.; Kim, K.; Cho, J.-S.; Yun, J.H.; Ahn, S.; Gwak, J.; Shin, D. Fabrication and Characterization of Cu2ZnSnSe4 Thin-Film Solar Cells using a Single-Stage Co-Evaporation Method: Effects of Film Growth Temperatures on Device Performances. Energies 2020, 13, 1316. [Google Scholar] [CrossRef]
- Nieto-Nieto, L.M.; Ferrer-Rodríguez, J.P.; Muñoz-Cerón, E.; Pérez-Higueras, P. Experimental set-up for testing MJ photovoltaic cells under ultra-high irradiance levels with temperature and spectrum control. Meas 2020, 165, 108092. [Google Scholar] [CrossRef]
- Rohaeni, S.; Damayanti, N.E.; Syafutra, H.; Hardhienata, H. Simulating the Performance of Al0.3Ga0.7As/InP/Ge Multijunction Solar Cells under Variation of Spectral Irradiance and Temperature. Model. Simul. Eng. 2019. [Google Scholar] [CrossRef]
- Andrews, D.L. Electromagnetic Radiation. In Encyclopedia of Spectroscopy and Spectrometry, 3rd ed.; Academic Press: London, UK, 2017; pp. 427–431. [Google Scholar]
- Marques, L.; Torres, J.P.N.; Branco, P.J.C. Triangular shape geometry in a Solarus AB concentrating photovoltaic-thermal collector. Int. J. Interact. Des. Manuf. 2018, 12, 1455–1468. [Google Scholar] [CrossRef]
- Torres, J.P.N.; Nashih, S.K.; Fernandes, C.A.F.; Leite, J.C. The effect of shading on photovoltaic solar panels. Energy Syst. 2018, 9, 195–208. [Google Scholar] [CrossRef]
- Castro, R. Uma introdução às Energias Renováveis: Eólica, Fotovoltaica e Mini-Hidrica; Instituto Superior Técnico (IST): Lisboa, Portugal, 2011. [Google Scholar]
- Ahmed Elsayed Ghitas, Studying the effect of spectral variations intensity of the incident solar radiation on the Si solar cells performance. NRIAG J. Astron. Geophys. 2012, 165–171.
- Martín, N.; Ruiz, J.M. A new method for spectral characterization of PV modules. Prog. Photovolt. Res. Appl. 1999, 7, 299–310. [Google Scholar] [CrossRef]
- IEC 60904-7. Photovoltaic Devices—Part 7: Computation of the Spectral Mismatch Correction for Measurements of Photovoltaic Devices, 3rd ed.; IHS Markit Inc.: London, UK, 2008. [Google Scholar]
- Rodrigo, P.M.; Fernándes, E.F.; Almonacid, F.M.; Pérez-Higueras, P.J. Quantification of the spectral coupling of atmosphere and photovoltaic system performance: Indexes, methods and impact on energy harvesting. Sol. Energy Mater. Sol. Cells 2017, 163, 73–90. [Google Scholar] [CrossRef]
- Mitsubishi Electric, Modulo PV-MLU255HC. Available online: https://www.mitsubishielectricsolar.com/images/uploads/documents/specs/MLU_spec_sheet_250W_255W.pdf (accessed on 20 March 2018).
- Schott Solar, Modulo Schott ASI® 100. Available online: http://www.solarnipaneli.hr/pdf/shott/SCHOTT%20ASI%20100-107%20data%20sheet%20EN%200111.pdf (accessed on 20 March 2018).
- Fist Solar, Modulo First Solar Series 6™. Available online: http://www.firstsolar.com/en-EMEA/-/media/FirstSolar/Technical-Documents/Series-6-Datasheets/Series-6-Datasheet.ashx (accessed on 20 March 2018).
- Solar Frontier, Modulo SF170-S. Available online: https://www.desolarstore.nl/wpcontent/uploads/2016/09/1400591520wpdm_solar-frontier-sf170-s-eng.pdf (accessed on 20 March 2018).


© 2020 by the authors. Licensee MDPI, Basel, Switzerland. This article is an open access article distributed under the terms and conditions of the Creative Commons Attribution (CC BY) license (http://creativecommons.org/licenses/by/4.0/).