Article

Experimental Investigation on Influence of Shed Parameters on Surface Rainwater Characteristics of Large-Diameter Composite Post Insulators under Rain Conditions

1
School of Electric Power, South China University of Technology, Guangzhou 510640, China
2
Electric Power Research Institute, China Southern Power Grid Co., Ltd., Guangzhou 510080, China
*
Author to whom correspondence should be addressed.
Energies 2020, 13(19), 5011; https://doi.org/10.3390/en13195011
Submission received: 1 August 2020 / Revised: 10 September 2020 / Accepted: 22 September 2020 / Published: 24 September 2020
(This article belongs to the Section F: Electrical Engineering)

Abstract

:
The discharges of water columns and droplets between the sheds make the leakage distance not effectively used, which is one of the main reasons for flashover of composite post insulators under heavy rainfall. To study the influence of shed parameters on surface rainwater characteristics, artificial rain tests were carried out on the large-diameter composite post insulators under the rainfall intensity of 2–15 mm/min. Lwc (the length of water columns at the edge of large sheds), Nwc (the number of water columns at the edge of large sheds), Nwde (the number of water droplets at the edge of large sheds) and Nwds (the number of water droplets in the space between two adjacent large sheds) were proposed as the parameters of surface rainwater characteristics. The influences of large shed spacing, large shed overhang and rod diameter on the parameters of surface rainwater characteristics under different rainfall intensities were analyzed. The experimental results show that, under the same rainfall intensity, with the rise in large shed spacing, large shed overhang or rod diameter, Lwc, Nwc, Nwde and Nwds all increase. Under different rainfall intensities, the trends of the parameters with the change in shed parameters are basically invariant; however, the change ranges of the parameters are different. The increases in the parameters with the rises in shed parameters and rainfall intensity are mainly attributed to the change in the rainfall on the insulator surface. The experimental results can provide references for the quantitative description of surface rainwater characteristics and the design of large-diameter composite post insulators for DC transmission systems.

1. Introduction

Post insulators are important pieces of equipment for substations and converter stations and play an important role in mechanical support and electrical insulation [1]. Under meteorological conditions, such as fog, rain, and ice, the insulation performance of insulators will decrease, which may lead to flashover accidents, seriously affecting the safe and stable operation of the power system [2,3,4,5,6,7].
In recent years, affected by the greenhouse effect and El Niño phenomenon, global climate change is intense, and extreme precipitation events occur frequently [8]. Flashover accidents of insulators in power stations under heavy rainfall have been reported frequently. McDermid et al. made statistics on the flashover accidents with clear causes in the converter station of the Nelson River HVDC (high voltage direct current) transmission system from 1975 to 2013, of which rain flashover accounted for about 50% [9,10]. In September 2003, heavy rain fell in France and Italy, resulting in the interruption of traffic and communication and the failure of the high-voltage power transmission project from France to Italy [11]. In November 2009, a rain flashover accident of composite insulators occurred in the Brazilian power grid, causing power outages in about 2/3 of the states [11]. According to the statistics of China Electric Power Research Institute, there were 84 flashover accidents in China’s AC (alternating current) 330 kV and 500 kV substations and DC (direct current) ±500 kV converter stations, of which 81.0% were caused by rain [12]. After 2000, rain flashover accidents occurred in the Longquan, Tianshengqiao and Suidong converter stations in China, causing huge economic losses [13,14]. The flashover of external insulation caused by heavy rainfall has become one of the vulnerabilities of EHV (extra-high voltage) and UHV (ultra-high voltage) DC transmission systems. Based on the references related to the rain flashover accident, it can be seen that the main parameters (such as shed spacing, shed overhang and section modulus) and the technical indexes (such as power frequency wet withstand voltage and switching impulse wet withstand voltage) of insulators that have experienced rain flashover in stations match the requirements of the standard IEC60815 [15]. Unfortunately, the parameters and technical indexes specified in the above standard cannot fully guarantee the safe operation of the external insulation equipment under heavy rainfall.
In view of the rain flashover of insulators, a lot of research has been carried out. According to De la O’s experiments of the pollution flashover in the fog and the rain flashover under a rainfall intensity of 5 mm/min, the flashover of contaminated insulators can occur under the rain at a much lower contamination severity than that in the fog [16]. Besides, the main reason of rain flashover was that the creepage distance was not effectively utilized due to the discharge between sheds caused by water columns and droplets. Ishiwari et al. carried out the artificial rain flashover tests on porcelain and composite insulators, and found that the rainfall intensity, the rain angle, and the shed parameters of insulators influenced the withstand voltage [17]. Okada et al. conducted the rain flashover tests on the composite, porcelain and glass insulators, and found that the size of raindrops had no obvious effect on the change in insulator surface resistance with time [5]. The rainwater bridging sheds, or flow along the surface of insulators, may cause the decrease in the rain flashover voltage [5].
Lan et al. pointed out, through simulation calculation, that the presence of water columns and water droplets had a great influence on the electric field distribution of insulators [18]. According to the artificial rain flashover tests under the rainfall intensity of 3 mm/min, Fan et al. found that, when the shed spacing was small, the two adjacent sheds were easily bridged by rainwater, resulting in a reduction in the rain flashover voltage per unit of creepage distance. In the selection of shed parameters of post insulators [19]. Zhang et al. carried out rain flashover tests of composite post insulators at high altitudes, and pointed out that the rain conductivity, the rainfall intensity, and the shed parameters had a significant effect on rain flashover voltage. Considering the air gap discharge between sheds caused by water column discharge, a model to describe the DC flashover process of the post insulator in rain was carried out, based on the classical model of pollution flashover [20,21].
In summary, the water columns and water droplets between the sheds caused by rain have a great impact on the rain flashover voltage of post insulators. However, there is no quantitative study on the surface rainwater characteristics of insulators. Besides, there are few reports on the influence of the parameters of sheds on the distribution of the water column and water droplets between sheds under different rainfall intensities. In view of the needs of theoretical research and engineering application, in this paper, the large-diameter composite post insulators widely used in UHV converter stations were the test samples. The tests of surface rainwater characteristics under different rainfall intensities were carried out, and the parameters of surface rainwater characteristics were proposed. Furthermore, the influences of shed parameters and rainfall intensity on the parameters of surface rainwater characteristics were systematically studied. The research results can provide references for the quantitative description of surface rainwater characteristics and the design of large-diameter composite post insulators.

2. Experiment Setup

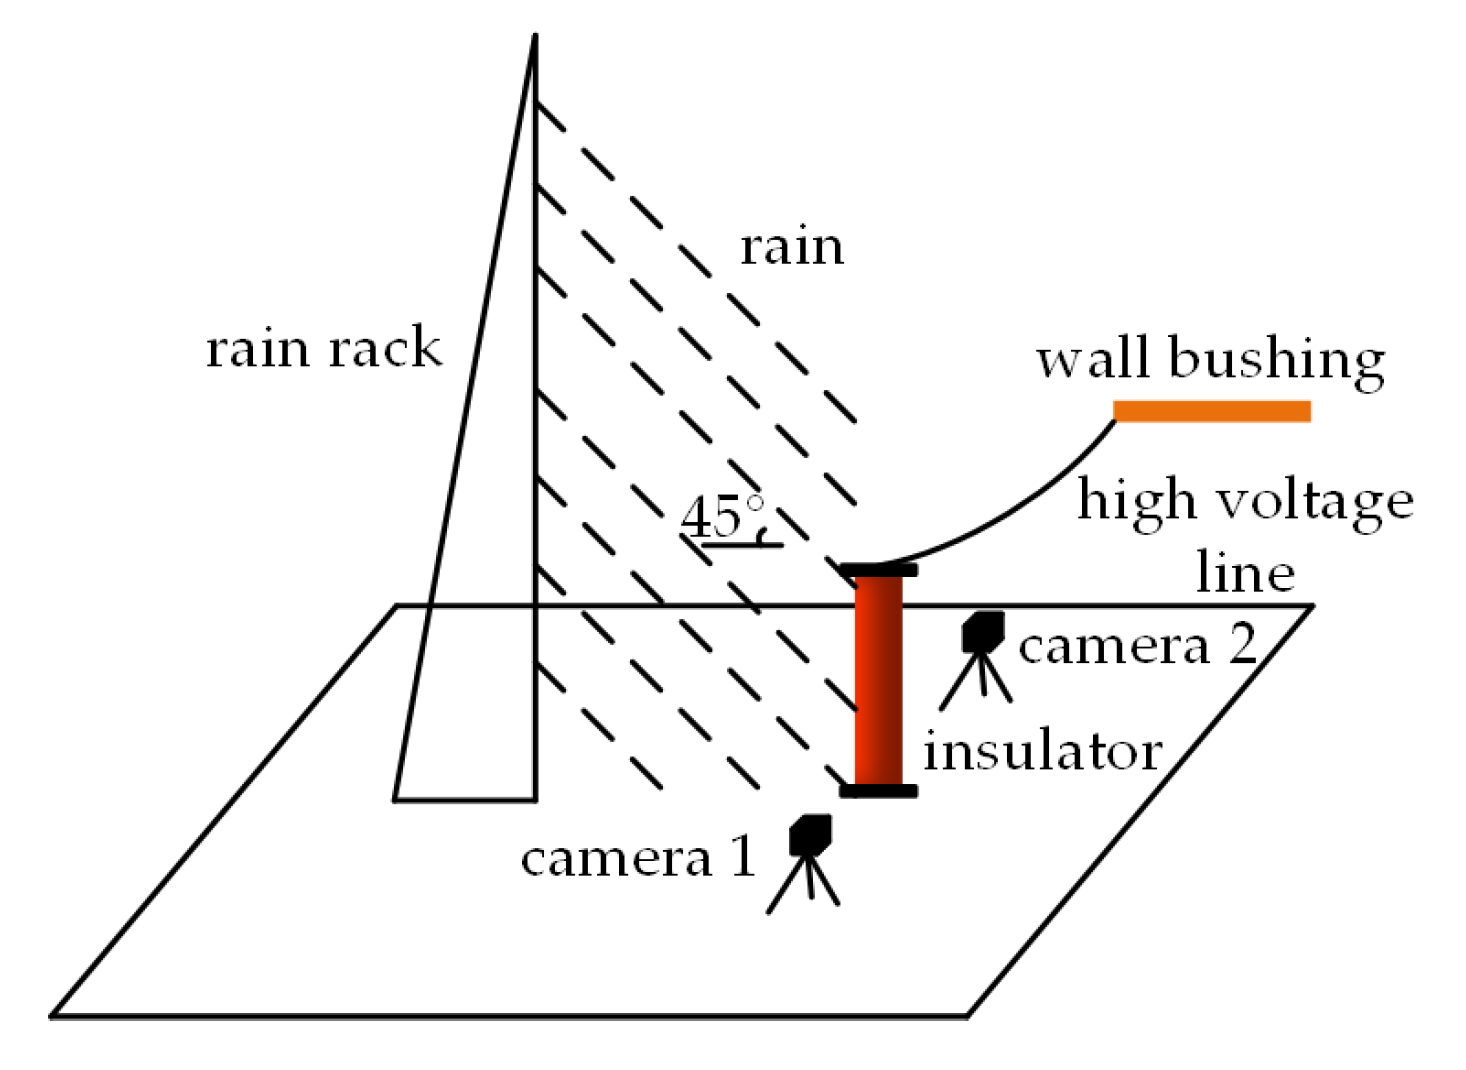
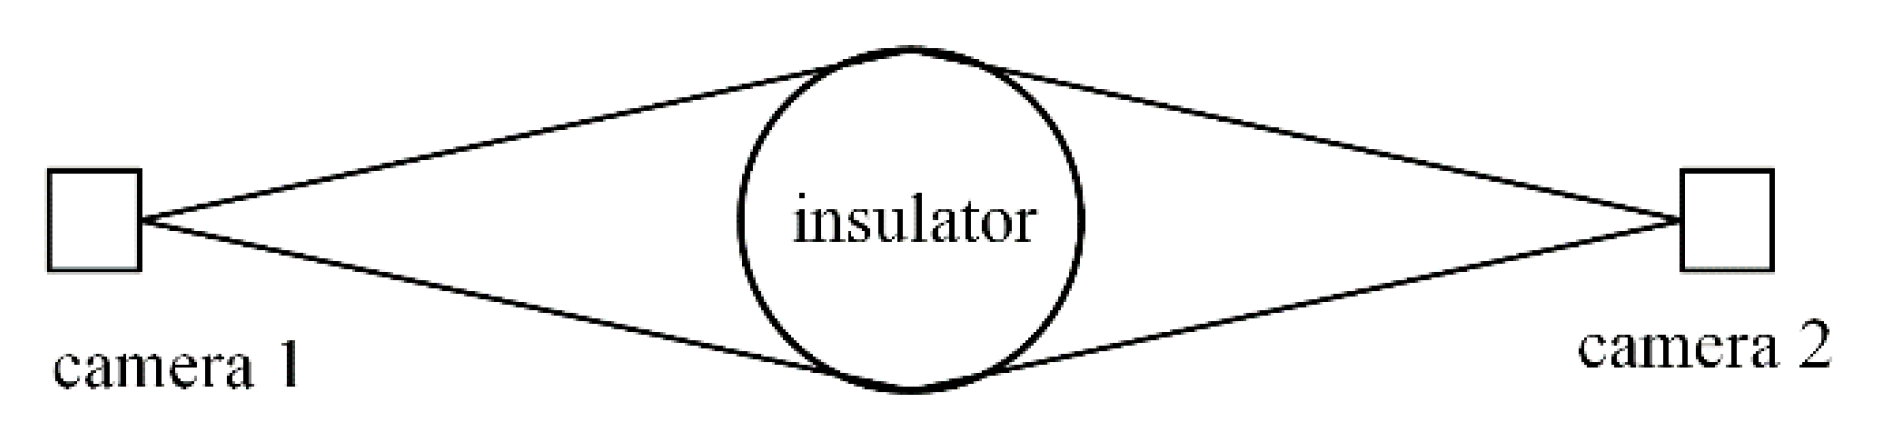
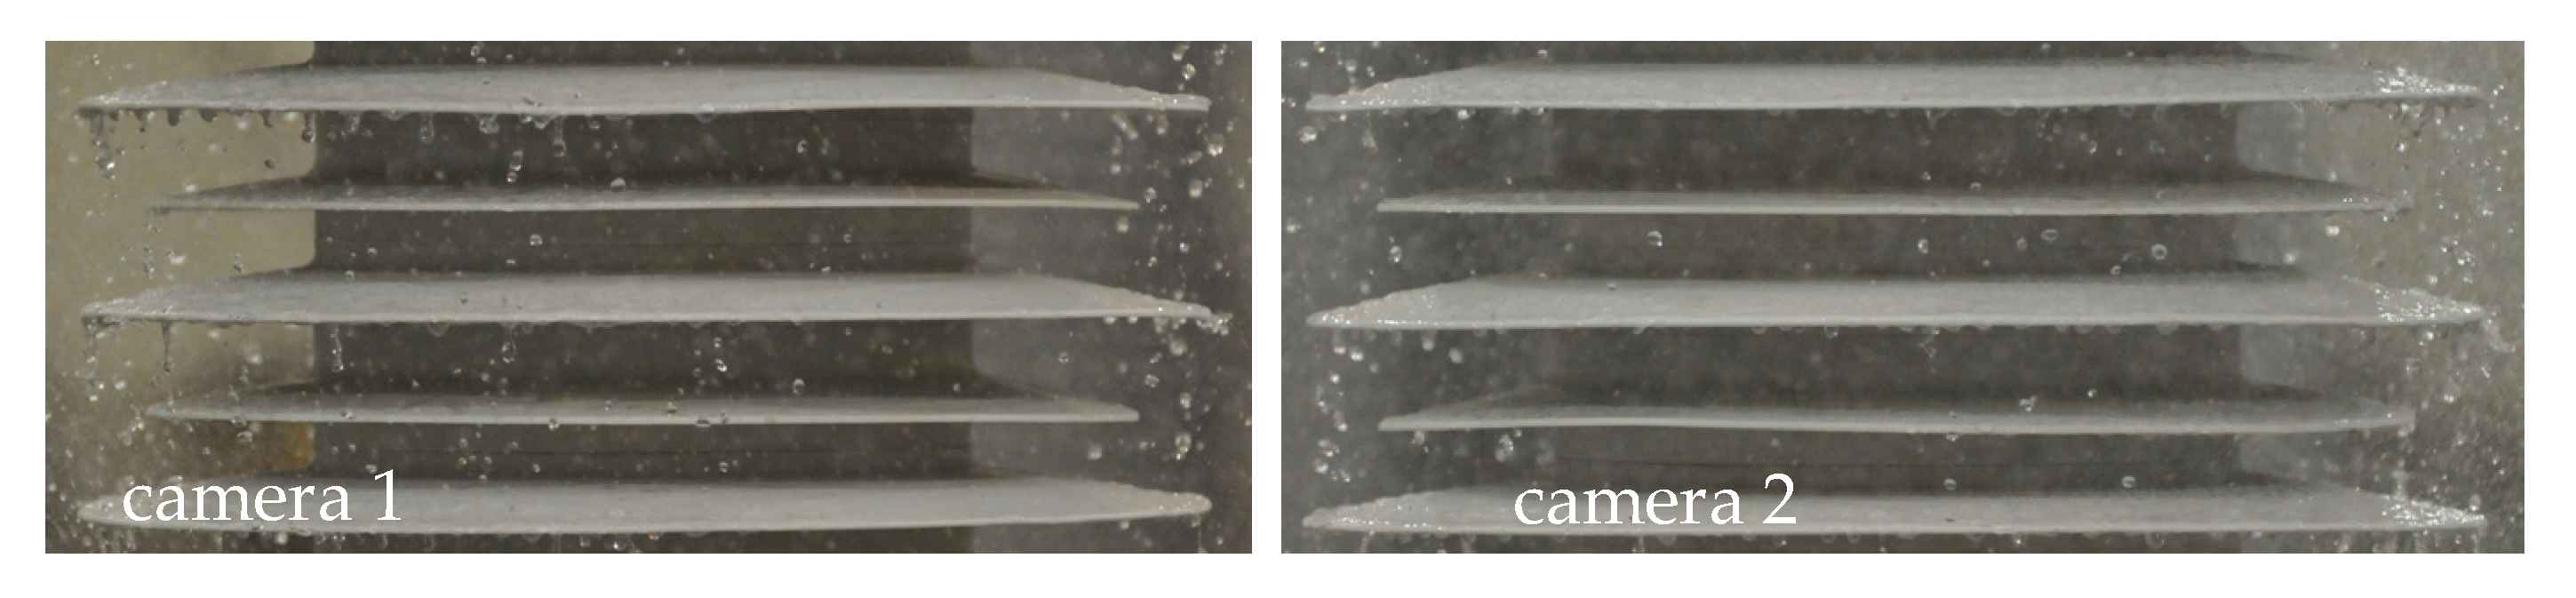
2.1. Test Arrangement
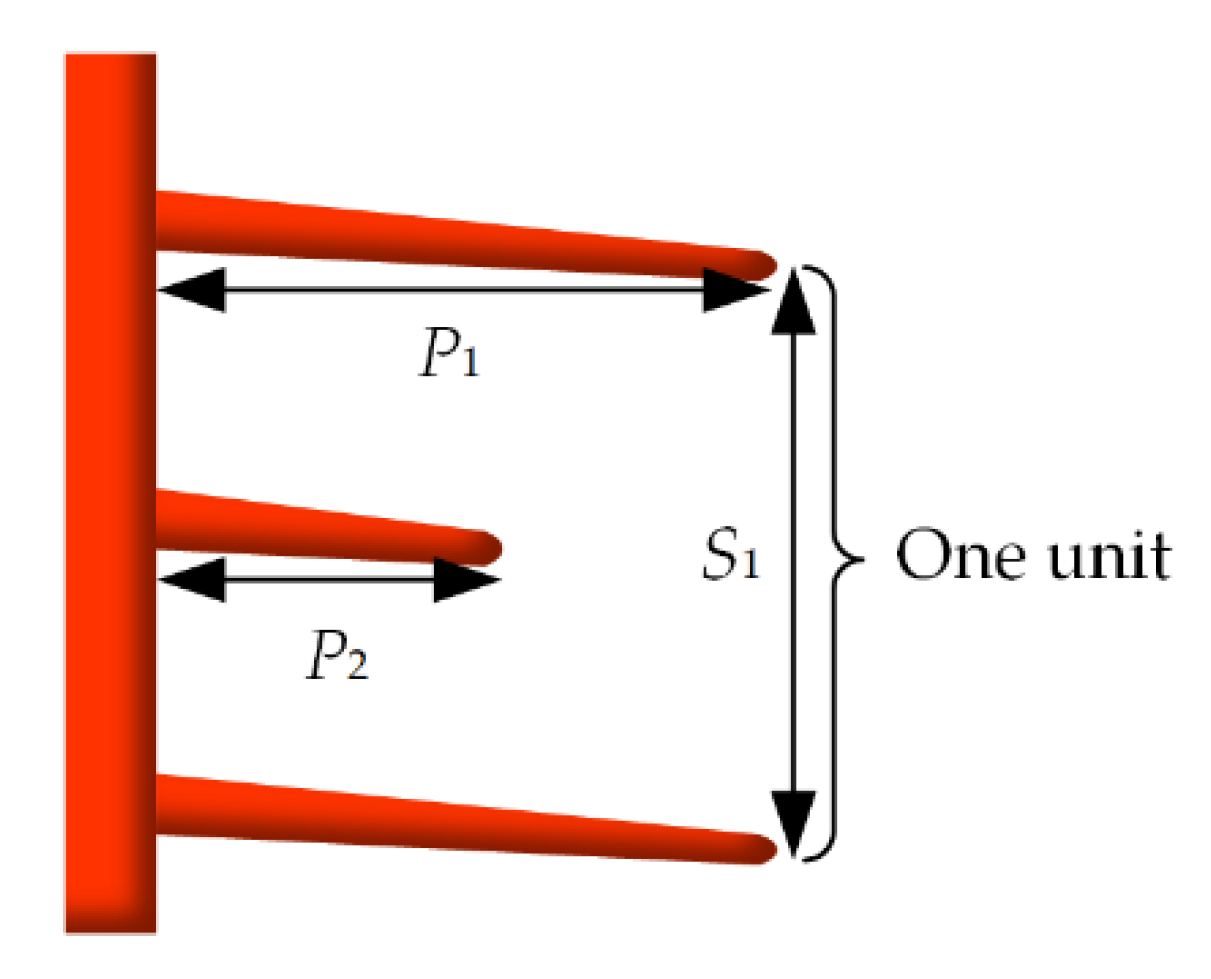
The tests were carried out in the AC/DC artificial pollution laboratory of the National Engineering Laboratory for Ultra-High Voltage Engineering Technology [22]. The test arrangement is shown in Figure 1. The insulator was placed vertically on the horizontal ground in front of the rain rack, and the horizontal distance between the insulator and the rain rack was about 6 m. The nozzles of the rain rack were the shape and structure recommended in the standard GB/T 775.2-2003 [23], the water output was adjustable, and the raindrops sprayed were dense and uniform, which met the requirements of the artificial rain test. During the tests, the temperature of the laboratory was 25 ± 5 °C, and the relative humidity was 76% to 92%.
Two Nikon D700 cameras were used to take pictures of the insulators in the rain. The two cameras were installed on tripods and placed on the left and right sides of the insulator, respectively. The two cameras were in a straight line with the insulator, and this straight line was parallel to the plane where the rain rack was located. Rainwater along the edge of the insulator sheds and within the air gap was recorded by the two cameras, and the schematic diagram is shown in Figure 2. The photos taken by the two cameras at the same time are shown in Figure 3. It can be seen from Figure 3 that the camera lens is focused on the front sheds, and the rainwater situation on the other side is not effectively photographed. Each photo only counts the rainwater situation of the half circle of the insulator shed; therefore, the water column and droplet will not be calculated repeatedly.
Moreover, the tap water was used to simulate rainwater, and the water conductivity was 157 μS/cm at 20 °C. According to the standard GB/T 775.2-2003 [23], the rainfall rate was adjusted and measured to reach the predetermined rain condition. In order to simulate the presence of wind, the angle of the rain was 45°, and the horizontal component was the same as the vertical component.

2.2. Test Samples

In this paper, the samples were designed based on the parameters of large-diameter composite post insulators currently in operation at a converter station of a ±800 kV UHVDC transmission system. The samples were all alternating in large and small sheds design and were made of silicone rubber with good hydrophobicity; all of them were HC1 grade. The inclination angle of the upper surface of the shed was about 11°. The shed shapes of specimens are shown in Figure 4, and the parameters of the samples are shown in Table 1.
In Table 1, S1 is the spacing between large sheds, S2 is the spacing between large shed and small shed, P1 is the overhang of large shed, P2 is the overhang of small shed, l is the creepage distance, h is the insulation height, and D is the rod diameter, Cf is creepage factor. Cf is calculated by the equation:
C f = l / h

2.3. Test Procedures

(1) In order not to destroy the surface hydrophobicity of the silicone rubber sheds of the insulator, before each test, absorbent cotton was used to gently dry the water film on the surface and the hanging water column and water drop on the edge of sheds, and then we let the insulator dry naturally.
(2) The appropriate exposure time of the camera was selected, then the focal length, aperture, sensitivity, white balance, and other parameters were adjusted. During the tests, the exposure time was invariant, and according to the light intensity of the scene, other parameters were adjusted to ensure that the photos were clear enough.
(3) According to the actual operation, the insulator was applied with a constant voltage of DC 70 kV by the DC power supply system.
(4) After the voltage was stable, the adjusted artificial rain system was turned on. When the surface of the insulator was fully wet, photos of the insulator in the rain were taken by the two cameras. To reduce the dispersion, the tests were repeated three times under each condition, and at least 10 valid photos were taken by each camera in each test.

3. Selections of Exposure Time and Parameters of Surface Rainwater Characteristics

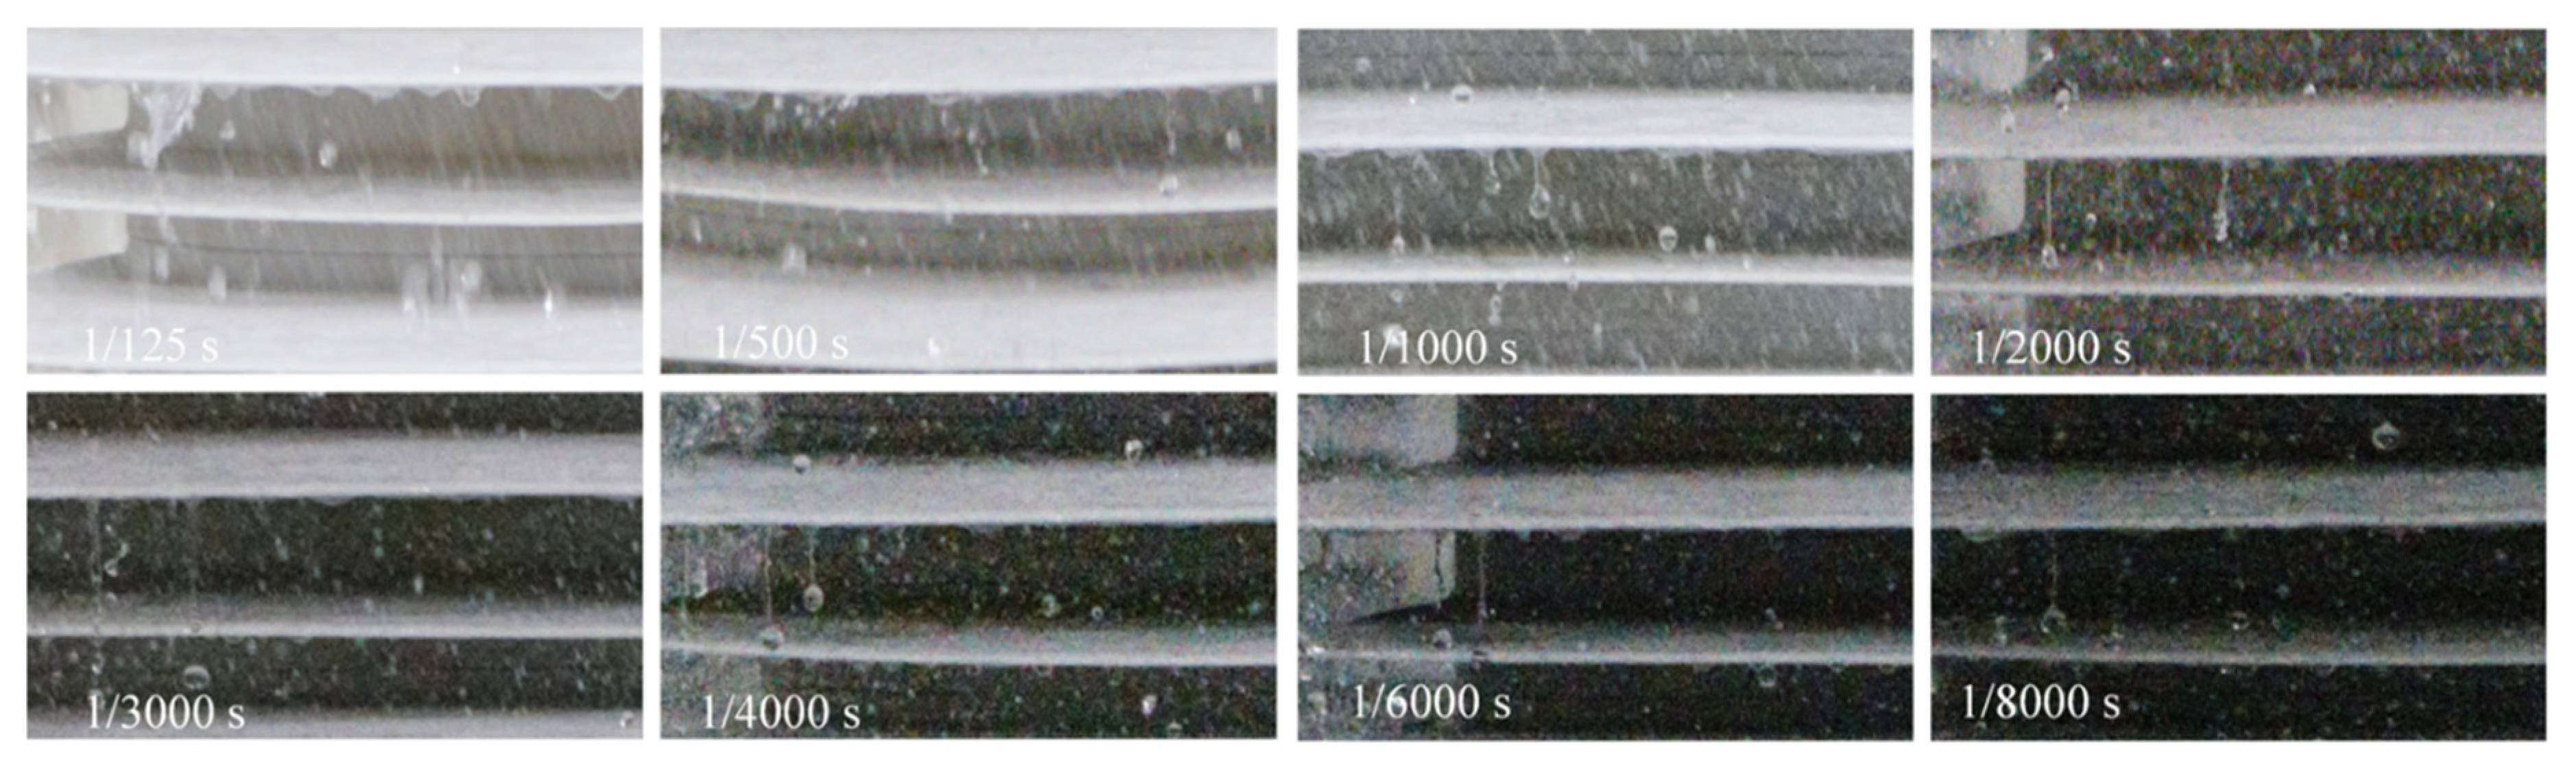
3.1. Selection of Exposure Time

The time interval between the camera shutter opening and closing is the exposure time. In rain characteristic tests, raindrops ejected from the nozzles of rain rack, water columns and water droplets hanging on the edge of the insulator shed are all dynamic. The exposure time determined by the shutter speed will affect the accuracy of rain characteristic parameters recorded in the photos. Therefore, the appropriate exposure time must be selected by reasonably setting the shutter speed of the camera.
In order to select the appropriate exposure time, this paper used the exposure times of 1/125, 1/500, 1/1000, 1/2000, 1/3000, 1/4000, 1/6000, and 1/8000 s to take photos of sample A3 under rainfall of 15 mm/min, respectively. The rainwater on the surface of sample A3 under each exposure time are shown in Figure 5.
It can be seen from Figure 5 that, when the exposure time is greater than 1/2000 s, the movement tracks of water droplets overlap and the contours of water droplets and water columns are blurred, so it is impossible to accurately calculate the numbers and lengths of them. When the exposure time is less than 1/2000 s, the shapes and movement tracks of water droplets and water columns are clearly recorded, however, the photos are darker and the noise within the photos increases. Therefore, considering the accuracy of information recorded and the quality of photos, the exposure time selected in the tests was 1/2000 s.

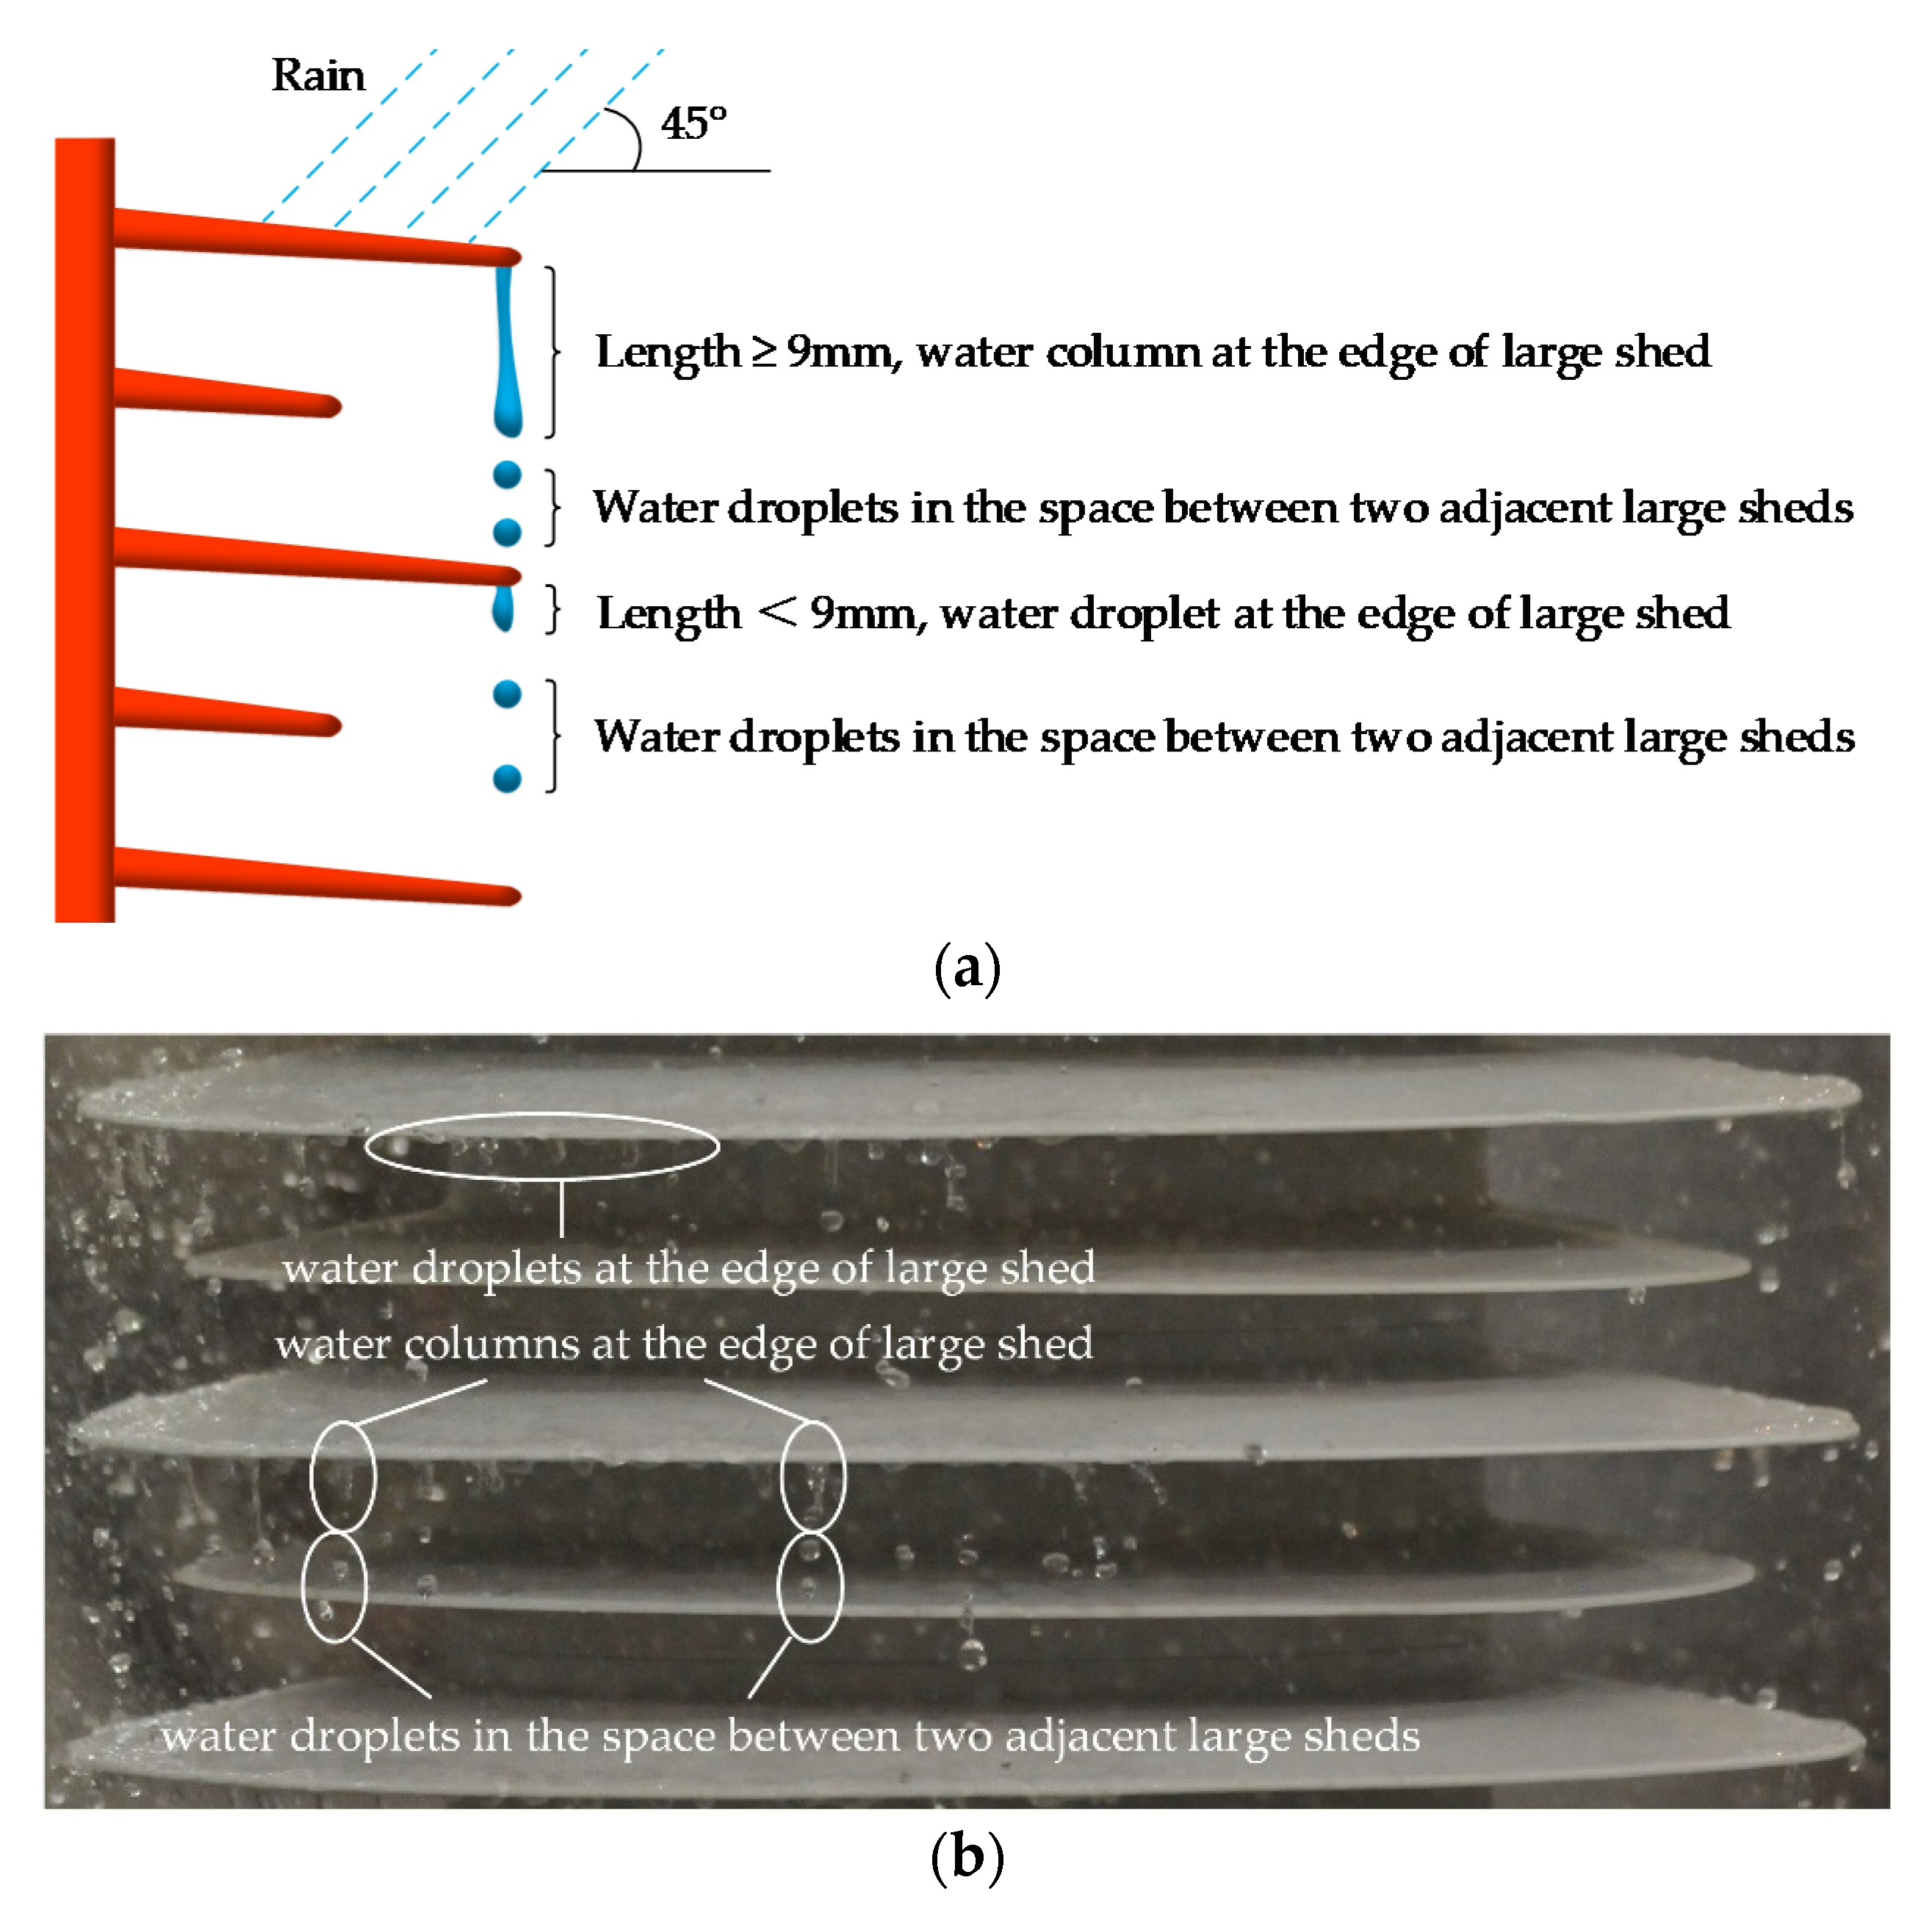
3.2. Selection of Parameters of Surface Rainwater Characteristics

3.2.1. The Length of Water Columns at the Edge of Large Sheds (Lwc)

When the contaminated insulator is exposed to the rain, there will form a “water column-air gap” between insulator sheds. In this case, the air gap plays the main role in insulation [24]. Upon falling, the conductive rainwater may bridge the air gap between sheds, causing the decrease in the insulation performance between two adjacent sheds. The longer the water column is, the shorter the air gap is and the easier it is to be broken down, eventually leading to flashover [4,21,24,25]. The length of water columns between sheds has an important effect on the insulation performance. So, the length of water columns at the edge of large sheds (Lwc) is taken as one of the parameters of surface rainwater characteristics. In order to reflect the bridging degree of two adjacent sheds, the ratio of Lwc to the spacing (Rwc) is also considered as one of parameters of surface rainwater characteristics.

3.2.2. The Number of Water Columns at the Edge of Large Sheds (Nwc)

Multiple water columns may be formed at the edge of large sheds when the insulator is in the rain, thus many “dirty water column-air gaps” between the same unit can be regarded as a parallel connection. The increase in water columns is equivalent to the increase in parallel branches, which increases the possibility of the arc bridging of sheds. Therefore, the number of water columns at the edge of large sheds (Nwc) is taken as one of parameters of surface rainwater characteristics.

3.2.3. The Number of Water Droplets at the Edge of Large Sheds (Nwde)

The authors in [20,21] pointed out that, during the flashover process of insulators, the maximum field strength of the water droplet surface at the edge of the shed appears near the apex of the water droplet instead of at the side of the water droplet. The path of discharge is mostly the air gap from the upper shed to the adjacent lower shed, rather than along the surface of the insulator [26]. Such discharge easily causes the bridging between the sheds. The water droplets at the edges of sheds are an important reason for the partial discharge and the development of the arc along the air gap between sheds. Therefore, the number of water droplets at the edge of large sheds (Nwde) is taken as one of the parameters of surface rainwater characteristics.

3.2.4. The Number of Water Droplets in the Space between Two Adjacent Large Sheds (Nwds)

Under the action of gravity and surface tension, the water columns at the edge of sheds will break when they are extended to a certain length. When the water columns break, water droplets will fall into the space between the sheds. The water droplets at the edge of sheds may also drop in the spaces between the sheds. If the water droplets in the space between two adjacent sheds are too dense, the air gap between the sheds will be shortened correspondingly, which is also detrimental to the insulation. Therefore, the number of water droplets in the space between two adjacent large sheds (Nwds) is taken as one of the parameters of surface rainwater characteristics. In order to reflect the distribution density of water droplets in the vertical direction, the number of water droplets per unit of insulation height (Nwds) is also taken into account as one of the parameters.

3.2.5. The Definition of Water Column and Water Droplet

There were water columns and water droplets hanging at the edge of large sheds. In this paper, the length was used to distinguish them. The shed parameters of other samples in this paper were designed on the basis of sample A3, with a large shed spacing of 90 mm. At first, the rain test was carried out on sample A3. It was found that the diameter of the spherical droplet on the edge of the sheds was basically less than 9 mm by measuring. When the spherical droplet was too large, it would deform and elongate under the action of the surface tension and gravity. In order to unify the judgment standard of water column on the surface of different samples, the deformed droplet, whose length was more than 10% of the large shed spacing of A3, was defined as the water column.
Besides, the diameter of spherical water droplets on the surface of insulators was measured in the rain tests, and it found that the diameter was basically greater than 2 mm. For the convenience of measurements and statistics, only water droplets with a diameter greater than 2 mm were counted. The parameters of surface rainwater characteristics are shown in Figure 6a, and the actual water columns and water droplets are shown in Figure 6b.
Each parameter of surface rainwater characteristics was obtained by the functions of image editing, pixel measurement, and spacing calculation of ImageJ and Photoshop software. The parameters under a test condition were the average value of the corresponding parameters measured from all the photos obtained from the 3 tests under this condition. For example, the length of water columns at the edge of large sheds (Lwc) was calculated by the equation:
L wc = 1 3 i = 1 3 L wc i = 1 3 i = 1 3 ( 1 20 m = 1 20 L wc i m )
where Lwci was the average length of water columns at the edge of large sheds of all photos taken by two cameras in test i; Lwcim was the average length of water columns at the edge of large sheds in the photo m of the test i. Other parameters of surface rainwater characteristics were calculated by a similar method. In addition, based on the Bessel formula [27], the relative standard deviation error (σ1) was employed to represent the dispersion of Lwci, and σ1 can be calculated by the equation:
σ 1 = 1 L wc i = 1 3 ( L wc i L wc ) 2 2
Based on the same method, the relative standard deviation error of Nwc, Nwde and Nwds can be obtained, defined as σ2, σ3 and σ4, respectively.

4. Experimental Results and Analyses

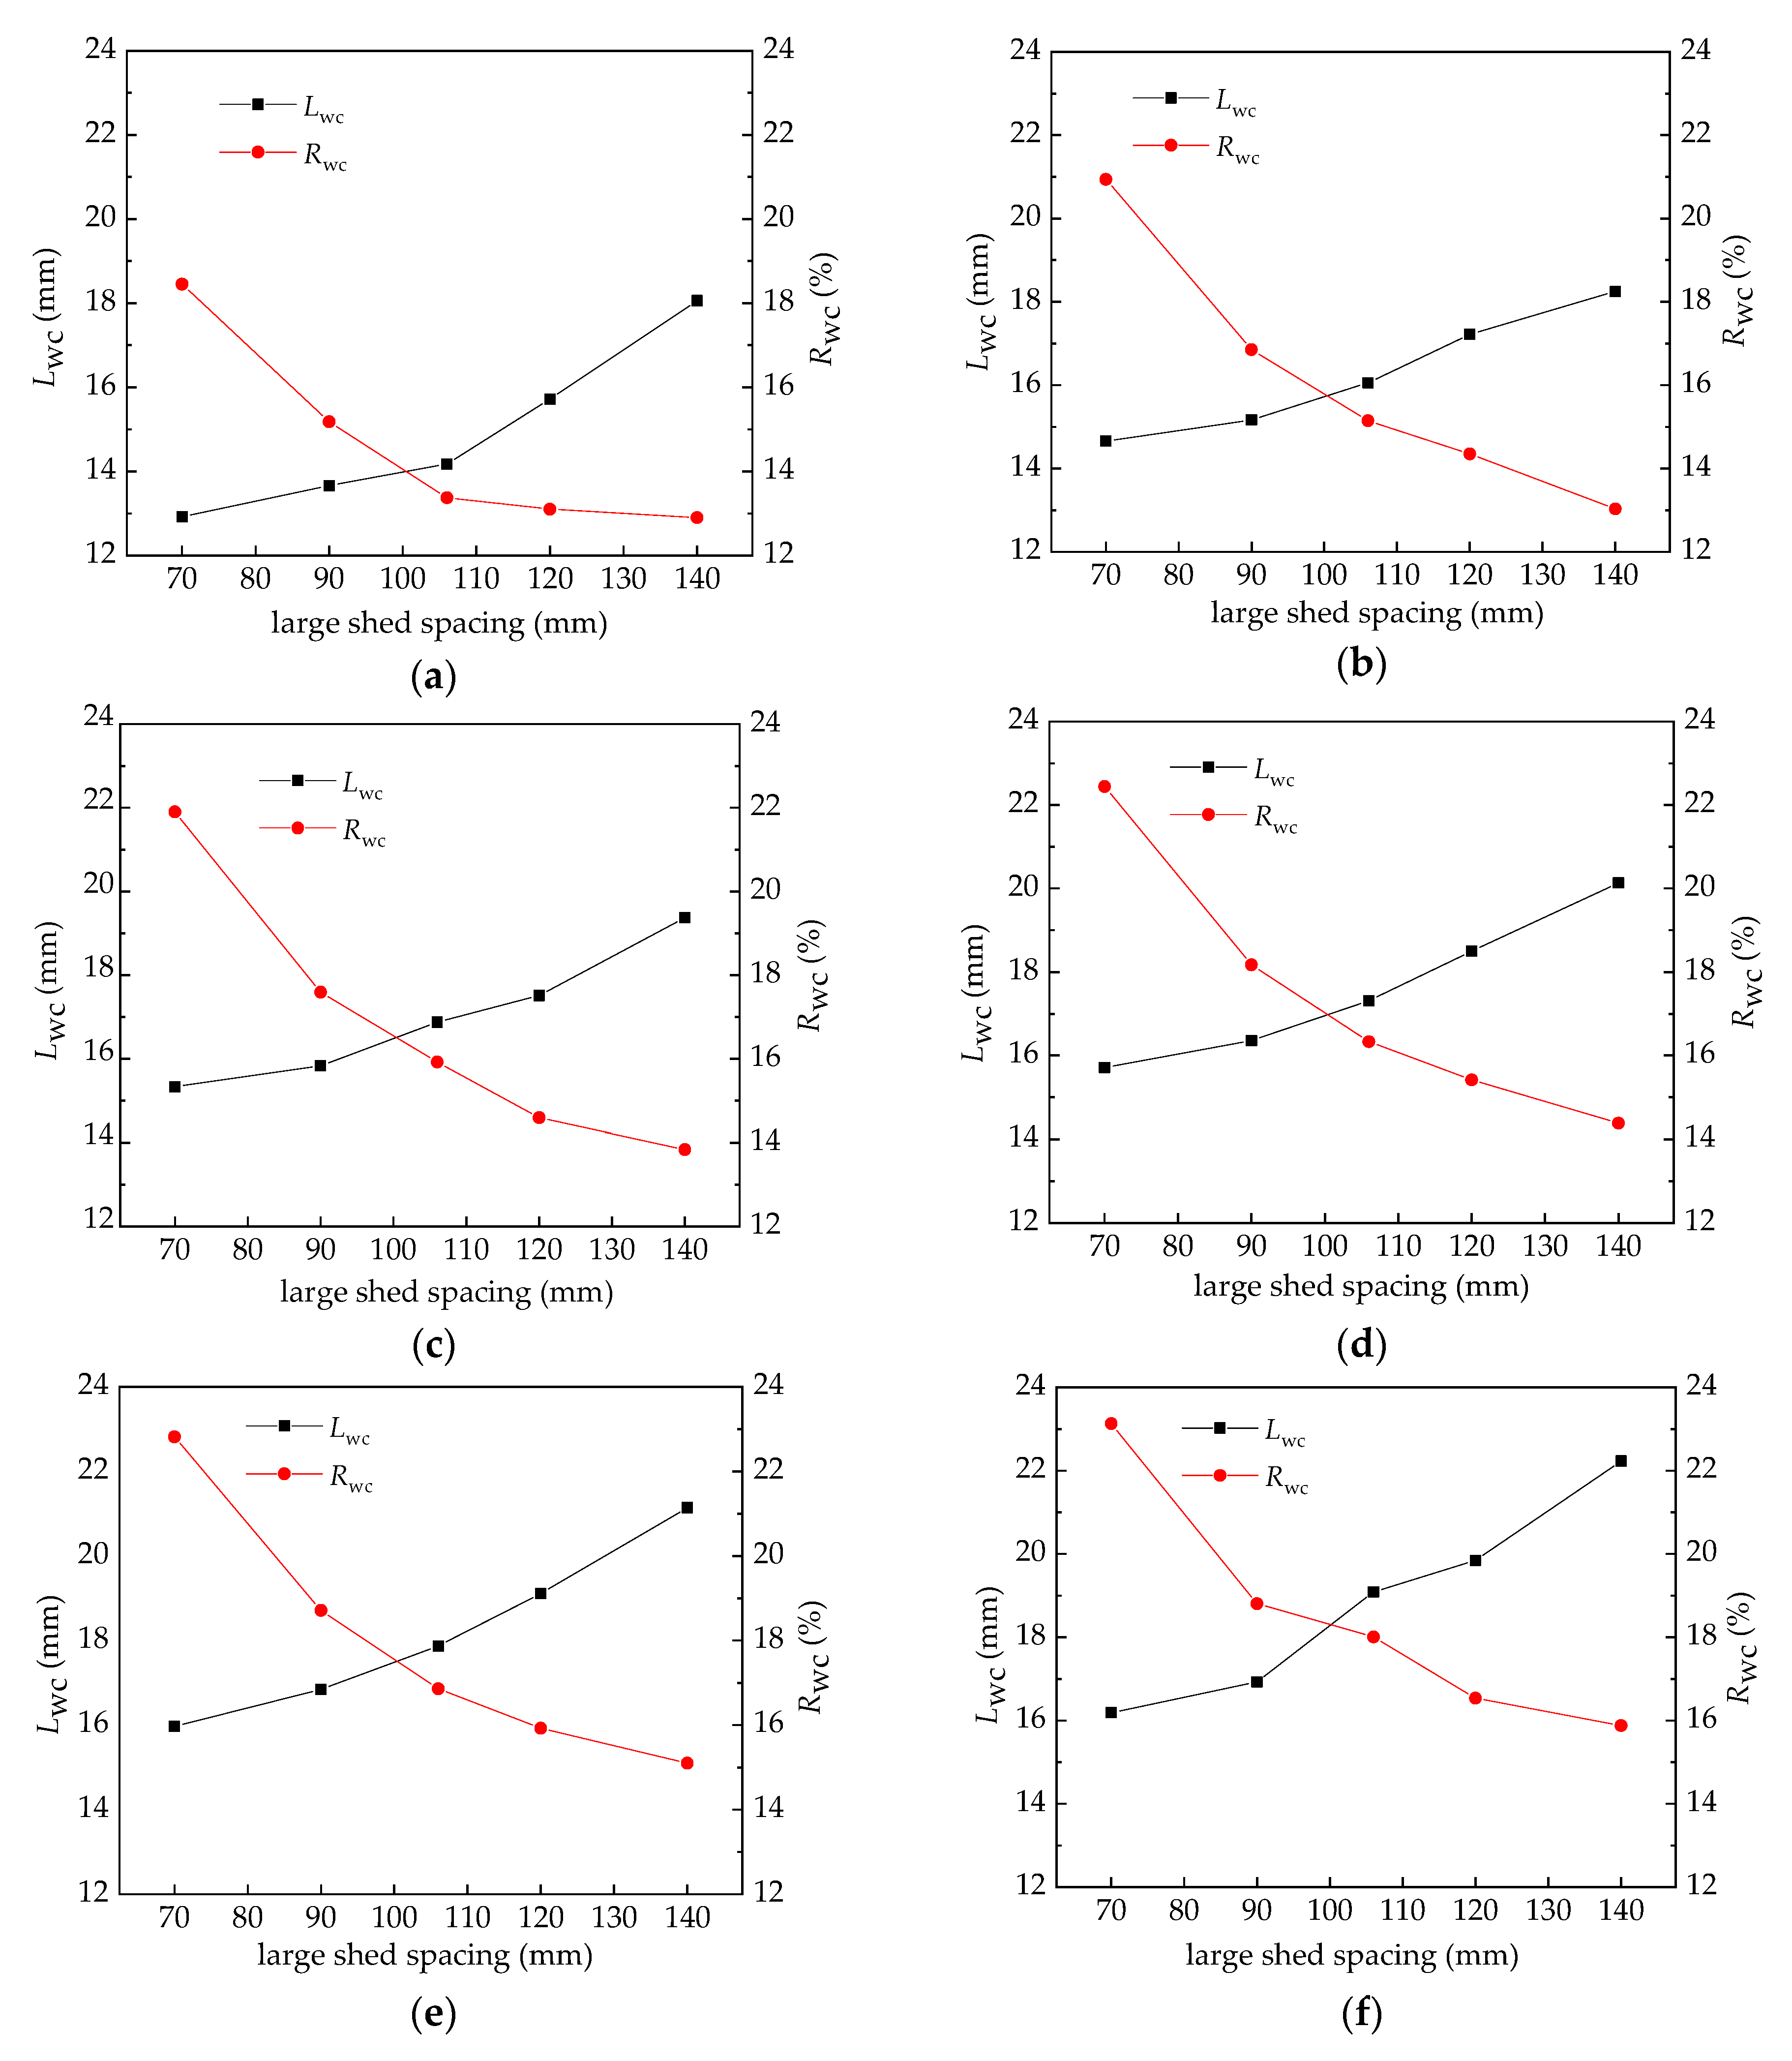
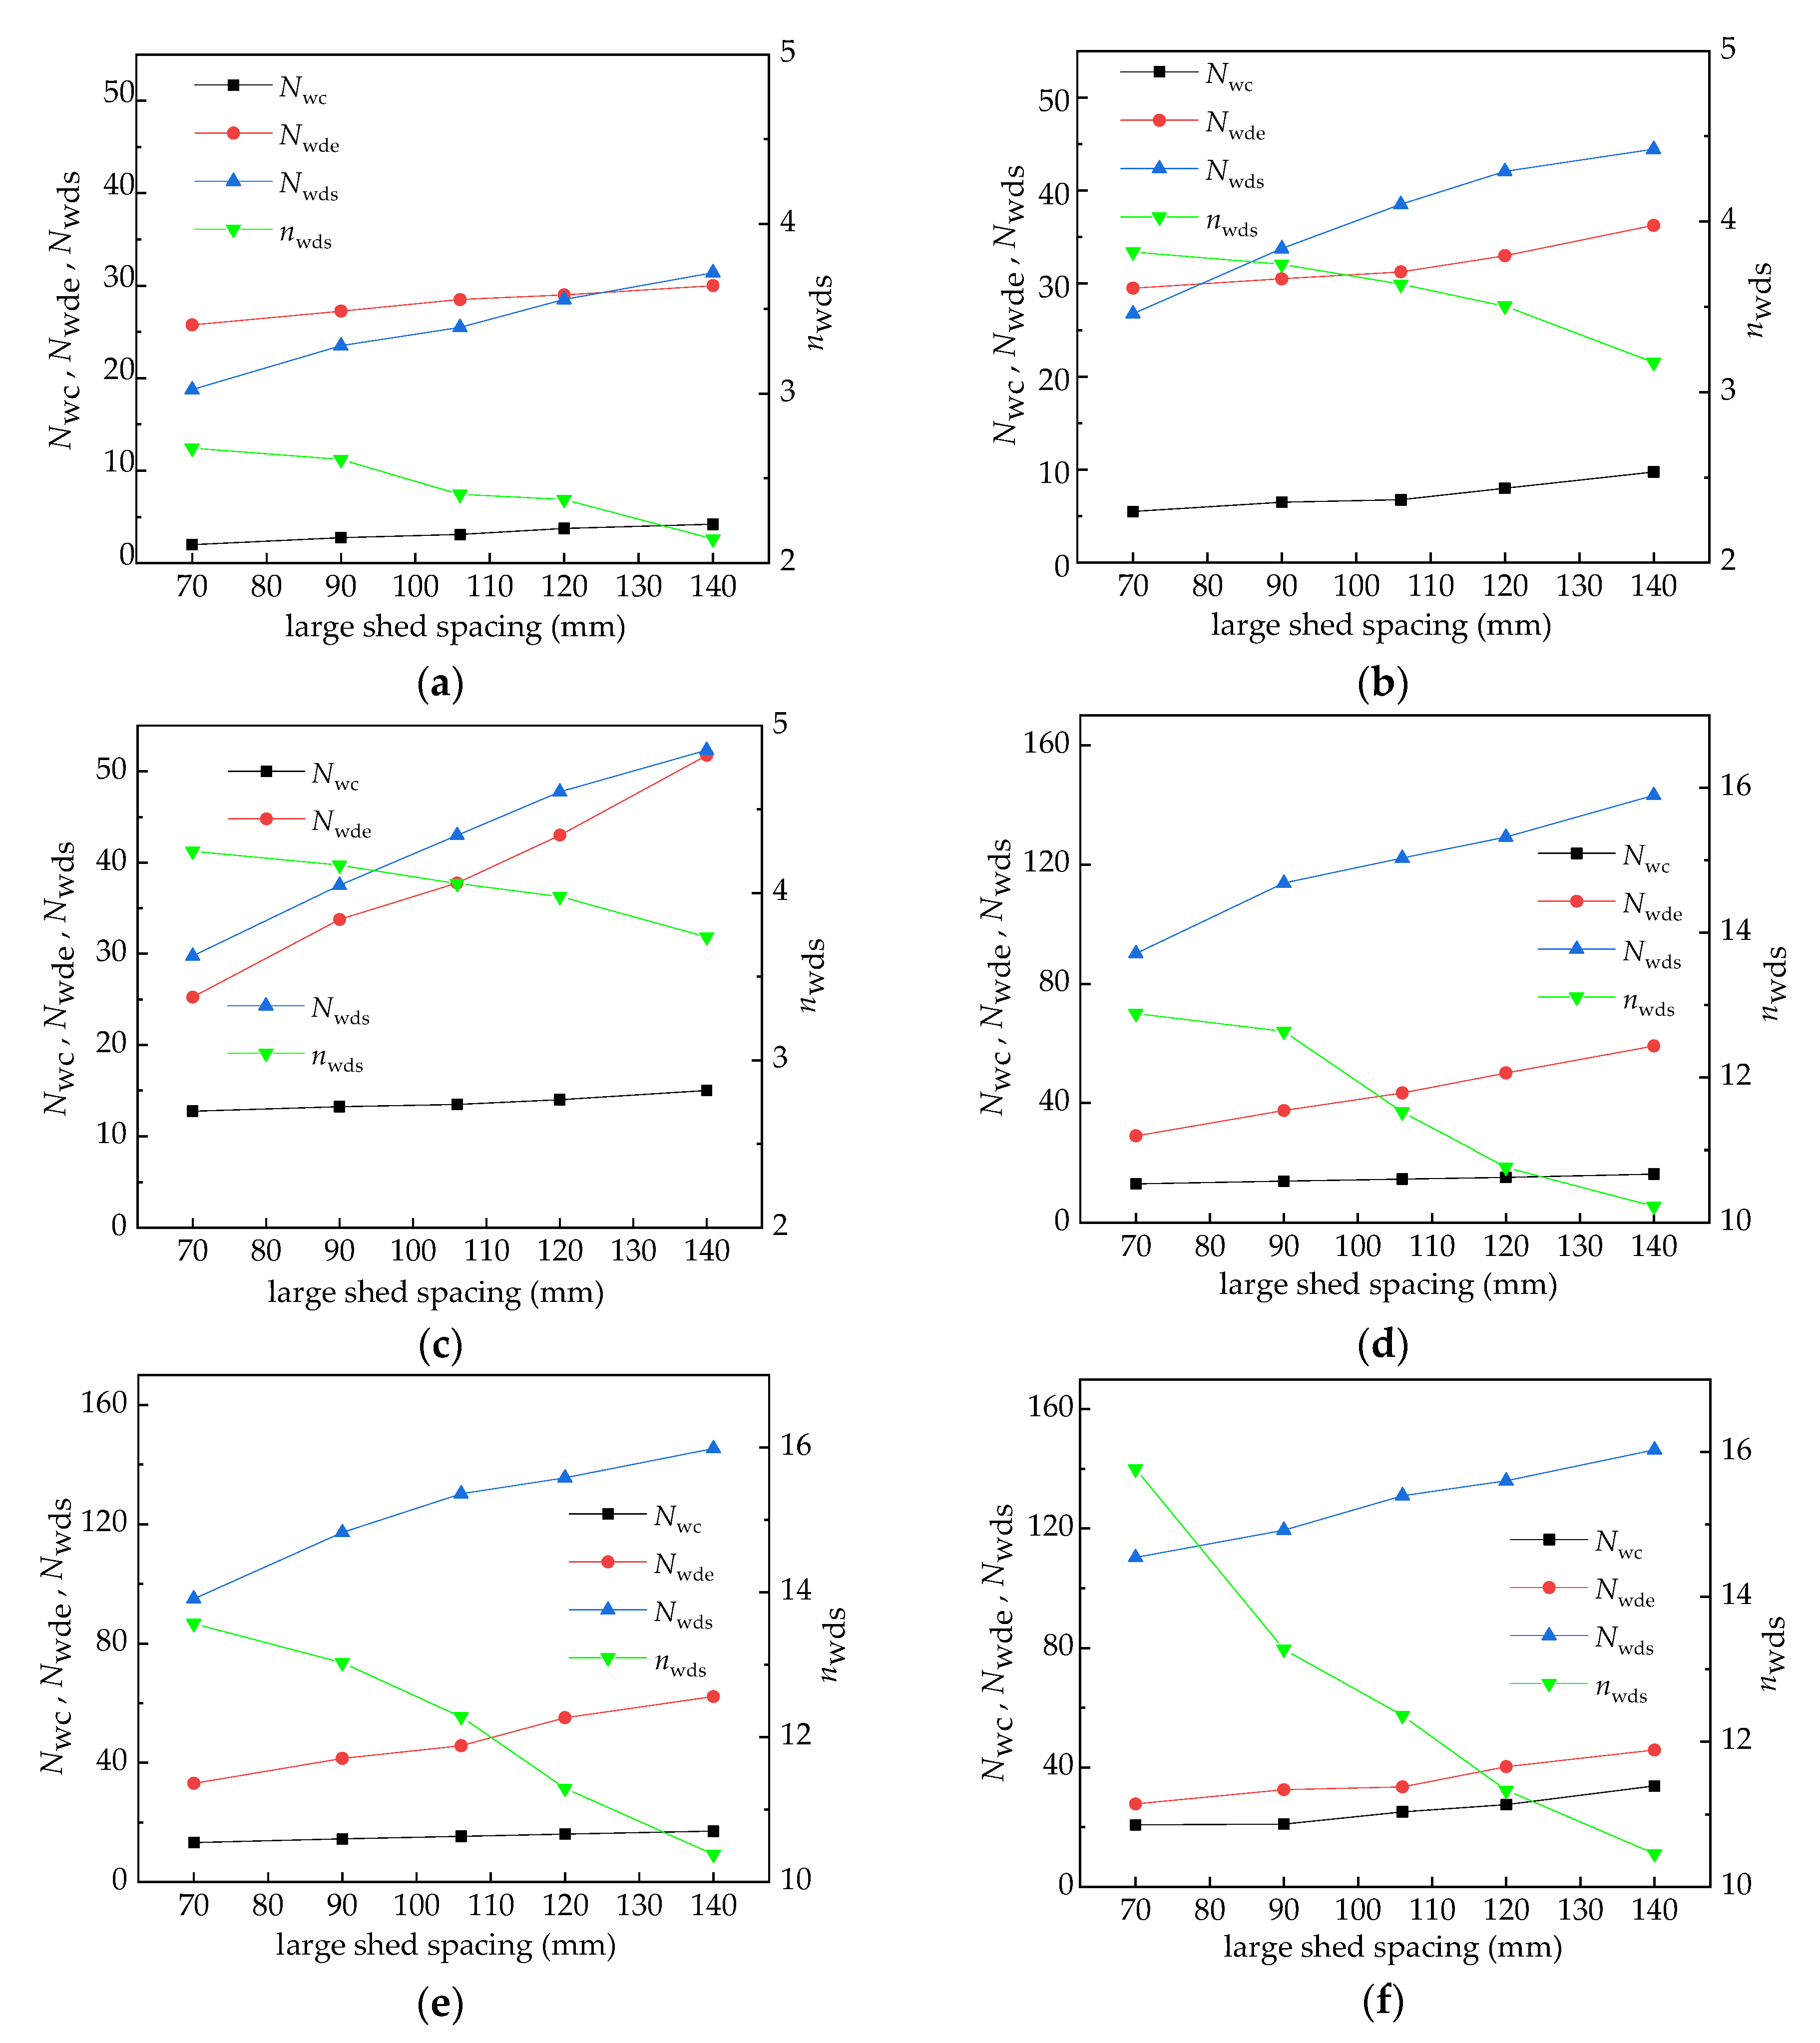
4.1. Influence of Large Shed Spacing on Parameters of Surface Rainwater Characteristics

The samples A3, A6–A9 have the same large shed overhang and rod diameter, but different large shed spacing. The test results under different rainfall intensities are shown in Figure 7 and Figure 8.
Figure 7 and Figure 8 show that:
(1) Under the same rainfall intensity, with the increase in large shed spacing, Lwc increases, while the ratio of Lwc to shed spacing (Rwc) decreases. Moreover, Nwc, Nwde and Nwds increase with the increase in large shed spacing; however, nwds decreases.
(2) Under different rainfall intensities, the trends of Lwc with the increase in large shed spacing are consistent, and Lwc increases with the rise in rainfall intensity, while the increase in Lwc is not obvious. Lwc at 15 mm/min increases by about 3 mm compared with that of 2 mm/min, and the corresponding Rwc increased by about 5%. Moreover, the trends of Nwc, Nwde and Nwds are invariant with the change in large shed spacing. Additionally, it is worth mentioning that, when the rainfall intensity is less than 8 mm/min, the change in Nwds is slight. When the rainfall intensity increases from 8 mm/min to 10 mm/min, Nwds rises significantly.
The analyses for the above test results are as follows:
When the large shed spacing increases, the mutual shielding effect between the sheds is weakened, the area of the rod and the sheds exposed to rain is increased, and there is more rainwater gathering. Therefore, the length and number of water columns, and the number of water droplets all increase. However, the increases in Lwc and Nwds are far less than that of large shed spacing, so Rwc and nwds fall with the increase in large shed spacing. That is to say, water droplets in the space between two adjacent large sheds are more sparsely distributed in the vertical direction, and it is more difficult for water columns and water droplets to bridge the two adjacent large sheds.
Moreover, the reason that Lwc does not increase significantly with the increase in the rainfall intensity is that the water droplets hanging at the edge of the large shed will break under the action of gravity and surface tension, and its length will not increase indefinitely, finally forming the water columns and the water drops in the space.
Additionally, there are two reasons for the obvious increase in Nwds when the rain intensity is from 8 mm/min to 10 mm/min. The first is that the increase in rainfall intensity makes the sheds suffer more rainfall, and more water drops will be separated from the end of the hanging water column. The second is that the rainfall of 10 mm/min is very intense, and the rainwater will rebound when it falls on the surface of insulator; then, more discrete water drops will be formed in the space.

4.2. Influence of Large Shed Overhang on Parameters of Surface Rainwater Characteristics

The samples A1–A5 have the same large shed spacing and rod diameter, but different large shed overhang. The test results are shown in Figure 9.
Figure 9 illustrates that:
(1) Under the same rainfall intensity, with the increase in large shed overhang, Nwc, Nwde, Nwds and Lwc all increase.
(2) Under different rainfall intensities, the trends of Nwc, Nwde, Nwds and Lwc with the change in large shed overhang are identical. With the increase in rainfall intensity, the values of the four characteristic parameters increase.
(3) Lwc does not change significantly when the large shed overhang is less than 105 mm and more than 120 mm. However, as the large shed overhang extends from 105 mm to 120 mm, Lwc rises sharply.
The analyses for the above test results can be proposed so that, when the large shed overhang increases, the area of the sheds exposed to rain is increased, as shown in Figure 10. As a result, there is more rainwater gathering, leading to the increase in rain characteristic parameters in Figure 9. When the rainfall intensity rises, the amount of rainwater on the surface of the insulator per unit of time under the same shed overhang condition increases obviously, also causing the increase in the parameters.
Moreover, the reason for the sudden increase in Lwc in the process of large shed overhang rising, which is the speed of rainwater flowing to the edge of sheds, which increases as the overhang is from 105 mm to 120 mm, and the water droplets hanging on the shed edge have higher initial velocity, which leads to the significant increase in the length of water columns [28].

4.3. Influence of Rod Diameter on Parameters of Surface Rainwater Characteristics

The samples A3, A10–A13 have the same large shed spacing and large shed overhang, but different rod diameters. The test results under different rainfall intensities are shown in Figure 11. Figure 11 shows that:
(1) Under the same rainfall intensity, with the increase in rod diameter, Nwc, Nwde, Nwds and Lwc all increase.
(2) Under different rainfall intensities, the trends of Nwc, Nwde and Nwds and Lwc, with the change in rod diameter, are basically invariant. With the increase in rainfall intensity, the values of the four characteristic parameters rise with varying degrees. Especially, Nwds rises significantly as the rainfall intensity increases from 8 mm/min to 10 mm/min.
The analyses are as follows. The shed of insulators is a circular ring shape, as shown in Figure 10. The area of sheds ΔS exposed in rain expands as the rod diameter D increases, and there is more rainwater gathering. When the rainfall intensity rises, rainwater on the insulator surface will also increase. In addition, the circumference of sheds increases with the increase in rod diameter. As a result, water columns and water droplets hanging on the edge of large sheds, and water droplets in the space between two adjacent large sheds more widely distribute; thus, the number of them increases.
Moreover, there are two reasons why Nwds increases obviously when the rainfall intensity increases from 8 mm/min to 10 mm/min. One is that the increase in the rainfall intensity makes the sheds suffer more rainwater, and more water drops will be separated from the end of the hanging water column at the edge of the sheds; the other is that, when the rainwater falls on the sheds or the rod, it will rebound and form water drops in the space between two adjacent large sheds.
Finally, according to the test results and analyses on the influences of large shed spacing, large shed overhang and rod diameter on the parameters of surface rainwater characteristics, on the premise of meeting the technical indicators, such as creepage factor, the large shed space of large-diameter composite insulators can be appropriately increased to prevent the insulator sheds bridged by rainwater in the areas where heavy rain occurs frequently, whereas the large shed overhang and rod diameter can be reduced properly.

4.4. Influence of Rainfall Intensity on Rain Flashover Voltage

In order to investigate the correlation between the water droplet parameters and the electrical performance of the insulator, the flashover tests on sample A3 were carried out to study the influence of rainfall intensity on the rain flashover voltage (U50%). In the tests, the rainwater conductivity was 157 μS/cm and the surface of the insulator was not contaminated. The tests results are presented in Figure 12. In addition, the flashover process of the large-diameter composite post insulator under 10 mm/min is shown in Figure 13.
The fitting analysis reveals that the relationship between the rain flashover voltage and rainfall intensity is as follows:
U 50 % = 282.0 × r 0.293
where r is rainfall intensity; the coefficient of determination R2 is 0.9987.
It can be seen from Figure 12 and Equation (4) that the rain flashover voltage decreases with the rise in rainfall intensity. From the discharge phenomenon, shown in Figure 14, it is found that the number and length of water columns at the edge of sheds are rising as rainfall intensity increases, and the local arcs developing along the water columns can more easily bridge the adjacent sheds, resulting in a shorter creepage distance. Consequently, the flashover voltage decreases with the rise in rainfall intensity.
Moreover, the experimental results of surface rainwater characteristics (Figure 7 and Figure 8) have indicated that the number of water columns, the length of water columns and the number of water droplets on the surface of sample A3 all increase with the rising in rainfall intensity. According to [21], if there are more numerous water droplets on the insulator surface, the discharge is more likely to occur. It is pointed out in [24] that, when the numbers and lengths of water columns increase, it is easier for the arcs to develop along the water columns to bridge two adjacent sheds, resulting in the decrease in flashover voltage.

5. Conclusions

In this paper, artificial rain tests on large-diameter composite post insulators under the rainfall intensity of 2–15 mm/min were carried out, and the influences of large shed spacing, large shed overhang, and rod diameter on rain characteristic parameters were studied. The conclusions can be drawn as follows:
(1)
The effect of mutual shielding between the sheds is weakened as the shed spacing increases, causing the expansion of the area of the rod and the sheds exposed to rain, leading to more rainwater gathering on the insulator surface. As a result, the lengths of water columns, the number of water columns and the number of water droplets rise. The increase in large shed spacing is greater than that of the length of the water columns and the number of water droplets in the space between two adjacent large sheds. Consequently, the ratio of the length of the water columns to large shed spacing and the number of water droplets in the space between two adjacent large sheds per unit insulation height fall with the increase in large shed spacing.
(2)
When large shed overhang increases, the overhang of small shed also rises, while its extension is less than that of the large shed. In general, the area of the insulator surface suffering rain expands and there is more rainwater gathering, leading to the increases in the lengths of water columns, the number of water columns and the number of water droplets.
(3)
With the increase in rod diameter, the area of the circular sheds exposed in the rain increases and there is more rainwater gathering. Additionally, the increase in the rod diameter leads to an increase in the circumference of sheds. Therefore, the distributions of water columns, water droplets at the edge of large sheds, and water droplets in the spacing between two adjacent large sheds are more extensive, and the number of them rises at the same time.
(4)
When the rainfall intensity increases, rainwater on the insulator surface will obviously increase as time goes on, resulting in the increase in all rain characteristic parameters. When the rainfall intensity increases from 8 mm/min to 10 mm/min, Nwds rises significantly, which is because the rainfall of 10 mm/min is very intense, and the rainwater will rebound when it falls on the surface of the shed and rod; thus, more discrete water drops will be formed between the large sheds.
(5)
The rain flashover voltage decreases with the rise in rainfall intensity. This is because the increases in the number and length of water columns make the local arcs bridge sheds easily, resulting in the lower flashover voltage.

Author Contributions

Y.H.: conceived and designed the experiments and wrote the paper; Y.L. and Z.K. performed the experiments and helped in writing the paper; Y.S., G.S., W.Z., G.M. and L.Y. worked on the analysis part and helped in the experiments; F.Z. guided the writing and the data analysis; L.L. provided guidance on the test. All authors have read and agreed to the published version of the manuscript.

Funding

This research was funded by the science and technology project of China Southern Power Grid Company Limited, grant number: CSGTRC-K153025, CSGTRC-K163024. And National Natural Science Foundation of China (Grant NO. 52077084) firmly and effectively supported this work.

Conflicts of Interest

The authors declare no conflict of interest.

References

  1. Zhang, Z.Z.; Yang, S.H.; Jiang, X.L.; Qiao, X.H.; Xiang, Y.Z.; Zhang, D.D. DC flashover dynamic model of post insulator under non-uniform pollution between windward and leeward sides. Energies 2019, 12, 2345. [Google Scholar] [CrossRef] [Green Version]
  2. Zhang, F.Z.; Wang, L.M.; Guan, Z.C.; Mark, M. Influence of composite insulator shed design on contamination flashover performance at high altitudes. IEEE Trans. Dielectr. Electr. Insul. 2011, 18, 739–744. [Google Scholar] [CrossRef]
  3. Zhang, C.Y.; Wang, L.L.; Guan, Z.C.; Zhang, F.Z. Pollution flashover performance of full-scale ±800 kV converter station post insulators at high altitude area. IEEE Trans. Dielectr. Electr. Insul. 2013, 20, 717–726. [Google Scholar]
  4. Rizk, F.A.M. Mechanism of insulator flashover under artificial rain. Proc. Inst. Electr. Eng. 1975, 122, 449–454. [Google Scholar] [CrossRef]
  5. Okada, N.; Ikeda, K.; Sumi, S.; Kondo, K.; Ito, S. Contamination withstand voltage characteristics of hydrophobic polymer insulators under simulated rain conditions. In Proceedings of the 2002 IEEE International Symposium on Electrical Insulation, Boston, MA, USA, 7–10 April 2002; pp. 228–231. [Google Scholar]
  6. Farzaneh, M.; Kiernicki, J. Flashover performance of IEEE standard insulators under ice conditions. IEEE Trans. Power Deliv. 1997, 12, 1602–1613. [Google Scholar]
  7. Hu, Q.; Wang, S.J.; Shu, L.C.; Jiang, X.L.; Qiu, G.; Li, H.T. Influence of shed configuration on icing characteristics and flashover performance of 220 kV composite insulators. IEEE Trans. Dielectr. Electr. Insul. 2016, 23, 319–330. [Google Scholar] [CrossRef]
  8. Ohba, M.; Sugimoto, S. Differences in climate change impacts between weather patterns: Possible effects on spatial heterogeneous changes in future extreme rainfall. Clim. Dyn. 2019, 52, 4177–4191. [Google Scholar] [CrossRef]
  9. McDermid, W.; Black, T. Experience with Preventing External Flashovers in HVDC Converter Stations. In Proceedings of the 2008 IEEE International Symposium on Electrical Insulation, Vancouver, BC, Canada, 9–12 June 2008; pp. 81–84. [Google Scholar]
  10. McDermid, W.; Black, T. External flashovers, related insulation failures and corrective measures in converter stations of Nelson River bipole 1 and bipole 2. IEEE Trans. Dielectr. Electr. Insul. 2014, 21, 2406–2414. [Google Scholar] [CrossRef]
  11. Tan, O. Study on Heavy Rain Test Method of Composite Insulator. Master’s Thesis, South China University of Technology, Guangzhou, China, April 2019. [Google Scholar]
  12. Su, Z.Y. To prevent the big bushing flashover the focal point of external insulation design of the UHV transformation equipment. Electr. Power 2001, 34, 52–55. [Google Scholar]
  13. Chai, Z. Research on Property and Protection Measures of Contaminated Station Insulator’s Heavy Rain Flashover. Master’s Thesis, China Electric Power Research Institute, Beijing, China, April 2017. (In Chinese). [Google Scholar]
  14. Wei, X.X.; Li, J.P.; Chu, J.W.; Xia, G.L.; Chen, W. Application of composite insulators and analysis of rain flashover in converter stations. High Volt. Eng. 2017, 43, 3958–3963. (In Chinese) [Google Scholar]
  15. International Standard IEC/TS 60815. Selection and Dimensioning of High-Voltage Insulators Intended for Use in Polluted Conditions; IEC: Geneva, Switzerland, 2008. [Google Scholar]
  16. De la O, A.; Gorur, R.S. Flashover of contaminated nonceramic outdoor insulators in a wet atmosphere. IEEE Trans. Dielectr. Electr. Insul. 1998, 5, 814–823. [Google Scholar] [CrossRef]
  17. Ishiwari, M.; Ito, S.; Arakawa, K.; Nakachi, T.; Kondo, K. Various artificial contamination withstand voltage test methods and a comparison of their results on polymer and porcelain insulators. In Proceedings of the 1999 Eleventh International Symposium on High Voltage Engineering, London, UK, 27–23 August 1999. [Google Scholar]
  18. Lan, L.; Gorur, R.S. Computation of AC wet flashover voltage of ceramic and composite insulators. IEEE Trans. Dielectr. Electr. Insul. 2008, 15, 1346–1352. [Google Scholar] [CrossRef]
  19. Fan, J.B.; Su, Z.Y.; Li, W.F.; Li, P.; Zhou, J. Research on profiles of HVDC post insulator and bushing. Proc. CSEE 2007, 27, 1–6. (In Chinese) [Google Scholar]
  20. Zhang, C.Y.; Meng, X.B.; Zhang, F.Z.; Li, R.H.; Ma, Y.; Mei, H.W.; Wang, L.M.; Guan, Z.C. Research on the DC rain flashover mechanism of polluted post insulators. Proc. CSEE 2014, 34, 1481–1489. (In Chinese) [Google Scholar]
  21. Zhang, C.Y.; Wang, L.M.; Guan, Z.C. Investigation of DC discharge behavior of polluted porcelain post insulator in artificial rain. IEEE Trans. Dielectr. Electr. Insul. 2016, 23, 331–338. [Google Scholar] [CrossRef]
  22. Wang, G.L.; Lu, G.Q.; Li, R.H.; Han, W.Q.; Wang, B. Construction of National Engineering Laboratory for UHV Engineering Technology (Kunming). High Volt. Eng. 2009, 35, 1553–1558. (In Chinese) [Google Scholar]
  23. China Standard GB/T775.2. Test Method for Insulators—Part 2: Electrical Test Methods; Standards Press of China: Beijing, China, 2003. (In Chinese) [Google Scholar]
  24. Lu, J.Z.; Xie, P.K.; Hu, J.P. AC Flashover Performance of 10 kV Rod-Plane Air-Gapped Arresters under Rain Conditions. Energies 2018, 11, 1563. [Google Scholar] [CrossRef] [Green Version]
  25. Naito, K.; Matsuoka, R.; Ito, S.; Morikawa, S. An investigation of the horizontally mounted insulators for HVDC stations. IEEE Trans. Power Deliv. 1989, 4, 653–666. [Google Scholar] [CrossRef]
  26. Xu, Z.N.; Lv, F.C.; Li, H.M. Influence of separated globules on post insulator electric field distribution. High Volt. Eng. 2010, 36, 2278–2284. (In Chinese) [Google Scholar]
  27. Courant, R.; Friedrichs, K.; Lewy, H. On the Partial Difference Equations of Mathematical Physics. IBM J. Res. Dev. 1967, 11, 215–234. [Google Scholar]
  28. Yang, L.; Sun, Y.J.; Liao, Y.F.; Kuang, Z.Q.; Hao, Y.P.; Li, L.C.; Zhang, F.Z. Dynamic Deformation of Pendant Drops on theEdge of High-Voltage Bushing Sheds Under Extreme Rainfall. IEEE Access 2020, 8, 118101–118113. [Google Scholar] [CrossRef]
Figure 1. Diagram of the test arrangement.
Energies 13 05011 g001
Figure 2. Top view of camera coverage.
Energies 13 05011 g002
Figure 3. Rainwater situation at local position of A3 under rainfall intensity of 10 mm/min.
Energies 13 05011 g003
Figure 4. Diagram of one unit of large-diameter composite post insulator.
Energies 13 05011 g004
Figure 5. Rainwater on the surface of sample A3 under different exposure time.
Energies 13 05011 g005
Figure 6. Diagram and actual pictures of water droplets and water columns: (a) diagram of water droplets and water column; (b) actual picture of water droplets and water columns.
Energies 13 05011 g006
Figure 7. Effects of shed spacing on Lwc (the length of water columns at the edge of large sheds) and Rwc (the ratio of Lwc to large shed spacing). (a) 2 mm/min; (b) 5 mm/min; (c) 8 mm/min; (d) 10 mm/min; (e) 12 mm/min; (f) 15 mm/min. (σ1 is no more than 7.3%).
Energies 13 05011 g007
Figure 8. Effects of large shed spacing on Nwc (the number of water columns at the edge of large sheds), Nwde (the number of water droplets at the edge of large sheds) and Nwds (the number of water droplets in the space between two adjacent large sheds) and nwds (the number of water droplets per unit insulation height). (a) 2 mm/min; (b) 5 mm/min; (c) 8 mm/min; (d) 10 mm/min; (e) 12 mm/min; (f) 15 mm/min. (σ2, σ3 and σ4 are all no more than 8.1%).
Energies 13 05011 g008
Figure 9. Effects of large shed overhang on Nwc (the length of water columns at the edge of large sheds), Nwde (the number of water droplets at the edge of large sheds) and Nwds (the number of water droplets in the space between two adjacent large sheds) and Lwc (the length of water columns at the edge of large sheds). (a) 2 mm/min; (b) 5 mm/min; (c) 8 mm/min; (d) 10 mm/min; (e) 12 mm/min; (f) 15 mm/min. (σ1, σ2, σ3 and σ4 are all no more than 9.0%).
Energies 13 05011 g009aEnergies 13 05011 g009b
Figure 10. Influence of large shed overhang (P1) and rod diameter (D) on rain area of shed.
Energies 13 05011 g010
Figure 11. Effects of rod diameter on Nwc (the length of water columns at the edge of large sheds), Nwde (the number of water droplets at the edge of large sheds) and Nwds (the number of water droplets in the space between two adjacent large sheds) and Lwc (the length of water columns at the edge of large sheds). (a) 2 mm/min; (b) 5 mm/min; (c) 8 mm/min; (d) 10 mm/min; (e) 12 mm/min; (f) 15 mm/min. (σ1, σ2, σ3 and σ4 are all no more than 8.6%).
Energies 13 05011 g011
Figure 12. Influence of rainfall intensity on the rain flashover voltage (U50%).
Energies 13 05011 g012
Figure 13. Flashover process under 10 mm/min. (The time between two successive photos is 500 ms).
Energies 13 05011 g013
Figure 14. Discharge phenomena under different rainfall intensities. (a) 2 mm/min (b) 10 mm/min.
Energies 13 05011 g014
Table 1. Parameters of large-diameter composite post insulators samples.
SpecimenS1/mmS2/mmP1/mmP2/mml/mmh/mmD/mmCf
A190456550391312502803.13
A290458060456312502803.65
A3904510575556412502804.45
A4904512080615012502804.92
A5904513590680012502805.44
A6703510575700012502805.60
A71065310575500012502804.00
A81206010575465012502803.72
A91407010575412012502803.30
A10904510575556412503804.45
A11904510575593012504454.72
A12904510575593012505064.72
A13904510575578012506254.62

