Abstract
This study involved conducting an experimental and numerical investigation on the effects of the air-to-fuel ratio (AFR), engine speed, and engine load on the inlet gas component of a three-way catalyst (TWC) and on the effects of noble metal loading, noble metal ratio, and carrier pore density on the emission conversion efficiency. The results showed that AFR can significantly affect the raw emissions of NOx and total hydrocarbon (THC), and better emission conversion efficiency of a TWC can be reached when AFR is controlled between 0.995 to 1. Compared with engine speed, engine load has a relatively small effect on exhaust temperature but greatly affects the flow velocity and NOx and THC emissions. Increasing the content of Pt in the catalyst can improve the THC conversion efficiency. For low Pt and Pd-Rh catalysts, the THC conversion effect is significantly deteriorated. The content of Rh affects the NOx conversion, and NOx conversion efficiency at high speeds is significantly reduced when Rh content is reduced. Higher carrier pore density can slightly improve the catalytic reaction rate and emission conversion efficiency at high engine speeds. However, high conversion efficiency can be maintained even after aging.
1. Introduction
Due to stringent emissions regulations and the high cost of diesel fuel, alternative fuels provide solutions to an array of environmental and economic problems. Among alternative gaseous fuels, natural gas is regarded as the most promising for internal combustion engine [1,2,3,4]. Compared with gasoline, natural gas (NG) shows many advantages as motor fuel. A higher-octane number leads to a lower tendency to knock and makes it easier to achieve a higher compression ratio and, therefore, better thermal efficiency. In terms of safety, natural gas is volatile, and it has a higher spontaneous combustion temperature and flammable limit. In addition, natural gas has a lower carbon content, and as motor fuel, its CO2 emissions are lower compared with gasoline and diesel [5,6].
Lean-burn operation and stoichiometric operation are the two main routes of spark ignition (SI) in natural gas engines. Before the implementation of Euro-VI emission standards on heavy-duty engines, lean-burn mode was commonly applied to NG SI engines due to its lower knock tendency and better thermal efficiency [7,8]. In order to meet the stringent emissions requirements of non-methane total hydrocarbons (NMHC), CH4, and nitrogen oxides (NOx) in the latest emission standard, heavy-duty NG SI engines are designed to operate on a stoichiometric mixture combined with a three-way catalyst (TWC) and ammonia slip catalyst (ASC). This mode is generally recognized as the most effective for NG engines due to its very low emissions and after-treatment costs compared with lean-burn operation [9,10,11].
Currently, the TWC typically has a dual-layer washcoat applied to a cordierite substrate. In general, the underlayer is alumina rich, and the top layer contains oxygen storage (OSC) components, mainly Ce-Zr-mixed oxides. Both layers contain dispersed platinum group metal (PGM) components [12,13]. Ce-Zr-mixed oxides are added to the TWC formulation to buffer the perturbations near the stoichiometric operation of engines. Zirconium oxide itself have no OSC, but its incorporation with cerium oxides can improve the thermal stability and enhance the oxygen transport under lean/rich gas cycling reaction conditions. At first, TWC formulation for natural gas engines was mainly referred to gasoline engines [14,15]. The active components were mainly platinum (Pt), a small amount of rhodium (Rh), and CeO2 as a performance additive [16]. However, more than 80% of hydrocarbon emissions in the exhaust gas of natural gas engines are CH4. CH4 is difficult to oxidize catalytically, and the exhaust gas also contains a large amount of water vapor and a small amount of SO2. Using gasoline formulation may reduce CH4 conversion efficiency to less than 15% and cause poisoning and catalyst deactivation. Therefore, a TWC for gasoline vehicles is not suitable for the purification of natural gas engines [17,18]. Other than the catalyst and carrier, the catalytic performance of a TWC is also affected by operating conditions, such as the air-to-fuel ratio (AFR), engine speed, and engine load. The TWC efficient working window of natural gas engines is narrower than that of gasoline engines. When AFR is controlled toward the lean-burn side, the conversion efficiency of hydrocarbons and NOx decreases rapidly [19]. Moreover, noble metal composition can influence the conversion efficiency of emissions, which is caused by complicated coherent effects or synergistic effects among different noble metals and additives.
Therefore, research on TWCs is particularly important for natural gas engines using stoichiometric operation. Some research on the performance of TWCs for natural gas engines has been conducted, but most studies carried out sample tests, so there are still few studies based on engine tests. Huo et al. [20] studied the effect of the noble metal ratio on the catalytic performance of natural gas engines on a sample test bench and found that a certain percentage of Pt had a promoting effect on CH4 and NOx conversion efficiency but basically no effect on CO conversion efficiency. Zhang et al. [21] used Pd and a small amount of Pt as components to conduct comparative analysis through a sample test. The results showed that Al2O3/SiO2 as a coating material has good anti-sulfur poisoning ability and catalytic performance. Xi et al. [22] found that, because of the reliance of NOx conversion on CO and H2, CH4 conversion can strongly affect NOx conversion. Hajbabaei et al. [4] found that the stoichiometric engine significantly reduced NOx and THC emissions compared to the lean-burn engine but also resulted in higher levels of CO and ammonia (NH3) emissions. Takayuki [23] investigated the effect of noble metals in the catalyst on emissions, finding that Pd had the best effect on the conversion of CH4, whereas Pt and Rh were less effective. The high-efficiency working window of Pd is narrow, and when AFR increases, the conversion efficiency of CH4 decreases significantly. Some numerical study on TWC models have also been carried out. Maio et al. [24] investigate the effect of very fast composition transitions of the engine exhaust typical in real-world driving operating conditions. A predictive model of catalyst behavior with oxygen storage and release of a heavy-duty engine powered with NG was developed. Zeng et al. [25] established a kinetic model of a three-way catalyst and found that lower exhaust emission on a natural gas engine with a TWC can be achieved with an optimal dithering amplitude of AFR.
In order to determine the effect of the engine operation condition on the inlet state of a TWC and the effect of the TWC parameter on the conversion efficiency of main emissions, bench test and numerical simulation were conducted in this study. This paper aims to reveal the effects of AFR, engine speed, and engine load on the inlet gas component of TWCs as well as the effects of noble metal loading, noble metal ratio, and carrier pore density on the conversion efficiency of NOx and THC to provide TWC optimization guidelines for natural gas engines.
2. Experiment and Simulation Setup
2.1. Test Platform and Experimental Apparatus
A six-cylinder, 12.42-L turbocharged NG SI engine with a compression ratio of 11.46:1 was used for this experimental study. The specifications of the tested engine are shown in Table 1. A continuous-flow valve was employed for precise fuel supply control. The AFR was controlled by a closed-loop control system with a broadband oxygen sensor, and AFR was controlled by default at 0.995. A high-pressure loop external exhaust gas recirculation (EGR) system was implemented, which consisted of an EGR cooler, a one-way valve, and a cold-side EGR valve. The schematic of the experimental device is illustrated in Figure 1.

Table 1.
Specifications of tested engine.
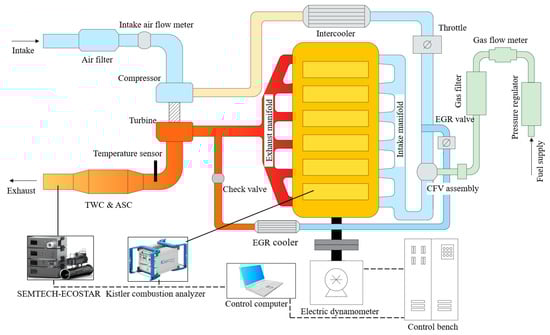
Figure 1.
The schematic diagram of experimental setup and engine test bench.
The composition of natural gas has a significant impact on engine combustion. The natural gas used in the test had a high methane content, and the main properties of the fuel at 20 °C and 1 standard atmosphere (atm) are shown in Table 2.
Table 2.
The main compositions and properties of natural gas used in the test.
To obtain the emission state of the engine, a SEMTECH-D emissions test system (Sensors, Inc., Saline, MI, USA) was used to detect THC, NOx, and CO concentration in the exhaust gas. The SEMTECH-FID module uses a heated flame ionization detector (HFID) to measure the total hydrocarbon concentration; its detection range is 0–3000 ppmc, and its resolution is 1 ppm. The SEMTECH-NOx module directly measures NO and NO2 concentration through non-dispersive ultraviolet (NDUV) to obtain the NOx concentration value with a resolution of 0.3 ppm. Finally, the SEMTECH-FEM module uses non-dispersive infrared (NDIR) technology to measure the CO and CO2 concentrations.
This study investigated the effect of operating conditions on TWC inlet parameters, and the influence of TWC parameters on catalytic performance of natural gas engine exhaust. The test conditions were controlled by the test bench, and the electronic throttle, excess air ratio, and EGR rate were controlled using electronic control unit (ECU) software. Before each test, the engine was fully warmed and the backpressure of the engine was adjusted to 1.35 MPa with 100% load at 1800 r/min. An inlet air conditioning system was used to maintain the temperature, humidity, and pressure of the inlet air at 20 ± 2 °C, 45 ± 3%, and 101 ± 1 kPa, respectively. During the test, the outlet cooling temperature of the intercooler was controlled by a PID controller and the control target was set to 90 °C.
To access the effects of AFR, engine speed, and engine load on the inlet state of TWCs, engine emission test operating points were designed, as shown in Figure 2. The engine was allowed to maintain a steady state for 2 min before emissions were sampled and data were collected.
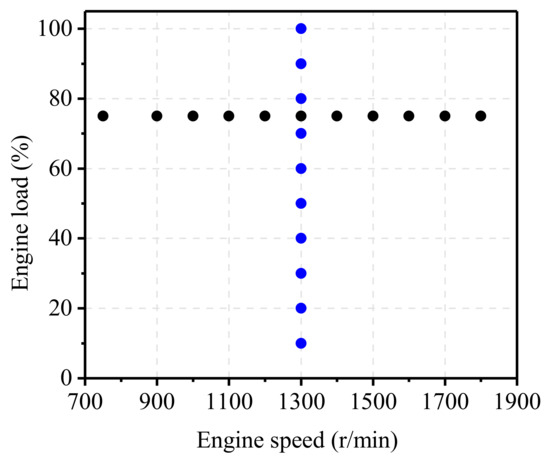
Figure 2.
The tested operating conditions.
To reduce the cost of TWCs and optimize the conversion performance of TWC, seven sets of TWCs with different parameters were designed and manufactured based on the mainstream TWC design parameters. The carrier material was cordierite, the wall thickness of the hole was 0.1 mm, and the size of the TWC was 152.4 mm (length) × 304.8 mm (diameter). CeO2 and Al2O3 were used as a performance additive. Additionally, all tested TWCs were tightly coupled with an ammonia slip catalyst (ASC). The size was 76.2 mm (length) × 304.8 mm (diameter), and it contained 10 g/ft3 Pt. The specific design parameters of the seven sets of TWCs are shown in Table 3.
Table 3.
The parameters of tested three-way catalysts (TWCs).
2.2. Numerical Simulation of Three-Way Catalysts
In order to study the effect of engine control parameters and TWC parameters on catalytic conversion efficiency, a numerical model of the catalyst was established by a scientific computing software Matlab, including a catalytic reaction kinetics model, heat and mass transfer model, and control equations.
2.2.1. Catalytic Reaction Kinetics Model
For the heterogeneous catalytic reaction of the three-way catalyst, the well-known Arrhenius equation still apply, as shown in Equation (1):
where is activation energy and pre-exponential factor is a constant independent of temperature.
Activation energy and pre-exponential factor are important contents of chemical kinetics. Their values are determined when the model is calibrated.
The reaction mechanism is also an important part of catalytic reaction kinetics model. For the traditional TWC used on gasoline vehicles, Koltsakis [26] proposed a five-reaction mechanism based on the existing research. The exhaust components of natural gas engines are different from traditional gasoline engines, and also, the catalyst is different. Therefore, the reaction mechanism of traditional TWCs is not applicable to natural gas engines. Considering that the main part of hydrocarbon emissions of natural gas engine is CH4, the traditional five-reaction mechanism is adjusted, and the following reaction mechanism is established:
where QR is the heat of the chemical reaction, and its value is positive for endothermic reactions and negative for exothermic reactions.
The main component of the fuel used in the bench test was CH4, which accounted for more than 99%, as shown in Table 2. To simplify the numerical model, only the oxidation and steam reforming reactions of CH4 were considered, and other alkanes were ignored.
2.2.2. Heat and Mass Transfer Model
In order to simplify the mathematical model while ensuring the reliability of the simulation results, the following assumptions were made: the gas flow state in each channel is consistent; there is neither heat nor mass transfer between the carriers; the geometric shape and the active components coated on the surface are the same; the inlet gas parameters (i.e., flow rate, temperature, composition) are consistent; the gas flow in is a fully developed laminar flow; the heat and mass transfer of the gas flow in the carrier channel in the axial direction is ignored; the inlet gas is an ideal gas with an average molecular weight, and there is no mutual reaction between the components.
For heat and mass exchange at the gas–solid boundary, the lumped parameter model was used, and the convective heat-transfer coefficient and convective mass-transfer coefficient were calculated using the dimensionless Nusselt number and the Sherwood number, as shown in Equations (9) and (10):
where is the convection heat-transfer coefficient; Nu is the Nusselt number; is the heat conductivity coefficient of gas; is the hydraulic diameter of channel; is the mass-transfer coefficient of component j in exhaust; Sh is the Sherwood number; is the diffusion coefficient of component j.
The diffusion coefficient of each component also changes with temperature changes, and therefore, it is corrected by the exhaust temperature, as shown in Equations (11)–(13):
where is the exhaust temperature.
According to the experimental results, the Reynolds number corresponding to the air flow in the carrier channel is about 77; that is, the air flow is in a laminar state, and the Schmidt number Sc corresponding to the air flow is about 0.73. Therefore, the Nusselt and Sherwood numbers in this study were calculated by Equations (14) and (15):
2.2.3. Control Equations
The exhaust gas in the exhaust pipe enters the pores of the catalyst carrier through the inlet expansion pipe. Due to the concentration gradient, the reactant molecules diffuse to the catalyst surface and catalytic reaction occurs, and the product separates from the catalyst surface and is discharged through the outlet contraction pipe. After certain simplification, because this article mainly studies steady-state characteristics and ignores the radial temperature difference of the carrier and the axial heat and mass transfer of the gas, the control equations shown in Equations (16)–(19) are established, which correspond to the gas-phase energy conservation equation, the gas-phase mass conservation equation, the solid-phase (carrier surface) energy conservation equation, and the solid-phase mass conservation equation, respectively:
where z is the axial coordinate of the carrier; is the exhaust density; is the constant pressure specific heat for exhaust; is the aperture rate of the carrier; and are, respectively, the temperature of exhaust gas and carrier; is the gas flow rate; is the convective heat transfer coefficient between exhaust gas and carrier wall; is the geometric surface area per unit volume of the carrier; is the concentration of component j in the exhaust; is the concentration of component j on the surface of the carrier; is the mass transfer coefficient of component j in the exhaust gas.
where the superscript i represents different chemical reactions; is the density of the carrier material; is the specific heat of carrier; is the external surface area per unit volume of the carrier; is the ambient temperature; and are, respectively, the reaction heat and reaction rate of chemical reaction i; is the rate of change of the concentration of component j.
2.2.4. Model Parameter Settings and Calibration
The parameters of the catalytic converter model are referred to the TWC used in the experiment, and the size, carrier material, and wall thickness of the hole has been described in Section 2.1. The honeycomb carrier of the catalyst is a square pore structure, as shown in Figure 3, where d represents the pore spacing; h is the pore wall thickness; R is the radius of the pore fillet.
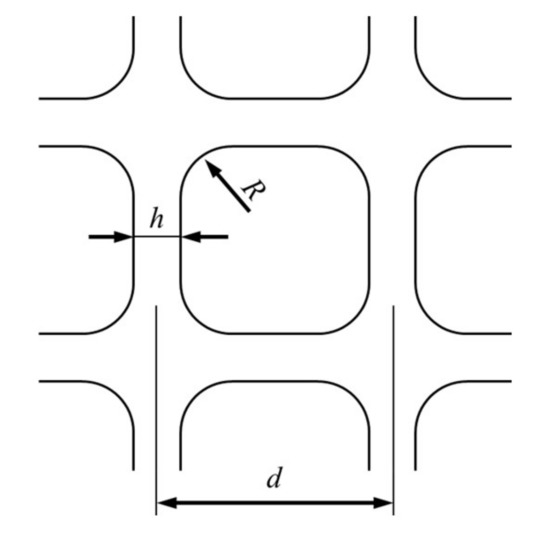
Figure 3.
Schematic diagram of pore structure of carrier.
According to the parameters of the carrier and the physical properties of the material, combined with the actual test environment conditions, the model parameters for numerical calculation were determined, as shown in Table 4. The inlet gas parameter values are constantly changing with temperature changes. The data in the table are based on the exhaust temperature under 1200 r/min speed and 100% load condition. To determine the parameter values of the inlet gas for preliminary model calibration. In the actual simulation calculation, the inlet gas parameter values need to be adjusted according to the operating conditions.
Table 4.
Parameters used in the numerical model.
In order to calibrate and verify the model, the original engine emissions and the post-catalyst exhaust emissions under 1200 r/min speed and 100% load are used as the inlet and outlet parameters of the three-way catalytic converter mathematical model, as shown in Table 5.
Table 5.
Gas sample composition at the catalyst inlet.
Based on the test results, the parameters of the oxidation reaction mechanism and the reduction reaction mechanism were calibrated separately to determine the activation energy and pre-finger factor of the reaction. The constructed chemical reaction mechanism is shown in Table 6.
Table 6.
Catalytic reaction mechanism used in simulation.
The conversion efficiency obtained by numerical simulation is in the form of a solid curve, and the bench test results are expressed in the form of scattered points, as shown in Figure 4. It can be seen that the simulation results are basically consistent with the test results, and the deviation value is less than 2% in the common AFR range of the engine, which can meet the simulation needs.
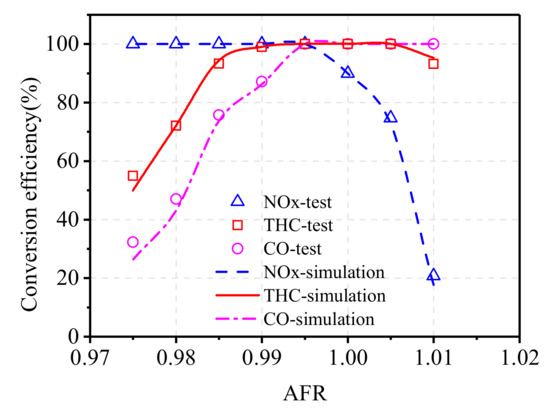
Figure 4.
Comparison of simulation results and test results of catalytic conversion efficiency.
3. Results and Discussion
3.1. Analysis of Results under Different Operation Conditions
3.1.1. Effect of Air-to-Fuel Ratio
The inlet component of a TWC greatly affects the catalytic efficiency, and the inlet component of a TWC is determined by the engine operating conditions and control parameters. To analyze the effect of AFR on raw emissions of the engine and conversion efficiency of a TWC, steady-state tests were conducted at two operating conditions: 2100 N·m at 1300 r/min (full-load condition at maximum torque speed) and 1700 N·m at 1800 r/min (full-load condition at maximum power speed), which are the most important operating conditions for engine calibrations. The EGR rate was controlled at 17.5%.
Figure 5 and Figure 6 show the effect of AFR on raw emissions of the engine and conversion efficiency of a TWC under the condition of 2100 N·m at 1300 r/min. From the figures, it can be seen that CO emissions are the most sensitive when AFR changes, then followed by NOx emissions. As shown in Figure 5a, raw NOx emissions of the engine continuously increased with the increase in AFR from 0.975 to 1.02. Although the change of AFR slightly affected the combustion temperature and duration of high temperature, the increase in NOx emissions was mainly caused by increasing oxygen concentration. The increase in AFR led to a significant drop in raw CO emissions but showed little effect on raw THC emissions. As can be seen in Figure 5b, the trends of raw NOx, THC, and CO emissions at 1800 r/min were basically the same as those at 1300 r/min. NOx emissions were relatively lower due to a higher EGR rate and shorter high-temperature duration compared to that of 1300 r/min. THC and CO emissions increased when the engine speed increased from 1300 r/min to 1800 r/min. This was mainly due to the increase in unburnt fuel caused by wall and bulk quenching as well as leaking during valve overlapping [27].
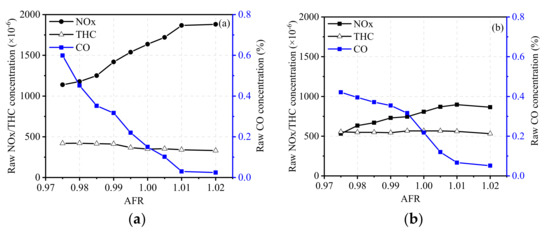
Figure 5.
Raw emissions of the engine under the conditions of (a) 2100 N·m at 1300 r/min and (b) 1700 N·m at 1800 r/min.
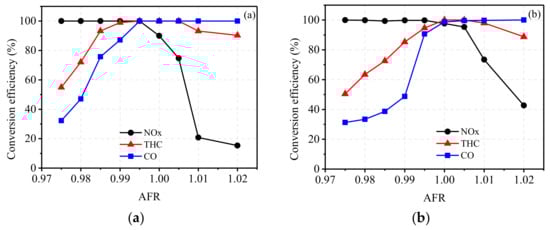
Figure 6.
Conversion efficiency of emissions under the conditions of (a) 2100 N·m at 1300 r/min and (b) 1700 N·m at 1800 r/min.
As illustrated in Figure 6a, the conversion efficiencies of CO and THC were quite low when AFR < 0.99 due to the lack of O2 in the exhaust gas. As NOx emissions were lower and the reductant was sufficient due to higher CO and THC emissions, the conversion efficiency of NOx was quite high, staying at more than 99%. As shown in Figure 6b, the conversion efficiency of CO was lower when AFR < 0.99, which was caused by lower NOx emissions at 1800 r/min. When AFR increased from 0.99 to 1.00, the conversion efficiencies of CO and THC rapidly increased, and the efficiency of NOx started to decrease. When AFR > 1.00, the conversion efficiency of CO stayed at about 100%, but the efficiency of THC decreased eventually, which was due to the oxidation activity of CH4 being significantly reduced when AFR was controlled at the lean side.
3.1.2. Effect of Engine Speed
To clarify the effects of engine speed on the inlet gas state of TWCs, the EGR rate was kept constant at 17.5%, and the engine load was maintained at 75% load. Figure 7 and Figure 8 show the effects of engine speed on raw emissions, exhaust temperature, and flow velocity. As shown in Figure 7, with the increase in engine speed, NOx emissions rapidly increased, reached a peak value near 1100 r/min, and then started to decrease. At low engine speed, the temperature in the cylinder rapidly increased with an increase in engine speed, which leads to high NOx emissions. At high engine speed, lower in-cylinder temperature caused by increasing the EGR rate as well as shorter reaction time leads to lower NOx emissions. The CO concentration showed little change with the increase in engine speed, whereas THC emissions decreased before eventually beginning to increase when the engine speed was more than 1100 r/min. At a low engine speed with lower in-cylinder temperature, the possibility of bulk quenching in the late combustion stages increases, which results in higher THC emissions [28]. At high engine speed, CH4 emissions coming from escape during the valve overlapping period increase, and more HC emissions are generated due to a higher EGR rate, which results in an increase in THC emissions [29].
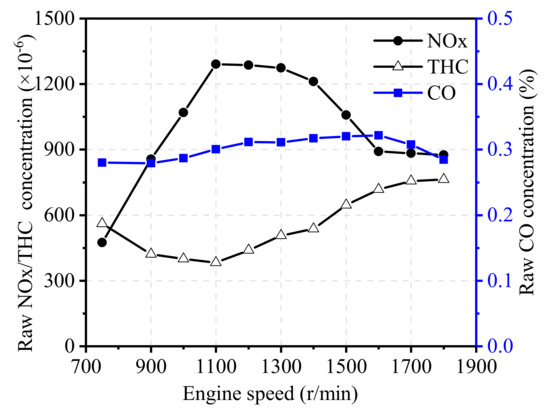
Figure 7.
Effect of engine speed on exhaust components.
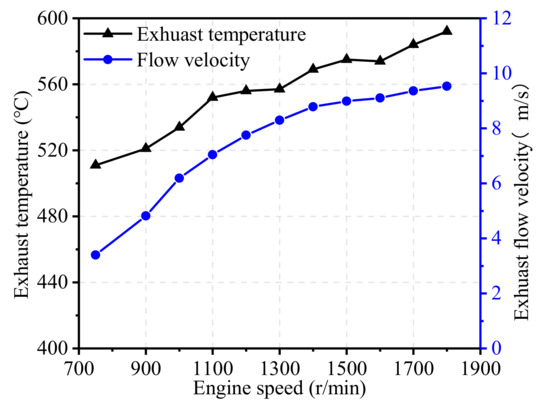
Figure 8.
Effect of engine speed on exhaust temperature and flow velocity.
As illustrated in Figure 8, with the increase in engine speed, the exhaust temperature increased almost linearly from 510 °C at 750 r/min to 590 °C at 1800 r/min. However, the exhaust flow velocity through the catalyst carrier increased significantly, and the rate of increase slowed down slightly at high engine speeds.
3.1.3. Effect of Engine Load
To evaluate the effects of engine load on the inlet gas state of TWCs, the EGR rate was kept constant at 17.5%, and the engine load was maintained at 1300 r/min. Figure 9 and Figure 10 illustrate the effects of engine load on raw emissions, exhaust temperature, and flow velocity. From the figures, it can be seen that NOx emissions are the most sensitive when engine load changes, then followed by THC emissions. As shown in Figure 9, the raw NOx concentration monotonously increased with the increase in engine load at 1300 r/min. Under low load conditions, the NOx concentration was low due to the low in-cylinder temperature. With the increase in engine load, NOx emissions gradually increased until they became stable at high load. THC emissions initially increased before eventually dropping down, and the maximum value was reached at about 30% load, high THC emissions in low-load conditions is mainly due to the bulk quenching caused by slower flame propagation speed and the unburned fuel resulting from the crevice effects [30]. Similar to the trend in the test of engine speed, the CO concentration showed only slight changes with the change of engine load, staying at about 0.3%. With the increase in engine load, the flow velocity increased almost linearly, as shown in Figure 10. The exhaust temperature varied greatly at high load and low load but remained basically unchanged at medium load.
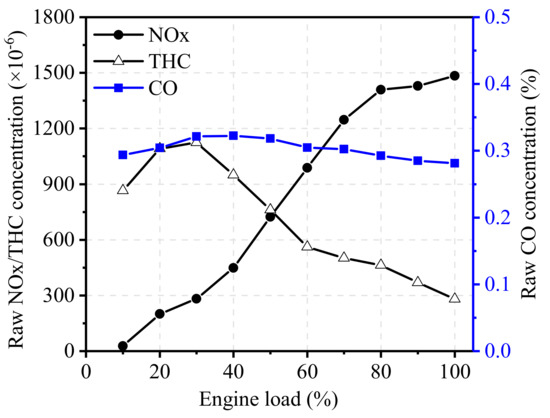
Figure 9.
Effect of engine load on exhaust components.
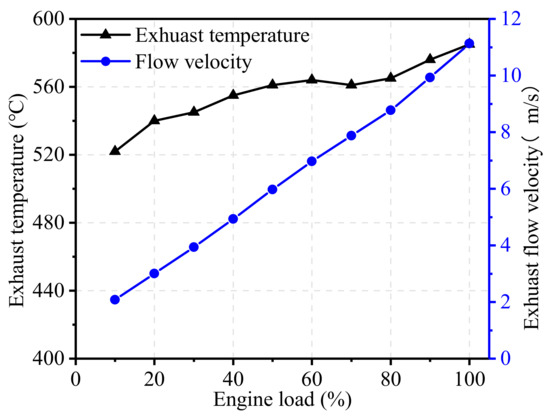
Figure 10.
Effect of engine load on exhaust temperature and flow velocity.
3.2. Analysis of Results of Emissions Using Different Three-Way Catalysts
3.2.1. Effect of Noble Metal Loading
To access the effect of noble metal loading on the performance of TWCs, emission tests were conducted on the natural gas engine matching with three different TWCs. The noble metal loading was 150 g/ft3 for 1# TWC, 120 g/ft3 for 2# TWC, and 100 g/ft3 for 3# TWC, as mentioned in Table 3.
Figure 11 shows the effect of noble metal loading on the NOx conversion efficiency of TWCs at 75% engine load from 750 r/min to 1800 r/min. As the engine speed increased, the conversion efficiency of NOx started to decrease when the engine speed was higher than 1300 r/min. At high engine speeds, the higher flow velocity through the carrier led to the shorter residence time of exhaust gas in the catalyst, which reduced the NOx conversion efficiency. Comparing three TWCs with different noble metal loading, it can be seen that 3# TWC showed relatively lower conversion efficiency at high engine speeds (about 1% lower). At low and medium engine speeds, noble metal loading seemed to have little effect on the conversion efficiency of NOx.
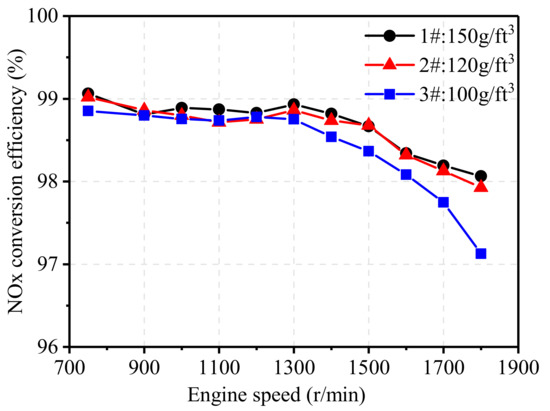
Figure 11.
Effect of noble metal loading on NOx conversion efficiency.
Figure 12 illustrates the effect of noble metal loading on the THC conversion efficiency of TWCs at 75% engine load from 750 r/min to 1800 r/min. At low engine speeds, the THC conversion efficiencies of all three TWCs were high but eventually decreased with the increase in engine speed due to higher THC concentration and exhaust flow velocity. Overall, TWCs with noble metal loading of 150 g/ft3 and 120 g/ft3 showed little effect on THC conversion efficiency at all engine speed ranges, but TWCs with noble metal loading of 100 showed an obvious negative effect on THC conversion. A proper increase in noble metal loading can enhance the conversion efficiency of both NOx and THC, but increasing the loading means increasing the cost of the after-treatment system, so it is necessary to comprehensively consider the catalytic performance and economy.
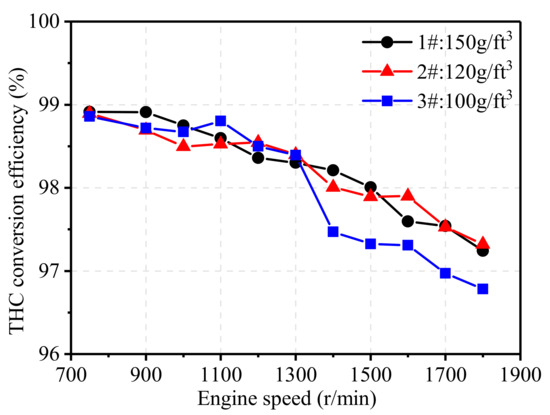
Figure 12.
Effect of noble metal loading on THC conversion efficiency.
3.2.2. Effect of Noble Metal Ratio
To access the effect of noble metal ratio on the performance of TWCs, emission tests were conducted on the natural gas engine matching with four different TWCs. The noble metal ratio (Pt:Pd:Rh) was 45:100:15 for 1# TWC (baseline), 30:110:10 for 4# TWC (lower Pt/Pd ratio), 55:85:10 for 5# TWC (higher Pt/Pd ratio), and 0:140:10 for 6# TWC (Pd-Rh), as mentioned in Table 3.
Figure 13 shows the effect of noble metal ratio on the NOx conversion efficiency of TWCs at 75% engine load from 750 r/min to 1800 r/min. At high engine speeds, 5# TWC and 6# TWC showed obvious drops in NOx conversion efficiency, and the NOx conversion efficiency of 4# TWC also showed a certain degree of decline. This is because rhodium is mainly used for the catalytic reduction of NOx [20], so the content of Rh can greatly affect the conversion of NOx. 1# TWC had a higher Rh content and showed a better NOx conversion effect, whereas 5# TWC and 6# TWC had lower Rh contents and, hence, poorer NOx conversion efficiency at high engine speeds.
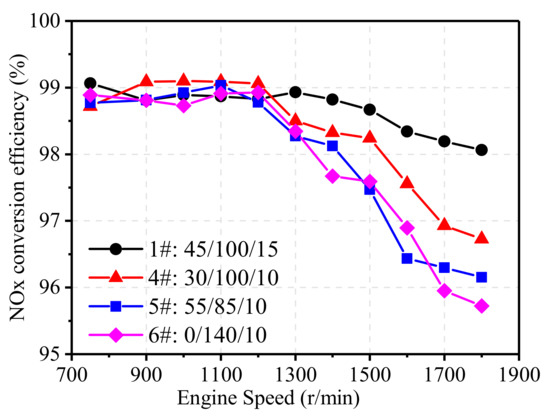
Figure 13.
Effect of noble metals ratio on NOx conversion efficiency.
Figure 14 illustrates the effect of noble metal ratio on the NOx efficiency of TWCs at 75% engine load from 750 r/min to 1800 r/min. Similar to NOx conversion, noble metal ratio showed little effect on THC conversion at low engine speed as the conversion ratio remained at more than 98%. However, when engine speed was high, it can be seen from the curve that the Pt content in the catalyst had a significant effect on THC emissions. Low-Pt TWC (4#) and Pd-Rh TWC (6#) both had a low conversion efficiency of THC. The 6# catalyst had no Pt, and the main part of the catalyst was Pd, which is more sensitive to AFR due to the narrow efficient working window, and thus, a more obvious drop of THC conversion can be observed at high engine load. Besides, the decrease in THC conversion efficiency of 4# and 6# TWC can also attributed to the fact that the catalytic efficiency of Pd content starts to decrease when the temperature remains at high level [31]. In contrast, the high-Pt catalyst (5#) improved the catalytic conversion efficiency of THC in the high-speed section, maintaining a higher efficiency at all speeds.
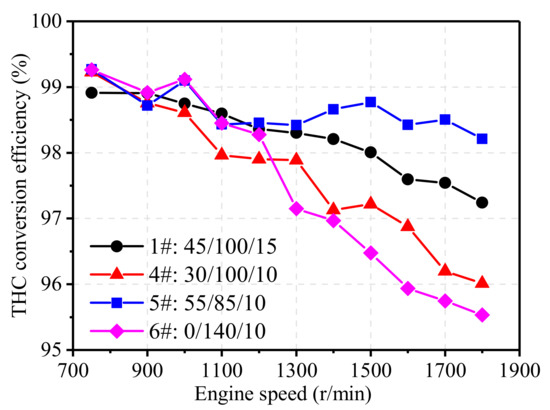
Figure 14.
Effect of noble metals ratio on THC conversion efficiency.
3.2.3. Effect of Pore Density of Carrier
To access the effect of carrier pore density on the performance of TWCs, emission tests were conducted on the natural gas engine matching with two different TWCs. The pore density of the carrier was 400 channels per square inch (cpsi) for 1#TWC and 600 cpsi for 7#TWC. A comparison of carrier parameters is displayed in Table 7.
Table 7.
Comparison of carrier parameters of 1# and 7#TWC.
Compared with the 400 cpsi carrier, the 600 cpsi carrier had a higher geometric surface area and porosity but a lower pore wall thickness and hydraulic diameter. The increase in the geometric surface area of the carrier can increase the contact area between the reaction gas and catalyst, thus enhancing the catalytic reaction rate. The smaller the hydraulic diameter, the higher the convective mass transfer coefficient, which promotes the heterogeneous catalytic reaction to some extent. To study the effect of carrier pore density on the catalytic reaction in the carrier, a TWC numerical model was established using the simulation method mentioned in Section 2.2. Based on the model, the catalyst reaction rate and gas temperature of two TWCs with different pore densities were simulated. After long-term use of the catalyst, the catalyst will age, and catalytic performance will be reduced. In the process of catalyst deactivation, the reaction rate is not only a function of temperature and concentration, but also a function of catalyst activity. In order to simulate aging, catalyst relative activity α was introduced to characterize the degree of catalyst deactivation. The definition of relative activity is shown in Equation (20) [32]. A of the fresh catalyst is 1. As the reaction time increases, the catalyst undergoes high temperature deactivation and poisoning deactivation, and α gradually decreases. In this study, α was taken as 0.1 in simulation, which means the reaction rate after aging is one tenth the reaction rate on a fresh catalyst.
where is the reaction rate of reactant A after aging on a catalyst, and is the reaction rate of reactant A on a fresh catalyst.
Figure 15 shows the change of the molar concentration of O2 along the axial position of the carrier before and after aging. As shown in the figure, the catalytic oxidation rate in the TWC with 600 cpsi was faster, as the molar concentration of O2 decreased by about 99% at 0.05 m, whereas in the TWC with 400 cpsi the molar concentration of O2 decreased by about 99% at 0.069 m. Compared with the fresh catalysts, the rate of decrease in O2 concentration was significantly slower in the aged catalysts. At the end of the simulation, both aged catalysts still contained a lot of O2, although the concentration of the 600 cpsi TWC was lower.
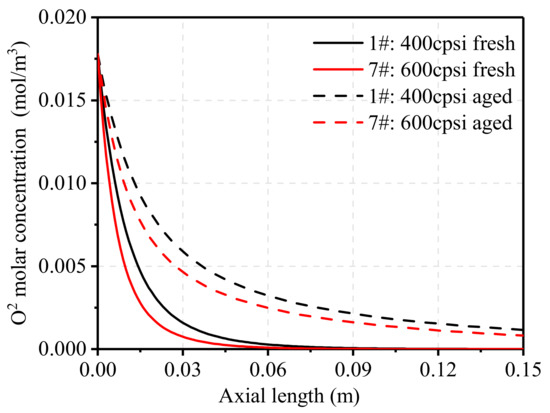
Figure 15.
Effect of pore density on oxidation reaction rate.
Figure 16 shows the change of gas temperature along the axial position of the carrier before and after aging. Due to the larger geometric surface area of the carrier, the contact area between the reaction gas and catalyst increased in 7#TWC and led to a higher catalytic reaction rate. Thus, the catalytic reaction was more concentrated on the front side of the carrier and caused a rapid increase of gas temperature in the front of the carrier. As can be seen in the figure, the gas temperature increase rate in 7#TWC was much higher than that in 1#TWC, and the increase in gas temperature within a certain range helped the catalytic reaction proceed. Compared with fresh catalysts, the increase rates in the front of the carrier were much lower after aging. The middle and rear part of the carrier still contained a lot of O2; thus, the temperature tended to increase monotonically.
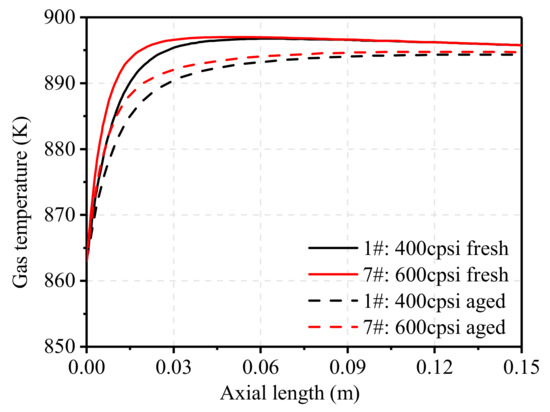
Figure 16.
Effect of pore density on gas temperature distribution.
Figure 17 and Figure 18 illustrate the effect of pore density on the NOx and THC conversion efficiency of TWCs at 75% engine load from 750 r/min to 1800 r/min. As shown Figure 17, TWC with higher pore density showed little effect on NOx conversion efficiency at low and medium speed conditions, and a slightly increased effect at high engine speeds. Similar to NOx, the THC conversion efficiency of the 600 cpsi TWC was much higher than that of the 400 cpsi TWC, and its efficiency was increased by 0.68% at 1800 r/min. Overall, the increase in the pore density of the carrier can improve the catalytic performance of TWCs, especially at high engine speeds. In addition, the conversion efficiency of catalysts with higher pore density after aging was much higher than that of catalysts with low pore density. Increasing pore density also increases the cost of the after-treatment system, and the improvement of catalytic performance is quite limited at low and medium speeds, and thus, should be further discussed in engineering application.
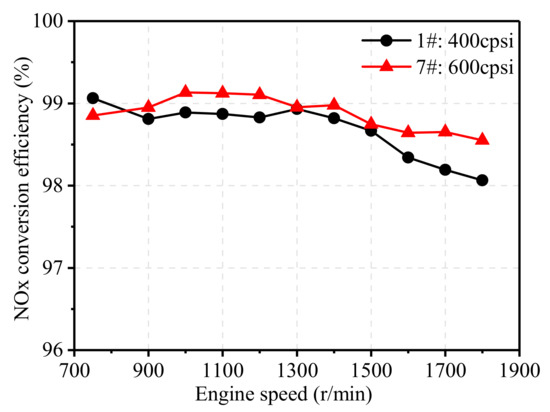
Figure 17.
Effect of pore density on NOx conversion efficiency.
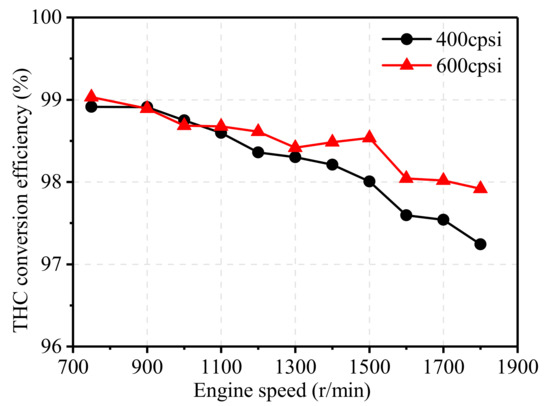
Figure 18.
Effect of pore density on THC conversion efficiency.
4. Conclusions
In order to study the effect of TWC parameters on the after-treatment performance of natural gas engines, bench tests and numerical simulations were conducted in this study. The effects of AFR, engine speed, and engine load on the inlet gas component of TWC, and the effects of noble metal loading, noble metal ratio, and carrier pore density on the conversion efficiency of NOx and THC were discussed. The main conclusions from the study are summarized as follows:
- (1)
- AFR can significantly affect the raw emissions of NOx and THC, and better emission conversion efficiency of TWCs can be reached when AFR is controlled between 0.995 to 1. Increasing engine speed leads to higher NOx emissions, exhaust temperature, and flow velocity. Compared with engine speed, engine load has a relatively small effect on exhaust temperature but greatly affects the flow velocity as well as NOx and THC emissions.
- (2)
- Increasing noble metal loading can improve the catalytic performance, especially at high engine speeds. Increasing the content of Pt in the catalyst can improve the THC conversion efficiency. For low Pt and Pd-Rh catalysts, the THC conversion effect is significantly deteriorated. The content of Rh affects the NOx conversion. When Rh content is reduced, the catalytic conversion efficiency of NOx at high speeds is significantly reduced.
- (3)
- Higher pore density of the carrier enhances the catalytic reaction rate and gas temperature in the carrier. Conversion efficiency is also improved at high engine speeds. After aging, TWCs with high carrier pore density can still maintain high catalytic conversion efficiency.
Author Contributions
Methodology, Y.R.; software, X.L.; validation, Y.Z. and D.L.; writing—original draft preparation, Y.R.; writing—review and editing, Y.Z. and D.L.; project administration, X.S. All authors have read and agreed to the published version of the manuscript.
Funding
This research was funded by National Key R&D Program of China (2017YFE0102800).
Acknowledgments
The authors would like to acknowledge the financially support by National Key R&D Program of China (2017YFE0102800).
Conflicts of Interest
The authors declare no conflict of interest.
References
- Duan, X.; Li, Y.; Liu, J.; Guo, G.; Fu, J.; Zhang, Q.; Zhang, S.; Liu, W. Experimental study the effects of various compression ratios and spark timing on performance and emission of a lean-burn heavy-duty spark ignition engine fueled with methane gas and hydrogen blends. Energy 2019, 169, 558–571. [Google Scholar] [CrossRef]
- Fagundez, J.; Golke, D.; Martins, M.; Salau, N.P.G. An investigation on performance and combustion characteristics of pure n-butanol and a blend of n-butanol/ethanol as fuels in a spark ignition engine. Energy 2019, 176, 521–530. [Google Scholar] [CrossRef]
- Ibrahim, A.; Bari, S. An experimental investigation on the use of EGR in a supercharged natural gas SI engine. Fuel 2010, 89, 1721–1730. [Google Scholar] [CrossRef]
- Hajbabaei, M.; Karavalakis, G.; Johnson, K.C.; Lee, L.; Durbin, T.D. Impact of natural gas fuel composition on criteria, toxic, and particle emissions from transit buses equipped with lean burn and stoichiometric engines. Energy 2013, 62, 425–434. [Google Scholar] [CrossRef]
- Ou, X.; Zhang, X. Life-Cycle Analyses of Energy Consumption and GHG Emissions of Natural Gas-Based Alternative Vehicle Fuels in China. J. Energy 2013, 2013, 1–8. [Google Scholar] [CrossRef]
- Li, Y.; Wang, P.; Wang, S.; Liu, J.; Xie, Y.; Li, W. Quantitative investigation of the effects of CR, EGR and spark timing strategies on performance, combustion and NOx emissions characteristics of a heavy-duty natural gas engine fueled with 99% methane content. Fuel 2019, 255. [Google Scholar] [CrossRef]
- Einewall, P.; Tunestål, P.; Johansson, B. Lean Burn Natural Gas Operation vs. Stoichiometric Operation with EGR and a Three Way Catalyst. SAE Tech. Pap. Ser. 2005. [Google Scholar] [CrossRef]
- Sen, A.; Litak, G.; Yao, B.-F.; Li, G.-X. Analysis of pressure fluctuations in a natural gas engine under lean burn conditions. Appl. Eng. 2010, 30, 776–779. [Google Scholar] [CrossRef]
- Li, M.; Zhang, Q.; Li, G. Emission Characteristics of a Natural Gas Engine Operating in Lean-Burn and Stoichiometric Modes. J. Energy Eng. 2016, 142, 04015039. [Google Scholar] [CrossRef]
- Zhang, Q.; Xu, Z.; Li, M.; Shao, S. Combustion and emissions of a Euro VI heavy-duty natural gas engine using EGR and TWC. J. Nat. Gas. Sci. Eng. 2016, 28, 660–671. [Google Scholar] [CrossRef]
- Zheng, J.; Wang, J.; Zhao, Z.; Wang, D.; Huang, Z. Effect of equivalence ratio on combustion and emissions of a dual-fuel natural gas engine ignited with diesel. Appl. Eng. 2019, 146, 738–751. [Google Scholar] [CrossRef]
- Gandhi, H. Automotive exhaust catalysis. J. Catal. 2003, 216, 433–442. [Google Scholar] [CrossRef]
- Salaün, M.; Kouakou, A.; Da Costa, S.; Da Costa, P. Synthetic gas bench study of a natural gas vehicle commercial catalyst in monolithic form: On the effect of gas composition. Appl. Catal. B Environ. 2009, 88, 386–397. [Google Scholar] [CrossRef]
- Xi, Y.; Ottinger, N.; Liu, Z.G. The Dynamics of Methane and NOx Removal by a Three-Way Catalyst: A Transient Response Study. SAE Int. J. Engines 2018, 11, 1331–1341. [Google Scholar] [CrossRef]
- Karavalakis, G.; Hajbabaei, M.; Jiang, Y.; Yang, J.; Johnson, K.C.; Cocker, D.R.; Durbin, T.D. Regulated, greenhouse gas, and particulate emissions from lean-burn and stoichiometric natural gas heavy-duty vehicles on different fuel compositions. Fuel 2016, 175, 146–156. [Google Scholar] [CrossRef]
- Tabata, T.; Baba, K.; Kawashima, H.; Kitade, K. NOx reduction catalyst systems for natural Gas-Fuelled engine cogeneration systems. Stud. Surf. Sci. Catal. 1995, 92, 453. [Google Scholar]
- Kalam, M.; Masjuki, H.H.; Redzuan, M.; Mahlia, T.; Fuad, M.A.; Mohibah, M.; Halim, K.H.; Ishak, A.; Khair, M.; Shahrir, A.; et al. Development and test of a new catalytic converter for natural gas fuelled engine. Sadhana 2009, 34, 467–481. [Google Scholar] [CrossRef]
- Liotta, L.F.; Di Carlo, G.; Pantaleo, G.; Venezia, A.; Deganello, G. Co3O4/CeO2 composite oxides for methane emissions abatement: Relationship between Co3O4–CeO2 interaction and catalytic activity. Appl. Catal. B Environ. 2006, 66, 217–227. [Google Scholar] [CrossRef]
- Li, Z.; Zhu, L.; Li, J.; Wang, H.; Zhang, H.; He, L.; Zhang, Y. Effect of A/F ratio fluctuation on light-off performance of methane of TWC for CNG engine. J. Jilin Univ. 2019, 1, 79–87. [Google Scholar]
- Huo, C.; Zheng, B.; Wang, F.; Wang, Y.; Wang, J. Influence of noble metal ratio on performance of Three-Way catalyst for gas engine. Intern. Combust. Engine Powerpl. 2019, 20–24, 38. [Google Scholar]
- Zhang, Q.; Li, N.; Li, G. Three-Way catalyst for a natural-gas engine. J. Shandong Univ. 2010, 4, 121–124. [Google Scholar]
- Xi, Y.; Ottinger, N.; Liu, Z.G. Development of a Lab Reactor System for the Evaluation of Aftertreatment Catalysts for Stoichiometric Natural Gas Engines. SAE Tech. Pap. Ser. 2017, 1. [Google Scholar] [CrossRef]
- Sakai, T.; Choi, B.-C.; Osuga, R.; Ko, Y.; Kim, E. Unburned Fuel and Formaldehyde Purification Characteristics of Catalytic Converters for Natural Gas Fueled Automotive Engine. SAE Trans. 1992, 101, 721–727. [Google Scholar] [CrossRef]
- Di Maio, D.; Beatrice, C.; Fraioli, V.; Napolitano, P.; Golini, S.; Rutigliano, F.G. Modeling of Three-Way Catalyst Dynamics for a Compressed Natural Gas Engine during Lean–Rich Transitions. Appl. Sci. 2019, 9, 4610. [Google Scholar] [CrossRef]
- Zeng, F.; Finke, J.; Olsen, D.; White, A.; Hohn, K. Modeling of three-way catalytic converter performance with exhaust mixtures from dithering natural gas-fueled engines. Chem. Eng. J. 2018, 352, 389–404. [Google Scholar] [CrossRef]
- Koltsakis, G.; Konstantinidis, P.; Stamatelos, A. Development and application range of mathematical models for 3-way catalytic converters. Appl. Catal. B Environ. 1997, 12, 161–191. [Google Scholar] [CrossRef]
- Hu, E.; Huang, Z.; Liu, B.; Zheng, J.; Gu, X.; Huang, B. Experimental investigation on performance and emissions of a spark-ignition engine fuelled with natural gas–hydrogen blends combined with EGR. Int. J. Hydrogen Energy 2009, 34, 528–539. [Google Scholar] [CrossRef]
- Wang, S.; Li, Y.; Fu, J.; Liu, J.; Dong, H.; Tong, J. Quantitative investigation of the effects of EGR strategies on performance, cycle-to-cycle variations and emissions characteristics of a higher compression ratio and heavy-duty NGSI engine fueled with 99% methane content. Fuel 2020, 263, 116736. [Google Scholar] [CrossRef]
- Lampert, J.; Kazi, M.; Farrauto, R. Palladium catalyst performance for methane emissions abatement from lean burn natural gas vehicles. Appl. Catal. B Environ. 1997, 14, 211–223. [Google Scholar] [CrossRef]
- Du, Y.; Yu, X.; Liu, L.; Li, R.; Zuo, X.; Sun, Y. Effect of addition of hydrogen and exhaust gas recirculation on characteristics of hydrogen gasoline engine. Int. J. Hydrogen Energy 2017, 42, 8288–8298. [Google Scholar] [CrossRef]
- Bounechada, D.; Groppi, G.; Forzatti, P.; Kallinen, K.; Kinnunen, T. Enhanced Methane Conversion Under Periodic Operation Over a Pd/Rh Based TWC in the Exhausts from NGVs. Top. Catal. 2013, 56, 372–377. [Google Scholar] [CrossRef]
- Delmon, B.; Froment, G.F. Catalyst Deactivation; Elsevier Science Press: Amsterdam, The Netherlands, 1998. [Google Scholar]


© 2020 by the authors. Licensee MDPI, Basel, Switzerland. This article is an open access article distributed under the terms and conditions of the Creative Commons Attribution (CC BY) license (http://creativecommons.org/licenses/by/4.0/).