Article

Evaluating Public Policies for Fair Social Tariffs of Electricity in Brazil by Using an Economic Market Model

ISEE-Institute of Electrical Systems and Energy, Federal University of Itajuba, Itajuba MG 37500-903, Brazil
*
Author to whom correspondence should be addressed.
Energies 2020, 13(18), 4811; https://doi.org/10.3390/en13184811
Submission received: 14 July 2020 / Revised: 25 August 2020 / Accepted: 8 September 2020 / Published: 14 September 2020
(This article belongs to the Special Issue Energy Demand and Prices)

Abstract

:
This paper presents an evaluation of public policies for fare social tariffs of electricity in Brazil by using an economic model of the electricity market (TAROT-Optimized Tariff) that represents the regulated market of distribution of electrical energy. It was considered the scenario of an increasing number of prosumers (residential consumers who self-generate energy) in two of the five major regions of Brazil which have quite different socioeconomic characteristics. However, the current electricity regulation is the same for all concessionaires. In this work a new public policy is proposed, allowing the use of regulation in a different way aiming for a best result for Brazil and particularly for the poor population that today are not able to enjoy the benefits of electricity due to high tariff values. It is also discussed how this can contribute in a positive way to improve the income distribution in these regions, which is evaluated by using the GINI index.

1. Introduction

The Brazilian energy market is regulated by ANEEL (Brazilian Electricity Regulatory Agency) which has established the tariff calculation procedures for all distribution companies in the country. The premises followed by ANEEL ideally aim fair tariffs for consumers and for the electricity companies. Therefore, public policies are designed to make sure that the population will have access to electrical energy and the regulatory contractual requirements will be guaranteed for the concessionaires [1].

1.1. Motivation and Incitement

There are government programs to promote distributed generation (GD) and boost this market by giving consumers the chance of producing renewable energy [2,3]. In addition, there is also an electrical energy social tariff (TSEE) program for the low-income population. However, socioeconomic characteristics are quite different in each region of Brazil, and because of this, the present public policies, which are a cross-subsidized, do not cause the same impact on all consumers (especially for the ones living in poor regions [4,5]).

1.2. Contribution

The main contribution of this paper is to review the application of the same public policies for all regions and propose changes in its formulation, and deciding which best public policy could be applied to improve the situation of those consumers. Besides reducing energy poverty, one must also consider how this policy contributes for improving the income distribution in each region. With the Smart Grids scenario being globally promoted, a truly Smart Market should also care about minimizing energy poverty and promoting socioeconomic justice. In Brazil there are both cases of energy poverty, since for the average income of families, electricity is still too expensive. According to Brazilian Institute of Geography and Statistics (IBGE) [6,7], 99.8% of the Brazilian residences have access to electrical energy. The 0.2% of the population corresponds to about 140,000 homes without any access to electrical energy at all. According public data from ANEEL [8], about 12% of energy consumers are considered low-income consumers and, therefore, are getting discounts on their energy bills. In order to cope with these challenges, an economic model of the market is used in this work to reveal the fallacies of the actual tariff police discount and propose a new public policy. Therefore, after this brief introduction presenting the motivation for this work and its contributions, this paper is organized as follows: Section 2 presents a literature review and the currently social electricity tariff scheme used in Brazil. Section 3 discusses the impact of distributed generation in amplifying the energy poverty problem. Section 4 presents the fundamentals of the Optimized Tariff (TAROT) economic model and the use of the GINI index in order to assess the customers income distribution. Section 5 presents and discusses the simulated results of the proposed energy policy showing the variation in the main economic variables: tariff, income distribution, socioeconomic welfare. Finally, Section 6 shows the research work’s main conclusions.

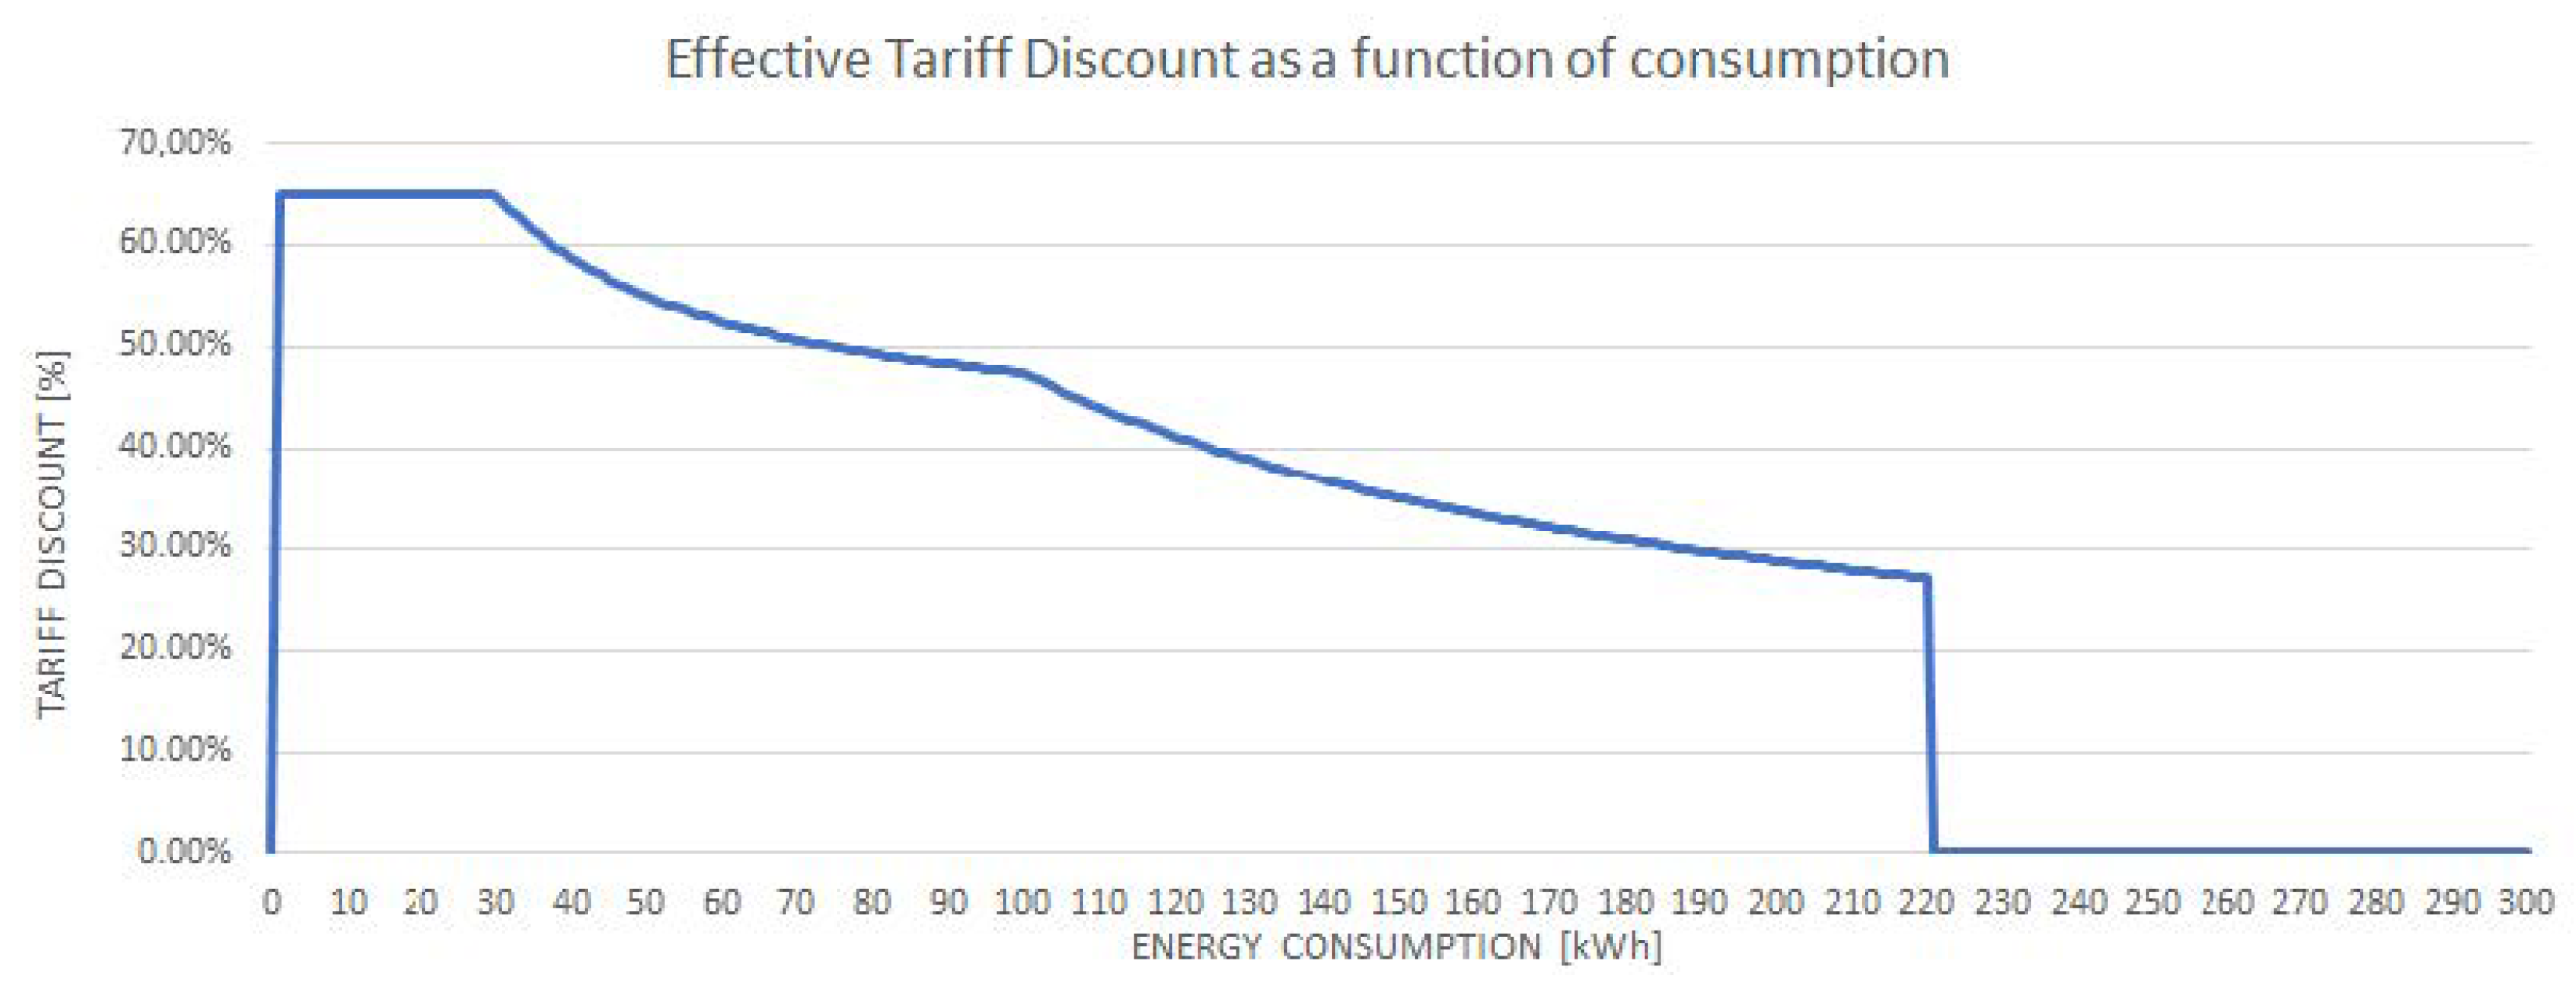
2. Social Electricity Tariff

There are many works in the literature that discuss energy policies, economics and technological approaches such as measuring energy efficiency in social housing in a case study in Brazil [9], constructing energy poverty profiles for an effective energy policy [10], policy implications of energy poverty indicators [11], socioeconomic indicators for the analysis of electricity distribution concessionaires in Brazil [12], study about reconsidering energy poverty policies [13], the political economy of energy poverty and what are key challenges [14], a critical perspective on energy poverty policies in the European Union [15], an evaluation on fuel poverty policy in Northern Ireland using a geographic approach [16], measurement of spatial socioeconomic impact of energy poverty [17], the energy poverty and social relations [18], the examination of the relationship between energy poverty and measures of deprivation [19], strengthening the EU response to energy poverty [20], and also an energy poverty overview [21]. All these works are showing concern for the less fortunate people who cannot benefit from electricity because of their socioeconomic conditions, a phenomenon known as energy poverty. In Brazil’s case, the Electrical Energy Social Tariff (TSEE) [22] is a public policy aimed at favoring the low-income population and providing better access for this population to the benefits of electricity. There is no doubt that with electrification, income growth and socioeconomic developments follow up. But it is relevant to adjust the energy policies to be less bureaucratic, less costly and more effective for the people in need. Currently in Brazil, the Electrical Energy Social Tariff (TSEE) is regulated by Law Nr. 12212 of 2010 and by Decree Nr. 7583 of 2013. It covers the Group B consumers, more specifically the group B1-Low Income, Indigenous and Quilombola. It consists of tariff discounts incident over the conventional residential tariff as shown in Table 1. Table 2 indicates how many low-income consumer units there were in Brazil in each of its country regions in December of 2018, and how much was subsidized in this same month. It is easy to see that each region has a different number of low-income consumers, and the northeastern region is the one with the largest relative percentage number of low-income consumers and the southern region is the one with the lowest.
Being the percentages of the Social Electricity Tariff (TSEE) applied cumulatively (according to Table 1), then a low-income consumer with a total monthly consumption of 220 kWh would have:
  • 65% discount on the tariff over 30 kWh ————> (0.35*Tariff)*30 kWh = 10.5*Tariff.
  • 40% discount on the tariff over 70 kWh ———–> (0.60*Tariff)*70 kWh = 42*Tariff.
  • 10% discount on the tariff over 120 kWh ———–> (0.90*Tariff)*120 kWh = 108*Tariff.
It will then pay a total electricity bill of: ( 10.5 + 42 + 108 ) * Tariff = 160.5*Tariff, whereas for a common consumer the electricity bill would be: 220*Tariff.
Figure 1 shows that the percentage of discounts depend on the energy consumption of each low-income consumer. Considering that this work is an analysis using average consumer data, it was assumed that all consumers have the same energy consumption profile. Therefore, two non-cumulative discount bands were chosen to carry out the study.
The discounts listed in Table 1 are cumulative as illustrated in Figure 1 and yet, as can be seen in Figure 2, and Figure 3 the electricity consumption by low-income consumers is lower than that of common consumers and the average discount on the electricity bill is only R$ 20. It is very clear the difference in the consumption among regular and low-income consumers since the value of the discount is very low. Due to the clear differences among regions, applying this small discount in the electricity tariff for the low energy consumption class does not seem to be a much effective as public policy. Eventually, the total regulatory cost of having this policy in place might be greater than its actual benefits it causes. Table 3 presents the socioeconomics characteristics of the five geographical regions in Brazil, with their GINI index. The difference between regions is clear when data on average income and average energy tariff are analyzed. Although the tariff value is close, the impact on average income in each of these regions is quite different. The average income in the southern is almost double the average income in the northeastern. GINI index also makes clear the difference between regions.

3. How Distributed Generation (Dg) Can Intensify This Difference

The impact of Distributed Generation (DG) on low-income consumers and its impact on energy poverty has been studied in various ways: there are studies about the effective way to overcome domestic energy poverty in developing regions using solar home systems [24], an Indian case also about solar home systems to reduce energy poverty [25] and there is a study questioning if the renewable’s are affecting income distribution and increasing the risk of household poverty [26]. In Brazil there is an aggravation scenario in this situation, when evaluating the history of average electric energy tariffs. Figure 4 shows the trend of tariff increases in the period of 2011–2020. By increasing the common residential electricity tariffs, the TSEE has also increased and this has led to even more socioeconomic discrepancy among these consumers. Figure 5 presents a graph illustrating the percentage of Distributed Generation (DG) connections per consumption class in 2018. However, unfortunately, the low-income residential consumer class and a big part of the Brazilian population are unable to use DG as a means for getting possibly cheaper electricity. That is, they will have to keep paying the growing concessionaires’ tariffs.
Figure 6 demonstrates how it was the share of individual power plants in Brazil in 2019. The proportion of solar energy is still very low in relation to hydraulics. Figure 5 presents a graph illustrating the percentage of Distributed Generation (DG) connections per consumption class in 2018. However, unfortunately, the low-income residential consumer class and a big part of the Brazilian population are unable to use DG as a mean for getting possibly cheaper electricity. That is, they will have to keep paying the growing concessionaire’s tariffs. A greater penetration of renewable generation in the electrical distribution systems, such as the installation of photovoltaic panels, would result in a reduction in the concessionaires’ revenue. In the current Brazilian regulatory model, the tariff is defined by ANEEL, in order to guarantee the concessionaire’s financial and economic equilibrium. In a context of high penetration of renewable DG, the reduction in the concessionaire’s revenue would be offset by ANEEL, allowing for higher tariff increases. Ultimately, the increase in tariffs would also impact low-income consumers, increasing energy poverty. There is not a correlation in the discussed period of the 2011–2020 price increase with the increase in Distributed Generation. These data have been put in place to show that captive consumers see rising tariffs as an incentive to become prosumers. The more prosumers are in the system, due to regulatory premises to maintain the financial economical equilibrium of the distribution companies, the electricity tariff will increase, resulting in a greater burden for common consumers and even greater burden on the low-income consumers. Considering the current very low relative number of prosumers in Brazil, there was not an evident increase in electricity prices during their installation. The increase in tariffs presented in Figure 4 is related to the other tariff components of the current Brazilian regulatory system, such as overinvestments of distributors in the sector, since the return on investments made in the sector are ensured by the current regulation and are part of the tariff calculation base. Other governance, environmental, geographical, socio-economical and regional characteristics also affect the power distribution companies’ performances, thus impacting their respective electricity tariffs.
Therefore, in this paper, the regulatory economic market model TAROT is applied taking into consideration the increase in the number of prosumers (consumers who produce their own energy), ordinary consumers and low-income consumers, in order to assess how the current TSEE public policy affects the regions already specified, and evaluate possible solutions.

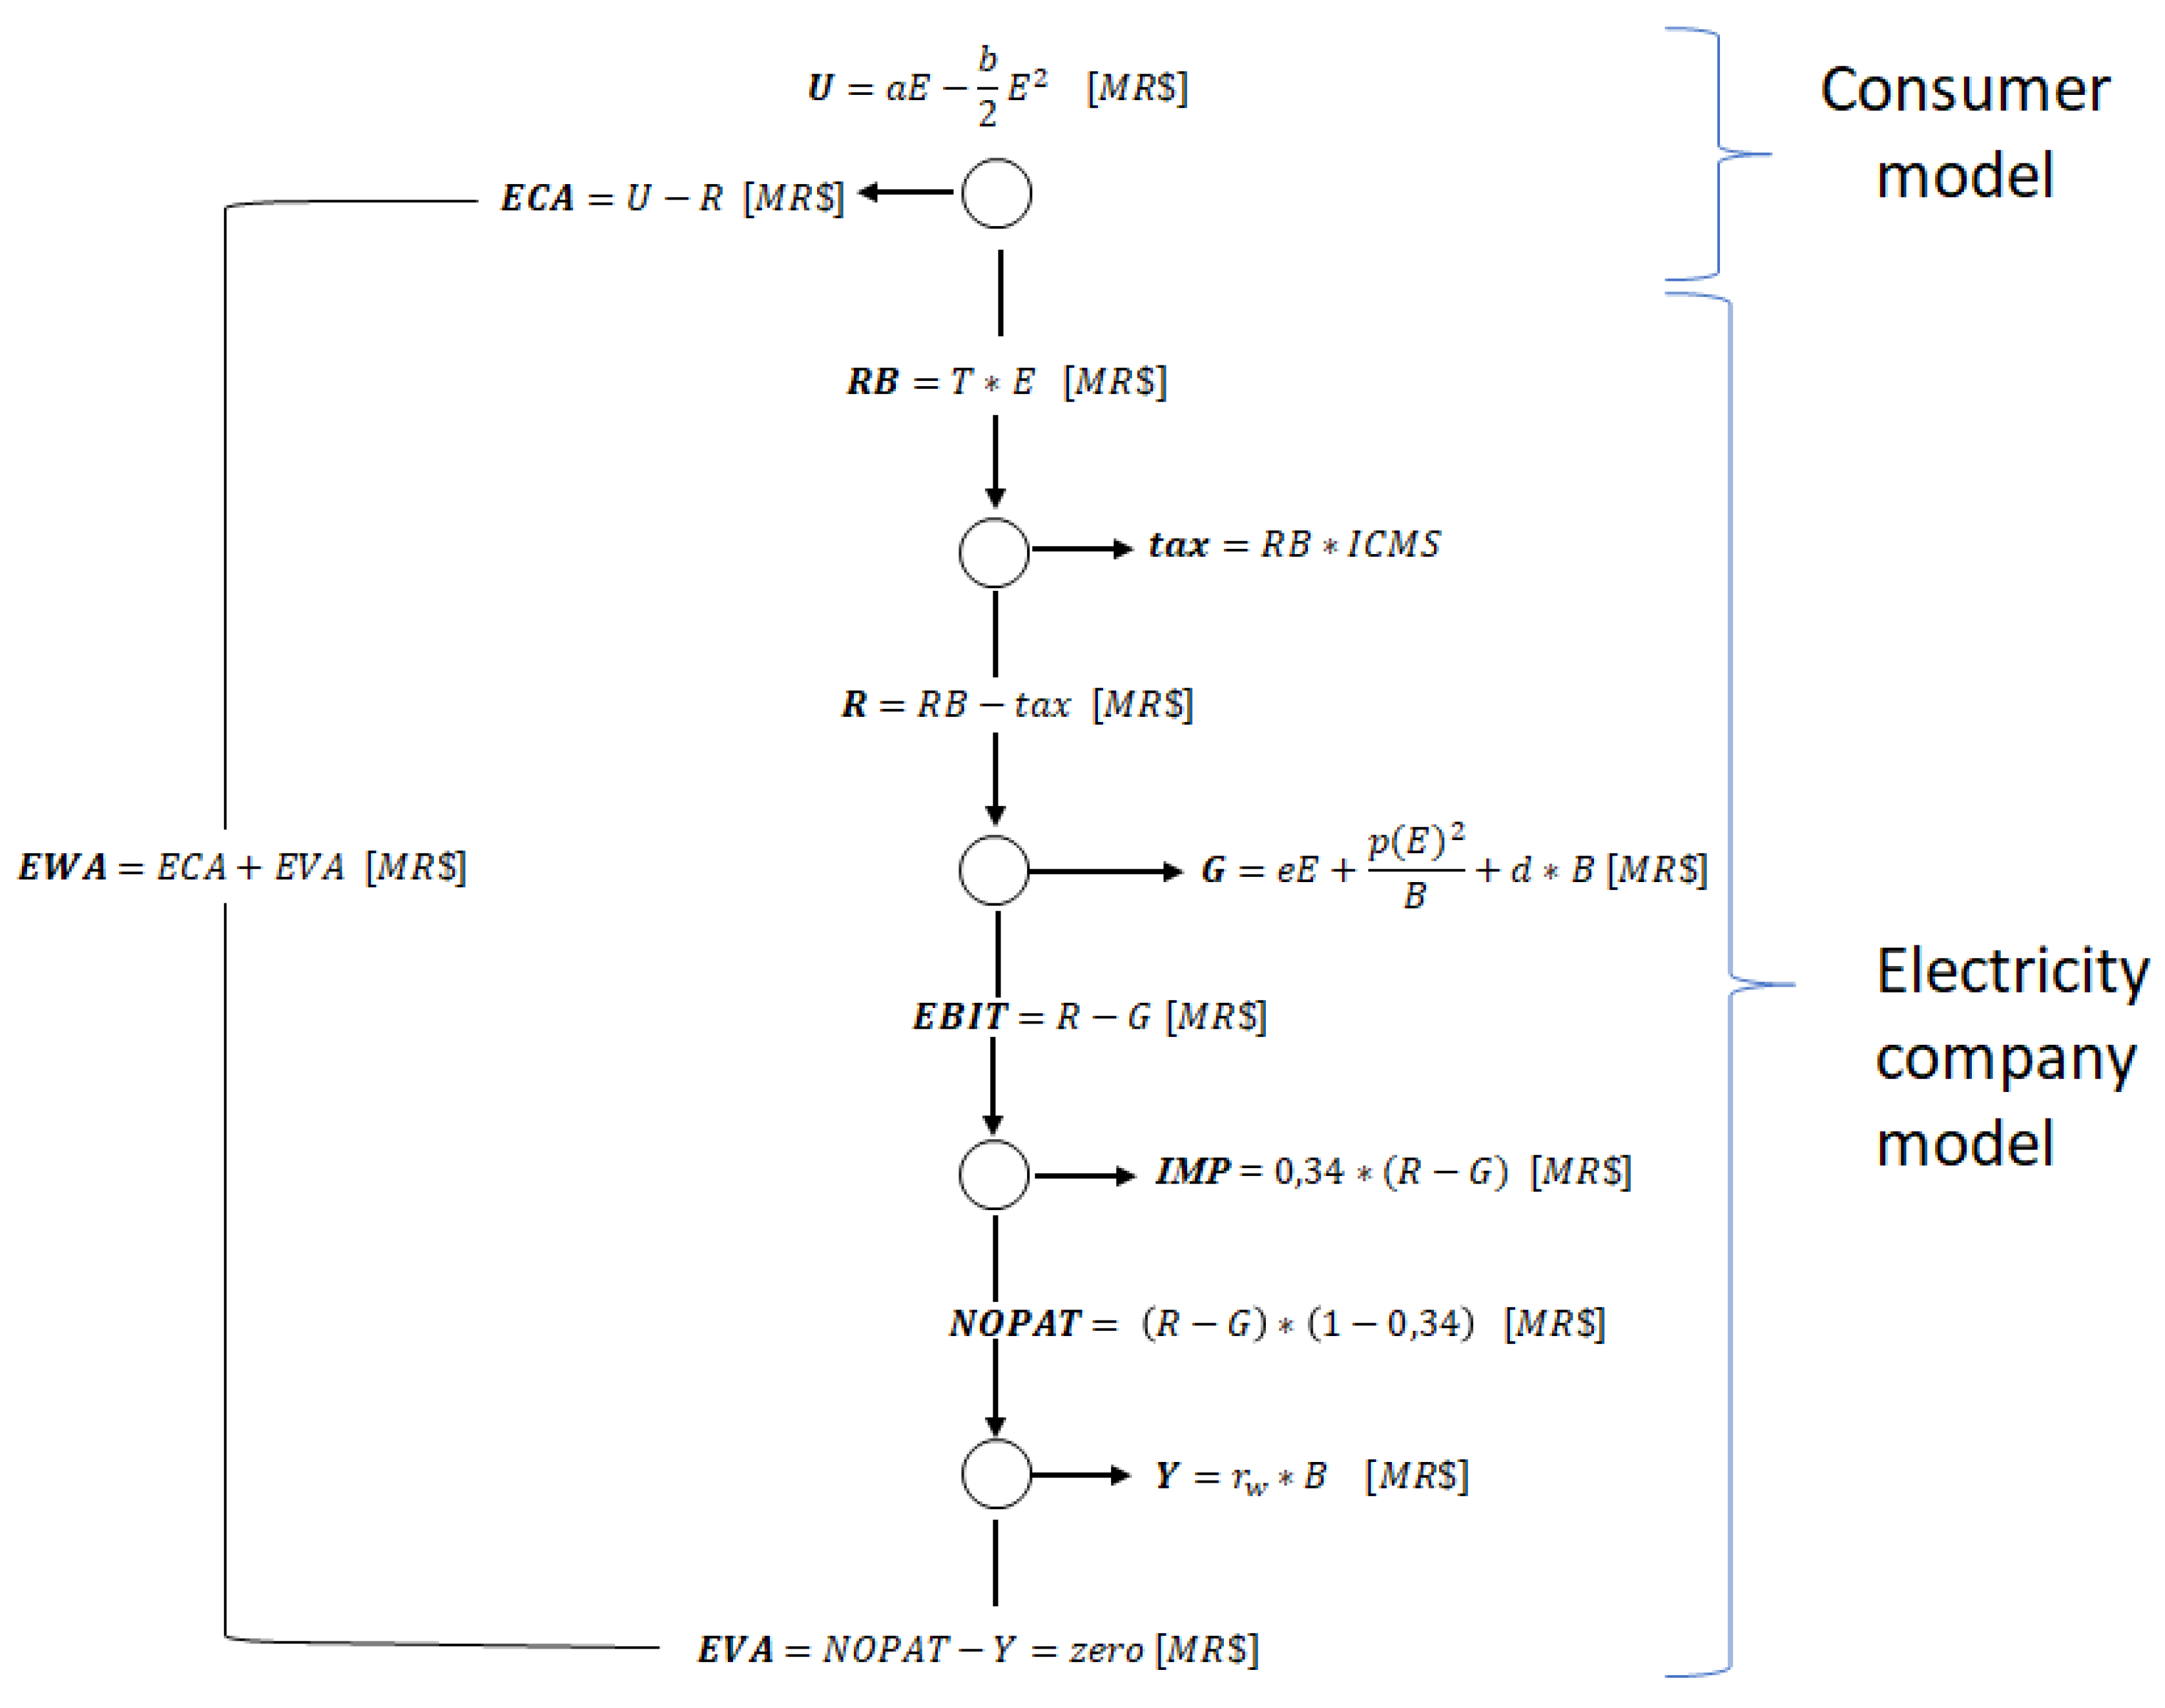
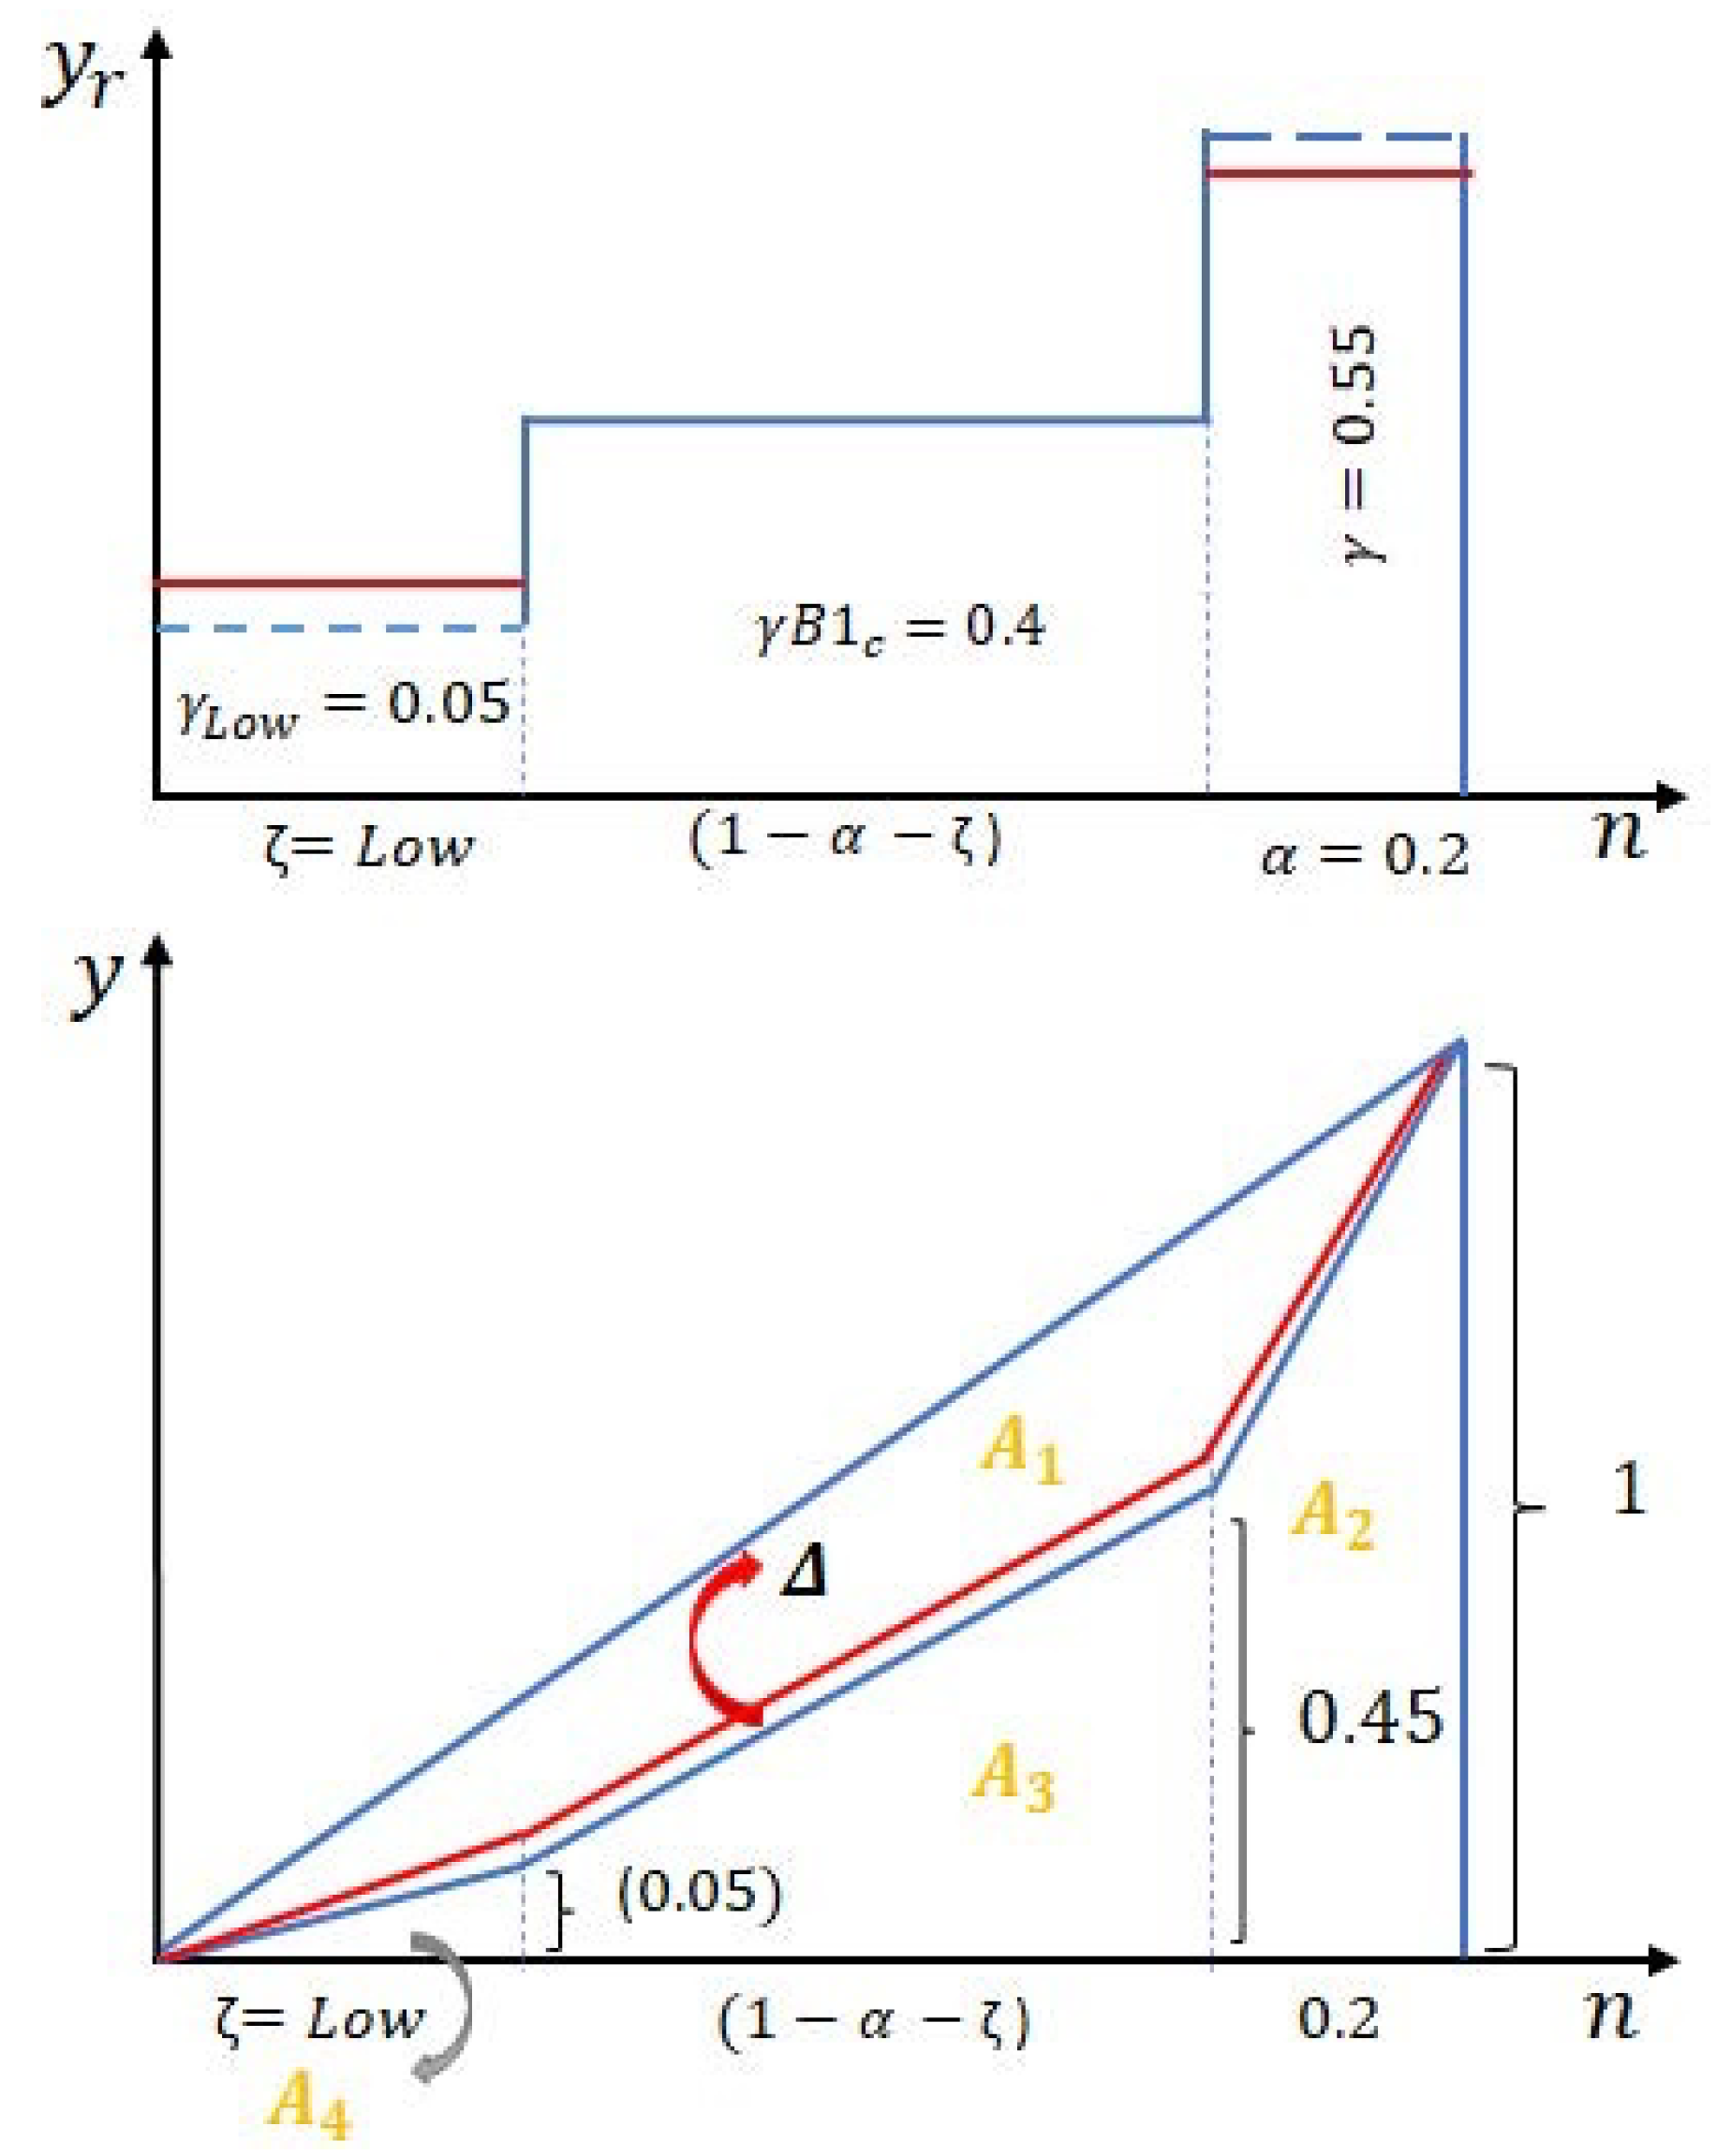
4. Regulatory Economic Market Model

The regulatory economic electricity market model that is used in this work is the TAROT. This model was already used to analyse the impact of electricity theft on power quality [30], for evaluation of public policies in smart grids [31], to do a socioeconomic analysis of incentive public policies for the use of renewable energy per consumer class in Brazil [32], aggregated economic analysis of the Brazilian electricity distribution companies [33], the impact of quality investment in the electricity market [34], economic evaluation of regulatory tariff risk planning for a Brazilian electric Power Company [35], etc. It is a model that represents the Brazilian regulated electricity distribution market. Using TAROT, it is possible to determine the value of the optimal regulatory tariff to be paid by all consumers, considering an optimized investment to maximize the socioeconomic well-being ( E W A = E C A + E V A in Figure 7), which is the main regulatory premise set by ANEEL. Figure 7 presents the model structure as an economic flow among the market agents, where: U—represents the economic utility for the use of electricity by consumers; E C A —represents the consumers surplus; RB-represents the gross revenue of the electricity company; t a x —represents the sales tax, which takes part of the revenue that goes to government; R—represents the revenue after tax; G—represents the costs of the concessionaire (purchase of energy and operating costs ( e E ), costs of technical and non-technical losses (( p * E 2 ) / B ) and the depreciation of investments ( d B )); E B I T —represents the Earnings Before Interests and Taxes, i.e., the profit before income taxes; I M P —income tax = t * ( E B I T ) ; t—represents the tax rate over company’s income; NOPAT—Net Operating Profits After Taxes ; Y—remuneration of capital; r w —represents the compensation ratio of the invested capital i.e., the Weighted Average Cost of Capital (WACC); B—represents the optimized basis of capital remuneration; E V A —Economic Valuer Added (EVA is a Stern & Stewart trademark); E W A —Socioeconomic welfare added to society; e, p, d—are adjustable coefficients that aim to approximate the costs to the real situations; E-is the amount of consumed electrical energy.
The parameters a and b represent the consumer eagerness and the satiety, and are calculated using data from the tariff regulatory review process and consumer characteristics, by Equations (1) and (2), respectively:
a = ( 1 + 1 ε ) * T
b = E ( ε * T )
where: T-consumers average electrical energy tariff; and ε -consumers demand-price elasticity (assumed ε = 0.055).
After calculating the TAROT parameters for a distribution company, it is possible to determine the optimized tariff without separation between the types of consumers. That is the reference of electricity tariff ( T R ). The reference tariff ( T R ) is the smallest tariff that consumers B1c and Low would pay (all prosumers, B1c and Low pay for the energy purchased (E)). Then the respective company’s revenue is given by Equation (3):
R = E * T R
Splitting the percentage of energy between prosumers ( δ ) and common consumers ( 1 δ ), one can determined the value of the tariff needed to be paid by prosumers assuming that the common consumers continue to pay the reference tariff. The company’s revenue can then be rewritten as in Equation (4):
R = δ * E * T p r o + ( 1 δ ) * E * T R
Now, the model can be deeper detailed in revenue and energy consumption type, for 3 types of consumers: B1c-common consumers, Low-low-income consumers and Prosumers (those who produce their own energy). Thus, knowing the percentage of energy consumed by Low-income consumers ( β ) with respect to common consumers, the company’s revenue can be rewritten according to the energy used by each consumer class and the energy tariff paid by each of them, as presented in Equation (5):
R = E p r o * T p r o + ( 1 δ ) * [ ( 1 β ) * E * T B 1 c + β * E * ( 1 d i s c o u n t ) * T R ]
where: E p r o —prosumers energy; T p r o —prosumers tariff; δ —percentage of energy due to prosumers (assumed, for this academic study as 10%); E B 1 c = (1- δ )*(1- β )*E—common consumers energy; T B 1 c — tariff of common consumers; E L o w = (1- δ )* β *E—Low-income energy; TSEE— tariff of low-income consumers; E T = E B 1 c + E L o w ; β —is the percentage of energy associated with low-income consumers, based on values from ANEEL (Table 4).
The Prosumers tariff remains the same (previously calculated), and the TSEE is calculated as a discount over T R and considering that the discount was based on the value of the optimal tariff. The costs for the electricity company consider only the consumers with type B1c and Low, and are presented in Equation (6):
G = e * E T + p * E T 2 B + d * B
The intent prosumers consumption tends to be low and their compensation mechanism for the surplus of generated energy uses the same tariff in the present regulation. So, only the common consumers are overcharged due to the tariff percentage of discount applied to get the TSEE. Using Equation (5) and knowing that the discount at TSEE will be given on the reference tariff ( T R ), the only term to be determined is the common energy tariff ( T B 1 c ). Thus, it can be determined how the public policy impacts on all common consumers. For this it is given the discount that is already considered in Table 1. It was chosen the value of 10% and the value of 65%. A suggestion of new public policy is to withdraw the tax over sales (ICMS) ceasing to be a cross-subsidy, as will be demonstrated later in this paper.
Figure 8 presents a flowchart with the steps of the study.
In order to assess the income distribution, it is used the GINI index, since this is a widely used method for evaluating inequality in income distribution as exemplified in [36,37,38]. For example, a perfectly equal income distribution has GINI index of zero, whereas a total unequal distribution has GINI index equal to one, as illustrated in Figure 9. Figure 10 illustrates how the GINI Index was calculated (for this specific study), being Δ = the difference between the GINI Index before and after the applied tariff discount, ’yr’= relative level of income, ‘y’= cumulative percentage (or per unit) of income participation , ‘n’= percentage (or per unit) of population, where: γ L o w —percentage (or per unit) of income related to Low-income consumers; γ —percentage (or per unit) of income related to wealthier consumers; γ B 1 c —percentage (or per unit) of income related to common consumers; ζ —Percentage (or per unit) of Low-income consumers, that is, the poorest consumers; α - percentage (or per unit) of the wealthiest consumers; (1- α - ζ )—cumulative percentage (or per unit) of the common consumers. It is assumed that the share ( α < 0.50) of the wealthiest inhabitants receives total inflows equal to the share ( γ > 0.50) of the total income of the country. In this study it was adopted α = 0.20 and γ = 0.55. What is considered is that with the reduction of the tariff, there is an equivalent increase in the income of the low-income consumers. Before, those consumers used to spend an “X” amount of their income with the electricity bill, and now they will spend “X- Δ X”. Then, it can be said that there was a relative transfer of income from the richest to the poorest, and this indicates a reduction in the inequality. For this study, the distribution of income was based on [23] and it was assumed that only 10% [39] of their income was spent on electricity bills.
For the main purpose of this paper and based on the Figure 10 the calculation of the GINI Index is performed according to Equation (7). A GINI Index equal to zero means an equally income distribution:
G I N I I n d e x = A 1 A 1 + A 2 + A 3 + A 4
On the other hand, according to the current public policy and regulation, in order to pay for the discounts given to the poor, the common consumers tariff increases. They used to pay “Y” and now they will spend “Y + Δ Y” in their electricity bill.
The data of the regions for this study are presented in Table 4, Table 5, Table 6 and Table 7, and it was chosen one electricity company for each state of the two geographic regions of Brazil, i.e., the northeastern region, with the highest relative percentage (24.59%) of low-income consumers and the southern region, with the lowest (5.00%) of low-income consumers in relation to the total number of consumers in each region, respectively (see Table 2. With the TAROT model the parameters of Table 8 and Table 9 can be determined. It was compared the lowest and highest discount allowed by the current regulation (Table 9) in comparison to the proposal of a new type of discount as a social electricity tariff: withdrawn one of the sale taxes applied to the tariff, the ICMS, and then evaluate its effects on deconcentrating income to the entire population. With all these data, the simulation was done and the results are presented and discussed in the next section.

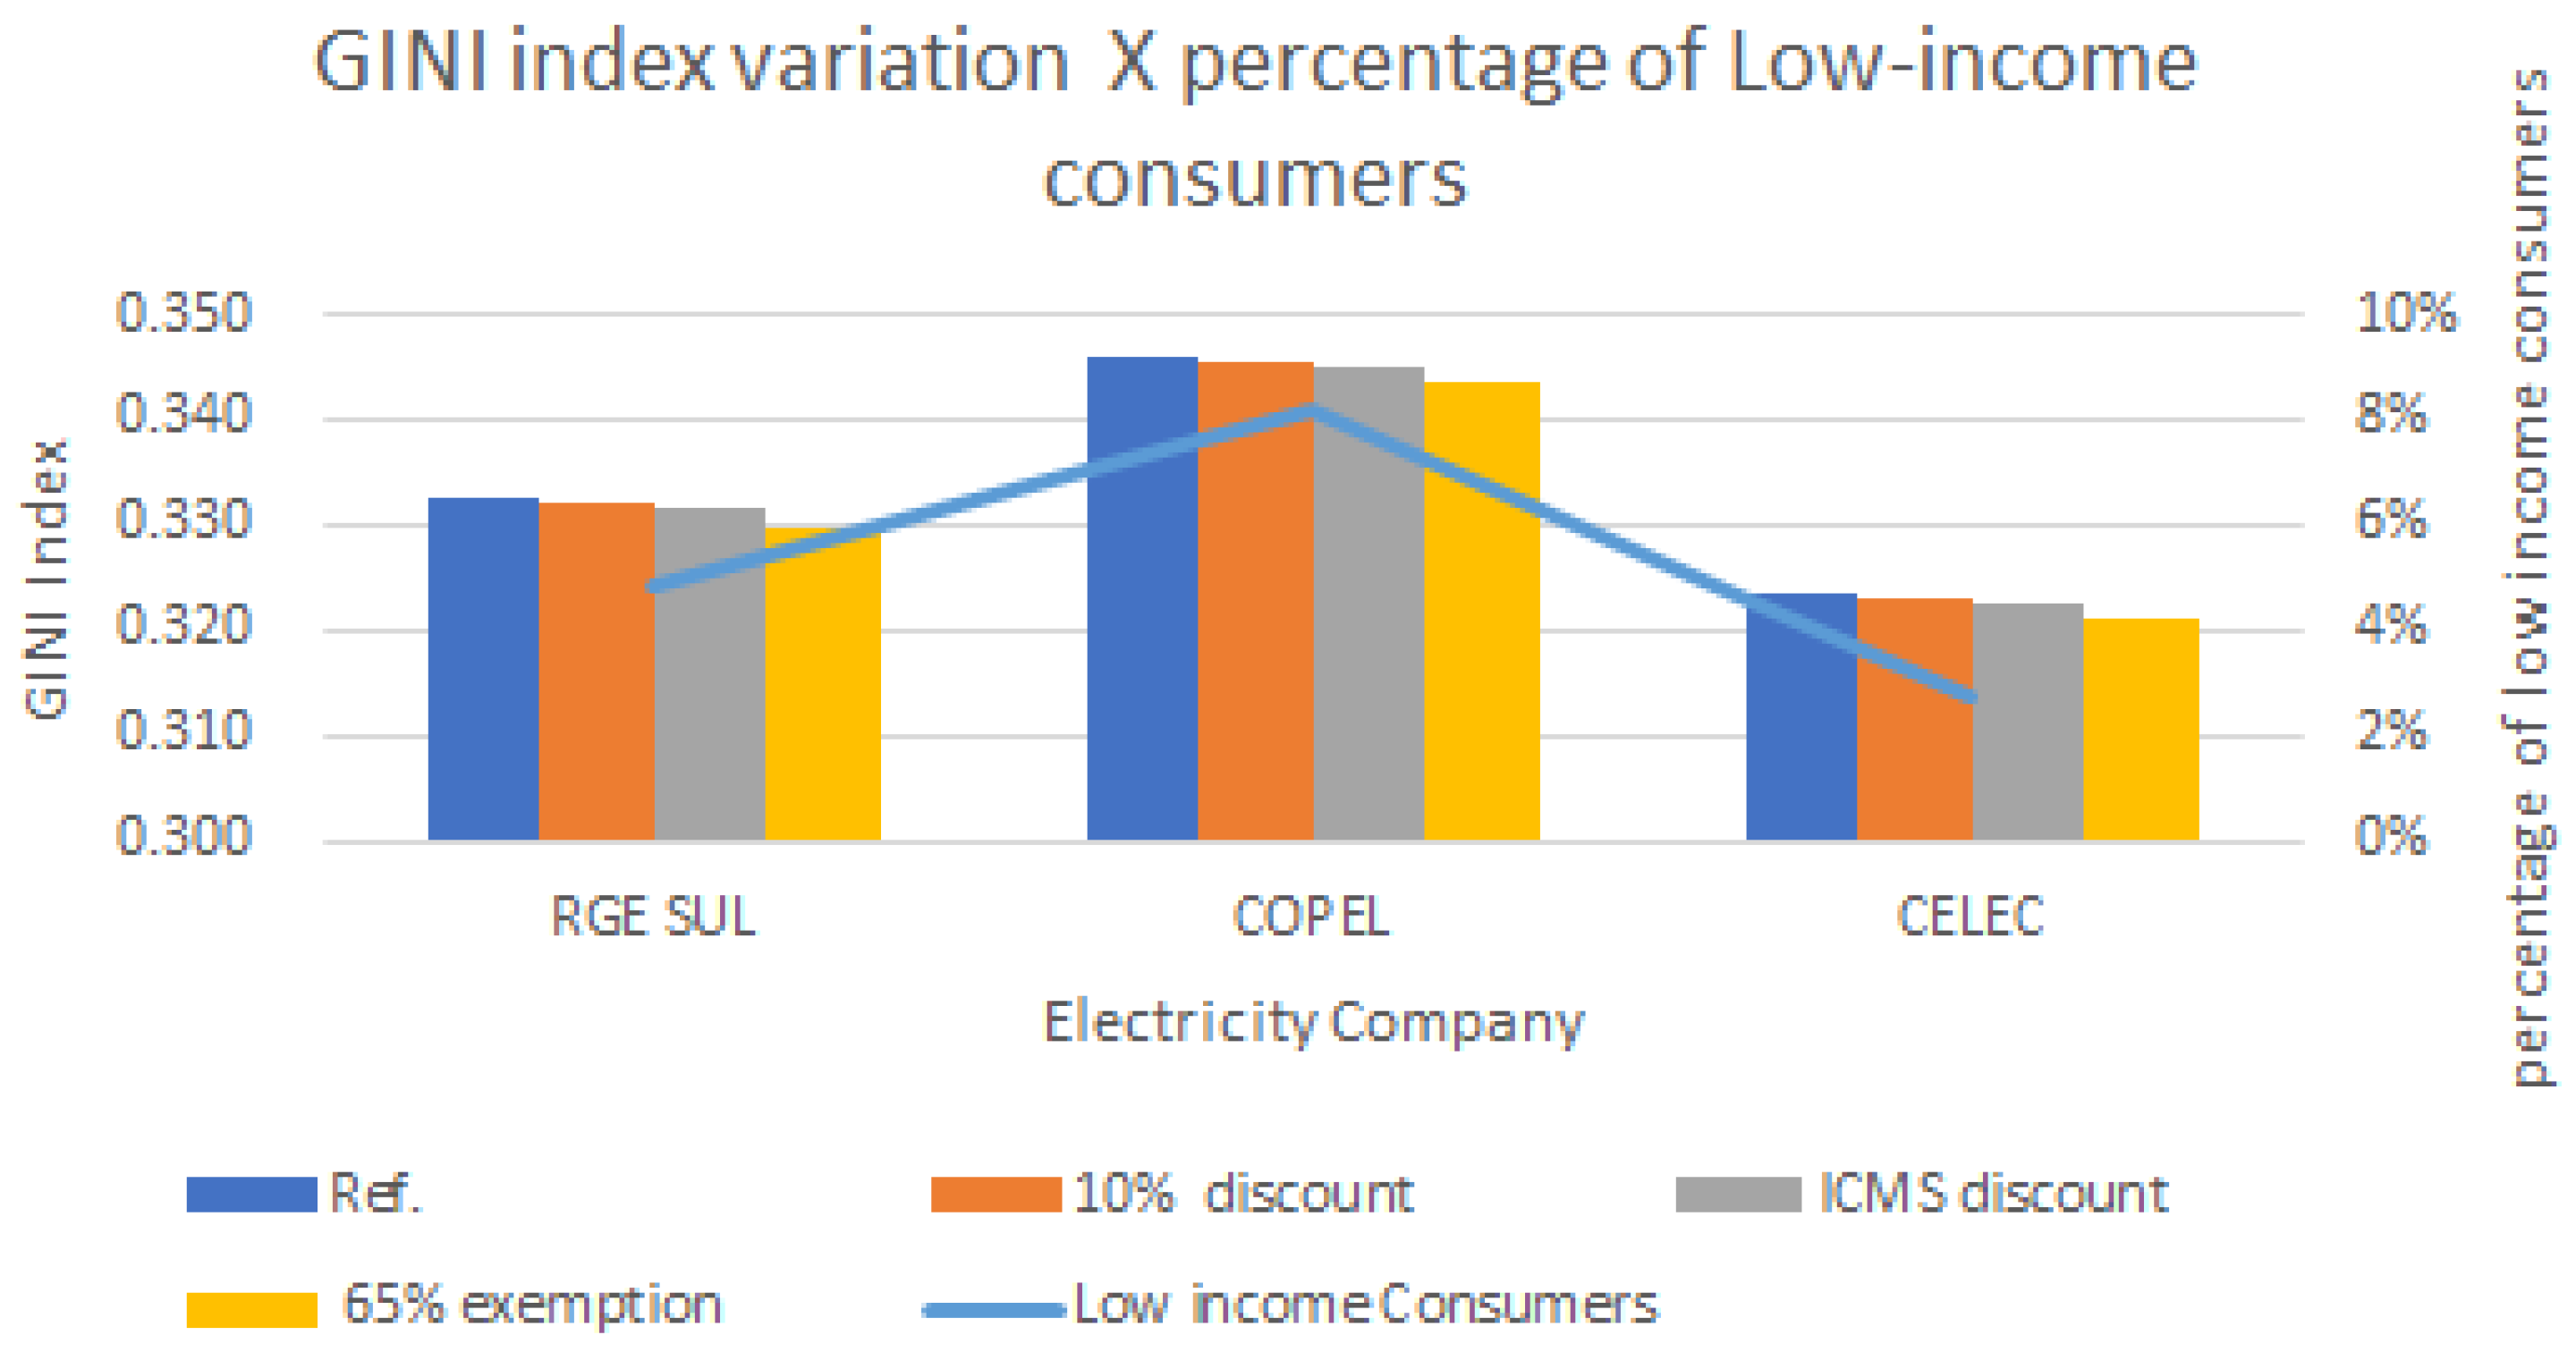
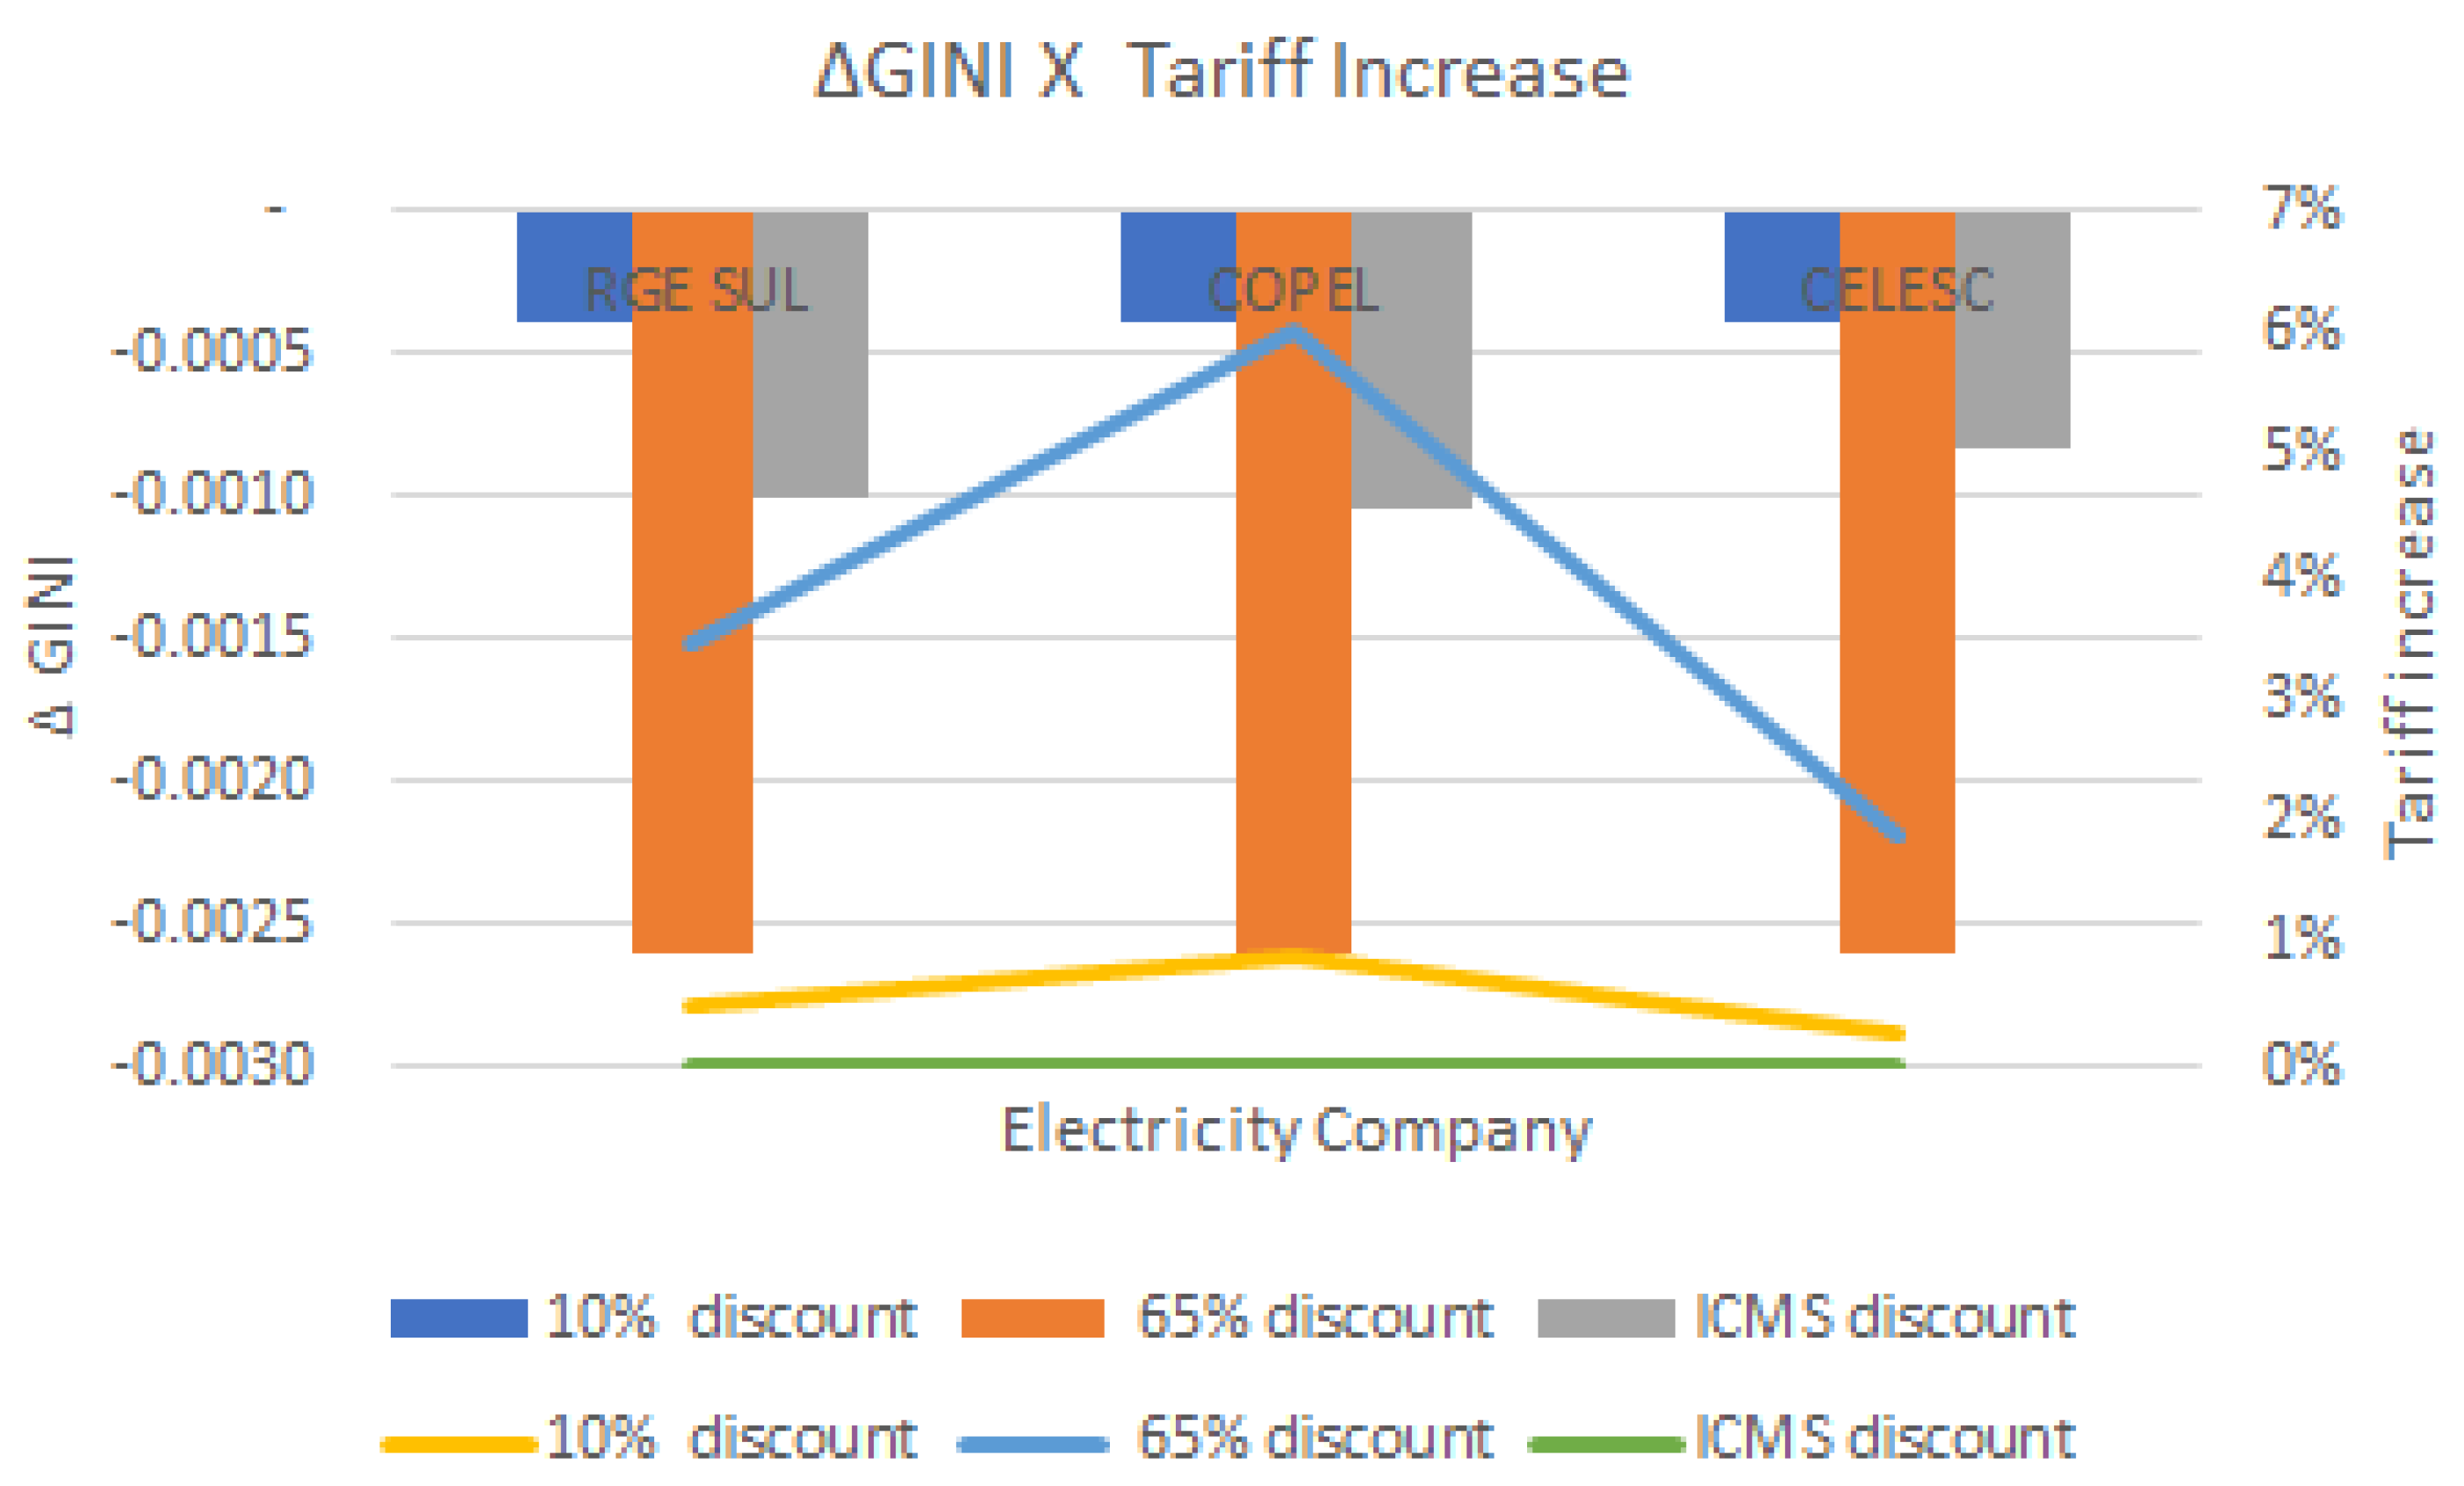
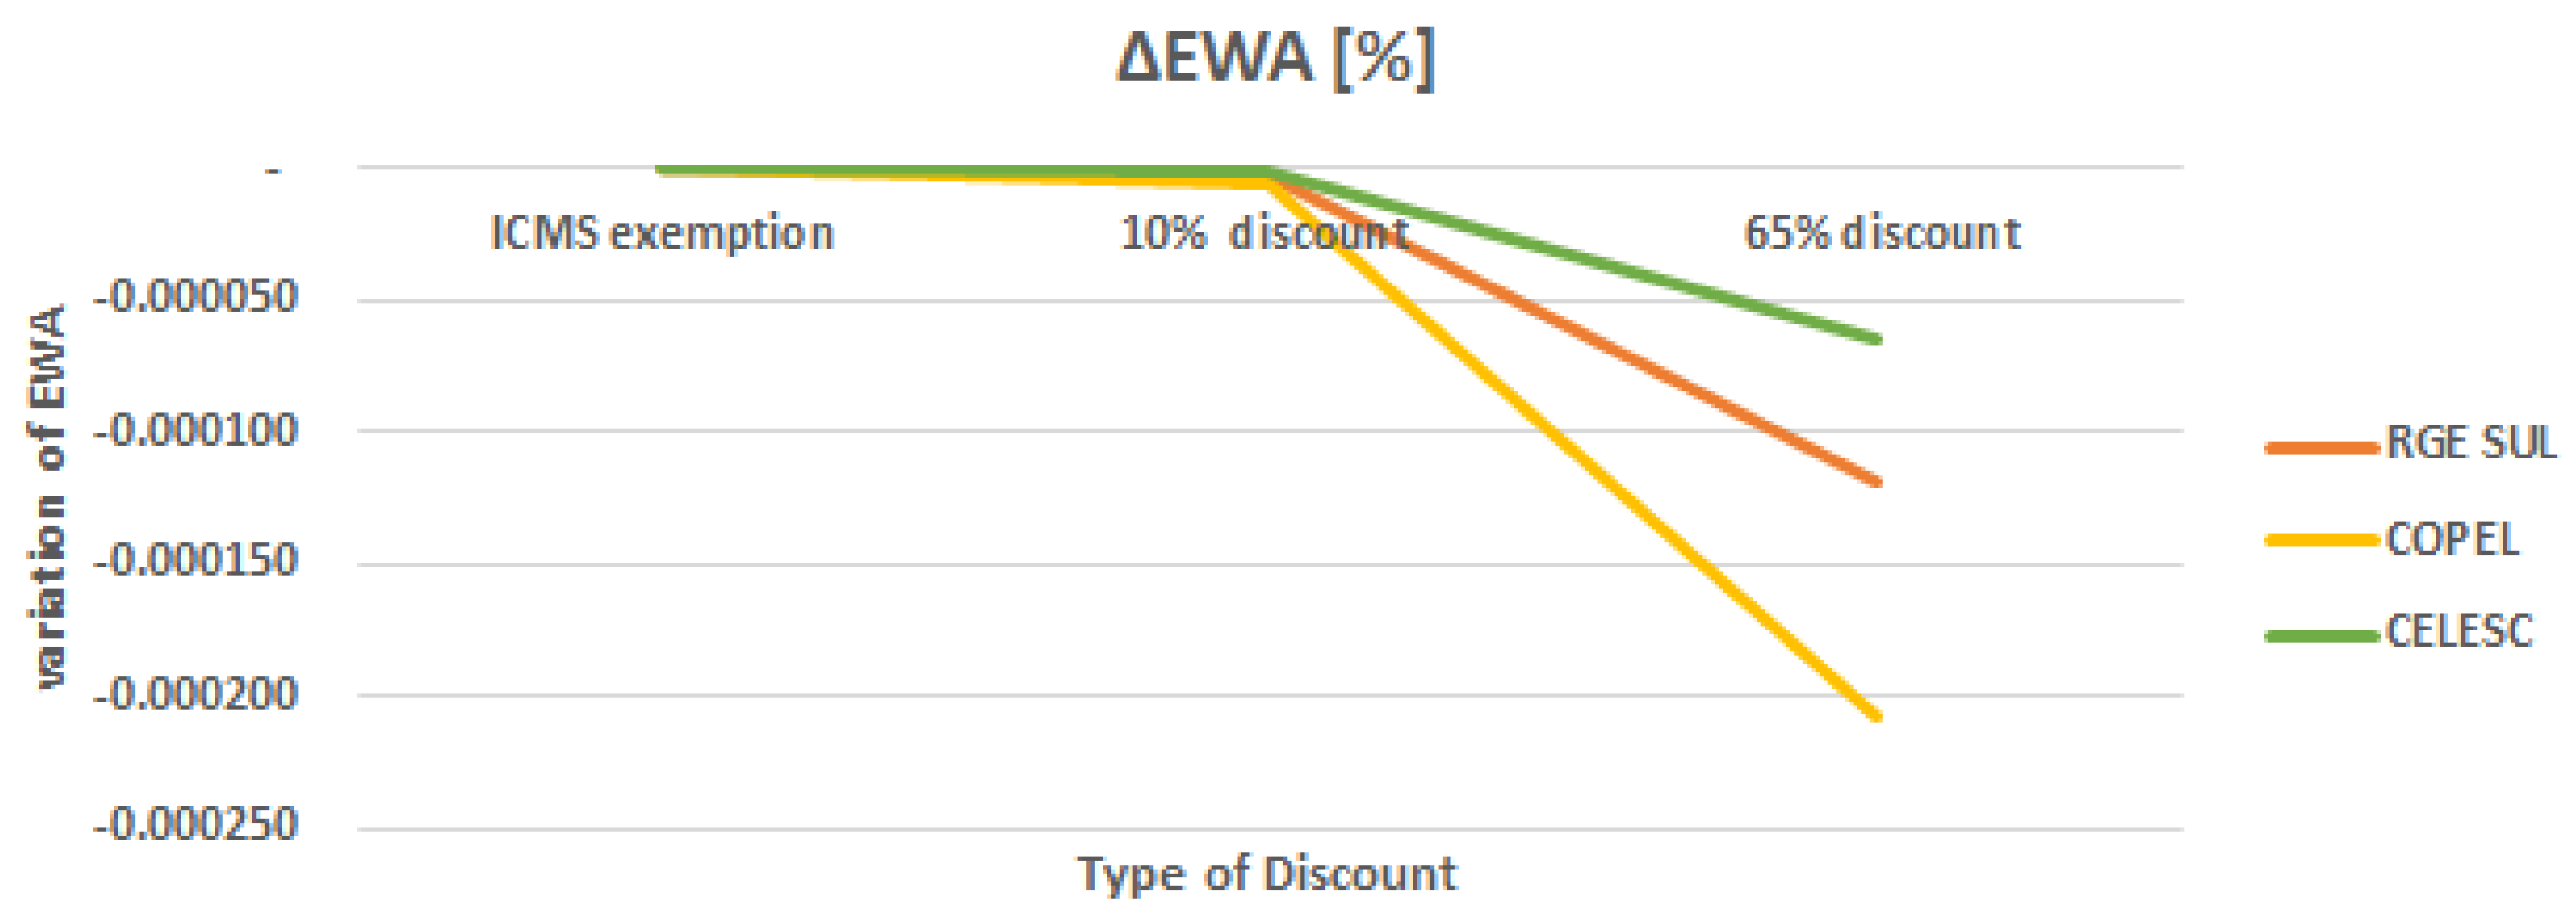
5. Simulation Results and Discussions

The simulation results are presented and discussed here, separated by region, in order to highlight that the same energy policy causes different and relevant impacts on society, mainly in the poor people.

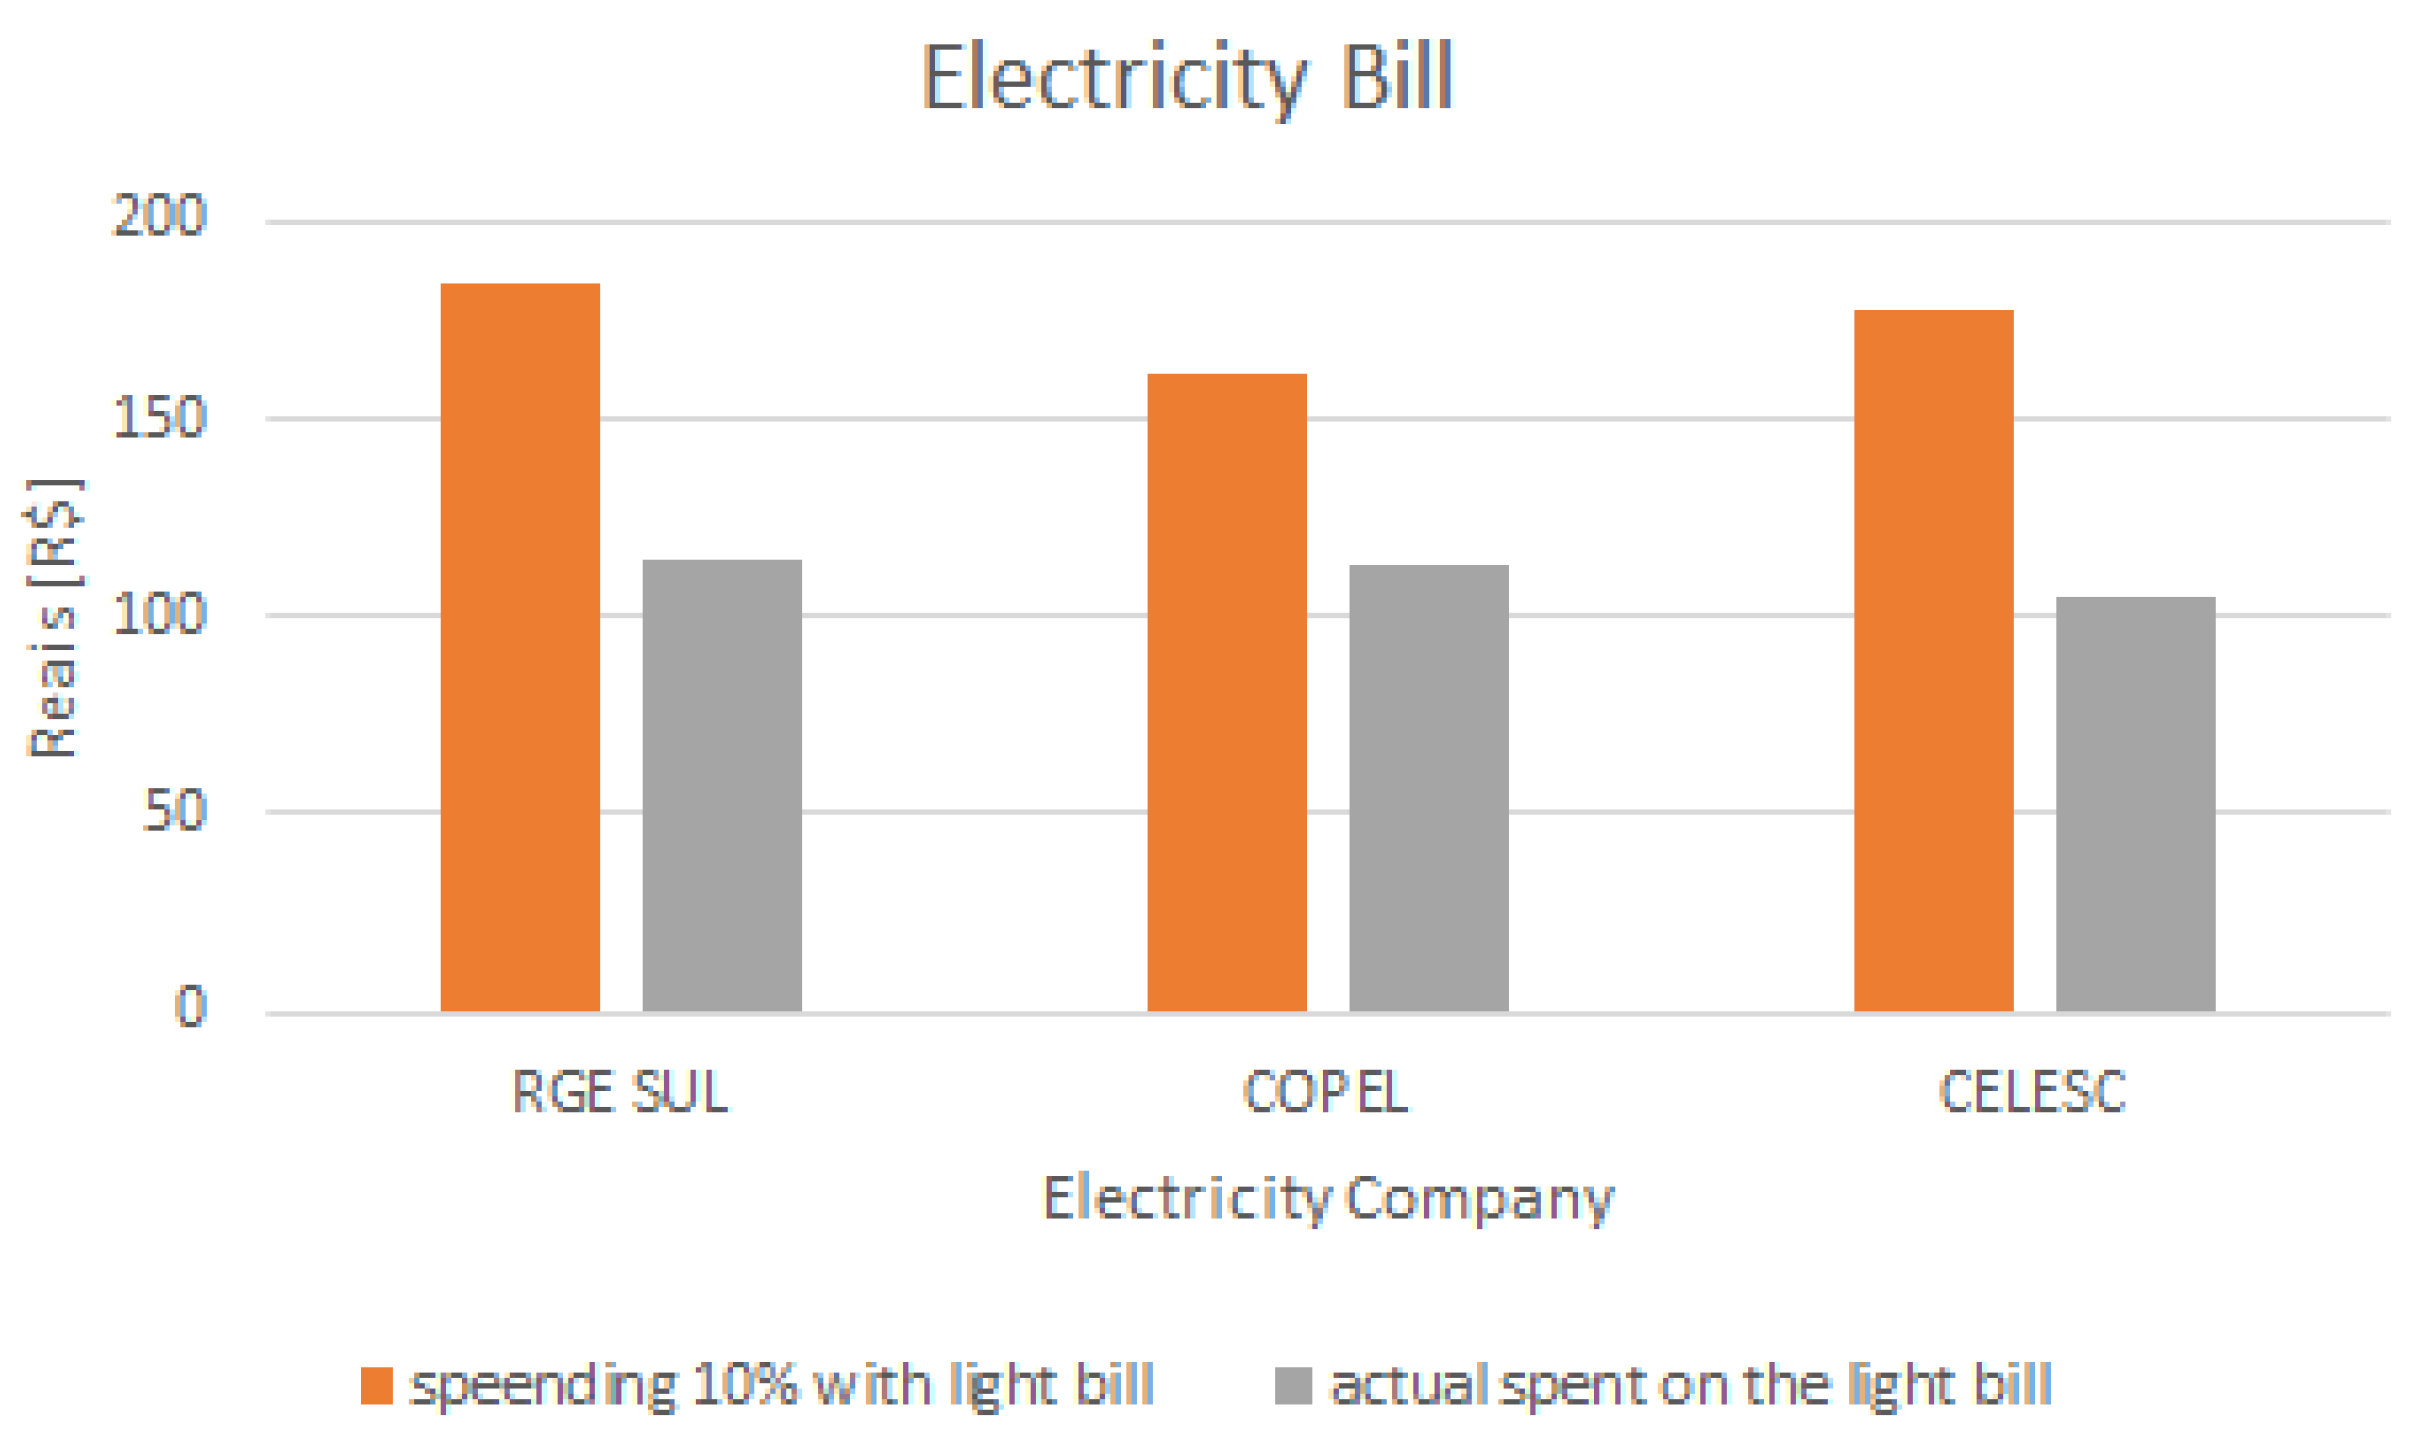
5.1. Southern Region

Observing Figure 11 and Figure 12, it is possible to notice that in all types of tariff discounts there was an improvement in the GINI index, that is, there was a decrease in inequality of income distribution. The more negative the Δ GINI becomes, this means less income inequality. Also, the increase of energy price for the rest of consumers was less than 7% and looking into Figure 13 it is easy to see that the tariff increase for the common consumers seems to not have a strong impact in the income for the population of southern region, since the impact on the electricity bill is small. The percentage of low-income consumers is less than 9% as shown in Figure 11, and all public policies applied had an improvement in GINI index despite the small drop in the socioeconomic welfare (Figure 14). However, the increase is connected to the number of low-income consumers, i.e., the higher the number of low-income consumers, the higher the tariff increase for common consumers. Figure 15 shows that these consumers spent less than 10% of their income on electrical energy. In Figure 16 is possible to see that the sacrifice in the amount of average energy consumption in order to maintain the same electricity bill was not that severe, no matter what public policy is applied.

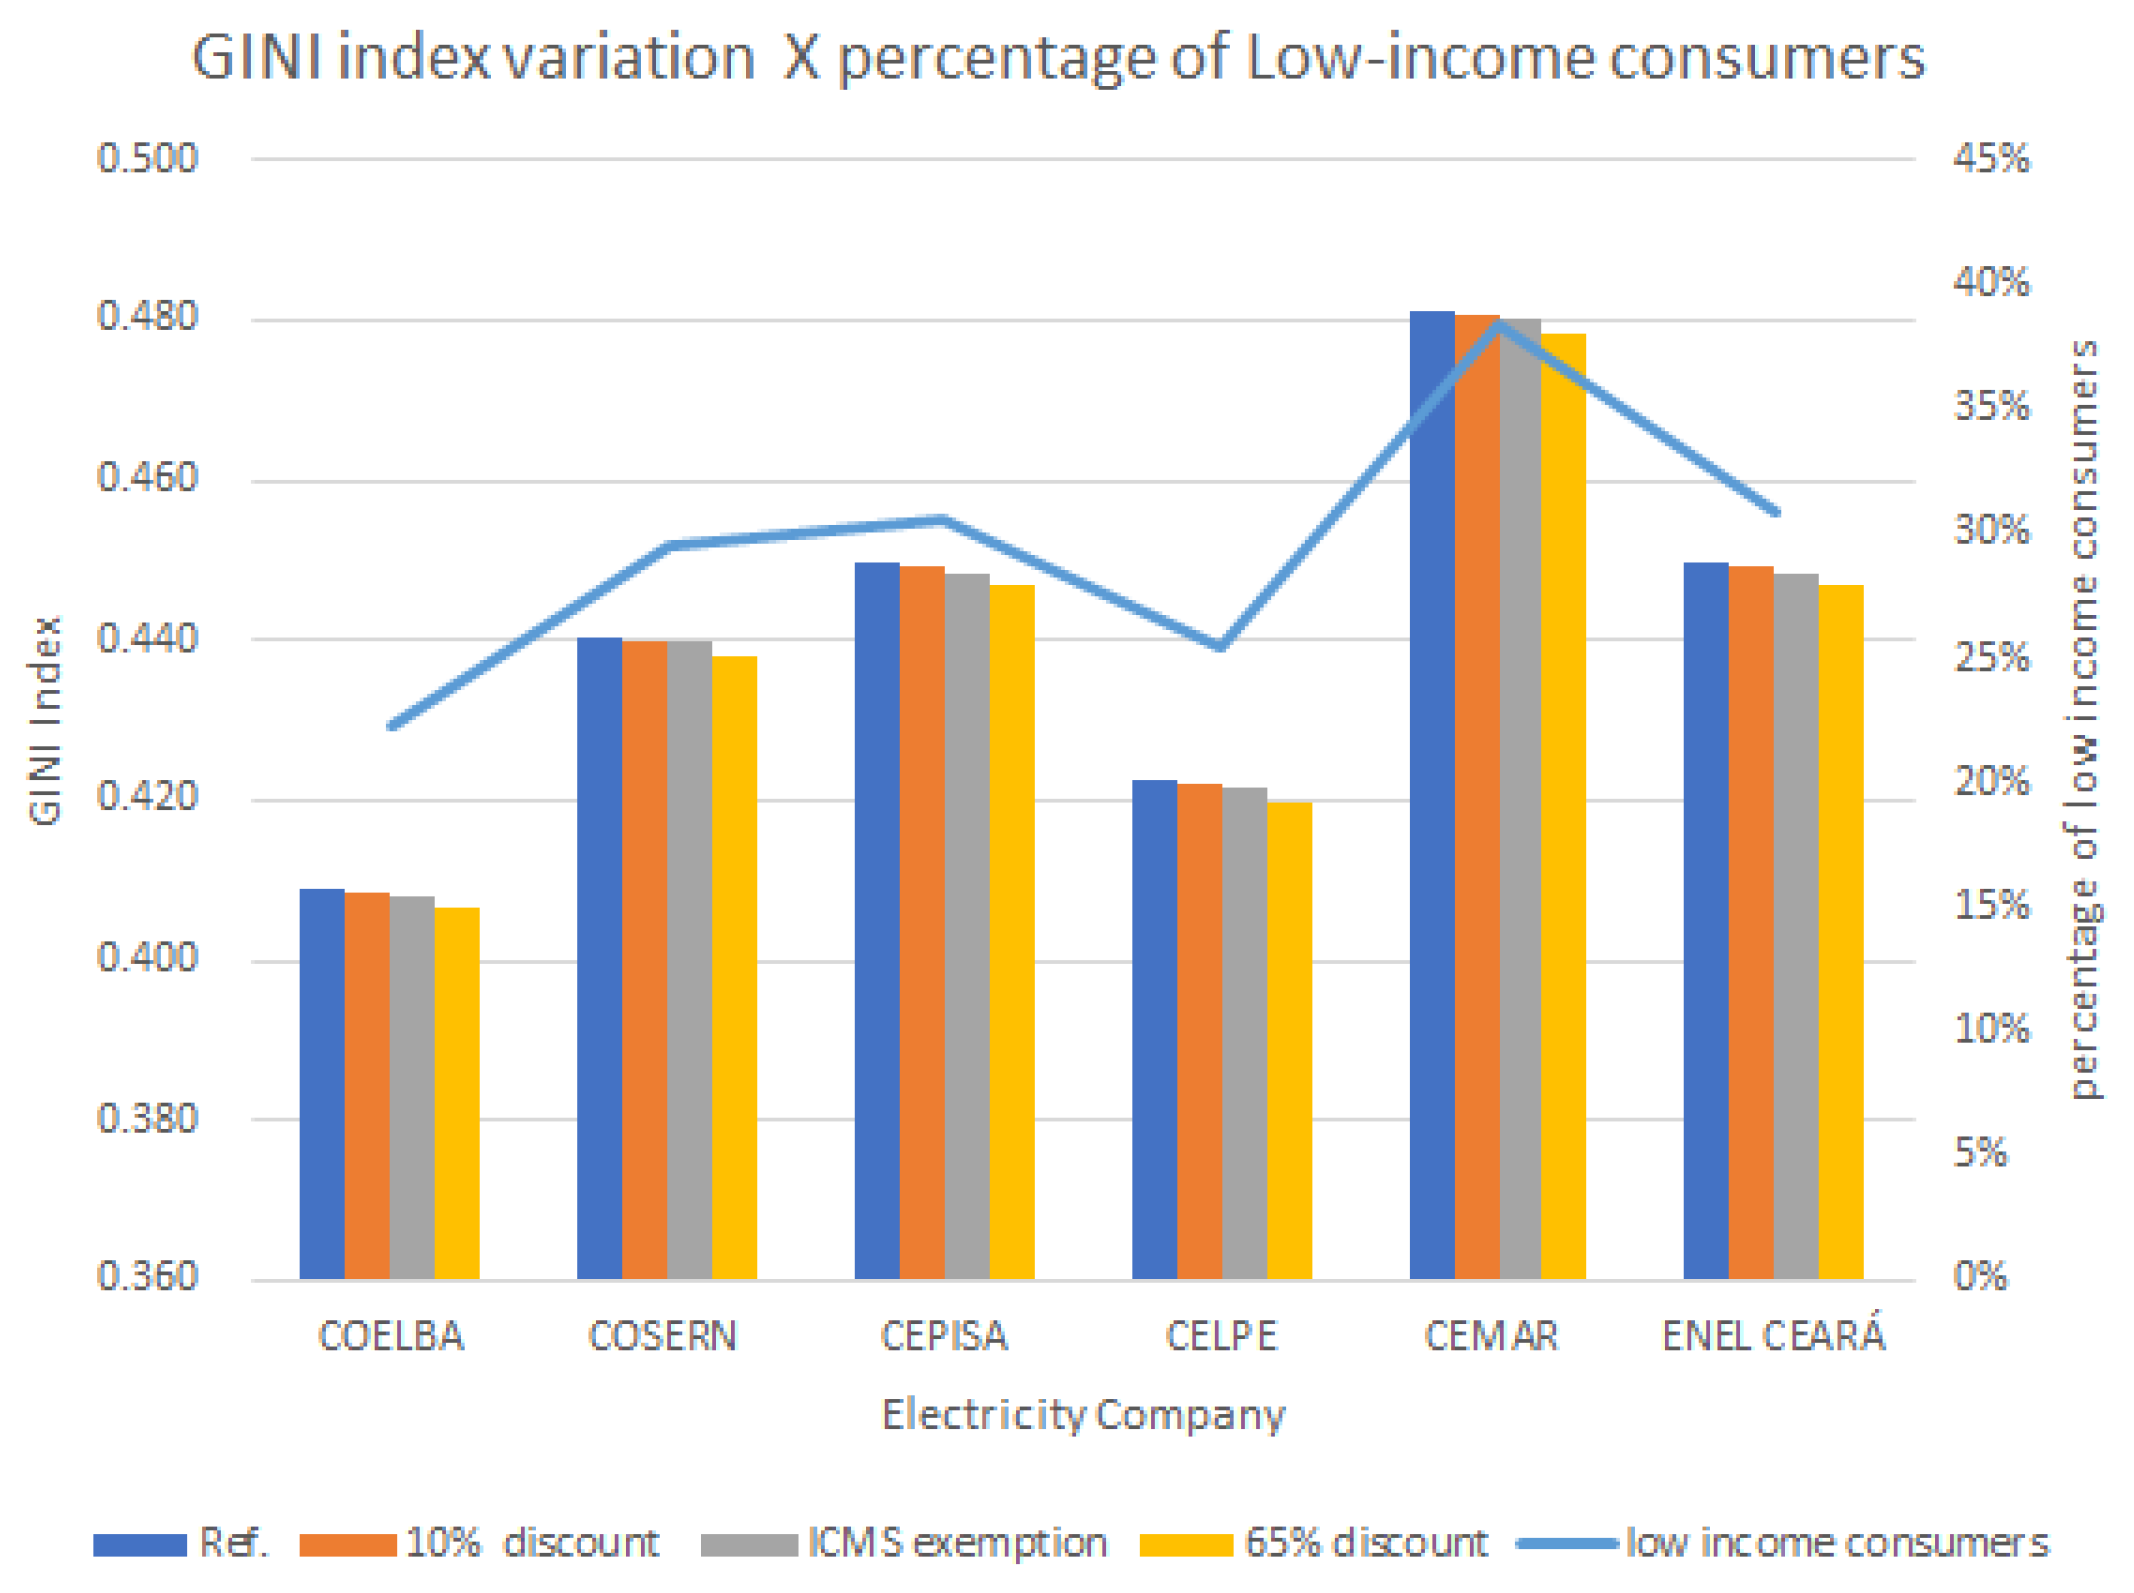
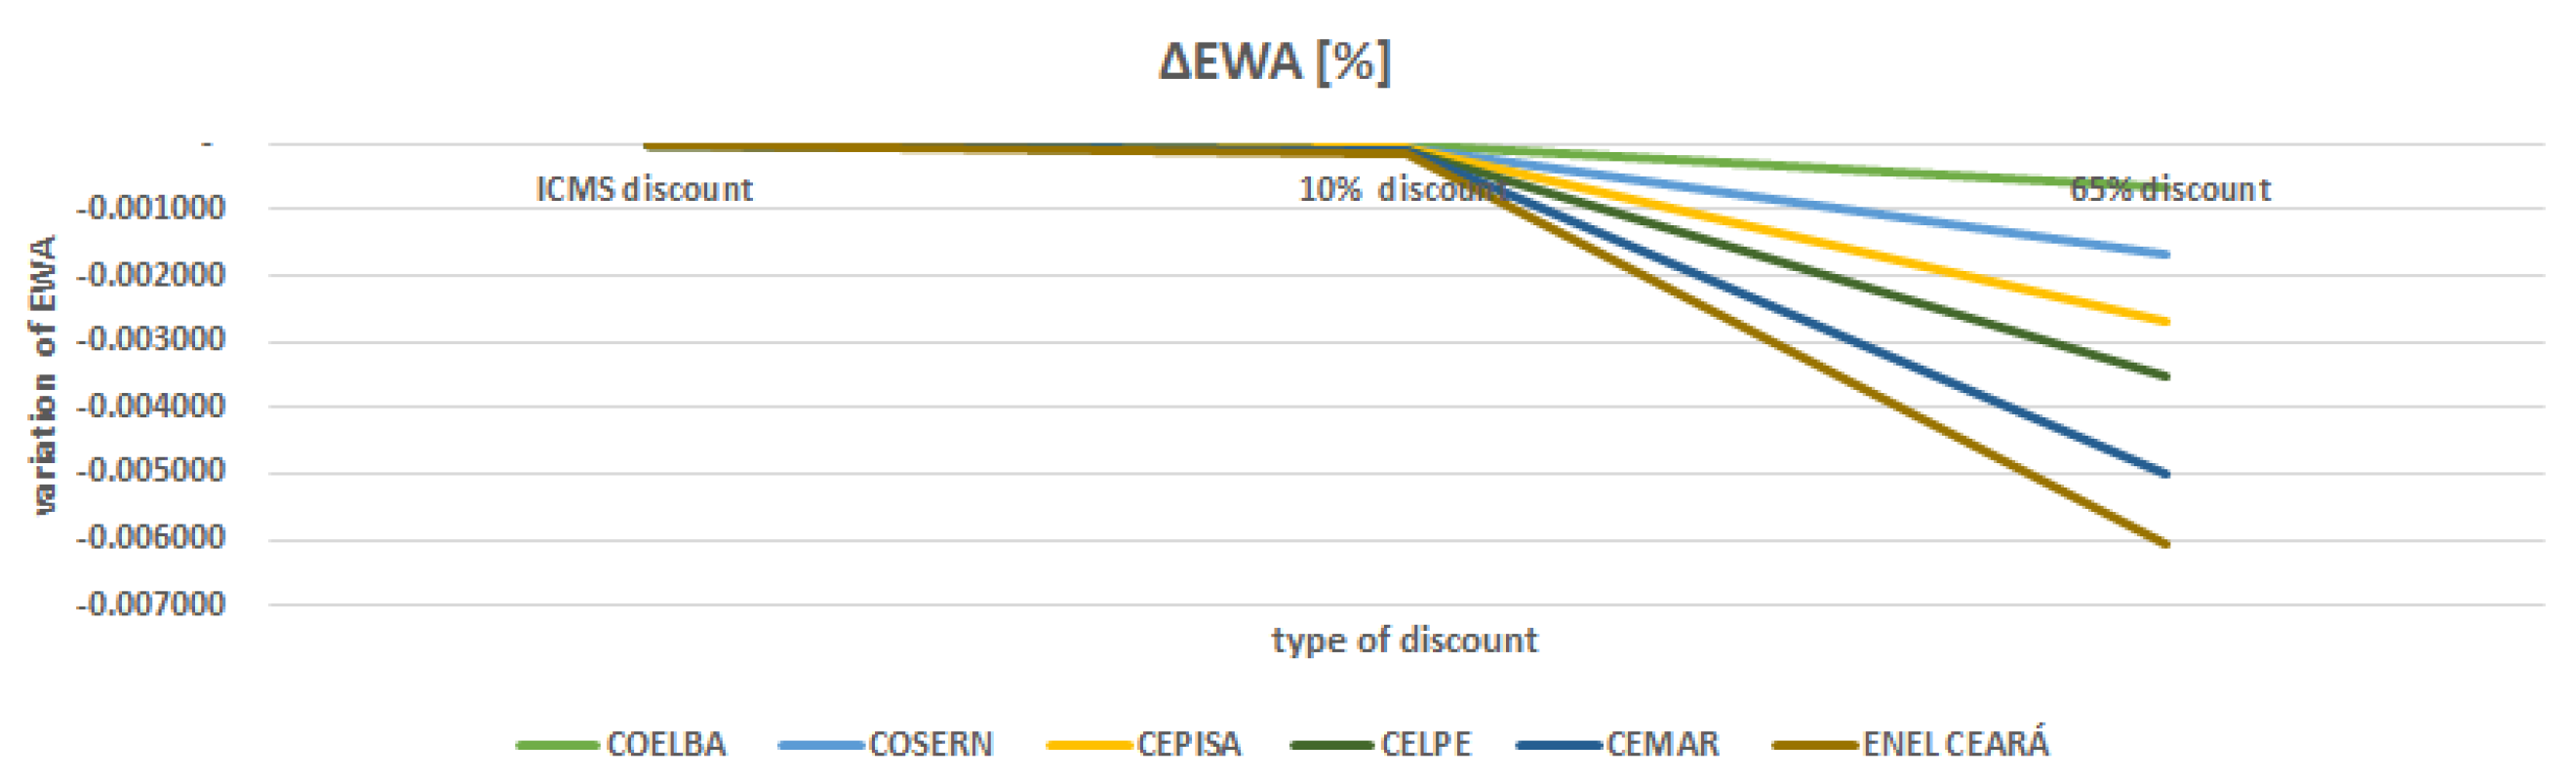
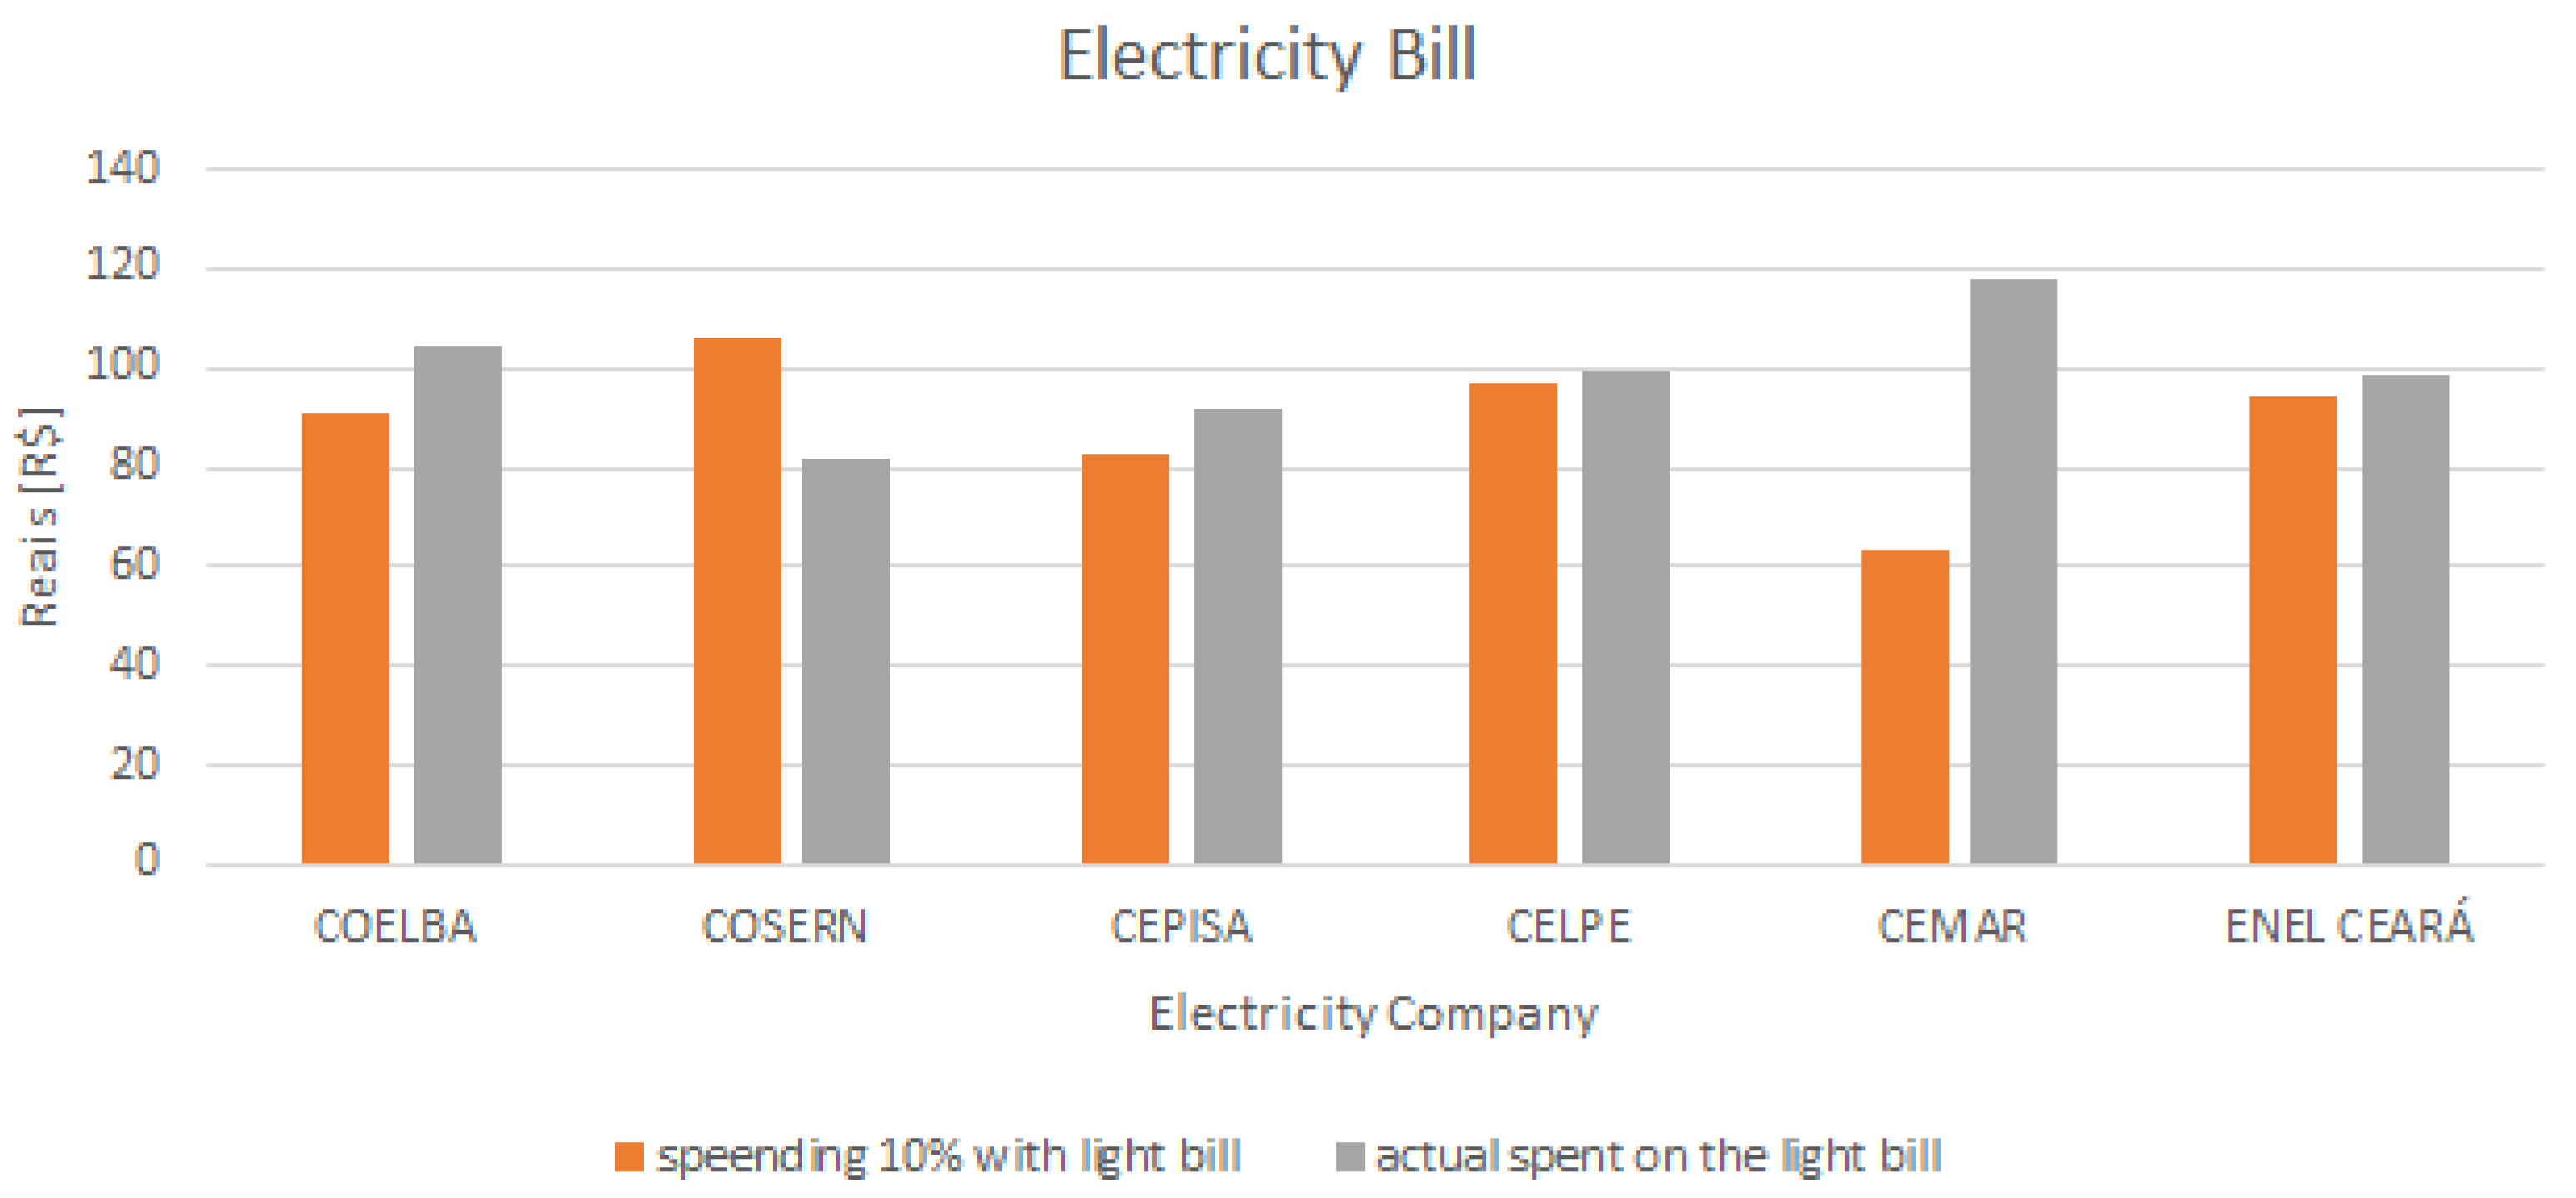
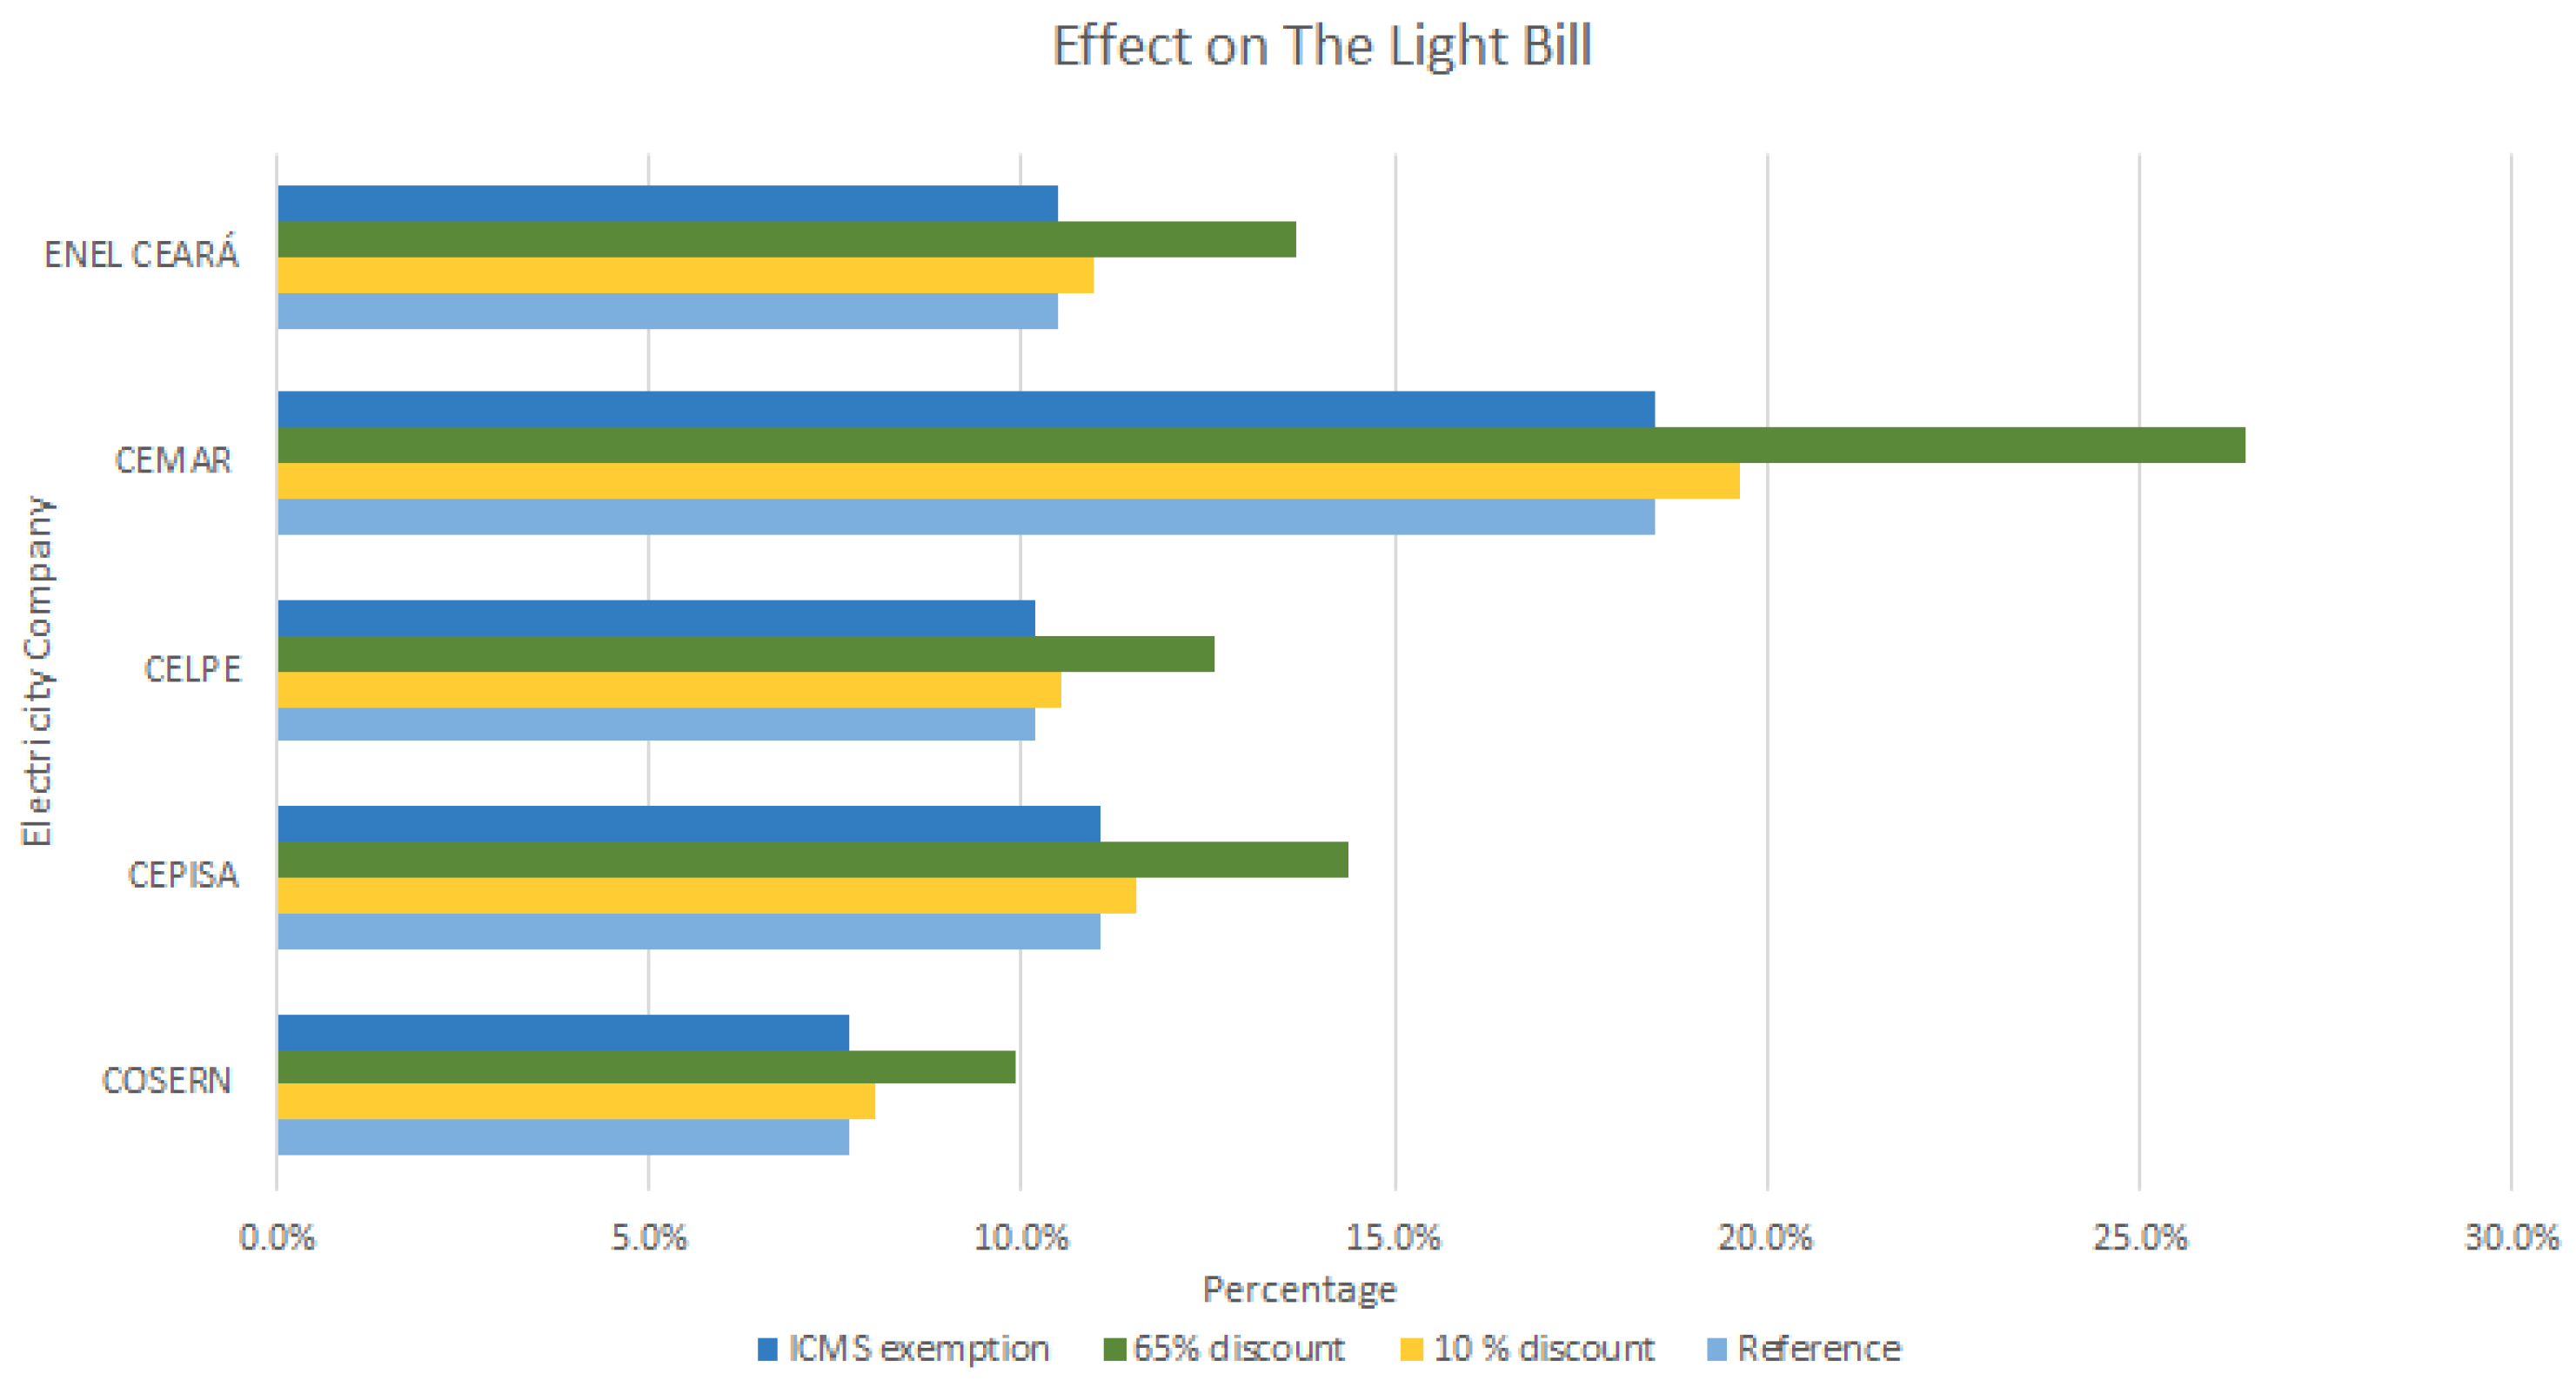
5.2. Northeastern Region

In this region, Figure 17 and Figure 18 also show there has been an improvement in the GINI index for all types of tariff discounts, that is, there was a decrease in inequality of income distribution for this region too. Again, the more negative the Δ GINI becomes, this means less income inequality. In both regions, when 65% of discount is applied, more improvement the GINI index has, despite the small drop in the socioeconomic welfare (Figure 19). However, Figure 20, Figure 21 and Figure 22 are a strong warning about the benefit for the poorest at the expense of the B1c consumer tariff for this region. People who do not have social conditions and are not able to receive TSEE will pay even more for their electrical energy. On the other side, when the ICMS was withdrawn, those people did not have to pay more and the low-income consumers could receive a discount. This way, it is possible to simultaneously improve the GINI index (Figure 18) despite the small drop in the socioeconomic welfare. The connection between the percentage of low-income consumers and the increase in tariff remains. Here, it is even more evident. Observing Figure 20, in order to maintain the same energy bill the sacrifice in the amount of energy consumption was higher in this region. For example, to CEMAR the sacrifice was almost 30% less energy consumed. Figure 21 shows that consumers have actually already spent more than 10% of their income on electrical energy. Therefore, any increase in their tariff, implicates in a significant way in their average income. In Figure 20 it is clear the necessity to spend more if they want to maintain the average consumption of energy.

6. Conclusions

This paper has presented an evaluation of public policies for fair social tariffs of electricity in Brazil by using an economic market model. The TAROT economic model of the regulated electricity distribution market was used to review the discrepancies of the current public policies on the socioeconomic situation of two of the five regions of Brazil. The studied regions, northeastern and southern, present different responses to the application of the same public policy for social tariffs. In the northeast the population ends up being harmed in two of the three proposals to reduce the social tariff (because they either pay more and reduce their income or reduce their electrical energy consumption), while in the south all proposals have shown improvement It seems that is evident that it should be possible to apply different public policies in order to reduce energy poverty in the country. Despite the fact that the greater the discount, the greater is the impact on combating inequality, the public policy of exempting the ICMS seems to be the best option for the northeastern region, as it is possible to give a better discount, (regardless the energy consumption) and not burden common consumers in this region, which has an average low income and lose whenever there is an increase in the tariff. The present regulatory system applied in Brazil guarantees the Financial Economic Equilibrium (FEE) for all power distribution utilities throughout a Capital Assets Price Model (CAPM), under a stablished Weighted Average Capital Cost (WACC), being the electricity tariff calculated to meet this goal. Therefore, maintenance costs and prudent expansion investments are straight considered in the tariff. However, the electricity tariff has also been historically used to collect various taxes to the government (federal and state). Therefore, lowering or resigning from some taxes can be implemented as public policies without affecting the energy infrastructure.
In regions with a large gap in income and where most of the population is poor, tax withdrawal is more efficient for improving the GINI index and has a small effect on the socioeconomic welfare, being the best scenario for the northeastern region. This might be a better way to include the low-income population in electrical energy consumption, reducing energy poverty in the country, by changing the number of GINI index produced by cross-subsidies and tax waiver (removing ICMS from TSEE). Presently, due to the COVID-19 pandemics an emergency measure has been applied in Brazil. There is a new public policy, by provisional measure MP950/2020 made by the Brazilian Federal Government, applied for the low-income consumers that exempts those consumers whose consumption is up to 220KWh per month from any payment (100% discount) for 3 months. In the future, post-pandemics, the exemption from ICMS is a better measure to be implemented because, as already demonstrated, this policy is the one that brings the most benefit to society as a whole.
It is important to consider that in regions with high levels of poverty, there is not always an exact correlation between social public policy and its effect on the GINI index. Here, in this paper, a simplified study was carried out, in order mainly to alert about the application of public policies for the entire population in a large and diverse country without studying alternative and simplified public policies and their impacts on the population of each region. Further studies of what really represents the changes in income and social welfare are necessary, so that sociological theory can also be helpful for regulatory studies. When a social public energy policy is introduced, the ultimate goal is to produce a leveling in the degree of welfare (or “happiness”) of the various layers of a society. This policy, in addition to displacing income, changes the structure of income utilization.

Author Contributions

L.d.S.B.M., H.A. conceived and designed the experiments; L.d.S.B.M. performed the experiments; L.d.S.B.M. and B.D.B. analyzed the data; L.G.A. contributed with reviews and contributions on the text; L.d.S.B.M. and B.D.B. wrote the paper. All authors have read and agreed to the published version of the manuscript.

Funding

CAPES-Coordenação de Aperfeiçoamento de Pessoal de Nível Superior-Brazil-Finance Code 001, through a scholarship provided to L.d.S.B.M.

Acknowledgments

The authors gratefully acknowledge the financial support in part of CAPES-Coordenação de Aperfeiçoamento de Pessoal de Nível Superior-Brazil-Finance Code 001, CNPq-National Council for Scientific and Technological Development-Brazil, INERGE, FAPEMIG, and UNIFEI.

Conflicts of Interest

The authors declare no conflict of interest.

References

  1. ANEEL. Tariff Regulation Procedures-Proret. Normative Resolution 435; Technical Report; ANEEL: Brasilia, Brazil, 2011. [Google Scholar]
  2. ANEEL. Normative Resolution 482; Technical Report; ANEEL: Brasilia, Brazil, 2012. [Google Scholar]
  3. ANEEL. Normative Resolution 492-PROINFA; Technical Report; ANEEL: Brasilia, Brazil, 2012. [Google Scholar]
  4. Obermaier, M.; Szklo, A.; La Rovere, E.L.; Rosa, L.P. An assessment of electricity and income distributional trends following rural electrification in poor northeast Brazil. Energy Policy 2012, 49, 531–540. [Google Scholar] [CrossRef]
  5. Pereira, M.G.; Freitas, M.A.V.; da Silva, N.F. Rural electrification and energy poverty: empirical evidences from Brazil. Renew. Sustain. Energy Rev. 2010, 14, 1229–1240. [Google Scholar] [CrossRef]
  6. IBGE. Number of CENSO 2020; IBGE: Rio de Janeiro, State of Rio de Janeiro, Brazil, 2020. [Google Scholar]
  7. IBGE. National Continuous Household Sample Survey-Continuous PNAD; IBGE: Rio de Janeiro, State of Rio de Janeiro, Brazil, 2019. [Google Scholar]
  8. ANEEL. Distribution Indicators; ANEEL: Brasilia, Brazil, 2016. [Google Scholar]
  9. Bodach, S.; Hamhaber, J. Energy efficiency in social housing: Opportunities and barriers from a case study in Brazil. Energy Policy 2010, 38, 7898–7910. [Google Scholar] [CrossRef]
  10. Primc, K.; Slabe-Erker, R.; Majcen, B. Constructing energy poverty profiles for an effective energy policy. Energy Policy 2019, 128, 727–734. [Google Scholar] [CrossRef]
  11. Romero, J.C.; Linares, P.; López, X. The policy implications of energy poverty indicators. Energy Policy 2018, 115, 98–108. [Google Scholar] [CrossRef]
  12. Benso, L.; Bonatto, B.; Arango, H.; Carvalho, L. Socioeconomic indicators for the analysis of electricity distribution concessionaires. In Proceedings of the 2018 Simposio Brasileiro de Sistemas Eletricos (SBSE), Niteroi, Brazil, 12–16 May 2018; pp. 1–5. [Google Scholar]
  13. Primc, K.; Slabe-Erker, R. Social policy or energy policy? Time to reconsider energy poverty policies. Energy Sustain. Dev. 2020, 55, 32–36. [Google Scholar] [CrossRef]
  14. Sovacool, B.K. The political economy of energy poverty: A review of key challenges. Energy Sustain. Dev. 2012, 16, 272–282. [Google Scholar] [CrossRef]
  15. Bouzarovski, S.; Petrova, S.; Sarlamanov, R. Energy poverty policies in the EU: A critical perspective. Energy Policy 2012, 49, 76–82. [Google Scholar] [CrossRef]
  16. Walker, R.; Liddell, C.; McKenzie, P.; Morris, C. Evaluating fuel poverty policy in Northern Ireland using a geographic approach. Energy Policy 2013, 63, 765–774. [Google Scholar] [CrossRef]
  17. Scarpellini, S.; Hernández, M.A.S.; Moneva, J.M.; Portillo-Tarragona, P.; Rodríguez, M.E.L. Measurement of spatial socioeconomic impact of energy poverty. Energy Policy 2019, 124, 320–331. [Google Scholar] [CrossRef]
  18. Marchand, R.; Genovese, A.; Koh, S.L.; Brennan, A. Examining the relationship between energy poverty and measures of deprivation. Energy Policy 2019, 130, 206–217. [Google Scholar] [CrossRef]
  19. Dobbins, A.; Nerini, F.F.; Deane, P.; Pye, S. Strengthening the EU response to energy poverty. Nat. Energy 2019, 4, 2–5. [Google Scholar] [CrossRef]
  20. Schleich, J. Energy efficient technology adoption in low-income households in the European Union—What is the evidence? Energy Policy 2019, 125, 196–206. [Google Scholar] [CrossRef]
  21. González-Eguino, M. Energy poverty: An overview. Renew. Sustain. Energy Rev. 2015, 47, 377–385. [Google Scholar] [CrossRef]
  22. ANEEL. Social Tariff of Electric Energy—TSEE; ANEEL: Brasilia, Brazil, 2002. [Google Scholar]
  23. IBGE. PNAD Continua 2017 Income from All Sources; Technical Report; IBGE: Rio de Janeiro, State of Rio de Janeiro, Brazil, 2017. [Google Scholar]
  24. Zubi, G.; Fracastoro, G.V.; Lujano-Rojas, J.M.; El Bakari, K.; Andrews, D. The unlocked potential of solar home systems; an effective way to overcome domestic energy poverty in developing regions. Renew. Energy 2019, 132, 1425–1435. [Google Scholar] [CrossRef]
  25. Bhide, A.; Monroy, C.R. Energy poverty: A special focus on energy poverty in India and renewable energy technologies. Renew. Sustain. Energy Rev. 2011, 15, 1057–1066. [Google Scholar] [CrossRef]
  26. Pereira, D.S.; Marques, A.C.; Fuinhas, J.A. Are renewables affecting income distribution and increasing the risk of household poverty? Energy 2019, 170, 791–803. [Google Scholar] [CrossRef]
  27. ANEEL. Residential Tariff; ANEEL: Brasilia, Brazil, 2020. [Google Scholar]
  28. ANEEL. Distributed Generation; ANEEL: Brasilia, Brazil, 2020. [Google Scholar]
  29. EPE. Statistical Electrical Energy Year 2020; Technical Report; EPE: Brasilia, Brazil, 2019. [Google Scholar]
  30. Arango, L.; Deccache, E.; Bonatto, B.; Arango, H.; Ribeiro, P.; Silveira, P. Impact of electricity theft on power quality. In Proceedings of the 2016 17th International Conference on Harmonics and Quality of Power (ICHQP), Belo Horizonte, Brazil, 16–19 October 2016; pp. 557–562. [Google Scholar]
  31. Pereira, L.C.; Arango, H.; Bonatto, B.D.; de Almeida, T.D.; de Carvalho Filho, J.M.; da Silveira, P.M. Implementation of an economic model for the electricity market evaluation of public policies in smart grids. In Proceedings of the 2013 IEEE PES Conference on Innovative Smart Grid Technologies (ISGT Latin America), Sao Paulo, Brazil, 15–17 April 2013; pp. 1–4. [Google Scholar]
  32. Pereira, L.C.; dos Santos Lusvarghi, S.A.; Arango, L.G.; Arango, H.; Bonatto, B.D. Socioeconomic analysis of incentive public policies for the use of renewable energy per consumer class in Brazil. In Proceedings of the 2015 IEEE PES Innovative Smart Grid Technologies Latin America (ISGT LATAM), Montevideo, Uruguay, 5–7 October 2015; pp. 57–62. [Google Scholar]
  33. Cortez, C.; Bonatto, B.D.; Arango, H.; Castilla, M. Aggregated Economic Analysis of the Brazilian Electricity Distribution Companies Using a Regulated Market Economic Model. J. Control Autom. Electr. Syst. 2020, 31, 693–704. [Google Scholar] [CrossRef]
  34. Arango, L.; Arango, H.; Bonatto, B.; Deccache, E.; Maciel, L.; Pamplona, E. The Impact of Quality Investment in the Electricity Market Based on a Socioeconomic Market Model Contribution. In Proceedings of the 2018 15th International Conference on the European Energy Market (EEM), Lodz, Poland, 27–29 June 2018; pp. 1–5. [Google Scholar]
  35. Arango, L.; Arango, H.; Deccache, E.; Bonatto, B.; Pamplona, E. Economic Evaluation of Regulatory Tariff Risk Planning for an Electric Power Company. J. Control Autom. Electr. Syst. 2019, 30, 292–300. [Google Scholar] [CrossRef]
  36. Burrell, Q.L. The GINI index and the Leimkuhler curve for bibliometric processes. Inform. Process. Manag. 1992, 28, 19–33. [Google Scholar] [CrossRef]
  37. Wenli, F.; Ping, H.; Zhigang, L. Multi-attribute node importance evaluation method based on GINI-coefficient in complex power grids. IET Gener. Trans. Distrib. 2016, 10, 2027–2034. [Google Scholar] [CrossRef]
  38. Gastwirth, J.L. The estimation of the Lorenz curve and GINI index. The Rev. Econ. Stat. 1972, 54, 306–316. [Google Scholar] [CrossRef]
  39. Okushima, S. Gauging energy poverty: A multidimensional approach. Energy 2017, 137, 1159–1166. [Google Scholar] [CrossRef] [Green Version]
  40. ANEEL. Timetable and Results of Distribution Tariff Processes; ANEEL: Brasilia, Brazil, 2020. [Google Scholar]
Figure 1. Graphic of cumulative percentage of discount according to Table 1.
Energies 13 04811 g001
Figure 2. Graphic of average consumption in current TSEE [22].
Energies 13 04811 g002
Figure 3. Graphic of average discount by current TSEE [22].
Energies 13 04811 g003
Figure 4. Average energy tariffs over the years [27].
Energies 13 04811 g004
Figure 5. Graph illustrating the percentage of DG connections per consumption class in 2018 [28]
Energies 13 04811 g005
Figure 6. Electricity Generation in 2019 [29].
Energies 13 04811 g006
Figure 7. Economic flow diagram of a regulated electricity distribution market [31].
Energies 13 04811 g007
Figure 8. Flowchart of the steps implemented in this study.
Energies 13 04811 g008
Figure 9. GINI Index expressing income inequality distribution.
Energies 13 04811 g009
Figure 10. Simplified GINI Index calculation.
Energies 13 04811 g010
Figure 11. The GINI index for each discount and the relation with the percentage of Low-income consumers for southern region.
Energies 13 04811 g011
Figure 12. The relation between tariff increase (on the right side) and the impact in the income ( Δ GINI) (on the left side) for all consumers in the southern region.
Energies 13 04811 g012
Figure 13. The impact on the electricity bill when it is maintained the energy consumption in the southern region.
Energies 13 04811 g013
Figure 14. Socioeconomic welfare for each situation of tariff discounts in the southern region.
Energies 13 04811 g014
Figure 15. Difference between the actual consumption of electrical energy and when it is spent 10% of the income with it in the southern region.
Energies 13 04811 g015
Figure 16. Energy consumption in order to maintain the electricity bill due to the tariff increase in the southern region.
Energies 13 04811 g016
Figure 17. The GINI index for each discount and the relation with the percentage of low-income consumers for the northeastern region.
Energies 13 04811 g017
Figure 18. The relation between the impact in the income ( Δ GINI) (on the left side) for all consumers in the northeastern region and the tariff increase (on the right side).
Energies 13 04811 g018
Figure 19. Socioeconomic welfare for each situation of discounts in the northeastern region.
Energies 13 04811 g019
Figure 20. Energy consumption in order to maintain the electricity bill due to the tariff increase in the northeastern region.
Energies 13 04811 g020
Figure 21. Difference between the actual consumption of electrical energy and when it is spent 10% of the income in the northeastern region.
Energies 13 04811 g021
Figure 22. The impact in electricity bill when it is maintained the energy consumption in the northeastern region.
Energies 13 04811 g022
Table 1. Energy Consumption and Discount Percentage [22].
Monthly Consumption Parcel of Electrical Energy (MCP)Discount
MCP ≤ 30 kWh65%
30 kWh < MCP ≤ 100 kWh40%
100 kWh < MCP ≤ 220 kWh10%
MCP > 220 kWh0%
Table 2. Monthly Evolution of Electric Energy Social Tariff (TSEE) in Brazil [8].
Tracking by Region 2018
Number of Consumers UnitsMonthly Required
RegionIncome Income% Low Income/% Low Income/Revenue
ResidentialRegion% Toatl Low IncomeDifference (R$)%
Midwest411,7727.754.8110,167,512.455.16
Southeast2,120,5776.3824.7950,900,428.4525.82
South521,4025.006.1011,903,791.586.04
Northeast4,702,22124.5954.98101,975,446.6051.72
North796,58618.769.3122,313,699.5511.27
BRAZIL8,552,55811.80100.00197,160,879.09100.00
Table 3. Socioeconomic Characteristics of Brazil in 2017 [8,23].
GINI IndexPopulation
Distribution [%]
Average
Income [R$]
Average Consumption of
Electrical Energy [TWh]
Average Energy
Tariff [R$/MWh]
Midwest0.5367.602512.0028.18599.23
South0.47714.302397.0057.38579.06
Southeast0.52942.002475.00147.08593.51
Northeast0.56727.601509.0060.76546.82
North0.5448.501630.0020.26628.79
Brazil0.549100.002178.00313.65584.61
Table 4. Data from northeastern region electricity companies [40].
DATACOELBACOSERNCEPISACELPECEMARENEL CEARÁ
B [MR$]8739.811404.311160.735654.783822.263515.57
r w [%]7.507.507.508.098.098.09
d [%]3.863.933.993.963.823.84
e * E [MR$]7272.311796.921536.064523.483082.304130.08
E [TWh]19.875.584.5113.577.5411.36
LOSSES [MR$]2211.24112.80206.671486.84466.24529.97
T R [R$/MWh]609.94479.29525.11575.48690.02572.79
t [%]343434343434
β [%]222931253831
Average Income [R$]862.00845.00750.00852.00597.00824.00
Table 5. Data from southern region electricity companies [40].
DATARGE SULCOPELCELESC
B [MR$]3604.909170.995731.21
r w [%]8.098.098.09
d [%]3.873.683.78
e * E [MR$]3308.189636.727623.20
E [TWh]7.7423.2217.98
LOSSES [MR$]196.52583.51481.58
T R [R$/MWh]659.79641.19617.99
t [%]343434
β [%]583
Average Income [R$]1635.001472.001597.00
Table 6. The cumulative percentage (or per unit) of income participation and the percentage (or per unit) of population for the northeastern region.
Before Public Policy
γ γ Low γ B 1 c α ζ (1 − α ζ )
COELBA0.550.050.40.200.220.58
COSERN0.550.050.40.200.290.51
CEPISA0.550.050.40.200.310.49
CELPE0.550.050.40.200.250.55
CEMAR0.550.050.40.200.380.42
ENEL CEARÁ0.550.050.40.200.310.49
Table 7. The cumulative percentage (or per unit) of income participation and the percentage (or per unit) of population for southern region.
Before Public Policy
γ γ Low γ B 1 c α ζ (1 − α ζ )
RGE SUL0.550.050.40.200.050.75
COPEL0.550.050.40.200.080.72
CELESC0.550.050.40.200.030.77
Table 8. Data for TAROT of northeastern region electricity companies.
DATACOELBACOSERNCEPISACELPECEMARENEL
CEARÁ
a [R$/MWh]9590.047656.978045.118986.2610,974.978888.50
b [R$/MWh 2 ]457.511301.241690.01627.661380.54741.94
p [R$/MWh] 2 29,457.299694.8510,159.8828,158.3741,367.5415,429.11
e [R$/MWh]366.02322.17340.42333.32409.05363.71
Table 9. Data for TAROT of southern region electricity companies.
DATAREG SULCOPELCELESC
a [R$/MWh]10,133.779723.499760.55
b [R$/MWh 2 ]1241.31396.97514.66
p [R$/MWh] 2 15,745.7413,231.7611,203.29
e [R$/MWh]427.52415.07424.07

