Abstract
As the market share of electric vehicles increases, the intermittent load on the electricity grid due to charging will increase. This can be counteracted by Vehicle-to-Grid (V2G) which utilises dormant electric vehicles to feed power into the grid, generating income for the vehicle owner while relieving load across the grid. However, increased battery use through V2G can negatively affect battery health. In this work, a computational model of an electric vehicle with battery degradation is used to investigate the relationship of these effects. The analysis was conducted at the top level of detail, only considering the battery pack of the vehicle. The findings of this investigation show that the cost relating to battery degradation is smaller than the potential profit available from Vehicle-to-Grid over a three-year period. However, the benefit does not seem to be enough to justify the upfront investment requirement, and further financial incentives, such as net billing, may be required to make V2G economically viable. Future development within this field is vital for the success of the electric vehicle within the automotive markets, and for the transition to a renewable energy grid.
Keywords:
optimal; battery; charging; electric; vehicle; V2G; degradation; lithium-ion; MATLAB; Simulink 1. Introduction
The growth of the electric vehicle (EV) market will create additional intermittent load on the already stressed electricity grid as consumers charge their vehicles, particularly when users return home from work to charge. Due to the intermittent nature of renewable sources such as wind and solar, non-renewables are still needed to feed power into the electricity grid during these gaps. However, the utilisation of these polluting power sources contradicts the clean energy statement made by owning an EV. This has led the research into smart grids which introduce a method of reducing the load on the grid. One of the concepts at the forefront of smart-grid development is Vehicle-to-Grid (V2G). V2G treats each EV as an energy storage unit with bi-directional power transfer capabilities. This allows for peak electricity generation to be reduced by feeding power from dormant vehicles back into the grid at peak times, alleviating the stress applied, see Figure 1. The application of V2G allows the user to sell power back to the grid and potentially turn a profit, depending on energy prices at the time, which can be estimated using price-prediction methods. However, this has formed a trade-off between the vehicle usability and economic benefits of harnessing V2G. Steward et al. [1] presents an ethical dilemma; to reduce the loads on the grid, the EV must be plugged in, creating the potential for the occasional loss of use. Consequently, a balance must be met between the consumer and power supplier needs.
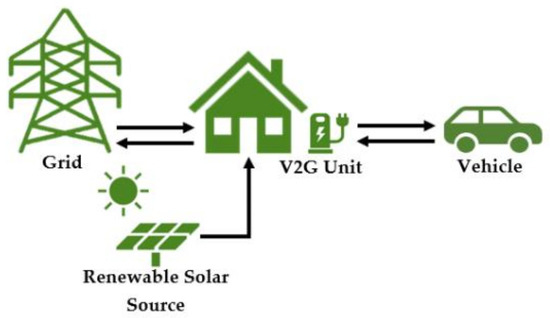
Figure 1.
Diagram showing how power is distributed in Vehicle-to-Grid (V2G) applications.
V2G has the potential to grant stability to the grid due to its ability to adapt through the usage of bi-directional flow. However, Wang and Chen [2] presented that the regular variation of the battery state of charge (SOC) has been found to affect the battery useable lifetime. Battery lifetime can be affected by both internal and external variables, such as depth of discharge, voltage, current and temperature [3].
The profits and feasibilities found in the combination of smart-grid technology and electric tariff estimation have been thoroughly documented [4,5,6]. The implementation of these allows for two objectives to be met: the stress implemented onto the grid in peak times to be reduced and costs to be minimised for the user and to provide the opportunity for potential profits. Even though the profitability of smart-grid technologies has been heavily documented, the negative impacts that smart-grid charging methods have on battery life are yet to be truly investigated. Financial incentives are one of the leading motivations in the purchase of electric vehicles, along with minimalizing carbon footprint. Consequently, a large quantity of research has been conducted to assess the likelihood of an economically profitable scheme, through the application of smart-grid technologies [5,6,7]. The surrounding literature shows that financial profitability can be achieved through a range of methods, the most prominent method is the combination of electric price prediction methods with stochastic dynamic programming or smart-charging technology [8].
Electricity tariff predictions are vital in the success of any financial scheme involving the charging of EVs as they can identify the optimal times to charge or discharge. The large electricity price variation, creating a great margin for profits through the utilisation of dynamic programming, is shown by several studies [8,9,10].
Smart charging is controlled and monitored charging, to achieve a range of goals for the user, supplier and the grid. Sun et al. [11] observed that, for a standard residential area consisting of 500 EVs, the peak–valley difference could be reduced by 50% by shifting all charging to between 1–6 am. Tarroja et al. [12] found that V2G allows for utilisation of renewable energy, as it facilitates the excess energy to be stored within EVs during peak solar generation. However, additional concerns highlighted by Steward et al. [1], Richardson [6] and Parsons et al. [13] show that for V2G to be successful, there is a need for contracts between both parties involved. This is further supported by both Tian and Hua [14] and Zeng. Leng and Zhang [15] utilised simulations to visualise the effectiveness of V2G in China and came to similar conclusions. This ideology can be used to create a charging plan that maintains grid capacity while improving the load curve. Furthermore, the implementation of financial incentives and smart charging is proven to be beneficial. However, the implementations of using this technology are yet to be truly understood.
To understand the effects of using V2G, the factors that affect battery degradation must be identified. Battery degradation and the parameters that influence its acceleration are an area of vital importance to the electric vehicle industry, due to the correlation between EV lifespan and health of the cell. Several studies have been conducted assessing the effects of a range of parameters within the battery. Examples of these studies are Lindgren and Lund [16] and Zhang and Filipi [17], who showed that a selection of charging strategy influenced the rate of capacity fade within the battery. The charging strategy encompasses when to charge, the charge current and, for V2G application, the depth of discharge. There has been a multitude of studies carried out to assess the effects of these variables, based on the “when to charge” problem, as researched by Schoch et al. [18] and the consequential effects of fast charging. Studies show a general trend, the larger the current, the quicker the capacity fade, as found by [19,20,21]. A wide range of battery aging simulations and experiments are available in the literature, for example [22,23,24,25,26,27], which conclude that the main factors contributing to the rate of capacity fade in lithium-ion cells are: temperature, charge/discharge current, depth of discharge (DOD) and storage SOC.
Research has been conducted to assess how financial motives, such as V2G, effect battery life. The focus of most of the studies [28,29,30,31,32] is the effects of fast charging and how that, paired with the consequent rise in temperature, affects the rate of capacity fade. The small amount of analysis into the effects of V2G on capacity degradation leaves room for future work. There are a handful of studies that have begun the investigation within this specific area. Zeng, Gibeau and Chow [5] presented a daily model, allowing for the assessment of possible revenues from uni-directional and bi-directional V2G charging technologies. This assessment was conducted across a range of EVs, showing that all were profitable and that bi-directional was 46–78% more profitable than uni-directional V2G. The simulations used a mixed range of battery size, SOC and charge rates to see its effects on profits. Within the concluding remarks, the authors highlight the importance of optimising the three parameters for future studies, aligning with the aims of the current work.
The findings discussed above identify that there are still further developments required to assess the net financial viability of V2G application within a consumer EV considering the associated cost of battery aging.
One of the issues that are not often discussed is the individual incentive surrounding V2G. Several studies focus on using smart charging to improve battery life or reduce the grid-load peak–valley difference. However, this fails to consider that if implementation of smart charging is not financially viable for the user then it is highly improbable that it would be widely accepted. Calero and Marinelli [33] conducted a recent study in Denmark and Japan, investigating the profitability of a reimbursement scheme called frequency regulation. This is not directly linked to the United Kingdom (UK), but it shows that over a 5-year span, the scheme has a profitability of approximately EUR 3500. While Ahmadian et al. [34] investigate the cost–benefit analysis of V2G for distribution networks, drawing the conclusion that it is un-economical without the assistance of renewable energy sources.
The current work aims to provide an appropriate solution to the hypothetical power problem, caused by the predicted rise in EVs. Firstly, the financial viability of continuous V2G usage was analysed for a typical electric vehicle in the UK. Secondly, to evaluate, through computational modelling, how the rate of battery degradation is influenced by V2G usage and its associated cost.
2. Methodology
A modelling-based approach has been selected for this work to enable the simulation of multiple V2G scenarios. The developed model was split into two sub-models: the EV cycle and characteristics model was simulated within Simulink, and the battery degradation model implemented, discussed in Section 2.3, was run in conjunction with MATLAB. The code used to produce these results is available online as referenced in Supplementary Materials.
2.1. Electric Vehicle and Vehicle-to-Grid Use Case
In this study a generalized use case has been developed based on a typical EV and usage pattern in the UK:
- A “fresh” 40 kWh Nissan Leaf was the selected test EV, as it is the most popular EV in the UK [35]. It is assumed that the vehicle has an effective cooling system for the vehicles battery pack.
- The typical UK daily commute was calculated at 40 miles per day, 5 days per week. This was calculated from averaged data given by the Department of Transport [36].
- The Pod-Point 22 kW Solo Charger [37] is the selected charger, with the internal programming to control the energy flow of V2G.
- A half-hourly slot price, for user inbound and outbound tariffs, using a week’s price variation in January 2020 [38].
- This study is based on initial adaptation of V2G, and therefore the effect of large-scale usage on tariffs is not considered.
2.2. Electric Vehicle Cycle and Characteristic Model
Due to the holistic approach of the ageing model, for ease of use, the Electric Vehicle Cycle and Characteristic (EVCC) model was split into two sub-models: the drive cycle and the battery characteristic models, below in Figure 2.
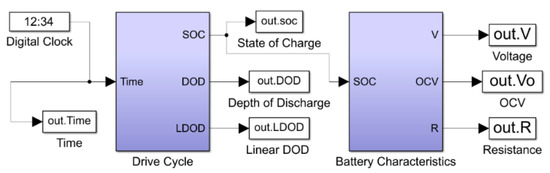
Figure 2.
Top-level of the electric vehicle cycle and characteristics model.
2.2.1. EV Drive Cycle
The EV drive cycle consists of two journeys in each 24-h period, commuting to and from the workplace. The user commutes from home to work between 07:30–08:00 and from work to home between 17:30–18:00. Constant current discharge is used to represent driving, the use of constant current discharge mitigates any influence driving behaviour will have on battery degradation, which is beyond the scope of this study.
Two charging methods are considered: charging as fast as possible (AFAP) or as late as possible (ALAP), as researched by Schoch et al. [18]. AFAP, sometimes known as naïve charging, is the strategy that is currently shown by the standard EV user. ALAP is a hypothetical strategy that requires future knowledge. Schoch et al. [18] demonstrated that using an ALAP strategy is the best for extending the lifespan of an EV since the stationary SOC plays a part in battery degradation. Both charging strategies are adopted in this project, as shown in Figure 3. Using AFAP as a baseline study and an optimised cycle with V2G implementation, discussed in Section 2.2.2, to allow for a suitable investigation into the effects of battery degradation.
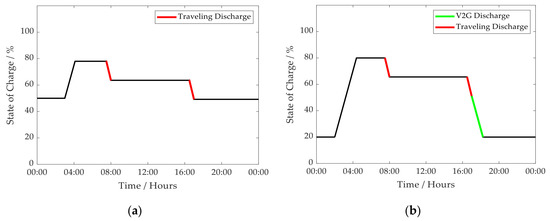
Figure 3.
A visual comparison between the two drive cycles used throughout this study: (a) the baseline as late as possible (ALAP) drive cycle; (b) the V2G-optimised drive cycle.
For both the baseline and the V2G simulation, a similar ALAP charging profile was selected, allowing the effects of the smart charging to be clearly identified. For this study, it is assumed that the user plugs in their vehicle as soon as the commute is over, allowing for V2G and charging across both simulations. There is one major difference between the two cycles shown in Figure 3. For the V2G cycle in Figure 3b, the smart-charging algorithm discharges the battery in the time of peak returns shown in Figure 4, to maximise profits for the user while still charging ALAP. Whereas the baseline case only charges in the early hours of the morning, as there is no V2G in this case.

Figure 4.
Plot showing the price variation in the Octopus Energy Agile Tariff—06/01/20 [38].
For suitable V2G optimisation, analysis of the electricity tariffs was required due to the extreme volatility of the market. Figure 4 highlights the discrepancy between the current inbound and outbound tariffs, showing the maximum cost variance within the inbound tariff of 21.63 p/kWh. The need for smarter charging strategies is highlighted, as the cost to charge could vary by a magnitude of ~GBP 7.60 per day, based on a fully charged 40 kWh EV, leading to a total discrepancy for the user across a 5-day working week of around GBP 38.00. Figure 4 shows that an optimal V2G strategy of discharge in the evening peak hours would maximise any possible returns.
It should be mentioned that the trends shown in Figure 4 are not solely unique to the UK, similar trends can also be seen in other countries. The peak between 16:00 and 19:00 is caused by transmission fees, and it is currently set in regulation and therefore predictable. Future approaches to regulation may make it more flexible.
2.2.2. EV Battery Characteristic Modelling
The battery characteristics subsystem, shown in Figure 2, has a single input, the EV state of charge. Equations (1) and (2) from Chen et al., and Erdinc et al. [39,40], are used for a lithium-ion cell, finding that the correlation between the state of charge on cell voltage () and resistance (), respectively, are determined. Voltage drop under load is not considered within the ageing model as C-rate during charge/discharge was below 1C and the battery spends most of its time at rest. This then sets the foundations for future studies relating to the resistance gain that is linked with battery degradation.
2.3. Battery Degradation Model
The degradation model selected replicates the research and findings from the work of Schmalstieg et al. [41] on lithium-ion cells with Li(NiMnCo)O2 (NMC) positive electrodes and graphite negative electrodes. The authors use a holistic ageing model to assess the rate of capacity fade. A holistic approach in this context means that the model acts around the rest of the system instead of within. Ageing is split into calendric and cyclic ageing, where calendric ageing is the degradation that occurs over an elongated period when the battery is stored at a certain SOC [42]. Cyclic aging, on the other hand, occurs when a battery is cycled through varied SOC causing the processes of lithium intercalation and deintercalation to occur, affecting the internal battery chemistry.
The Simulink model outputs the results into cycle-based segments, allowing for the MATLAB script to feed the results into the following degradation equations and further resistance equations, Appendix A. The calendric ageing function is an exponential function of temperature in Kelvin (T) and voltage (V) shown in Equation (3).
The cyclic ageing function is a three-part quadratic function of the linear depth of discharge, LDOD, and quadratic average voltage, QAV (V), shown in Equation (4).
From the analysis of the degradation equations, it showed that cyclic ageing was a priority for reduction. Therefore, the voltage range was reduced by limiting the total range of SOC, reducing the magnitude of β. The total degradation, CD, is given as a function of both ageing parameters, αD and βD, time, t (days) and total charge throughput, Q (Ah). The calculation for the capacity fade is shown in Equation (5).
For the V2G optimised cycle, a deeper look into the workings of the degradation equations was required. Upon inspection of Equations (1)–(5) to reduce the calendric ageing, the voltage needs to remain around 3.1 V and to reduce the cyclic ageing the target average voltage should be 3.667 V. This was achieved by limiting the total depth of available charge for the battery to be between 80–20%. As a result of the limited range, it meant that the linear depth of discharge was also reduced, further reducing the rate of cyclic ageing.
3. Results
The findings of this investigation are split into the following sections: degradation analysis and the V2G profitability analysis. Firstly, analysis of the outputted results from the degradation model was initiated to begin the assessment of V2G and smart charging impact on the capacity fade. Furthermore, due to the addition of the V2G optimised cycle, the effect of finding a balance between user and power-supplier can be inspected and compared against the baseline cycle. Finally, the combination of the net charging costs, costs of degradation, returns of V2G and theoretical net billing implementation allowed for a conclusion to be drawn regarding the sustainability of smart-charging technology.
3.1. Degradation Analysis
Within this study it has been stated that when an EV battery reaches 70% of its original capacity it has reached its end of life in its current application. This allows for a lower limit to be set on the total lifespan of the cell before it gets refurbished and reused by second-life battery applications [26]. For the financial analysis, the cost of the battery is set at USD 7800 or GBP 5850, and the value of a degraded battery is assumed to be proportional to the remaining capacity. The results of the simulations are shown below in Figure 5 and Figure 6 and Table 1. They highlight the effects of one day-long cycle, 00:00 to 00:00, of the vehicle with respect to battery health and the user’s financial status.

Figure 5.
A comparison between the two step-plots showing the variance in capacity fade against time for: baseline cycle (a), V2G-optimised cycle (b), when utilising the holistic ageing model.

Figure 6.
A graphical representation of the cumulative increase in total capacity lost across a week.

Table 1.
Cumulative results of both simulations across a week (6 January 2020–12 January 2020).
The results shown in Figure 5 and Figure 6 as well as Table 1 show that battery degradation is highly dependent on the EV drive cycle. Figure 6 highlights the variance in capacity loss because of V2G implementation. The change in the rise of capacity loss is due to an assumption made that the user uses the EV half as much on the days of the weekend in comparison to the weekday commute. The results show a 105% increase in capacity loss as a direct consequence of smart V2G charging within the first week. The internal increase in resistance within the battery shows a similar increase, by a factor of ~2 when implementing the V2G within the cycle, highlighting the proportional relationship between resistance gain and capacity loss. While the difference across a week is minute, Figure 7 shows the variance across a range of 3 years.

Figure 7.
A graphical representation of the cumulative fall in remaining capacity loss.
3.2. V2G Profitability Analysis
The cost associated with an increased rate of capacity fade through V2G could be mitigated if the smart-charging and V2G reimbursements generate enough revenue to outweigh the cost of battery degradation and charging costs. The reimbursement breakdown is as follows: the user receives the price of electricity at the current hourly rate plus the V2G returns. The resulting outcomes of this study are shown below in Table 2, Table 3 and Table 4. The findings shown below assume that the pricing tariffs do not have any weekly variation, this is purely to emphasize the benefits of smart charging across a wider scale.
Table 2.
Financial results of the baseline simulation across a working day, week, year, and three years (using pricing data from 6 January 2020–12 January 2020).
Table 3.
Cumulative financial results of the V2G simulation across a week (6 January 2020–12 January 2020).
Table 4.
Financial results of the V2G simulation across a working day, week, year, and three years (using pricing data 6 January 2020–10 January 2020).
Table 2, Table 3 and Table 4 show how the main contributors: Charge costs, Degradation costs and V2G returns vary between the baseline and optimized cycle. As the baseline has no profitable aspect, it makes a loss of GBP 688.27 over three years. This is the cost of the electricity for driving the vehicle, and the battery degradation resulting from charging and discharging it.
Table 4 shows the corresponding result for the V2G cycle, which also includes a V2G return column for the sold electricity. The implementation of V2G causes the cost of charge to increase by a factor of ~2. Furthermore, the results also show that with the addition of V2G, the cost of degradation is predicted to increase slightly by GBP 38.62 over the three-year period (it is more significant initially, but levels off over time as illustrated in Figure 7). At the same time, the selling of electricity during peak hours generates GBP 1245.60.
This leads to an approximately balanced financial total after three years for V2G. Compared to the cost of GBP 688.27 for conventional charging, this is a significant advantage of GBP 688.59 over three years, or about GBP 0.62 per day, for V2G. While this is not sufficient yet to pay for the extra cost of a V2G charger, it clearly demonstrates the potential for a commercially viable implementation of V2G. It is worth noting that V2G also benefits from depreciation of the battery or a reduction in the cost of a replacement, advances in V2G chargers, as well as from future changes to V2G outbound tariffs.
3.3. Model Sensitivity Analysis
In order to assess the robustness of these results, the model is subjected to a sensitivity study, which reveals how sensitive the financial advantage after 3 years is to the assumptions made. In an experimental study, this would be achieved using a significance test or confidence intervals, but since this is a model-based study, there is no set of data to study, and therefore the statistical properties are unknown. The sensitivity study achieves the same goal via an inverse approach; it reveals how much the parameters have to differ before the significance of the result is affected. This allows us to draw conclusions concerning the robustness of the results and the impact of future trends, without making further assumptions.
The parameters considered are the battery cost, the amount of battery degradation, the electricity cost (with proportional changes of both the inbound tariff for charging and the outbound tariff for V2G), as well as individual changes of these tariffs. The findings of this study are shown below in Table 5. Note that the net income change is for the difference between the baseline and the V2G charger (after both baseline and V2G results change in line with the parameters).
Table 5.
Results of a sensitivity study of the V2G results with respect to key factors.
Since the parameters are factors in the model, the relationship between the parameters and result is a linear one. This allows us to interpolate the point where the result changes significance—specifically where the positive financial advantage of V2G disappears and turns into a disadvantage. These values are shown in Table 6.
Table 6.
Results of a sensitivity study of the V2G results with respect to key factors.
This means that the results are highly significant and do not depend on small uncertainties in the parameters. The battery degradation would have to increase by an unrealistic 18 times before V2G becomes a disadvantage, or the battery cost would have to increase by the same factor. Equally, changes to the inbound and outbound tariff do not affect the result much, although the outbound tariff is (maybe not surprisingly) the most sensitive parameter. If the outbound tariff is reduced by 55%, the financial advantage of V2G disappears.
3.4. Net Billing
As stated, the analysis still excludes the capital and operational cost of a V2G charger. The benefit of about GBP 688 is not sufficient to justify this cost, as current prices are about an order of magnitude higher. While costs are bound to come down over time, it is unlikely that this gap will be bridged in the near future. Instead, financial incentives could be used to support the early adoption of V2G technology. These could take many forms, such as an additional tariff for the returned electricity, regulatory simplifications, or direct financial contributions to the cost.
The one incentive studied here is net billing, where the same tariff is applied for inbound and outbound electricity. The name “net billing” reflects the fact that only the net total of inbound and output electricity is charged. This does seem justified from a technical perspective in a typical European setup with a shared low voltage supply for a street, because the electricity returned will typically be used directly in neighbouring properties, without using electricity structure or devices beyond the property supply line and a short piece of low voltage distribution cable. (The situation is somewhat different in the US, where most properties have a dedicated transformer, and the path to the neighbour is via the medium voltage level.)
The use of net billing improves the revenue achieved by exported electricity, and therefore improves the profitability of V2G significantly. The model has been rerun assuming the outbound tariff is equal to the inbound tariff, instead of significantly lower, and the results are shown in Table 7.
Table 7.
Cumulative financial results of the V2G simulation while utilising net billing across a week (6 January 2020-12 January 2020).
Table 7 highlights how effective the implementation of net billing could be for the user. It shows a positive annual return of GBP 432.89, which compares to a cost of GBP 261.21 for charging the vehicle by conventional means, leading to a financial advantage of about GBP 694 per year. This is nearly three times the value achieved without net billing. When considering net billing across a three-year period a total profit of GBP 1427.36, which covers all initial fees relating to the parts and labour associated with home smart charger installation. Assuming a typical lifetime of the V2G charger of 6 to 10 years and a slight reduction in cost of the V2G charger, this is beginning to reach the point where V2G does become financially feasible for the end user.
There are inherent limitations in this model-based analysis. Losses in the V2G charger are not considered, neither is the financial depreciation of the battery, or the cost of labour for a replacement. Temperature related ageing effects are not modelled here because they are highly dependent on the thermal management strategy. With a good strategy, no significant additional ageing should occur. Uncertainty of future electricity prices and short-term effects around frequency stability are also excluded. The ageing behaviour model is necessarily limited in complexity and does not capture, for example, the end of life knee point. Some of these factors can only be explored with confidence in a wider (and longer lasting) practical study.
4. Conclusions
Smart-grid technology is imperative to the success of electric vehicles as without it, the electricity grid would not be able to cope with the increase in load that would occur due to the increase in electric vehicles on the road. These newly developed technologies are not faultless and most lead to an increase in the rate of battery degradation, reducing the lifespan of consumer vehicles. Considering the intention of reducing emissions by using electric vehicles, having to produce more vehicles as they are degrading faster is counterintuitive.
The current work investigated the financial viability of smart-charging technologies, and specifically V2G. Previous investigations have found that these technologies, can be greatly beneficial for the user and the whole electricity grid, but the financial benefit for the end user is often unclear.
The study has demonstrated that there is a clear financial benefit for the customer if the operation of V2G can be combined with an existing real-time tariff. Compared to a conventional charger, a financial gain of about GBP 700 can be expected over three years, considering battery degradation, but not the investment cost of the V2G charger (see Table 2 and Table 4). Although significant, the gain is unlikely to motivate the significant investment required. This result is remarkably insensitive to the many assumptions that have to be made.
Many factors will shift this balance in the future, from better battery management and cheaper battery technology to mass production of V2G chargers. However, in the meantime, further incentives should be considered to accelerate the technology adoption of smart charging in general and V2G in particular. The results of net billing (Table 7) show that a better outbound tariff can make V2G significantly more attractive and provide an appropriate revenue on the initial investment. It is unlikely that electricity providers will be able to offer this on their own, and changes to regulation and taxation may be required to make it feasible.
Finally, the availability of real-time tariffs for private customers has to improve. Although a number of such schemes exist in a number of countries, there is often little competition, and the participation is often limited to certain price-based arbitrage, while real-time billing and frequency stability services are not open to small customers. Aggregators could play a role in leveraging further benefits, such as short time frequency stabilisation or balancing of the transmission system. Overall, V2G has the potential to play a significant role in the shift to a smarter grid with more renewable electricity, and the financial viability is within reach.
Supplementary Materials
The model is available online at https://doi.org/10.17028/rd.lboro.12937178.
Author Contributions
Conceptualization, T.S. and A.F.; methodology, W.M.; software, W.M.; validation, T.S., A.F. and W.M.; formal analysis, T.S., A.F., W.M.; investigation, W.M.; resources, T.S. and A.F.; data curation, W.M.; writing—original draft preparation, W.M.; writing—review and editing, T.S., A.F. and W.M.; visualization, W.M.; supervision, T.S. and A.F.; project administration, T.S.; funding acquisition, T.S. All authors have read and agreed to the published version of the manuscript.
Funding
This research received no external funding.
Conflicts of Interest
The authors declare no conflict of interest.
Appendix A
The calendric resistance function, αR, is a two-part exponential function of temperature, T (K), and voltage, V (V), shown below in Equation (A1).
The cyclic resistance function, βR, is a three-part quadratic function of the linear depth of discharge, LDOD, quadratic average voltage, QAV (V), shown below in Equation (A2).
From the analysis of the resistance equations, it showed that the cyclic ageing was a priority for reduction. Therefore, the voltage range was reduced by limiting the total range of SOC, reducing the magnitude of β. The total resistance gain, CR, is given as a function of both parameters, αR and βR, time, t (days) and total charge throughput, Q (Ah). The calculation for the total degradation is shown below in Equation (A3).
References
- Steward, D. Critical Elements of Vehicle-to- Grid (V2G) Economics Critical; National Renewable Energy Lab (Nrel): Golden, CO, USA, 2017. [Google Scholar]
- Wang, L.; Chen, B. Model-Based Analysis of V2G Impact on Battery Degradation. SAE Tech. Pap. 2017, 1–8. [Google Scholar] [CrossRef]
- Fernández, I.J.; Calvillo, C.F.; Sánchez-Miralles, A.; Boal, J. Capacity fade and aging models for electric batteries and optimal charging strategy for electric vehicles. Energy 2013, 60, 35–43. [Google Scholar] [CrossRef]
- Maigha, C.; Crow, M.L. Economic and battery health conscious vehicle-to-grid electric vehicle operation. In Proceedings of the 2016 IEEE Power & Energy Society Innovative Smart Grid Technologies Conference (ISGT), Minneapolis, MN, USA, 6–9 September 2016; pp. 1–5. [Google Scholar] [CrossRef]
- Zeng, W.; Gibeau, J.; Chow, M.Y. Economic benefits of plug-in electric vehicles using V2G for grid performance-based regulation service. In Proceedings of the IECON 2015-41st Annual Conference of the IEEE Industrial Electronics Society, Yokohama, Japan, 9–12 November 2015; pp. 4322–4327. [Google Scholar] [CrossRef]
- Richardson, D.B. Encouraging vehicle-to-grid (V2G) participation through premium tariff rates. J. Power Sources 2013, 243, 219–224. [Google Scholar] [CrossRef]
- Calvillo, C.F.; Czechowski, K.; Söder, L.; Sanchez-Miralles, A.; Villar, J. Vehicle-to-grid profitability considering EV battery degradation. In Proceedings of the Asia-Pacific Power and Energy Engineering Conference, APPEEC, Xi’an, China, 25–28 October 2016; pp. 310–314. [Google Scholar]
- Mody, S.; Steffen, T. Benefits of Stochastic Optimisation with Grid Price Prediction for Electric Vehicle Charging. SAE Tech. Pap. 2017. [Google Scholar] [CrossRef][Green Version]
- Mody, S.; Steffen, T. Optimal Charging of EVs in a Real Time Pricing Electricity Market. SAE Int. J. Altern. Powertrains 2013, 2, 337–349. [Google Scholar] [CrossRef][Green Version]
- Mody, S.; Steffen, T. Optimal Charging of Electric Vehicles using a Stochastic Dynamic Programming Model and Price Prediction. SAE Int. J. Passeng. Cars Electron. Electr. Syst. 2015, 8, 379–393. [Google Scholar] [CrossRef]
- Sun, B.; Su, Z.; Wei, D.; Li, Y. Research on optimal control of electric vehicle charging in residential area. In Proceedings of the 2016 35th Chinese Control Conference (CCC), Chengdu, China, 27–29 July 2016; pp. 8617–8621. [Google Scholar] [CrossRef]
- Tarroja, B.; Zhang, L.; Wifvat, V.; Shaffer, B.; Samuelsen, S. Assessing the stationary energy storage equivalency of vehicle-to-grid charging battery electric vehicles. Energy 2016, 106, 673–690. [Google Scholar] [CrossRef]
- Parsons, G.R.; Hidrue, M.K.; Kempton, W.; Gardner, M.P. Willingness to pay for vehicle-to-grid (V2G) electric vehicles and their contract terms. Energy Econ. 2014, 42, 313–324. [Google Scholar] [CrossRef]
- Tian, S.; Hua, G. Charging and discharging strategies for electric vehicles based on V2G. In Proceedings of the 2015 International Conference on Logistics, Informatics and Service Sciences (LISS), Barcelona, Spain, 27–29 July 2015; pp. 1–5. [Google Scholar] [CrossRef]
- Zeng, M.; Leng, S.; Zhang, Y. Power charging and discharging scheduling for V2G networks in the smart grid. In Proceedings of the 2013 IEEE International Conference on Communications Workshops (ICC), Budapest, Hungary, 9–13 June 2013; pp. 1052–1056. [Google Scholar]
- Lindgren, J.; Lund, P.D. Effect of extreme temperatures on battery charging and performance of electric vehicles. J. Power Sources 2016, 328, 37–45. [Google Scholar] [CrossRef]
- Zhang, X.; Filipi, Z. Computationally Efficient Li-Ion Battery Aging Model for Hybrid Electric Vehicle Supervisory Control Optimization. SAE Tech. Pap. 2017. [Google Scholar] [CrossRef]
- Schoch, J.; Gaerttner, J.; Schuller, A.; Setzer, T. Enhancing electric vehicle sustainability through battery life optimal charging. Transp. Res. Part B Methodol. 2018, 112, 1–18. [Google Scholar] [CrossRef]
- Lei, Y.; Zhang, C.; Gao, Y.; Li, T. Charging optimization of lithium-ion batteries based on capacity degradation speed and energy loss. Energy Procedia 2018, 152, 544–549. [Google Scholar] [CrossRef]
- Abdollahi, A.; Han, X.; Avvari, G.V.; Raghunathan, N.; Balasingam, B.; Pattipati, K.R.; Bar-Shalom, Y. Optimal battery charging, Part I: Minimizing time-to-charge, energy loss, and temperature rise for OCV-resistance battery model. J. Power Sources 2016, 303, 388–398. [Google Scholar] [CrossRef]
- Lin, X.; Hao, X.; Liu, Z.; Jia, W. Health conscious fast charging of Li-ion batteries via a single particle model with aging mechanisms. Vet. Med. (Praha) 2018, 26, 95–100. [Google Scholar] [CrossRef]
- Mesbahi, T.; Rizoug, N.; Bartholomëus, P.; Sadoun, R.; Khenfri, F.; Le Moigne, P. Dynamic model of li-ion batteries incorporating electrothermal and ageing aspects for electric vehicle applications. IEEE Trans. Ind. Electron. 2018, 65, 1298–1305. [Google Scholar] [CrossRef]
- Li, K.; Wei, F.; Tseng, K.J.; Soong, B.H. A Practical Lithium-Ion Battery Model for State of Energy and Voltage Responses Prediction Incorporating Temperature and Ageing Effects. IEEE Trans. Ind. Electron. 2018, 65, 6696–6708. [Google Scholar] [CrossRef]
- Abdollahi, A.; Raghunathan, N.; Han, X.; Pattipati, B.; Balasingam, B.; Pattipati, K.R.; Bar-Shalom, Y.; Card, B. Battery health degradation and optimal life management. In Proceedings of the 2015 IEEE AUTOTESTCON, National Harbor, MD, USA, 2–5 November 2015; pp. 146–151. [Google Scholar]
- Park, C.H.; Yoon, J.H.; Choi, J.D. A Quantitative Study for Critical Factors of Automotive Battery Durability Reprinted From: Automotive Electronics and Systems Reliability. SAE Tech. Pap. 2007. [Google Scholar] [CrossRef]
- Timmermans, J.M.; Nikolian, A.; De Hoog, J.; Gopalakrishnan, R.; Goutam, S.; Omar, N.; Coosemans, T.; Van Mierlo, J.; Warnecke, A.; Sauer, D.U.; et al. Batteries 2020–Lithium-ion battery first and second life ageing, validated battery models, lifetime modelling and ageing assessment of thermal parameters. In Proceedings of the 2016 18th European Conference on Power Electronics and Applications (EPE’16 ECCE Europe), Karlsruhe, Germany, 5–9 September 2016. [Google Scholar]
- Scarfogliero, M.; Carmeli, S.; Castelli-Dezza, F.; Mauri, M.; Rossi, M.; Marchegiani, G.; Rovelli, E. Lithium-ion batteries for electric vehicles: A review on aging models for vehicle-to-grid services. In Proceedings of the 2018 International Conference of Electrical and Electronic Technologies for Automotive, Milan, Italy, 9–11 July 2018; Volume 2. [Google Scholar]
- Hoke, A.; Brissette, A.; Smith, K.; Pratt, A.; Maksimovic, D. Accounting for lithium-ion battery degradation in electric vehicle charging optimization. IEEE J. Emerg. Sel. Top. Power Electron. 2014, 2, 691–700. [Google Scholar] [CrossRef]
- Trippe, A.E.; Arunachala, R.; Massier, T.; Jossen, A.; Hamacher, T. Charging optimization of battery electric vehicles including cycle battery aging. In Proceedings of the IEEE PES Innovative Smart Grid Technologies, Europe, Istanbul, Turkey, 12–15 October 2015; pp. 1–6. [Google Scholar]
- Hoke, A.; Brissette, A.; Maksimovi, D.; Pratt, A.; Smith, K. Electric vehicle charge optimization including effects of lithium-ion battery degradation. In Proceedings of the 2011 IEEE Vehicle Power and Propulsion Conference, Chicago, IL, USA, 6–9 September 2011. [Google Scholar]
- Hoke, A.; Brissette, A.; Maksimovic, D.; Kelly, D.; Pratt, A. Maximizing lithium ion vehicle battery life through optimized partial charging. In Proceedings of the 2013 IEEE PES Innovative Smart Grid Technologies Conference (ISGT), Washington, DC, USA, 24–27 February 2013; pp. 1–5. [Google Scholar]
- Ma, T.; Mohammed, O.A. Economic analysis of real-time large-scale pevs network power flow control algorithm with the consideration of V2G services. IEEE Trans. Ind. Appl. 2014, 50, 4272–4280. [Google Scholar] [CrossRef]
- Calearo, L.; Marinelli, M. Profitability of Frequency Regulation by Electric Vehicles in Denmark and Japan Considering Battery Degradation Costs. World Electr. Veh. J. 2020, 11, 48. [Google Scholar] [CrossRef]
- Ahmadian, A.; Sedghi, M.; Mohammadi-Ivatloo, B.; Elkamel, A.; Aliakbar Golkar, M.; Fowler, M. Cost-Benefit Analysis of V2G Implementation in Distribution Networks Considering PEVs Battery Degradation. IEEE Trans. Sustain. Energy 2018, 9, 961–970. [Google Scholar] [CrossRef]
- Braithwaite-Smith, G. The UK’s Most Popular PHEVs and EVs. Available online: https://www.motoringresearch.com/car-news/popular-hybrid-and-electric-cars-2018/ (accessed on 10 May 2019).
- Department for Transport. Transport Statistics—Great Britan 2018; Department for Transport: London, UK, 2018.
- Pod-Point 22kW Solo Charger. Available online: https://pod-point.com/products/homecharge (accessed on 6 January 2020).
- Octopus Octopus Agile Pricing Tariff. Available online: https://www.energy-stats.uk/octopus-agile/ (accessed on 6 January 2020).
- Chen, M.; Rincón-Mora, G.A. Accurate electrical battery model capable of predicting runtime and I-V performance. IEEE Trans. Energy Convers. 2006, 21, 504–511. [Google Scholar] [CrossRef]
- Erdinc, O.; Vural, B.; Uzunoglu, M. A dynamic lithium-ion battery model considering the effects of temperature and capacity fading. In Proceedings of the 2009 International Conference on Clean Electrical Power, Capri, Italy, 9–11 June 2009; pp. 383–386. [Google Scholar]
- Schmalstieg, J.; Käbitz, S.; Ecker, M.; Sauer, D.U. A holistic aging model for Li(NiMnCo)O2 based 18650 lithium-ion batteries. J. Power Sources 2014, 257, 325–334. [Google Scholar] [CrossRef]
- Dubarry, M.; Devie, A.; Block, D. Battery Cycling and Calendar Aging: Year One Testing Results Battery Cycling and Calendar Aging: Year One Testing Results; Hawaii Natural Energy Institute: Hawaii, USA, 2016. [Google Scholar]
© 2020 by the authors. Licensee MDPI, Basel, Switzerland. This article is an open access article distributed under the terms and conditions of the Creative Commons Attribution (CC BY) license (http://creativecommons.org/licenses/by/4.0/).