Abstract
The energy contained in wastewaters has been identified as a promising sustainable energy resource that could be harvested by using microbial fuel cells (MFC). When dealing with real wastewaters, the MFCs should be able to manage high flow rates and flow rates fluctuations. In this work, the short-term effects of the influent flow rate variations on the performance of a microbial fuel cell has been studied. With this aim, the influent flow rate was stepwise increased from 0.72 to 7.2 L/d and then stepwise decreased. The obtained results indicate that, on the one hand, an increase in the influent flow rate leads to higher chemical oxygen demand removal rates up to 396 g/(L/d) and higher electric power generation almost 18 mW/m2, but to lower coulombic efficiencies. On the other hand, the reduction of the flow rate increases the coulombic efficiencies, as well as the percentage of chemical oxygen demand removed, but decreases electric power generation. In the short-term, the exposition to higher influent flow rates causes the growth of the microbial population of the MFC, the growth of the non-electrogenic microorganisms being higher than that of the electrogenic ones. The higher growth of non-electrogenic microorganisms may lead to lower coulombic efficiencies.
1. Introduction
Fossil fuels have supported the industrialization and economic growth of countries during the past century, but it is clear that they cannot indefinitely sustain a global economy, mainly due to carbon dioxide emission [1]. Due to that, it is necessary to identify alternative energy resources. These new resources of energy should be renewable and also environmentally friendly [2,3]. Nowadays, the generation of wastes has increased considerably, especially in developing countries, being used as an indicator of economic growth and industrial development [4]. For example, in 2013, 5.2 Km3/year of wastewaters in Spain and 6.17 Km3/year in Germany were generated [5]. Due to that, it is necessary to adequately manage these wastes. Nowadays, the wastewater treatment and regeneration has gained great attention resulting in wide application of biological techniques [6,7], electrochemical techniques [8,9], geothermal mechanisms [10], sun-based technologies [11], nanofiltration and ultrafiltration [12], and Fenton processes [13], etc. Unfortunately, in spite of the high amount of chemical energy contained in the wastewaters [14,15], these conventional treatments do not take advantage of it, presenting very high energy consumptions [16]. Due to that, it will be of great interest to find a clean and sustainable treatment process for the wastewaters. Additionally, the circular economy concept identifies the wastes as a resource that must be valorized as energy or material resource. This could be a good option for the society, given the current trends of wastewater generation and worldwide energy resource depletion. Due to that, the wastewaters seem to be an ideal commodity to produce renewable energy. Usually, the energy contained in the wastes is extracted as methane or hydrogen by means of anaerobic digestion or dark fermentation processes [17,18]. Once generated, these combustible gases are burnt and converted into electrical energy with the inefficiencies of the thermodynamic cycles.
In recent years, the microbial fuel cells (MFC) are under research with the aim to develop a process capable of directly converting the chemical energy of the biodegradable substrates contained in wastewater into electrical energy by means of the metabolic abilities of the electro-active bacteria [19,20]. The MFCs are bio-electrochemical devices where the reduction reaction and the oxidation reaction, usually carried out by microorganisms, take place separately [21]. In this way, it is possible to generate an electrical current flowing from the anode, where the oxidation takes place, to the cathode, where the reduction occurs. This electrical current is generated as a result of the potential difference between the electron acceptor reduction and the oxidation of biodegradable substrates [1,21]. Therefore, MFCs allow extracting the wastewater energy at the same time that the pollutants are removed by means of their oxidation. Recent publications show the potential and the robustness of this technology [22] demonstrating that the MFC technology could be used for real applications [23,24]. Moreover, several large pilot MFC reactor treatment applications have been launched in recent years [25,26,27,28]. However, this technology is not yet commercialized because it still requires expensive studies in order to reach high efficiency of energy recovery. For this reason, during the last years, scientific efforts have been focused on the design of the MFC as well as on the study of the operational conditions [19].
One of the variables controlling the performance of an MFC is the microbial consortia. MFC technology has been described based on pure or mixed cultures [29,30,31,32,33,34]. The MFCs operated with pure cultures are operationally stable and yield very high Coulombic efficiency (CE) values [35]. However, pure cultures present several limitations, such as a high risk of microbial contamination and high substrate specificity compared to the MFC operated with mixed cultures [36,37], where consortia of microorganisms compete for the same substrates [38,39]. This competition leads to the survival of the fittest microorganisms [40]. Due to that, the MFCs operated using mixed cultures currently achieve substantially greater power densities in comparison with those operated with pure cultures.
With regard to the electrochemical performance, it must be stated that the operational conditions maintained during the process influence the steady-state power density exerted by an MFC [41,42,43]. In the literature, it has been observed that the power output is mainly affected by the loading rate [44], pH [45,46], temperature [47,48], solids retention time [42,49], hydraulic configuration [50,51,52,53], hydraulic retention time (HRT) [51], external resistance [41,54,55], the use of membranes [56,57], reactor configuration [58], type of wastewater [59,60], anode potential [41], etc. Unfortunately, the effect of the influent flow rate variations of the domestic wastewaters on the performance of the MFCs has not been adequately described in the literature. To the authors knowledge, the number of studies is scarce, being only relevant to the studies performed by Ren et al. and Ieropoulos et al. [24,61,62]. The description of this influence is crucial for the real implementation of this technology as a domestic wastewater treatment system with coupled energy generation.
In this context, this work evaluates the short-term effects of the influent flow rate variations on the electrochemical performance of an MFC. With this objective, an MFC was subjected to different flow rates ranging from 0.72 to 7.2 L/d and the short-term effects of this variation were studied. The experimental results of this study were used to parameterize the MFC mathematical model proposed in [63]. That model is further developed taking into account the influence of flow rate on MFC performance determined here. The model will be used for system analyses such as those proposed in [64]. Compared to the work carried out by [65], this reports a higher value of generated power for the MFC in the continuous operation mode. The main novelty of this work is the identification of the main mechanisms affecting the energy generation and the pollutant removal when the influent flow rate is modified.
2. Materials and Methods
In this study, the effect of the influent flow rate on the exerted electric power generation, chemical oxygen demand (COD) removal rate, COD removal efficiency, and CE was studied. Experiments were carried out at different flow rates while keeping the substrate concentration constant at 322 mg COD/L. Three replicates of each experiment were performed in order to ensure the reproducibility of the tests. Initially, the influent flow rate was stepwise increased, from 0.72 to 7.20 L/d, and afterwards, the influent flow rate was stepwise decreased. Working in this way, the possible hysteresis was evaluated. Each influent flow rate was maintained 24 h in order to ensure the steady state and to evaluate the short-term effects.
2.1. Experimental Setup
This work was carried out in a two-chambered MFC. The anodic and cathodic chambers were made of graphite plates and had a volume of 0.93 and 0.53 cm3, respectively. The anodic and the cathodic electrodes were based on Toray carbon papers TGPH-120 (E-Tek, USA) and had active areas of 2.65 cm2. A layer of 0.5 mg Pt/cm2 was deposited on the surface of the cathodic electrode in order to obtain the catalytic advantages offered by the Pt presence [56]. In order to increase the mechanical properties of the electrodes, the anodic and cathodic electrodes were doped with 20% and 10% of Teflon, respectively. The anode and cathode were connected by means of wires and an external resistance of 120 Ω to externally close the electrical circuit. The experiments were performed at 25 °C.
The anodic chamber was fed with synthetic wastewater, whereas the cathodic chamber was opened to the atmosphere in order to take the oxygen from the air. For the anodic and cathodic chamber separation, a proton exchange membrane (Sterion®) was used. This membrane presented a high ionic conductivity (0.9–0.02 meq/g) and a low electronic conductivity (8·10−2 S/cm). The MFC was configured as a membrane-electrode assembly (MEA) in order to reduce the internal resistance as much as possible. The MEA preparation was carried out by hot-pressing between two stainless steel blocks equipped with heating surfaces and a temperature control system. Hot-pressing was performed at 130 °C by applying a load of 1 Ton for 15 min. Figure 1 shows a schematic view of the MFC.
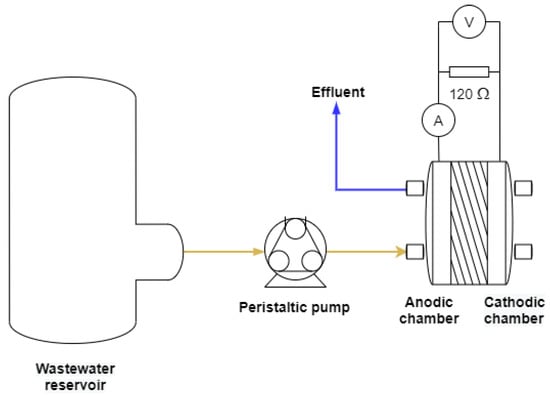
Figure 1.
Schematic view of the experimental setup.
2.2. Microorganisms and Wastewater
The anodic compartment of the MFC was seeded with activated sludge from the Ciudad Real Wastewater Treatment Plant, more information about this facility can be found elsewhere [66]. Then, the mixed microbial culture was acclimatized during four months to the MFC operational conditions. To do this, the anodic chamber was connected to a 0.25 L auxiliary tank. This tank was filled the first day with 0.2 L of activated sludge and 0.05 L of wastewater. The liquid bulk was recirculated during the first day at a flow rate of 0.75 L/d. Every day, 0.05 L of the liquid bulk of the tank was purged and replaced by fresh synthetic wastewater. The biochemical properties of the synthetic water used in this work allow it to be assumed to be neutral for microbes inside of MFC. Once acclimatized, the MFC operated in a continuous mode and the wastewater was fed, at a flow rate of 0.75 L/d, from a sterilized synthetic wastewater container of 5 L. The sterilization process was carried out at 105 °C for 30 min [67].
Wastewater was synthesized according to the literature in order to mimic the characteristics of the municipal wastewaters [66]. The components and concentrations of the synthetic wastewater are shown in Table 1.

Table 1.
Characteristics of the synthetic wastewater.
2.3. Analytical Methods
The voltage (V) between the terminals of the external resistance was continuously monitored using a digital multimeter (Keithley 2000). The voltage exerted is directly related to the current (I) flowing between the electrodes by the Ohms Law, I = V/R. Power (P) was calculated as p = I·V. Power density was calculated by dividing the power obtained by the surface area of the anode. Polarization curves were recorded using an Autolab PGSTAT30 potentiostat/galvanostat (Ecochemie, The Netherlands), with a scan rate of 1 mV/s and a step potential of 1 mV. These curves allow to discern three important parameters of the MFC performance, including the open circuit voltage (OCV) or the maximum allowable voltage (Vmax), the short-circuit current (Imax), and the maximum feasible power density (Pmax). Moreover, the internal resistance (Rint) can be calculated from the Pmax and the current density at Pmax (IPmax) according to Equation (1).
The volatile suspended solids (VSS) concentrations were determined according to standard methods [68]. The COD was determined using a spectrophotometer (Pharo 100 Merck). The pH was measured by a PCE-228 pH-meter (PCE Holding GmbH, Hamburg, Germany). The COD removal rate I was calculated through Equation (2) and COD removal efficiency (ξ) was obtained with Equation (3):
where CODo represents the influent COD concentration (g COD/L), CODf corresponds to the effluent COD concentration (g COD/L), Q is the flow rate (L/d) and V is the volume of the anodic chamber (L).
Finally, the CE can be calculated as indicated in Equation (4):
where M is the molecular weight of oxygen (32), I corresponds to the current intensity generated, F is Faraday’s constant (96.485 C mol−1 e−), b represents the number of electrons exchanged per mole of COD removed (in this case, glucose and fructose, 4 mol of electrons/mol of COD), V is the volume of liquid in the anode compartment, and ΔCOD denotes the change in COD concentration over the period of time.
Regarding the number of moles of electrons produced per mol of substrate measured as COD, its value is 4 as can be observed in the reactions taking place in the anodic chamber of the MFC [69]:
Anodic oxidation: C6H12O6 + 6 H2O → 6CO2 + 24 H+ + 24e−
Cathodic reduction: O2 + 4H+ + 4e− → 2H2O
Global reaction: C6H12O6 + 6O2 → 6CO2 + H2O
Cathodic reduction: O2 + 4H+ + 4e− → 2H2O
Global reaction: C6H12O6 + 6O2 → 6CO2 + H2O
The biomass characterization was carried out using a MALDI-TOF AXIMA Assurance by Shimadzu. The matrix solutions used for the analysis were prepared by saturating α-cyano-4-hydroxycinnamic acid in a 1:48:2 acetonitrile:water:trifluoroacetic acid matrix solution. Then, the microorganisms were dehydrated using ethanol at 75%, and the solution was centrifuged at 1000 rpm for ten minutes. After centrifugation, the supernatant was removed, and the biomass recovered from the precipitate using 20 µL of an acetonitrile/formic acid/water (50:35:15) solution according to the procedure described in the literature [70].
3. Results and Discussion
3.1. Influence of the Flow Rate on Exerted Current Density and COD Removal
As previously stated, the influent was stepwise modified. In order to test the existence of hysteresis, forward and reverse scans were carried out. Figure 2 presents the exerted voltage for the different influent flow rates studied.
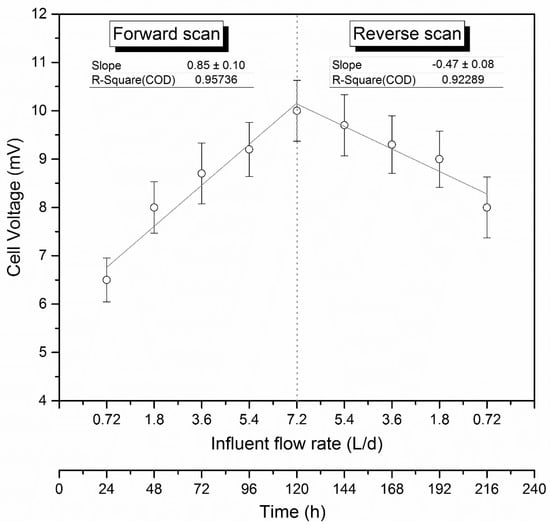
Figure 2.
Effect of the influent flow rate on the steady-state exerted voltage.
As can be seen, the exerted voltage drastically increased, from 6.5 to 10.0 mV, when the influent flow rate increased from 0.72 to 7.20 L/d. It could be explained by the fact that high flow rates increase the organic load available for microbial oxidation. This behavior has been also demonstrated by Gude [71], who reported that higher organic loading rates (OLR) resulted in higher electrical energy outputs. In addition, an increase in the flow rate generates turbulence. Both factors, i.e., the higher OLR and the higher turbulence, led the system to a more efficient mass transfer in the biofilm. This facilitates the diffusion and proton-motive potentials, causing, therefore, better electrochemical performance of the MFC in terms of electric power generation [72]. As can be seen in Figure 2, during the forward scan a linear trend with a slope of 0.85 mV per L/d increased in the flow rate was observed, presenting a regression coefficient of 0.957. Once the forward scan had been finished, a reverse scan was performed and a reduction in the exerted voltage, from 10.0 to 8.0 mV, was observed. During the reverse scan, a linear trend was also observed. However, the reduction in the exerted current density was lower than expected, 0.47 mV per each L/d decreased in the flow rate, regression coefficient 0.923, exerting in all the cases voltages higher than those obtained in the forward scan when operating at the same influent flow rate. The different behavior in the forward and reverse scans defined a hysteresis loop. This behavior could be explained by the growth of electrogenic microorganisms or by enhanced electrogenic metabolisms developed during the experiments performed at high flow rates [48]. In order to identify whether the increase in the electric power generation was linked or not to higher COD removal, the mineralization of the effluent was evaluated. To do that, the influent and effluent COD was analyzed, and the COD removal efficiency and COD removal rate were determined. In Figure 3, the COD removal efficiency and the COD removal rate are presented as functions of the influent flow rate.
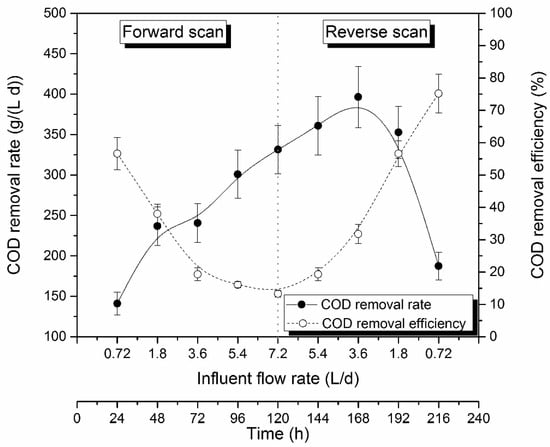
Figure 3.
Effect of the influent flow rate on the chemical oxygen demand (COD) removal efficiency and rate.
On the one hand, as can be seen in Figure 3, the increase in the flow rate from 0.72 to 7.20 L/d significantly increased the COD removal rate from 141.1 to 331.6 g/(L/d). This enhancement presented a linear trend. This trend was maintained even when the reverse scan started. When decreasing the flow rate from 7.2 to 5.4 and then to 3.6 L/d, the COD removal rate increased up to 396.4 g/(L/d). This behavior could be explained by the inertia of the MFC. In the literature, it has been interpreted that the exposition to high OLR could result in biomass growth and/or in an increase in the microbial enzymatic production in order to degrade as much COD as possible [48,73]. In this case, the effect was maintained during about 60 h indicating that it could be explained by an enhanced enzymatic activity. Then, when decreasing the flow rate down to 0.72 L/d, the COD removal rate decreased to 187.5 g/(L/d), yielding in all the cases COD removal rates higher in the reverse scan than in the forward one. This trend defined a maximum COD removal rate of 396.4 g/(L/d) obtained in the reverse scan when the influent flow rate was 3.6 L/d.
On the other hand, the substrate removal efficiency decreased from 57% to 13% as the influent flow rate increased in the forward scan. The minimum COD removal efficiency was reached when operating at the highest influent flow rate, i.e., 7.20 L/d. Then, the substrate removal efficiency increased from 13% to 75% as the influent flow rate decreased in the reverse scan. Again, the MFC presented a better performance in the reverse scan than in the forward one, the enhancement being of about 25%.
These behaviors can be explained by the fact that the higher the influent flow rate, the higher the OLR and the turbulence and the lower the HRT in the anodic chamber. As the OLR and the turbulence increase, the mass transfer is enhanced increasing the substrate available to be oxidized by the mixed microbial culture. Under these conditions, the amount of COD removed increased, although the higher OLR experienced led to lower figures in the percentage of COD removed. In addition, the time available by the microorganisms to degrade substrate decreased, due to the reduction in the HRT caused by the higher influent flow rate [74,75,76].
It can be seen in Figure 3 that the behavior of the system was different in the forward and reverse scans in terms of both COD removal efficiency and COD removal rate. The presence of hysteresis also indicated that the behavior of the microbial culture changed after the influent flow rate tests [48]. As in the case of the current density exerted, the hysteresis curve can be therefore explained by the growth of the electrogenic microorganisms or by an enhanced enzyme synthesis developed during the high load periods. In these conditions, the enhancement was maintained during about 48 h. Therefore, in these situations, the microbial culture of the MFC was able to degrade the COD at higher rates.
Once the current density exerted and the COD removal rate had been evaluated, it was observed that similar trends were experienced in both parameters. In addition, it is also important to analyze both enhancements and to check whether or not their enhancements were proportional. To do that, a parameter involving both variables, the Coulombic efficiency (CE), was determined.
3.2. Influence of the Flow Rate on the CE
In order to evaluate the change in the efficiency of the chemical energy conversion into electrical energy, the CE was determined in both the forward and the reverse scans. Figure 4 presents the effect of the influent flow rate on the CE in both forward and reverse scan. It can be seen that the CE decreased from 27% to 20% when the flow rate increased from 0.72 to 1.8 L/d. Then, the CE was maintained about constant when increasing the flow rate from 1.8 to 7.2 L/d. In the reverse scan, when the flow rate was decreased, the CE decreased from 22% to 14%. Finally, the CE drastically increased, reaching 25%, when the flow rate was reduced to 0.72 L/d. Moreover, Figure 4 shows that the CE obtained for the same flow rate is lower in the reverse scan than in the forward one, confirming the change in the behavior of the microbial culture. The trend presented by the CE can be explained by the fact that the COD removal increased more than proportionally to the electrical energy exerted, as seen in Figure 2 and Figure 3. Thus, although the microorganisms degraded more COD in the reverse scan, they used less substrate to electric power generation, yielding a lower CE value.
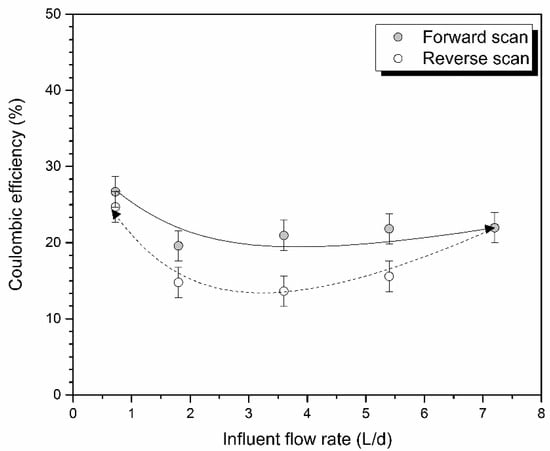
Figure 4.
Dependence of Coulombic efficiency (CE) with the influent flow rate.
When operating at higher flow rates, and therefore higher OLR, the non-electrogenic microorganisms consumed a higher share of the COD without electric power generation. In Figure 4, low values of the CE were obtained when operating at the higher OLR which could be explained by a high substrate oxidation by non-electrogenic microorganisms, such as sulphate-reducing bacteria or methanogenic archaea, etc. [77] and also due to the intrusion of oxygen through the PEM [45,78], whose dissolution is favored at high flow rates [79]. Additionally, the higher OLR experienced by the electrogenic microorganisms could reduce the CE according to the results previously reported in the literature [80]. In order to verify these statements, the microbial population was characterized by means of a MALDI-TOF analysis. From these analyses it was observed that, after the flow rate tests, the microbial population distribution was similar, presenting an increase in the presence of microorganisms from the Clostridium genus, a main fermenter strain with hardly electrogenic abilities. A gravimetric analysis also indicated an increase in the concentration of microorganisms in the MFC. These results indicate that the enhancement in the electric power generation was linked to an increase in the concentration of microorganisms.
From these results, it can be concluded that the best CE and COD removal efficiencies were observed at the lowest flow rate. However, better performance in terms of COD removal rate and electric power generation was obtained at high influent flow rates. Due to that, for practical applications in full-scale plants, the system design should reach the discharge limits established for the receiving water bodies balancing the high percentages of COD removal and CE reached, obtained at low influent flow rates, with the high COD removal rates and electric power generation, obtained at high influent flow rates.
3.3. Performance Modelling of the MFC
In order to determine the short-term effects of the influent flow rate modifications on the MFC performance, polarization curves before and after the step-wise flow rate tests were modelled. Both tests were performed at a flow rate of 0.72 L/d. Figure 5 presents the obtained polarization and power density curves which were slightly different, indicating that the changes in the influent flow rate experienced during the test influenced the MFC behavior. From these polarization curves, the maximum power density, the OCV, and internal resistance were determined.
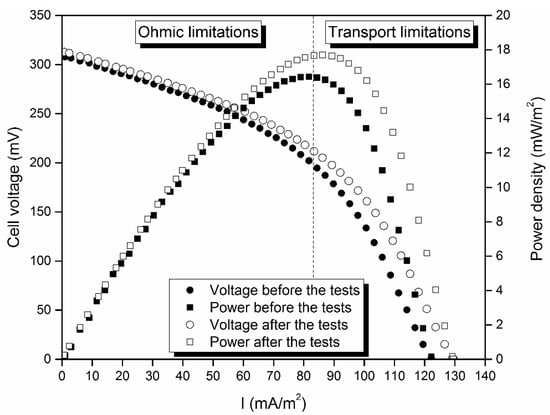
Figure 5.
Polarization and power curves of the microbial fuel cells (MFCs) before and after the experiments.
The theoretical fuel cell polarization curves have three regions where different types of losses reduce the exerted current: (1) The kinetic limitation is dominant at low current densities, (2) the ohmic limitation governs the intermediate region, and (3) the transport limitation is found at high current densities [1]. In the polarization curve obtained in this work, see Figure 5, only the ohmic and the transport limitation regions were observed. It means that the main limitations were ohmic losses and mass transfer losses. On the one hand, the ohmic losses arose from the resistance corresponding to ion conduction, due to the solution and the membrane, but also due to the flow of electrons through the electrode. On the other hand, the mass transfer losses mainly arose when the flux of reactants to the electrode or the flux of products from the electrode were insufficient, limiting the rate of reaction. It can be observed that the drop related to the ohmic losses softened after the flow rate tests and the same behavior was observed in the mass transfer losses. Therefore, limitations were partially overcome after performing the experiments with higher influent flow rates. In order to evaluate these facts, Table 2 shows the maximum power and current density exerted by the MFC before and after the flow rate tests.
Table 2.
Polarization and power curves parameters.
As shown in Table 2, the maximum power density that could be obtained with the MFC increased from 16.5 to 17.7 mW/m2, whereas the maximum current density increased from 122 to 130 mA/m2. These values reflect the same behavior of the electric power generation as presented in Section 3.1, in which the current density exerted under short circuit conditions at the end of the experiment was higher than the initial one. Therefore, the electrogenic activity of the MFC was favored after the exposition to high influent flow rates.
In order to isolate the mechanisms leading to better performance of the MFC after the influent flow rate tests, the results of the polarization curves were fitted to a mathematical model proposed in the literature [63].
In Equation (5), the MFC exerted voltage is calculated by subtracting the following voltage losses from the maximum achievable potential, i.e., the standard potential (E0): The losses caused by activation represented by the term (, those corresponding to ohmic resistances and represented by and those due to mass transfer limitations represented by the empirical term .
The obtained results showed that the E0 values were the same before and after the flow rate tests, remaining at approximately 0.3 V. This behavior indicates that no influence of the flow rate variations was experienced on the exerted standard voltage. This can be explained by the fact that the flow rate tests do not affect the reactions taking place in both the anode and the cathode. With regard to the activation losses, all the experimental data sets were fitted with the same b value of 0.005 V/decade indicating negligible short-term effects of the influent flow rate modifications on the bioelectrocatalytic activity of the MFC. This b value is in accordance with the typical value presented in the literature when fitting polarization curves [63] of MFC operating with bioanodes. With regard to the internal resistance value, R value, after the flow rate tests, a different value was observed, the value obtained before the tests being about 20% higher than after the tests. This result indicated that the flow rate modifications influenced the internal resistance of the MFC. Taking into account that neither the wastewater composition nor the MFC configuration was modified, the only explanation is the increase of the concentration of electrogenic microorganisms performing the electrogenic reactions. As stated above, the microbial composition was determined by means of a MALDI-TOF analysis. From this analysis, a slight increase was observed in the Clostridium presence. Moreover, the biomass concentration increased after the flow rate tests. Due to that, the change experienced by the MFC could only be explained by the growth of electrogenic microorganisms. Finally, mass transfer limitations were studied.
The fitting values of the parameter m were the same in both cases, however, the n parameter decreased about 5% after the flow rate tests. The n parameter is related to the threshold value causing a deviation in the linearity of the voltage due to mass transfer limitations. Due to that, the change in the value of n parameter indicated that different mass transfer limitations took place before and after the flow rate tests. In Table 2, it can be seen that the n parameter decreased after the flow rate tests, indicating that the threshold current density at which the limitations took place, was lower after the flow rate tests. This result indicates a direct relationship between the flow rate variations and the limitations experienced by the mass transfer. Taking into account that very similar microbial populations were observed in both tests, Geobacter and Clostridium, and the fact that the same flow rate as well as substrate concentrations were applied, these limitations could only be related to the increase in the concentration of electrogenic microorganisms in the MFC. In the particular case of the MFC technology, the direct and indirect electron transfers are controlled by the biomass concentration in the system [81]. In this sense, the higher the biomass concentration, the higher the electrogenic performance of the MFC.
Table 3.
Parameters values obtained in modelling the polarization curves.
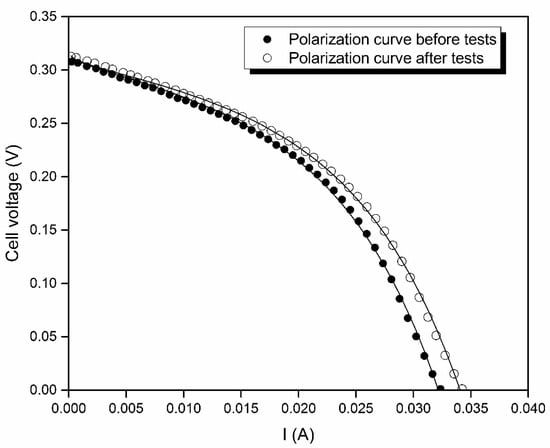
Figure 6.
Fitting results of the polarization curves obtained before and after the flow rate tests.
4. Conclusions
This work addresses one of the most important challenges to achieve real implementation of MFC, that is, handling the flow rate variations. For this reason, the short-term effects of the influent flow rate variations have been evaluated by operating an MFC. The results show that increasing the flow rate from 0.72 to 7.2 L/d increased the electric power generation exerted and the COD removal rate while decreased the COD removal efficiency and the CE. High flow rates lead to high OLR, high mixing intensity, and reduce mass transfer limitations. Then, when returning to the initial conditions a hysteresis loop was observed caused by the growth of the microbial culture when it is exposed to high OLR. CE figures reflect a decrease in the electrogenic activity at high flow rates. From the viewpoint of practical applications, the overall evaluation of these aspects indicates that the variations in the influent flow rate experienced by the MFC have no significant influence on its performance in either electrogenic or pollutant removal aspects. Future work will focus on the scale up by means of miniaturization and multiplication as well as in the implementation and analysis of a power system model.
Author Contributions
F.J.F.-M. designed the experiments; S.M. and S.P. performed the experiments; F.J.F.-M. and S.M. analyzed the data; F.J.F.-M. wrote the paper; F.J.F.-M. and J.N. reviewed and edited the paper. All authors have read and agreed to the published version of the manuscript.
Funding
This research was funded by JCCM, project grant number SBPLY/19/180501/000254 is gratefully acknowledged.
Conflicts of Interest
The authors declare no conflict of interest.
References
- Logan, B.E.; Hamelers, H.; Rozendal, R.; Schröder, U.; Keller, J.; Freguia, S.; Aelterman, P.; Verstraete, W.; Rabaey, K. Microbial Fuel Cells: Methodology and Technology. Environ. Sci. Technol. 2006, 40, 5181–5192. [Google Scholar] [CrossRef] [PubMed]
- Tommasi, T.; Lombardelli, G. Energy sustainability of Microbial Fuel Cell (MFC): A case study. J. Power Sour. 2017, 356, 438–447. [Google Scholar] [CrossRef]
- Strik, D.P.B.T.B.; Hamelers, V.M.H.; Snel, J.F.H.; Buisman, C.J.N. Green electricity production with living plants and bacteria in a fuel cell. Int. J. Energy Res. 2008, 32, 870–876. [Google Scholar] [CrossRef]
- Beyene, H.D.; Werkneh, A.A.; Ambaye, T.G. Current updates on waste to energy (WtE) technologies: A review. Renew. Energy Focus 2018, 24, 1–11. [Google Scholar] [CrossRef]
- Sato, T.; Qadir, M.; Yamamoto, S.; Endo, T.; Zahoor, A. Global, regional, and country level need for data on wastewater generation, treatment, and use. Agric. Water Manag. 2013, 130, 1–13. [Google Scholar] [CrossRef]
- De Lucas, A.; Rodríguez, L.; Villasenor, J.; Fernandez-Morales, F.J. Biodegradation kinetics of stored wastewater substrates by a mixed microbial culture. Biochem. Eng. J. 2005, 26, 191–197. [Google Scholar] [CrossRef]
- De Lucas, A.; Rodríguez, L.; Villasenor, J.; Fernández, F. Influence of industrial discharges on the performance and population of a biological nutrient removal process. Biochem. Eng. J. 2007, 34, 51–61. [Google Scholar] [CrossRef]
- Sirés, I.; Brillas, E.; Oturan, M.A.; Rodrigo, M.A.; Panizza, M. Electrochemical advanced oxidation processes: Today and tomorrow. A review. Environ. Sci. Pollut. Res. 2014, 21, 8336–8367. [Google Scholar] [CrossRef]
- Piuleac, C.G.; Curteanu, S.; Rodrigo, M.A.; Sáez, C.; Fernández, F. Optimization methodology based on neural networks and genetic algorithms applied to electro-coagulation processes. Open Chem. 2013, 11, 1213–1224. [Google Scholar] [CrossRef]
- Sandoval, O.G.M.; Trujillo, G.C.D.; Orozco, A.E.L. Amorphous silica waste from a geothermal central as an adsorption agent of heavy metal ions for the regeneration of industrial pre-treated wastewater. Water Resour. Ind. 2018, 20, 15–22. [Google Scholar] [CrossRef]
- Gutiérrez-Alfaro, S.; Rueda-Márquez, J.J.; Perales, J.A.; Manzano, M.A. Combining sun-based technologies (microalgae and solar disinfection) for urban wastewater regeneration. Sci. Total. Environ. 2018, 619, 1049–1057. [Google Scholar] [CrossRef] [PubMed]
- Van Der Bruggen, B.; Cornelis, G.; Vandecasteele, C.; Devreese, I. Fouling of nanofiltration and ultrafiltration membranes applied for wastewater regeneration in the textile industry. Desalination 2005, 175, 111–119. [Google Scholar] [CrossRef]
- Üstün, G.E.; Solmaz, S.K.A.; Birgul, A. Regeneration of industrial district wastewater using a combination of Fenton process and ion exchange—A case study. Resour. Conserv. Recycl. 2007, 52, 425–440. [Google Scholar] [CrossRef]
- Gude, V.G. Energy and water autarky of wastewater treatment and power generation systems. Renew. Sustain. Energy Rev. 2015, 45, 52–68. [Google Scholar] [CrossRef]
- Gude, V.G. Wastewater treatment in microbial fuel cells—An overview. J. Clean. Prod. 2016, 122, 287–307. [Google Scholar] [CrossRef]
- Fernandez-Morales, F.J.; Castro, M.; Rodrigo, M.A.; Cañizares, P. Reduction of aeration costs by tuning a multi-set point on/off controller: A case study. Control. Eng. Pract. 2011, 19, 1231–1237. [Google Scholar] [CrossRef]
- García-Gen, S.; Rodriguez, J.; Lema, J.M. Control strategy for maximum anaerobic co-digestion performance. Water Res. 2015, 80, 209–216. [Google Scholar] [CrossRef] [PubMed]
- Infantes, D.; Del Campo, A.G.; Villasenor, J.; Fernández, F. Influence of pH, temperature and volatile fatty acids on hydrogen production by acidogenic fermentation. Int. J. Hydrogen Energy 2011, 36, 15595–15601. [Google Scholar] [CrossRef]
- Fernández, M.D.L.A.; Sanromán, M.D.L.Á.; Marks, S.; Makinia, J.; Del Campo, A.G.; Rodrigo, M.A.; Fernandez-Morales, F.J.; Morales, F.J.F. A grey box model of glucose fermentation and syntrophic oxidation in microbial fuel cells. Bioresour. Technol. 2016, 200, 396–404. [Google Scholar] [CrossRef]
- Bose, D.; Dhawan, H.; Kandpal, V.; Vijay, P.; Gopinath, M. Bioelectricity generation from sewage and wastewater treatment using two-chambered microbial fuel cell. Int. J. Energy Res. 2018, 42, 4335–4344. [Google Scholar] [CrossRef]
- Kumar, R.; Singh, L.; Zularisam, A.; Hai, F.I. Microbial fuel cell is emerging as a versatile technology: A review on its possible applications, challenges and strategies to improve the performances. Int. J. Energy Res. 2017, 42, 369–394. [Google Scholar] [CrossRef]
- Mateo, S.; Cañizares, P.; Rodrigo, M.A.; Fernandez-Morales, F.J. Reproducibility and robustness of microbial fuel cells technology. J. Power Sour. 2019, 412, 640–647. [Google Scholar] [CrossRef]
- Mateo, S.; Cañizares, P.; Fernandez-Morales, F.J.; Rodrigo, M.A. A Critical View of Microbial Fuel Cells: What Is the Next Stage? ChemSusChem 2018, 11, 4183–4192. [Google Scholar] [CrossRef] [PubMed]
- Ren, H.; Lee, H.-S.; Chae, J. Miniaturizing microbial fuel cells for potential portable power sources: Promises and challenges. Microfluid. Nanofluid. 2012, 13, 353–381. [Google Scholar] [CrossRef]
- Babanova, S.; Jones, J.; Phadke, S.; Lu, M.; Angulo, C.; Garcia, J.; Carpenter, K.; Cortese, R.; Chen, S.; Phan, T.; et al. Continuous flow, large-scale, microbial fuel cell system for the sustained treatment of swine waste. Water Environ. Res. 2019, 92, 60–72. [Google Scholar] [CrossRef]
- Wu, S.; Li, H.; Zhou, X.; Liang, P.; Zhang, X.; Jiang, Y.; Huang, X. A novel pilot-scale stacked microbial fuel cell for efficient electricity generation and wastewater treatment. Water Res. 2016, 98, 396–403. [Google Scholar] [CrossRef]
- Lu, M.; Chen, S.; Babanova, S.; Phadke, S.; Salvacion, M.; Mirhosseini, A.; Chan, S.; Carpenter, K.; Cortese, R.; Bretschger, O. Long-term performance of a 20-L continuous flow microbial fuel cell for treatment of brewery wastewater. J. Power Sour. 2017, 356, 274–287. [Google Scholar] [CrossRef]
- Feng, Y.; He, W.; Liu, J.; Wang, X.; Qu, Y.; Ren, N. A horizontal plug flow and stackable pilot microbial fuel cell for municipal wastewater treatment. Bioresour. Technol. 2014, 156, 132–138. [Google Scholar] [CrossRef]
- Bond, D.R.; Lovley, D. Electricity Production by Geobacter sulfurreducens Attached to Electrodes. Appl. Environ. Microbiol. 2003, 69, 1548–1555. [Google Scholar] [CrossRef]
- Schröder, U. Anodic electron transfer mechanisms in microbial fuel cells and their energy efficiency. Phys. Chem. Chem. Phys. 2007, 9, 2619–2629. [Google Scholar] [CrossRef]
- Min, B.; Kim, J.R.; Oh, S.; Regan, J.M.; Logan, B.E. Electricity generation from swine wastewater using microbial fuel cells. Water Res. 2005, 39, 4961–4968. [Google Scholar] [CrossRef]
- Jung, S. Impedance analysis of Geobacter sulfurreducens PCA, Shewanella oneidensis MR-1, and their coculture in bioeletrochemical systems. Int. J. Electrochem. Sci. 2012, 7, 11091–11100. [Google Scholar]
- Ringeisen, B.R.; Henderson, E.; Wu, P.K.; Pietron, J.; Ray, R.; Little, B.; Biffinger, J.C.; Jones-Meehan, J.M. High Power Density from a Miniature Microbial Fuel Cell UsingShewanella oneidensisDSPEnviron. Sci. Technol. 2006, 40, 2629–2634. [Google Scholar] [CrossRef] [PubMed]
- Samsudeen, N.; Radhakrishnan, T.; Matheswaran, M. Bioelectricity production from microbial fuel cell using mixed bacterial culture isolated from distillery wastewater. Bioresour. Technol. 2015, 195, 242–247. [Google Scholar] [CrossRef] [PubMed]
- Kumar, R.; Singh, L.; Wahid, Z.A.; Din, M.F.M. Exoelectrogens in microbial fuel cells toward bioelectricity generation: A review. Int. J. Energy Res. 2015, 39, 1048–1067. [Google Scholar] [CrossRef]
- Rabaey, K.; Lissens, G.; Siciliano, S.D.; Verstraete, W. A microbial fuel cell capable of converting glucose to electricity at high rate and efficiency. Biotechnol. Lett. 2003, 25, 1531–1535. [Google Scholar] [CrossRef]
- Alipanahi, R.; Rahimnejad, M. Effect of different ecosystems on generated power in sediment microbial fuel cell. Int. J. Energy Res. 2018, 42, 4891–4897. [Google Scholar] [CrossRef]
- Fernández, F.; Sánchez-Arias, V.; Villasenor, J.; Rodríguez, L. Evaluation of carbon degradation during co-composting of exhausted grape marc with different biowastes. Chemosphere 2008, 73, 670–677. [Google Scholar] [CrossRef]
- Fernandez-Morales, F.J.; Villasenor, J.; Infantes, D. Modeling and monitoring of the acclimatization of conventional activated sludge to a biohydrogen producing culture by biokinetic control. Int. J. Hydrog. Energy 2010, 35, 10927–10933. [Google Scholar] [CrossRef]
- Hummert, S.; Bohl, K.; Basanta, D.; Deutsch, A.; Werner, S.; Theißen, G.; Schroeter, A.; Schuster, S. Evolutionary game theory: Cells as players. Mol. BioSyst. 2014, 10, 3044–3065. [Google Scholar] [CrossRef]
- Zhang, L.; Li, J.; Zhu, X.; Ye, D.; Fu, Q.; Liao, Q. Startup Performance and Anodic Biofilm Distribution in Continuous-Flow Microbial Fuel Cells with Serpentine Flow Fields: Effects of External Resistance. Ind. Eng. Chem. Res. 2017, 56, 3767–3774. [Google Scholar] [CrossRef]
- Mateo, S.; D’Angelo, A.; Scialdone, O.; Cañizares, P.; Rodrigo, M.A.; Fernandez-Morales, F.J. The influence of sludge retention time on mixed culture microbial fuel cell start-ups. Biochem. Eng. J. 2017, 123, 38–44. [Google Scholar] [CrossRef][Green Version]
- Liu, S.-H.; Lin, H.-H.; Wen, S.; Lin, C.-W. Performance of trickling bed microbial fuel cell treating isopropyl alcohol vapor: Effects of shock-load and shut-down episodes. Chemosphere 2019, 224, 168–175. [Google Scholar] [CrossRef]
- Aelterman, P.; Versichele, M.; Marzorati, M.; Boon, N.; Verstraete, W. Loading rate and external resistance control the electricity generation of microbial fuel cells with different three-dimensional anodes. Bioresour. Technol. 2008, 99, 8895–8902. [Google Scholar] [CrossRef]
- Behera, M.; Ghangrekar, M. Performance of microbial fuel cell in response to change in sludge loading rate at different anodic feed pH. Bioresour. Technol. 2009, 100, 5114–5121. [Google Scholar] [CrossRef]
- Sobieszuk, P.; Zamojska-Jaroszewicz, A.; Makowski, Ł. Influence of the operational parameters on bioelectricity generation in continuous microbial fuel cell, experimental and computational fluid dynamics modelling. J. Power Sour. 2017, 371, 178–187. [Google Scholar] [CrossRef]
- Larrosa-Guerrero, A.; Scott, K.; Head, I.M.; Mateo, F.; Ginestá, A.; Godínez, C. Effect of temperature on the performance of microbial fuel cells. Fuel 2010, 89, 3985–3994. [Google Scholar] [CrossRef]
- Del Campo, A.G.; Lobato, J.; Cañizares, P.; Rodrigo, M.A.; Fernandez-Morales, F.J. Short-term effects of temperature and COD in a microbial fuel cell. Appl. Energy 2013, 101, 213–217. [Google Scholar] [CrossRef]
- D’Angelo, A.; Mateo, S.; Scialdone, O.; Cañizares, P.; Fernandez-Morales, F.J.; Rodrigo, M.A. Optimization of the performance of an air-cathode MFC by changing solid retention time. J. Chem. Technol. Biotechnol. 2017, 92, 1746–1755. [Google Scholar] [CrossRef]
- Ledezma, P.; Greenman, J.; Ieropoulos, I. MFC-cascade stacks maximise COD reduction and avoid voltage reversal under adverse conditions. Bioresour. Technol. 2013, 134, 158–165. [Google Scholar] [CrossRef]
- Walter, X.A.; Forbes, S.; Greenman, J.; Ieropoulos, I. From single MFC to cascade configuration: The relationship between size, hydraulic retention time and power density. Sustain. Energy Technol. Assess. 2016, 14, 74–79. [Google Scholar] [CrossRef]
- Wei, L.; Yuan, Z.; Cui, M.; Han, H.; Shen, J. Study on electricity-generation characteristic of two-chambered microbial fuel cell in continuous flow mode. Int. J. Hydrogen Energy 2012, 37, 1067–1073. [Google Scholar] [CrossRef]
- Li, X.; Zhu, N.; Wang, Y.; Li, P.; Wu, P.; Wu, J. Animal carcass wastewater treatment and bioelectricity generation in up-flow tubular microbial fuel cells: Effects of HRT and non-precious metallic catalyst. Bioresour. Technol. 2013, 128, 454–460. [Google Scholar] [CrossRef]
- Li, W.-W.; Yu, H.-Q.; He, Z. Towards sustainable wastewater treatment by using microbial fuel cells-centered technologies. Energy Environ. Sci. 2013, 7, 911–924. [Google Scholar] [CrossRef]
- Ragab, M.; Elawwad, A.; Abdel-Halim, H. Simultaneous power generation and pollutant removals using microbial desalination cell at variable operation modes. Renew. Energy 2019, 143, 939–949. [Google Scholar] [CrossRef]
- Mateo, S.; Fernandez-Morales, F.J.; Cañizares, P.; Rodrigo, M.A. Influence of the Cathode Platinum Loading and of the Implementation of Membranes on the Performance of Air-Breathing Microbial Fuel Cells. Electrocatalysis 2017, 8, 442–449. [Google Scholar] [CrossRef]
- Liu, H.; Logan, B.E. Electricity Generation Using an Air-Cathode Single Chamber Microbial Fuel Cell in the Presence and Absence of a Proton Exchange Membrane. Environ. Sci. Technol. 2004, 38, 4040–4046. [Google Scholar] [CrossRef]
- Christwardana, M.; Frattini, D.; Frattini, D.; Yoon, S.P.; Kwon, Y. Early-stage performance evaluation of flowing microbial fuel cells using chemically treated carbon felt and yeast biocatalyst. Appl. Energy 2018, 222, 369–382. [Google Scholar] [CrossRef]
- Mateo, S.; Cañizares, P.; Rodrigo, M.A.; Fernandez-Morales, F.J. Driving force behind electrochemical performance of microbial fuel cells fed with different substrates. Chemosphere 2018, 207, 313–319. [Google Scholar] [CrossRef]
- Jafary, T.; Ghoreyshi, A.A.; Najafpour, G.D.; Fatemi, S.; Rahimnejad, M. Investigation on performance of microbial fuel cells based on carbon sources and kinetic models. Int. J. Energy Res. 2012, 37, 1539–1549. [Google Scholar] [CrossRef]
- Ren, H.; Torres, C.I.; Parameswaran, P.; Rittmann, B.E.; Chae, J. Improved current and power density with a micro-scale microbial fuel cell due to a small characteristic length. Biosens. Bioelectron. 2014, 61, 587–592. [Google Scholar] [CrossRef]
- Ieropoulos, I.; Winfield, J.; Greenman, J. Effects of flow-rate, inoculum and time on the internal resistance of microbial fuel cells. Bioresour. Technol. 2010, 101, 3520–3525. [Google Scholar] [CrossRef]
- Mateo, S.; Cañizares, P.; Rodrigo, M.A.; Fernandez-Morales, F.J. Driving force of the better performance of metal-doped carbonaceous anodes in microbial fuel cells. Appl. Energy 2018, 225, 52–59. [Google Scholar] [CrossRef]
- Potrykus, S.; Kutt, F.; Nieznański, J.; Fernandez-Morales, F.J. Advanced Lithium-Ion Battery Model for Power System Performance Analysis. Energies 2020, 13, 2411. [Google Scholar] [CrossRef]
- Salar-Garcia, M.; Ortiz-Martínez, V.M.; Baicha, Z.; Ríos, A.D.L.; Hernández-Fernández, F. Scaled-up continuous up-flow microbial fuel cell based on novel embedded ionic liquid-type membrane-cathode assembly. Energy 2016, 101, 113–120. [Google Scholar] [CrossRef]
- Mayor, L.R.; Camacho, J.V.; Morales, F.J.F. Operational Optimisation of Pilot Scale Biological Nutrient Removal at the Ciudad Real (Spain) Domestic Wastewater Treatment Plant. Water Air Soil Pollut. 2004, 152, 279–296. [Google Scholar] [CrossRef]
- De Lucas, A.; Rodríguez, L.; Villaseñor, J.; Fernández, F. Fermentation of agro-food wastewaters by activated sludge. Water Res. 2007, 41, 1635–1644. [Google Scholar] [CrossRef]
- Gilcreas, F.W. Future of standard methods for the examination of water and wastewater. Health Lab. Sci. 1967, 4, 137. [Google Scholar]
- Mateo, S.; Rodrigo, M.A.; Fonseca, L.P.; Cañizares, P.; Fernandez-Morales, F.J. Oxygen availability effect on the performance of air-breathing cathode microbial fuel cell. Biotechnol. Prog. 2015, 31, 900–907. [Google Scholar] [CrossRef]
- Mateo, S.; Del Campo, A.G.; Lobato, J.; Rodrigo, M.A.; Cañizares, P.; Fernandez-Morales, F.J. Long-term effects of the transient COD concentration on the performance of microbial fuel cells. Biotechnol. Prog. 2016, 32, 883–890. [Google Scholar] [CrossRef]
- Gude, V. Microbial fuel cells for wastewater treatment and energy generation. In Microbial Electrochemical and Fuel Cells; Elsevier: Amsterdam, The Netherlands, 2016; pp. 247–285. [Google Scholar] [CrossRef]
- Vigolo, D.; Al-Housseiny, T.T.; Shen, Y.; Akinlawon, F.O.; Al-Housseiny, S.T.; Hobson, R.K.; Sahu, A.; Bedkowski, K.I.; DiChristina, T.J.; Stone, H.A. Flow dependent performance of microfluidic microbial fuel cells. Phys. Chem. Chem. Phys. 2014, 16, 12535–12543. [Google Scholar] [CrossRef]
- Scott, K.; Yu, E.; Ghangrekar, M.; Erable, B.; Duţeanu, N. Biological and Microbial Fuel Cells. In Comprehensive Renewable Energy; Elsevier: Philadelphia, PA, USA, 2012; pp. 277–300. [Google Scholar]
- Ma, D.; Jiang, Z.-H.; Lay, C.-H.; Zhou, D. Electricity generation from swine wastewater in microbial fuel cell: Hydraulic reaction time effect. Int. J. Hydrogen Energy 2016, 41, 21820–21826. [Google Scholar] [CrossRef]
- Juang, D.F.; Yang, P.C.; Kuo, T.H. Effects of flow rate and chemical oxygen demand removal characteristics on power generation performance of microbial fuel cells. Int. J. Environ. Sci. Technol. 2012, 9, 267–280. [Google Scholar] [CrossRef]
- Park, Y.; Nguyen, V.K.; Park, S.; Yu, J.; Lee, T. Effects of anode spacing and flow rate on energy recovery of flat-panel air-cathode microbial fuel cells using domestic wastewater. Bioresour. Technol. 2018, 258, 57–63. [Google Scholar] [CrossRef]
- He, Z.; Minteer, S.D.; Angenent, L.T. Electricity Generation from Artificial Wastewater Using an Upflow Microbial Fuel Cell. Environ. Sci. Technol. 2005, 39, 5262–5267. [Google Scholar] [CrossRef] [PubMed]
- Ahn, Y.; Logan, B.E. A multi-electrode continuous flow microbial fuel cell with separator electrode assembly design. Appl. Microbiol. Biotechnol. 2012, 93, 2241–2248. [Google Scholar] [CrossRef] [PubMed]
- Li, Z.; Yao, L.; Kong, L.; Liu, H. Electricity generation using a baffled microbial fuel cell convenient for stacking. Bioresour. Technol. 2008, 99, 1650–1655. [Google Scholar] [CrossRef]
- Di Lorenzo, M.; Scott, K.; Curtis, T.P.; Head, I.M. Effect of increasing anode surface area on the performance of a single chamber microbial fuel cell. Chem. Eng. J. 2010, 156, 40–48. [Google Scholar] [CrossRef]
- Cheng, S.; Liu, H.; Logan, B.E. Increased Power Generation in a Continuous Flow MFC with Advective Flow through the Porous Anode and Reduced Electrode Spacing. Environ. Sci. Technol. 2006, 40, 2426–2432. [Google Scholar] [CrossRef]


© 2020 by the authors. Licensee MDPI, Basel, Switzerland. This article is an open access article distributed under the terms and conditions of the Creative Commons Attribution (CC BY) license (http://creativecommons.org/licenses/by/4.0/).