Low-Carbon Energy Governance: Scenarios to Accelerate the Change in the Energy Matrix in Ecuador


Abstract
1. Introduction
2. Materials and Methods
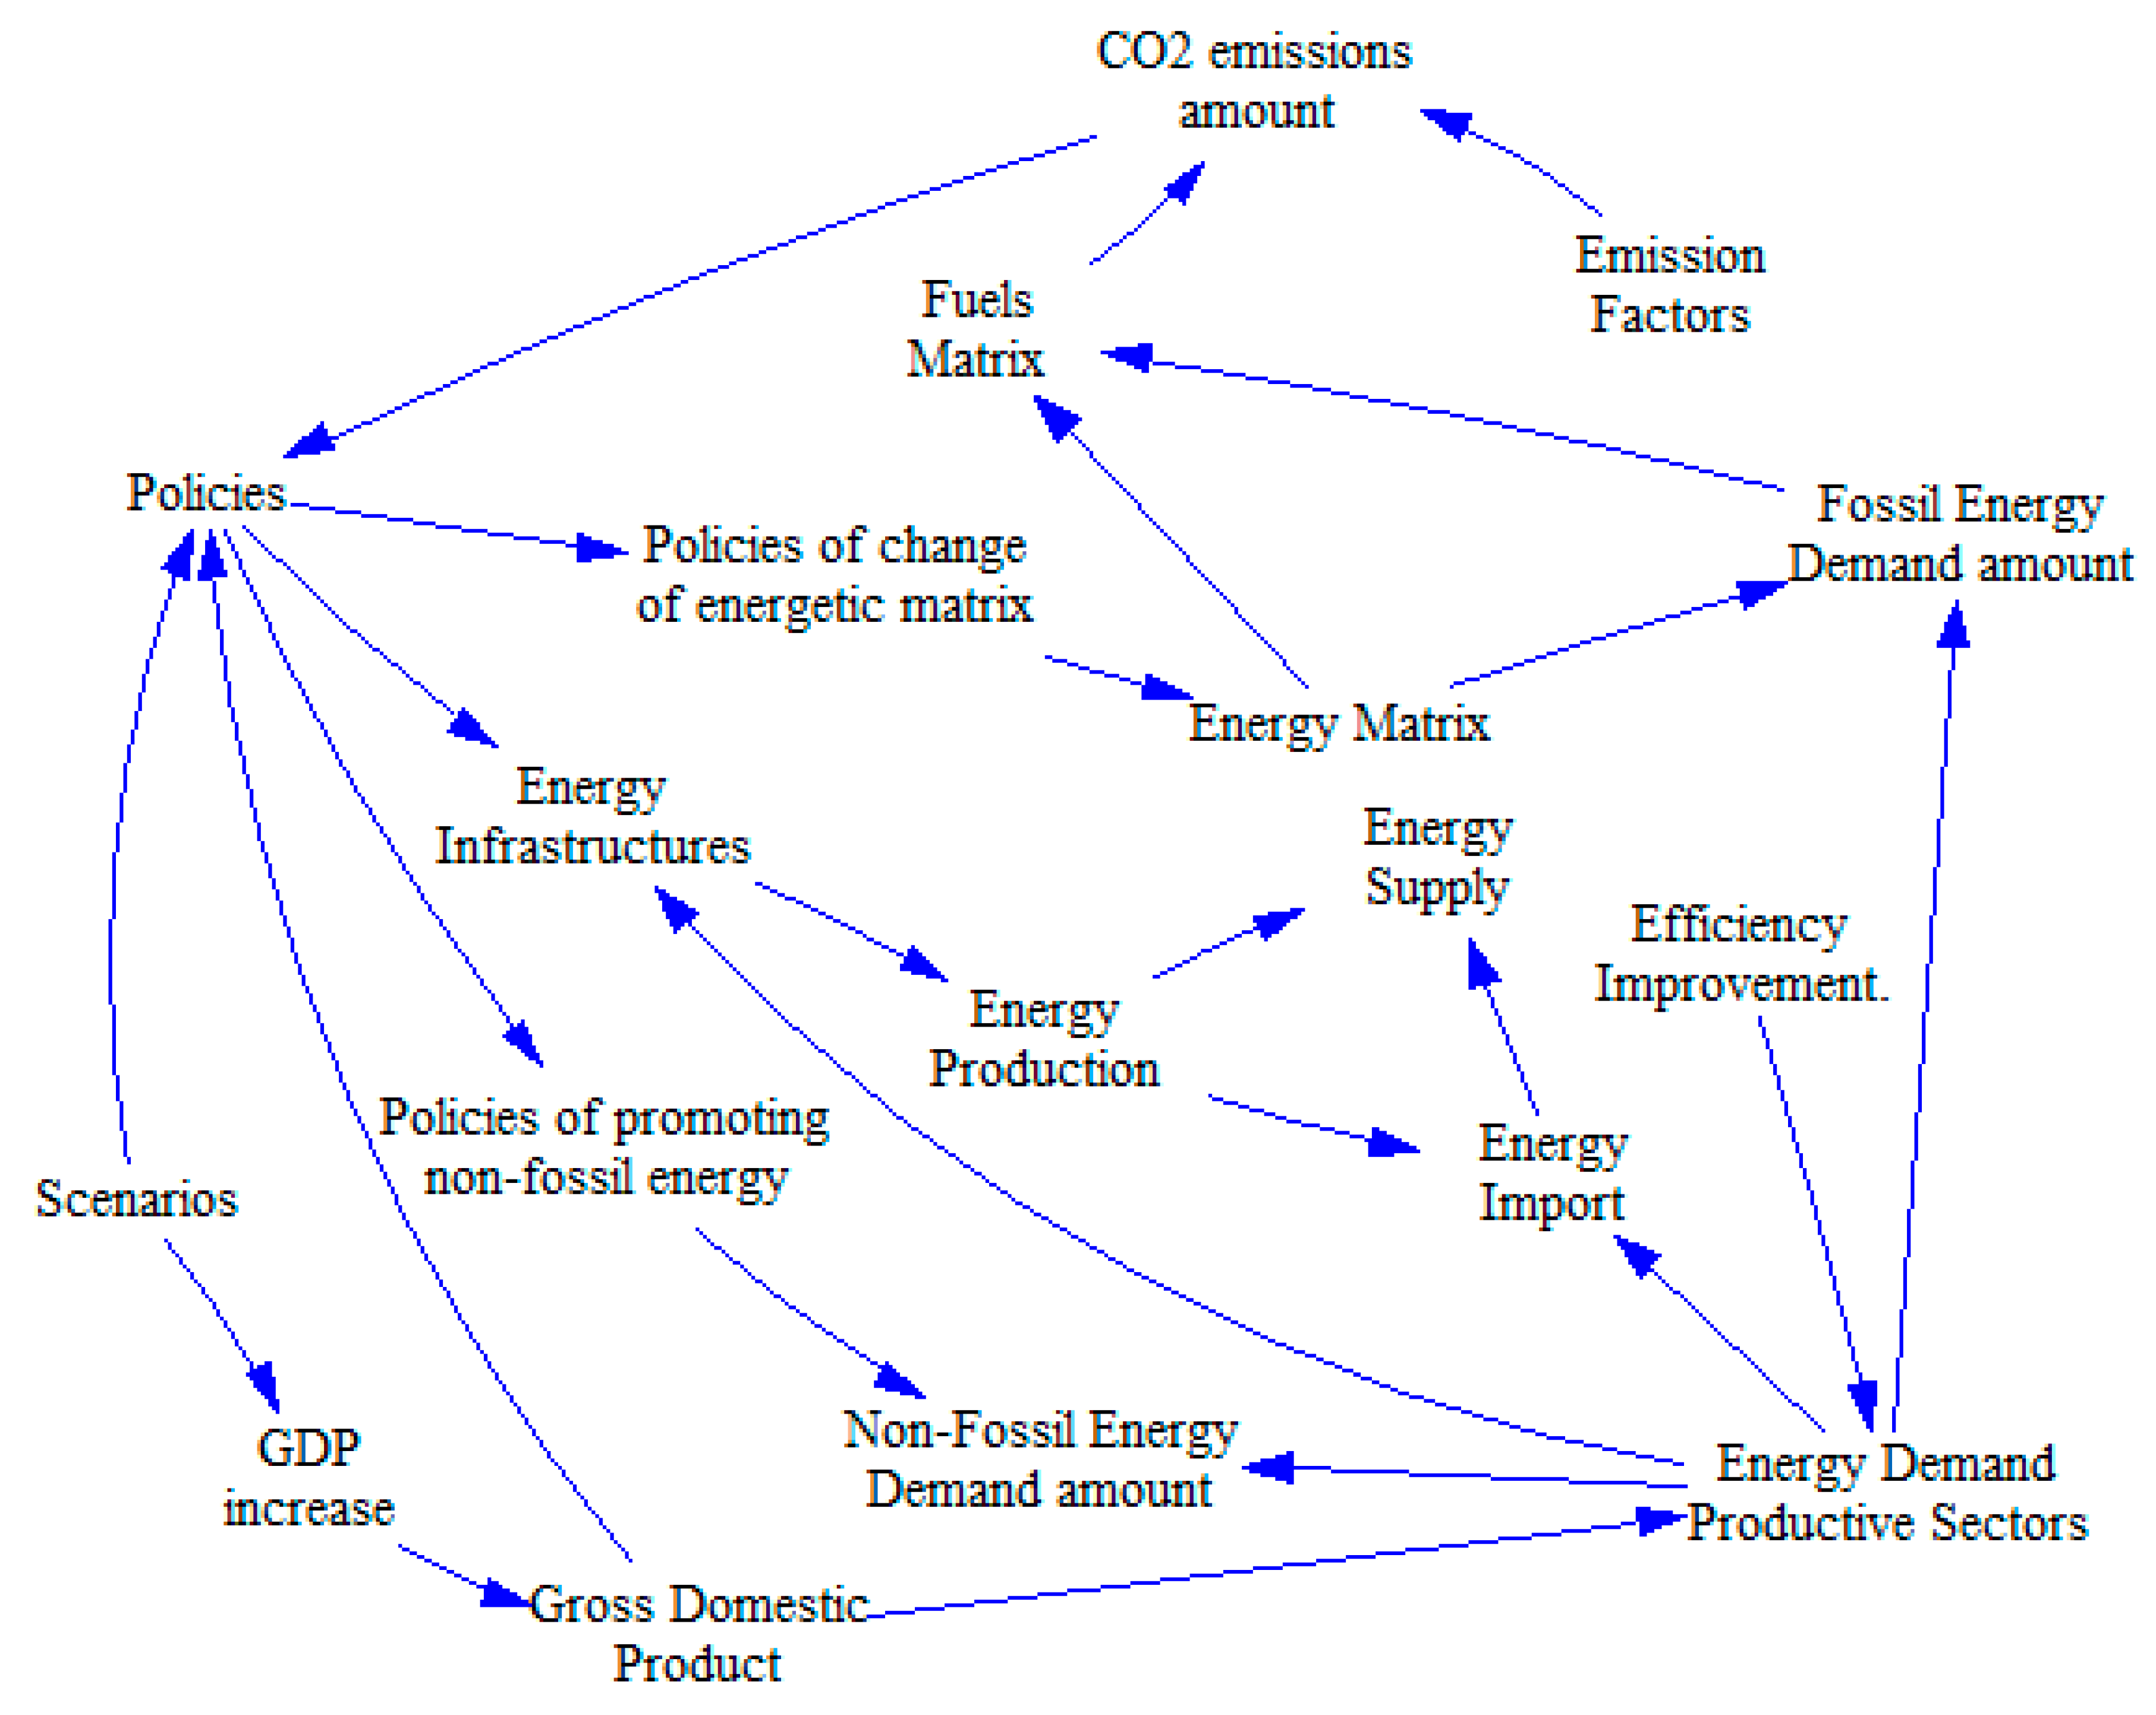
2.1. Model Description
2.2. Scenario Analysis
2.3. Modelling and Simulation
- Economy: the economy is modeled, assuming demand-driven growth and the complementarity of the sector. Therefore, production is determined by final demand and economic structure, combined with supply-side constraints, such as energy availability.
- Energy demand: final energy demand by sector is estimated through the projection of sector economic production and sector final energy demand, considering efficiency improvements and inter-final energy replacements driven by policies and physical scarcity.
- Energy availability: this module includes the potential and availability of RES and non-renewable energy resources, considering the biophysical and temporal limitations. In particular, the availability of non-renewable energy resources depends on both stock and flow limitations. In total, 5 energy sources and technologies are considered, and 9 final energies (electricity, solids, gases and liquids), with a technological breakdown. The modeling of energy availability is mainly based on the previous WoLiM model [56].
- Climate/emissions: the global model calculates the levels of CO2 emissions generated by the final amount of energy used in Ecuador.
3. Results
4. Discussion
5. Conclusions
Author Contributions
Funding
Conflicts of Interest
References
- United Nations Environment Programme. Global Environment Outlook GEO-6: Healthy Planet; UN Environment: Nairobi, Kenya, 2019. [Google Scholar]
- Claussen, E.; Peace, J. Energy myth twelve-climate policy will bankrupt the US economy. In Energy and American Society-Thirteen Myths; Springer: Dordrecht, The Netherlands, 2007; pp. 311–340. [Google Scholar]
- Stern, N. The Economics of Climate Change; Cambridge University Press: Cambridge, UK, 2007. [Google Scholar]
- International Energy Agency. Energy and Air Pollition; International Energy Agency: Paris, France, 2016. [Google Scholar]
- BP. BP Statistical Review of World Energy; Pureprint Group Limited: London, UK, 2019. [Google Scholar]
- International Energy Agency. Global Energy & CO2 Status Report; IEA: Paris, France, 2018. [Google Scholar]
- International Energy Agency. World Energy Outlook; IEA: Paris, France, 2016. [Google Scholar]
- Arroyo, F.R.; Miguel, L.J. Analysis of energy demand scenarios in Ecuador: National government policy perspectives and global trend to reduce CO2 emissions. Int. J. Energy Econ. Policy 2019, 9, 364–374. [Google Scholar]
- Ren, J.; Sovacool, B.K. Quantifying, measuring, and strategizing energy security: Determining the most meaningful dimensions and metrics. Energy 2014, 76, 838–849. [Google Scholar] [CrossRef]
- World Bank Group. Global Economic Prospects; The World Bank: Washington, DC, USA, 2019. [Google Scholar]
- Chang, C.-C. A multivariate causality test of carbon dioxide emissions, energy emissions, energy consumption and economic growth in China. Appl. Energy 2010, 87, 3533–3537. [Google Scholar] [CrossRef]
- Zhang, X.-P.; Cheng, X.-M. Energy consumption, carbon emissions, and economic growth in China. Ecol. Econ. 2009, 68, 2706–2712. [Google Scholar] [CrossRef]
- Saboori, B.; Sulaiman, J. CO2 emissions, energy consumption and economic growth in Association of Southeast Asian Nations (ASEAN) countries: A cointegration approach. Energy 2013, 55, 813–822. [Google Scholar] [CrossRef]
- Pao, H.-T.; Tsai, C.-M. CO2 emissions, energy consumption and economic growth in BRIC countries. Energy Policy 2010, 38, 7850–7860. [Google Scholar] [CrossRef]
- Mirzaei, M.; Bekri, M. Energy consumption and CO2 emissions in Iran, 2025. Environ. Res. 2017, 154, 345–351. [Google Scholar] [CrossRef] [PubMed]
- Hasseb, M.; Azam, M. Energy consumption, economic growth and CO2 emission nexus in Pakistan. Asian J. Appl. Sci. 2015, 8, 27–36. [Google Scholar] [CrossRef][Green Version]
- Saidi, K.; Hammami, S. The impact of CO2 emissions and economic growth on energy consumption in 58 countries. Energy Rep. 2015, 1, 62–70. [Google Scholar] [CrossRef]
- Arroyo, F.; Miguel, L.J. The Trends of the Energy Intensity and CO2 Emissions Related to Final Energy Consumption in Ecuador: Scenarios of National and Worldwide Strategies. Sustainability 2019, 12, 20. [Google Scholar] [CrossRef]
- Gazheli, A.; Van den Bergh, J.; Antal, M. How realistic is green growth? Sectoral-level carbon intensity versus productivity. J. Clean. Prod. 2016, 129, 449–467. [Google Scholar] [CrossRef]
- Arroyo, M.F.R.; Miguel, L.J. The Role of Renewable Energies for the Sustainable Energy Governance and Environmental Policies for the Mitigation of Climate Change in Ecuador. Energies 2020, 13, 3883. [Google Scholar] [CrossRef]
- Florini, A.; Sovacool, B.K. Who governs energy? The challenges facing global energy governance. Energy Policy 2009, 37, 5239–5248. [Google Scholar] [CrossRef]
- Sovacool, B.K. An international assessment of energy security performance. Ecol. Econ. 2013, 88, 148–158. [Google Scholar] [CrossRef]
- Sovacool, B.K.; Mukherjee, I.; Drupady, I.M.; D’Agostino, A.L. Evaluating energy security performance from 1990 to 2010 for eighteen countries. Energy 2011, 36, 5846–5863. [Google Scholar] [CrossRef]
- Saunders, H.; Sovacool, B.K. Competing policy packages and the complexity of energy security. Energy 2014, 67, 641–651. [Google Scholar]
- Ang, B.; Choong, W.; Ng, T. Energy security: Definitions, dimensions and indexes. Renew. Sustain. Energy Rev. 2015, 42, 1077–1093. [Google Scholar] [CrossRef]
- Morlet, C.; Keirstead, J. A comparative analysis of urban energy governance in four European cities. Energy Policy 2013, 61, 852–863. [Google Scholar] [CrossRef]
- Pinzón, K. Dynamics between energy consumption and economic growth in Ecuador: A granger causality analysis. Econ. Anal. Policy 2018, 57, 88–101. [Google Scholar] [CrossRef]
- BP. Statistical Review of World Energy; BP: London, UK, 2017. [Google Scholar]
- Coordinating Ministry of Strategic Sectors. National Energy Balance 2016; Coordinating Ministry of Strategic Sectors: Quito, Ecuador, 2017. [Google Scholar]
- Coordinating Ministry of Strategic Sectors. National Energy Agenda 2016–2040; Coordinating Ministry of Strategic Sectors: Quito, Ecuador, 2016. [Google Scholar]
- Sosa, G.F. El Cuidadano Períodico Oficial. 15 Noviembre 2017. Available online: http://www.elciudadano.gob.ec/ecuador-implementa-programas-para-reducir-las-emisiones-de-gases-contaminantes/ (accessed on 30 June 2019).
- IRENA. Renewable Energy Statistics 2018; International Renewable Energy Agency: Masdar City, UAE, 2018. [Google Scholar]
- International Energy Agency. World Energy Outlook 2018; IEA Publications: Paris, France, 2018. [Google Scholar]
- International Energy Agency. World Energy Investment; IEA Publications: Paris, France, 2018. [Google Scholar]
- IRENA. Renewable Power Generation Costs in 2017; International Renewable Energy Agency: Masdar City, UAE, 2018. [Google Scholar]
- Global Commission on the Geopolitics of Energy Transformation. A new world. In The Geopolitics of the Energy Transformation; International Renewable Energy Agency: Masdar City, UAE, 2019. [Google Scholar]
- DVG.GL. Energy Transition Outlook 2018; DVG.GL: Oslo, Norway, 2018. [Google Scholar]
- Downie, C. Business actors, political resistance, and strategies for policymakers. Energy Policy 2017, 108, 583–592. [Google Scholar] [CrossRef]
- Simsek, Y.; Lorca, Á.; Urmee, T.; Bahri, P.A.; Escobar, R. Review and assessment of energy policy developments in Chile. Energy Policy 2019, 127, 87–101. [Google Scholar] [CrossRef]
- Helm, D. The European framework for energy and climate policies. Energy Policy 2014, 64, 29–35. [Google Scholar] [CrossRef]
- Chang, C.-C.; Carballo, C.F.S. Energy conservation and sustainable economic growth: The case of Latin America and the Caribbean. Energy Policy 2011, 39, 4215–4221. [Google Scholar] [CrossRef]
- Gao, M.-Z.A.; Fan, C.-T.; Liao, C.-N. Application of German energy transition in Taiwan: A critical review of unique electricity liberalisation as a core strategy to achieve renewable energy growth. Energy Policy 2018, 120, 644–654. [Google Scholar] [CrossRef]
- Hildingsson, R.; Johansson, B. Governing low-carbon energy transitions in sustainable ways: Potential synergies and conflicts between climate and environmental policy objectives. Energy Policy 2016, 88, 245–252. [Google Scholar] [CrossRef]
- Emodi, N.V.; Chaiechi, T.; Rabiul, A.B.M.; Beg, A. A techno-economic and environmental assessment of long-term energy policies and climate variability impact on the energy system. Energy Policy 2019, 128, 329–346. [Google Scholar] [CrossRef]
- De Blas, I.; Miguel, L.J.; Capellán-Pérez, I. Modelling of sectoral energy demand through energy intensities in MEDEAS integrated assessment model. Energy Strategy Rev. 2019, 26, 100419. [Google Scholar] [CrossRef]
- Nieto, J.; Carpintero, Ó.; Miguel, L.J.; De Blas, I. Macroeconomic modelling under energy constraints: Global low carbon transition scenarios. Energy Policy 2020, 137, 111090. [Google Scholar] [CrossRef]
- Sterman, J.D. Business dynamics. In Systems Thinking and Modeling for a Complex World; McGraw-Hill Higher Education: New York, NY, USA, 2000. [Google Scholar]
- Mondal, M.A.H.; Bryan, E.; Ringler, C.; Mekonnen, D. Ethiopian energy status and demand scenarios: Prospects to improve energy efficiency and mitigate GHG emissions. Energy 2018, 149, 161–172. [Google Scholar] [CrossRef]
- Meadows, D.H.; Meadows, D.L.; Randers, J.; Behrens, W.W. The Limits to Growth; Universe Books: New York, NY, USA, 1972. [Google Scholar]
- Ford, A. Modeling the Environment, 2nd ed.; Island Press: Washington, DC, USA, 2010. [Google Scholar]
- Sterman, J.; Fiddaman, T.; Franck, T.R.; Jones, A.; McCauley, S.; Rice, P.; Sawin, E.; Siegel, L. Climate interactive: The C-ROADS climate policy model. Syst. Dyn. Rev. 2012, 28, 295–305. [Google Scholar] [CrossRef]
- Coordinating Ministry of Strategic Sectors. National Energy Balance 2013; Coordinating Ministry of Staging Sectors: Quito, Ecuador, 2013.
- Coordinating Ministry of Staging Sectors. National Energy Balance 2014; Coordinating Ministry of Staging Sectors: Quito, Ecuador, 2014.
- Coordinating Ministry of Strategic Sectors. National Energy Balance 2015; Coordinating Ministry of Staging Sectors: Quito, Ecuador, 2015.
- Ministry of Energy and Non-Renewable Natural Resources. National Energy Balance 2017; Ministry of Energy and Non-Renewable Natural Resources: Quito, Ecuador, 2018. [Google Scholar]
- Capellán-Pérez, I.; Mediavilla, M.; De Castro, C.; Carpintero, Ó.; Miguel, L.J. Fossil fuel depletion and socio-economic scenarios: An integrated approach. Energy 2014, 77, 641–666. [Google Scholar] [CrossRef]
- CONELEC. Electrification master plan 2013–2022; CONELEC: Quito, Ecuador, 2013. [Google Scholar]
- Calderón, Á.; Dini, M.; Stumpo, G. Los Desafíos del Ecuador Para el Cambio Estructural con Inclusión Social; Naciones Unidas: Santiago, Chile, 2016. [Google Scholar]
- Everett, T.; Ishwaran, M.; Ansaloni, G.P.; Rubin, A. Economic Growth and the Environment; Department for Environment, Food and Rural Affairs: London, UK, 2010.
- Kunchornrat, J.; Phdungsilp, A. Multi-Level Governance of Low-Carbon Energy Systems in Thailand. Energies 2012, 5, 531–544. [Google Scholar] [CrossRef]
- Limaye, D.R.; Heffner, G.C.; Sarkar, A. An Analytical Compendium of Institutional Frameworks for Energy Efficiency Implementation; The World Bank Group: Washington, DC, USA, 2008. [Google Scholar]
- Munir, Q.; Lean, H.H.; Smyth, R. CO2 emissions, energy consumption and economic growth in the ASEAN-5 countries: A cross-sectional dependence approach. Energy Econ. 2020, 85, 104571. [Google Scholar] [CrossRef]
- Acheampong, A.O. Economic growth, CO2 emissions and energy consumption: What causes what and where? Energy Econ. 2018, 74, 677–692. [Google Scholar] [CrossRef]
- Xue, B.; Geng, Y.; Muller, K.; Lu, C.; Ren, W. Understanding the Causality between Carbon Dioxide Emission, Fossil Energy Consumption and Economic Growth in Developed Countries: An Empirical Study. Sustainability 2012, 6, 1037–1045. [Google Scholar] [CrossRef]
- Nain, M.Z.; Ahmad, W.; Kamaiah, B. Economic growth, energy consumption and CO2 emissions in India: A disaggregated causal analysis. Int. J. Sustain. Energy 2015, 36, 807–824. [Google Scholar] [CrossRef]
- Hossain, M.S. Panel estimation for CO2 emissions, energy consumption, economic growth, trade openness and urbanization of newly industrialized countries. Energy Policy 2011, 39, 6991–6999. [Google Scholar] [CrossRef]
- Piłatowska, M.a.G.A.; Włodarczyk, A. The Effect of Renewable and Nuclear Energy Consumption on Decoupling Economic Growth from CO2 Emissions in Spain. Energies 2020, 13, 2124. [Google Scholar] [CrossRef]
- Kosow, H. Methods of Future and Scenario Analysis: Overview, Assessment, and Selection Criteria; German Development Institute (DIE): Bonn, Germany, 2008. [Google Scholar]
- Ahmed, M.M.; Shimada, K. The Effect of Renewable Energy Consumption on Sustainable Economic Development: Evidence from Emerging and Developing Economies. Energies 2019, 12, 2954. [Google Scholar] [CrossRef]
- Mardani, A.; Streimikiene, D.; Nilashi, M.; Aranda, D.A.; Loganathan, N.; Jusoh, A. Energy consumption, economic growth, and CO2 emissions in G20 countries: Application of adaptive neuro-fuzzy inference system. Energies 2018, 11, 2721. [Google Scholar] [CrossRef]
- Mardani, A.; Streimikiene, D.; Cavallaro, F.; Loganathan, N.; Khoshnoudi, M. Carbon dioxide (CO2) emissions and economic growth: A systematic review of two decades of research from 1995 to 2017. Sci. Total. Environ. 2019, 649, 31–49. [Google Scholar] [CrossRef]


| Variables | Simulated Scenarios to 2030 | |||
|---|---|---|---|---|
| 2016 | BAU | NP | GPAT | |
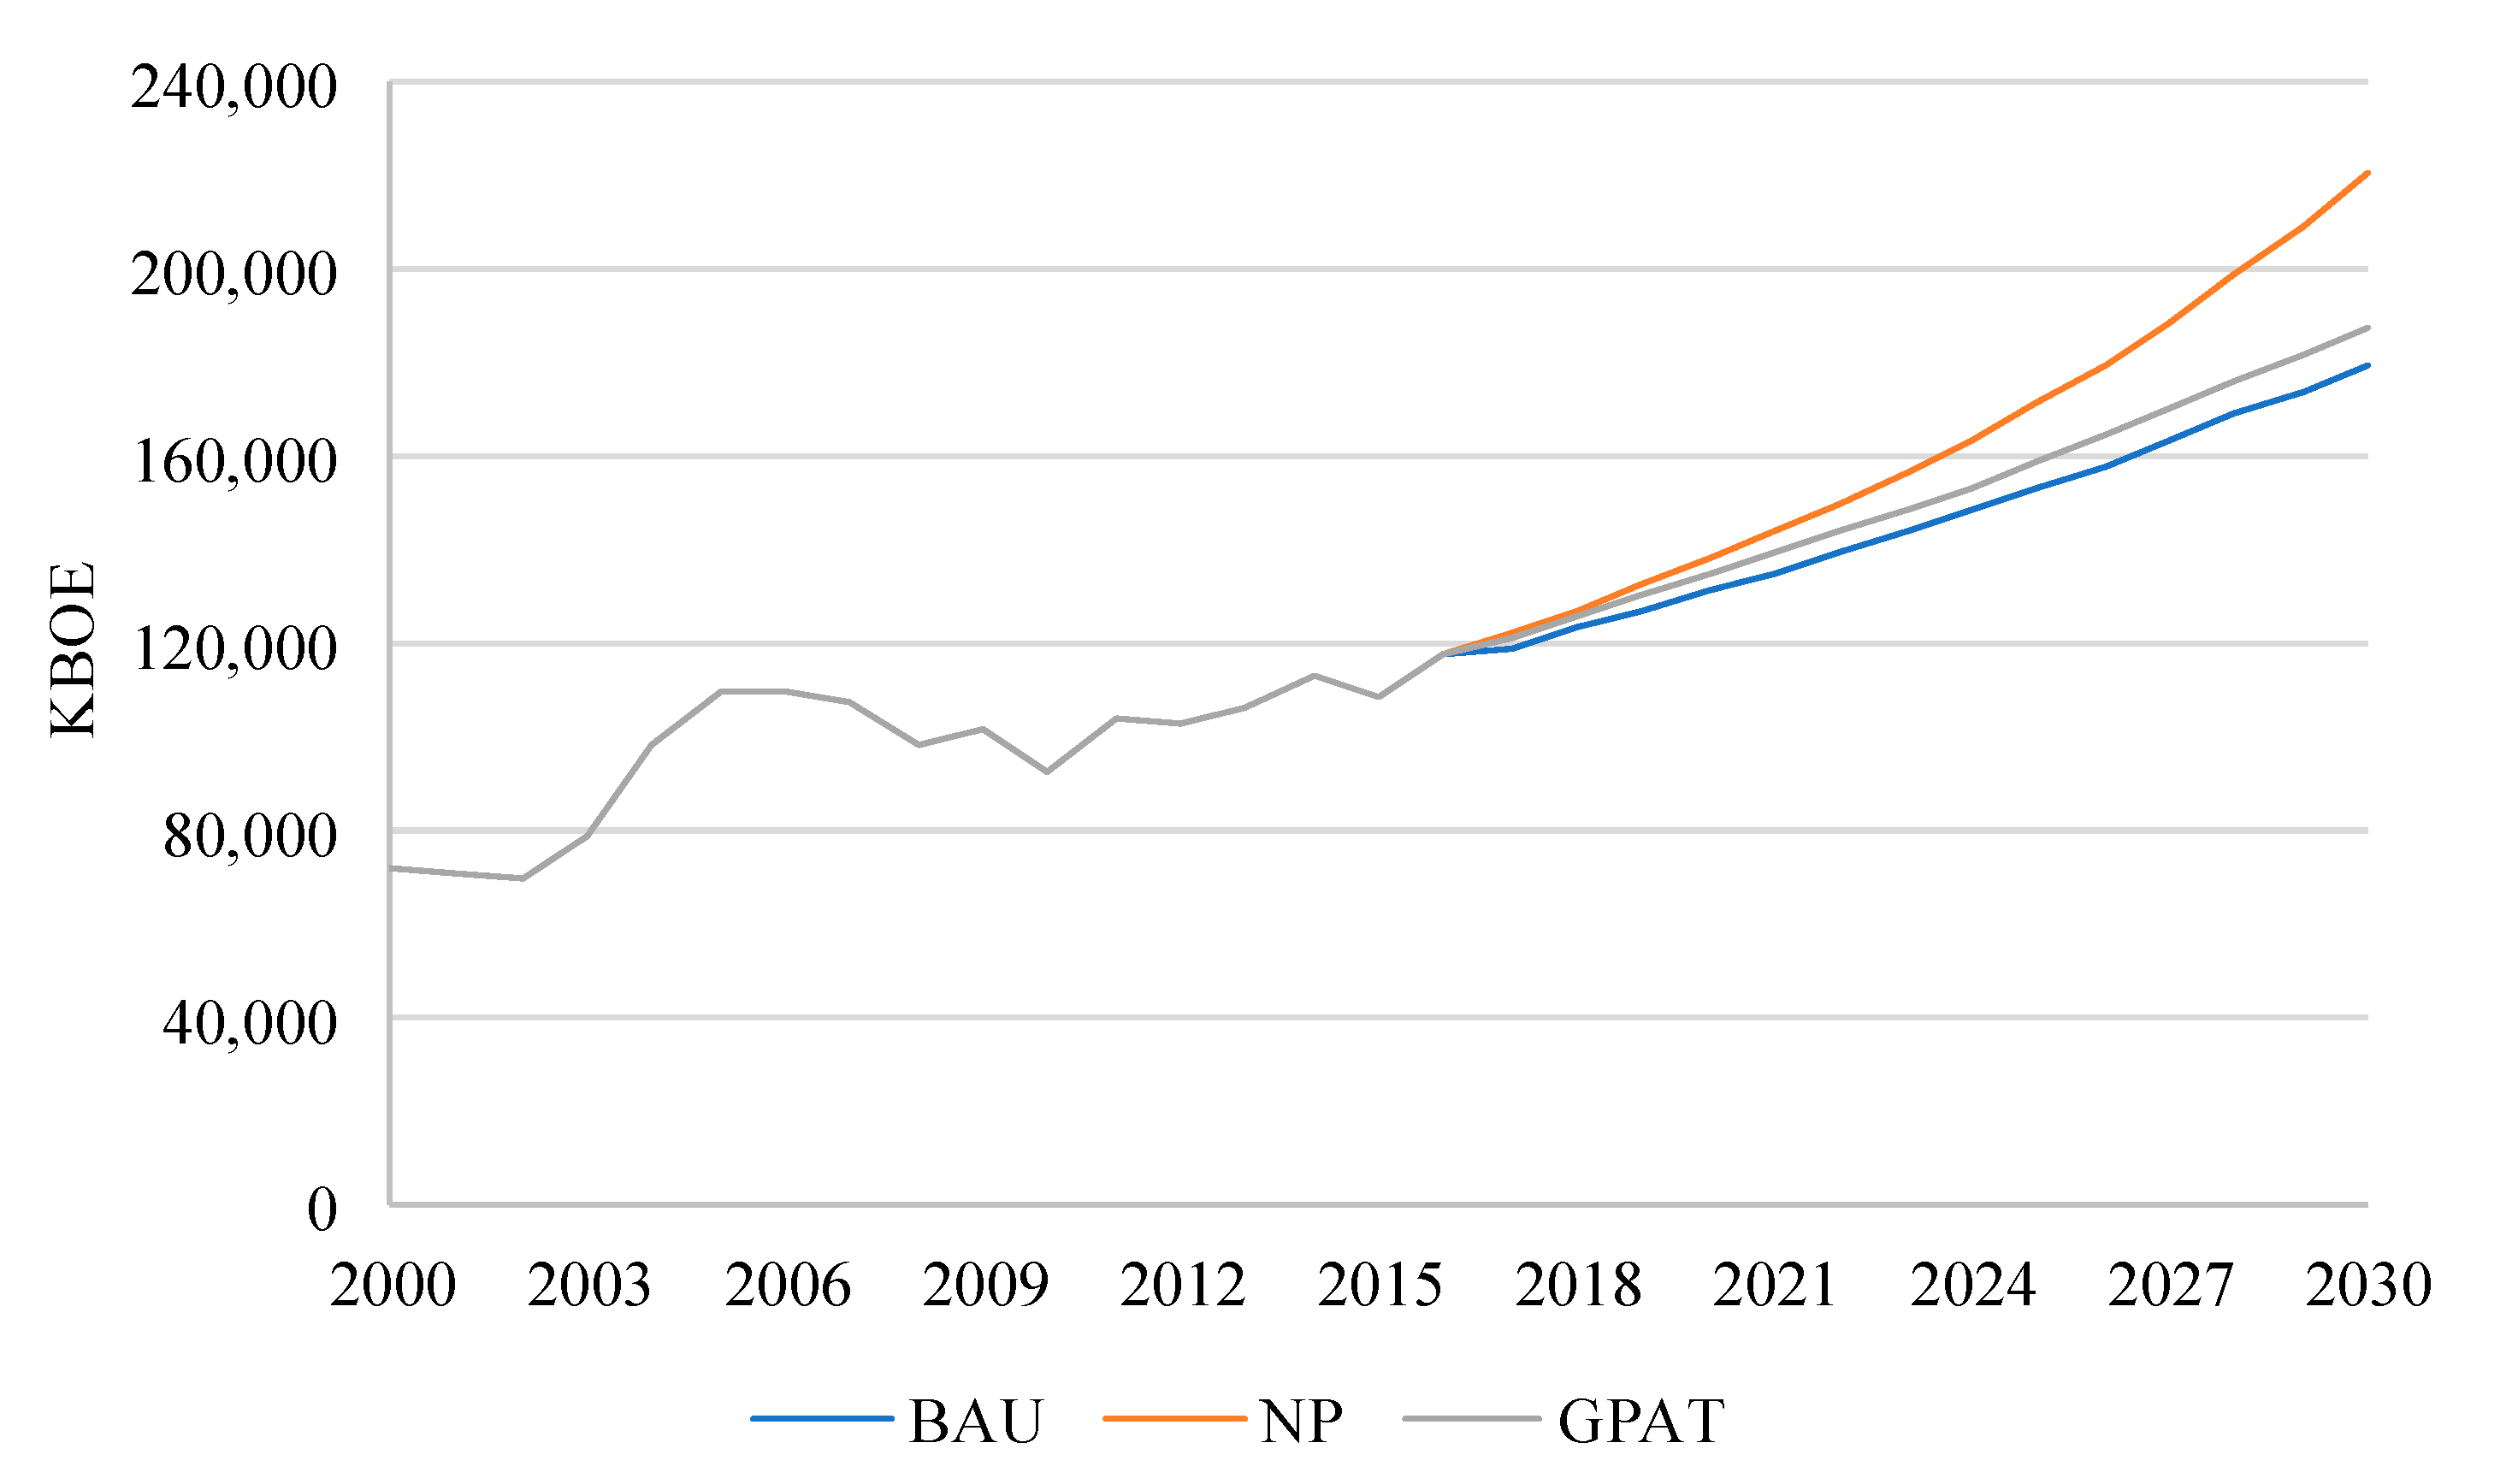
| Primary energy production (KBOE) | 117,987.00 | 151,219.00 | 225,901.00 | 195,145.00 |
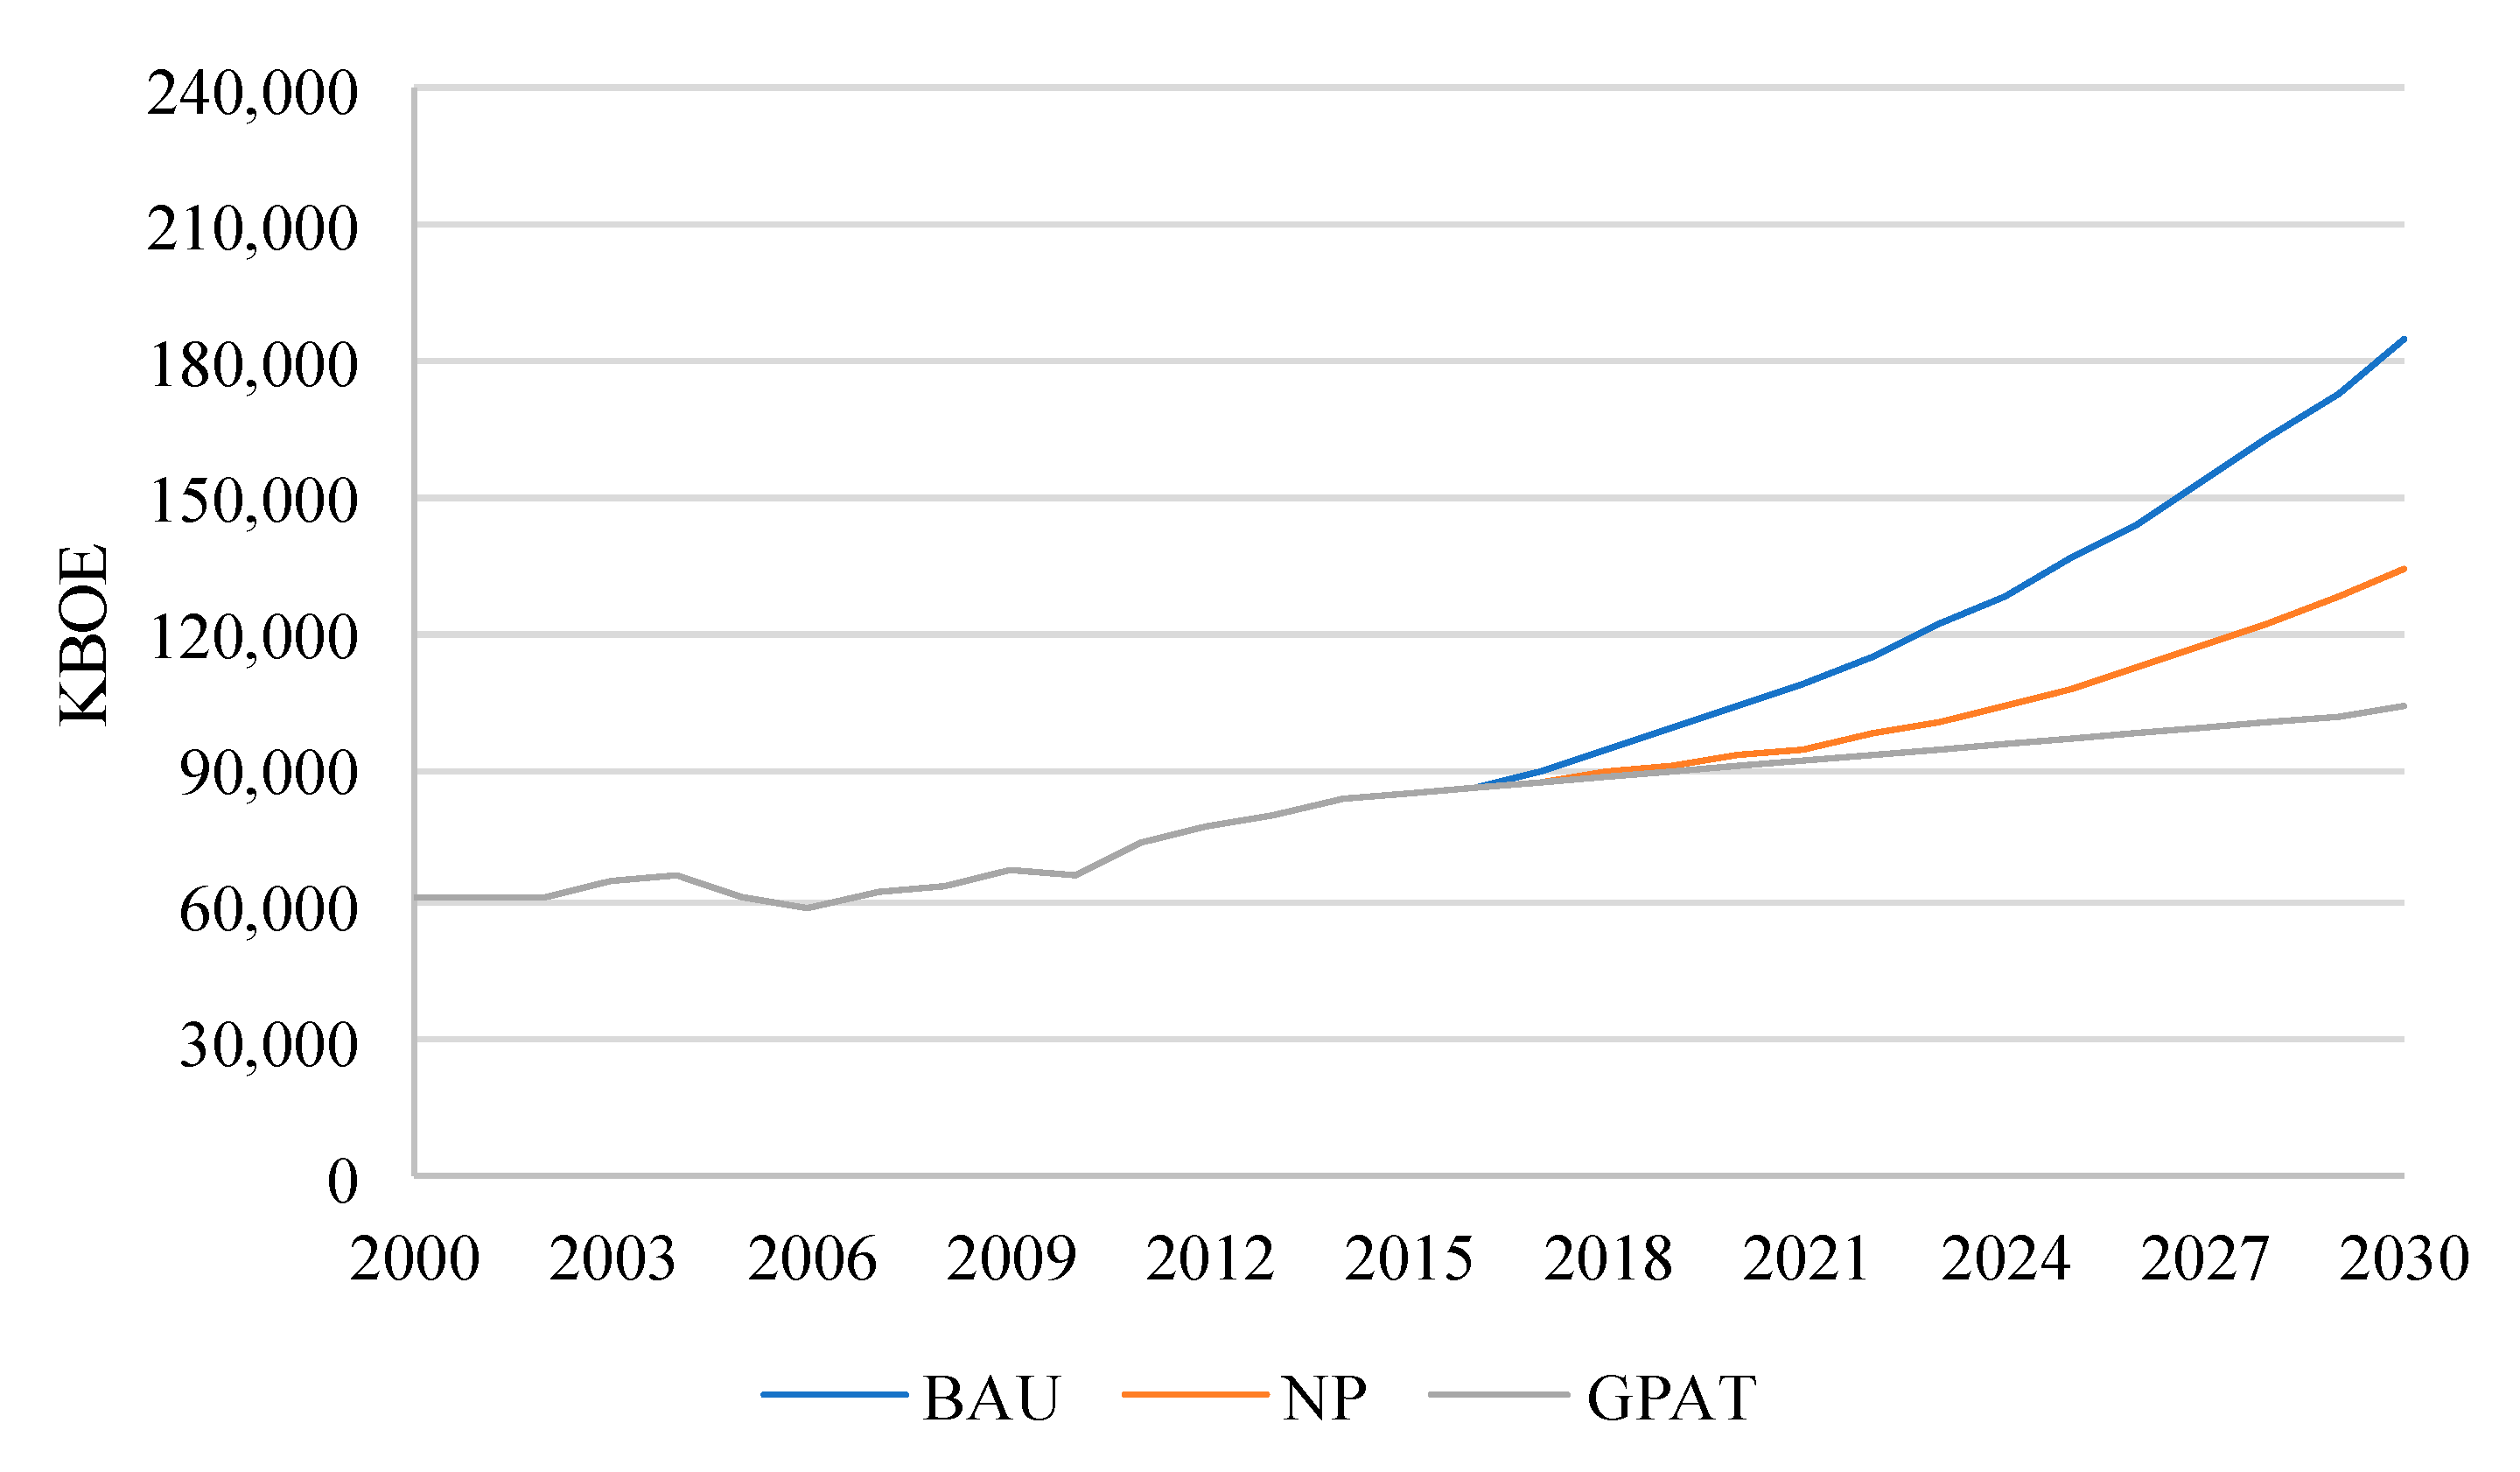
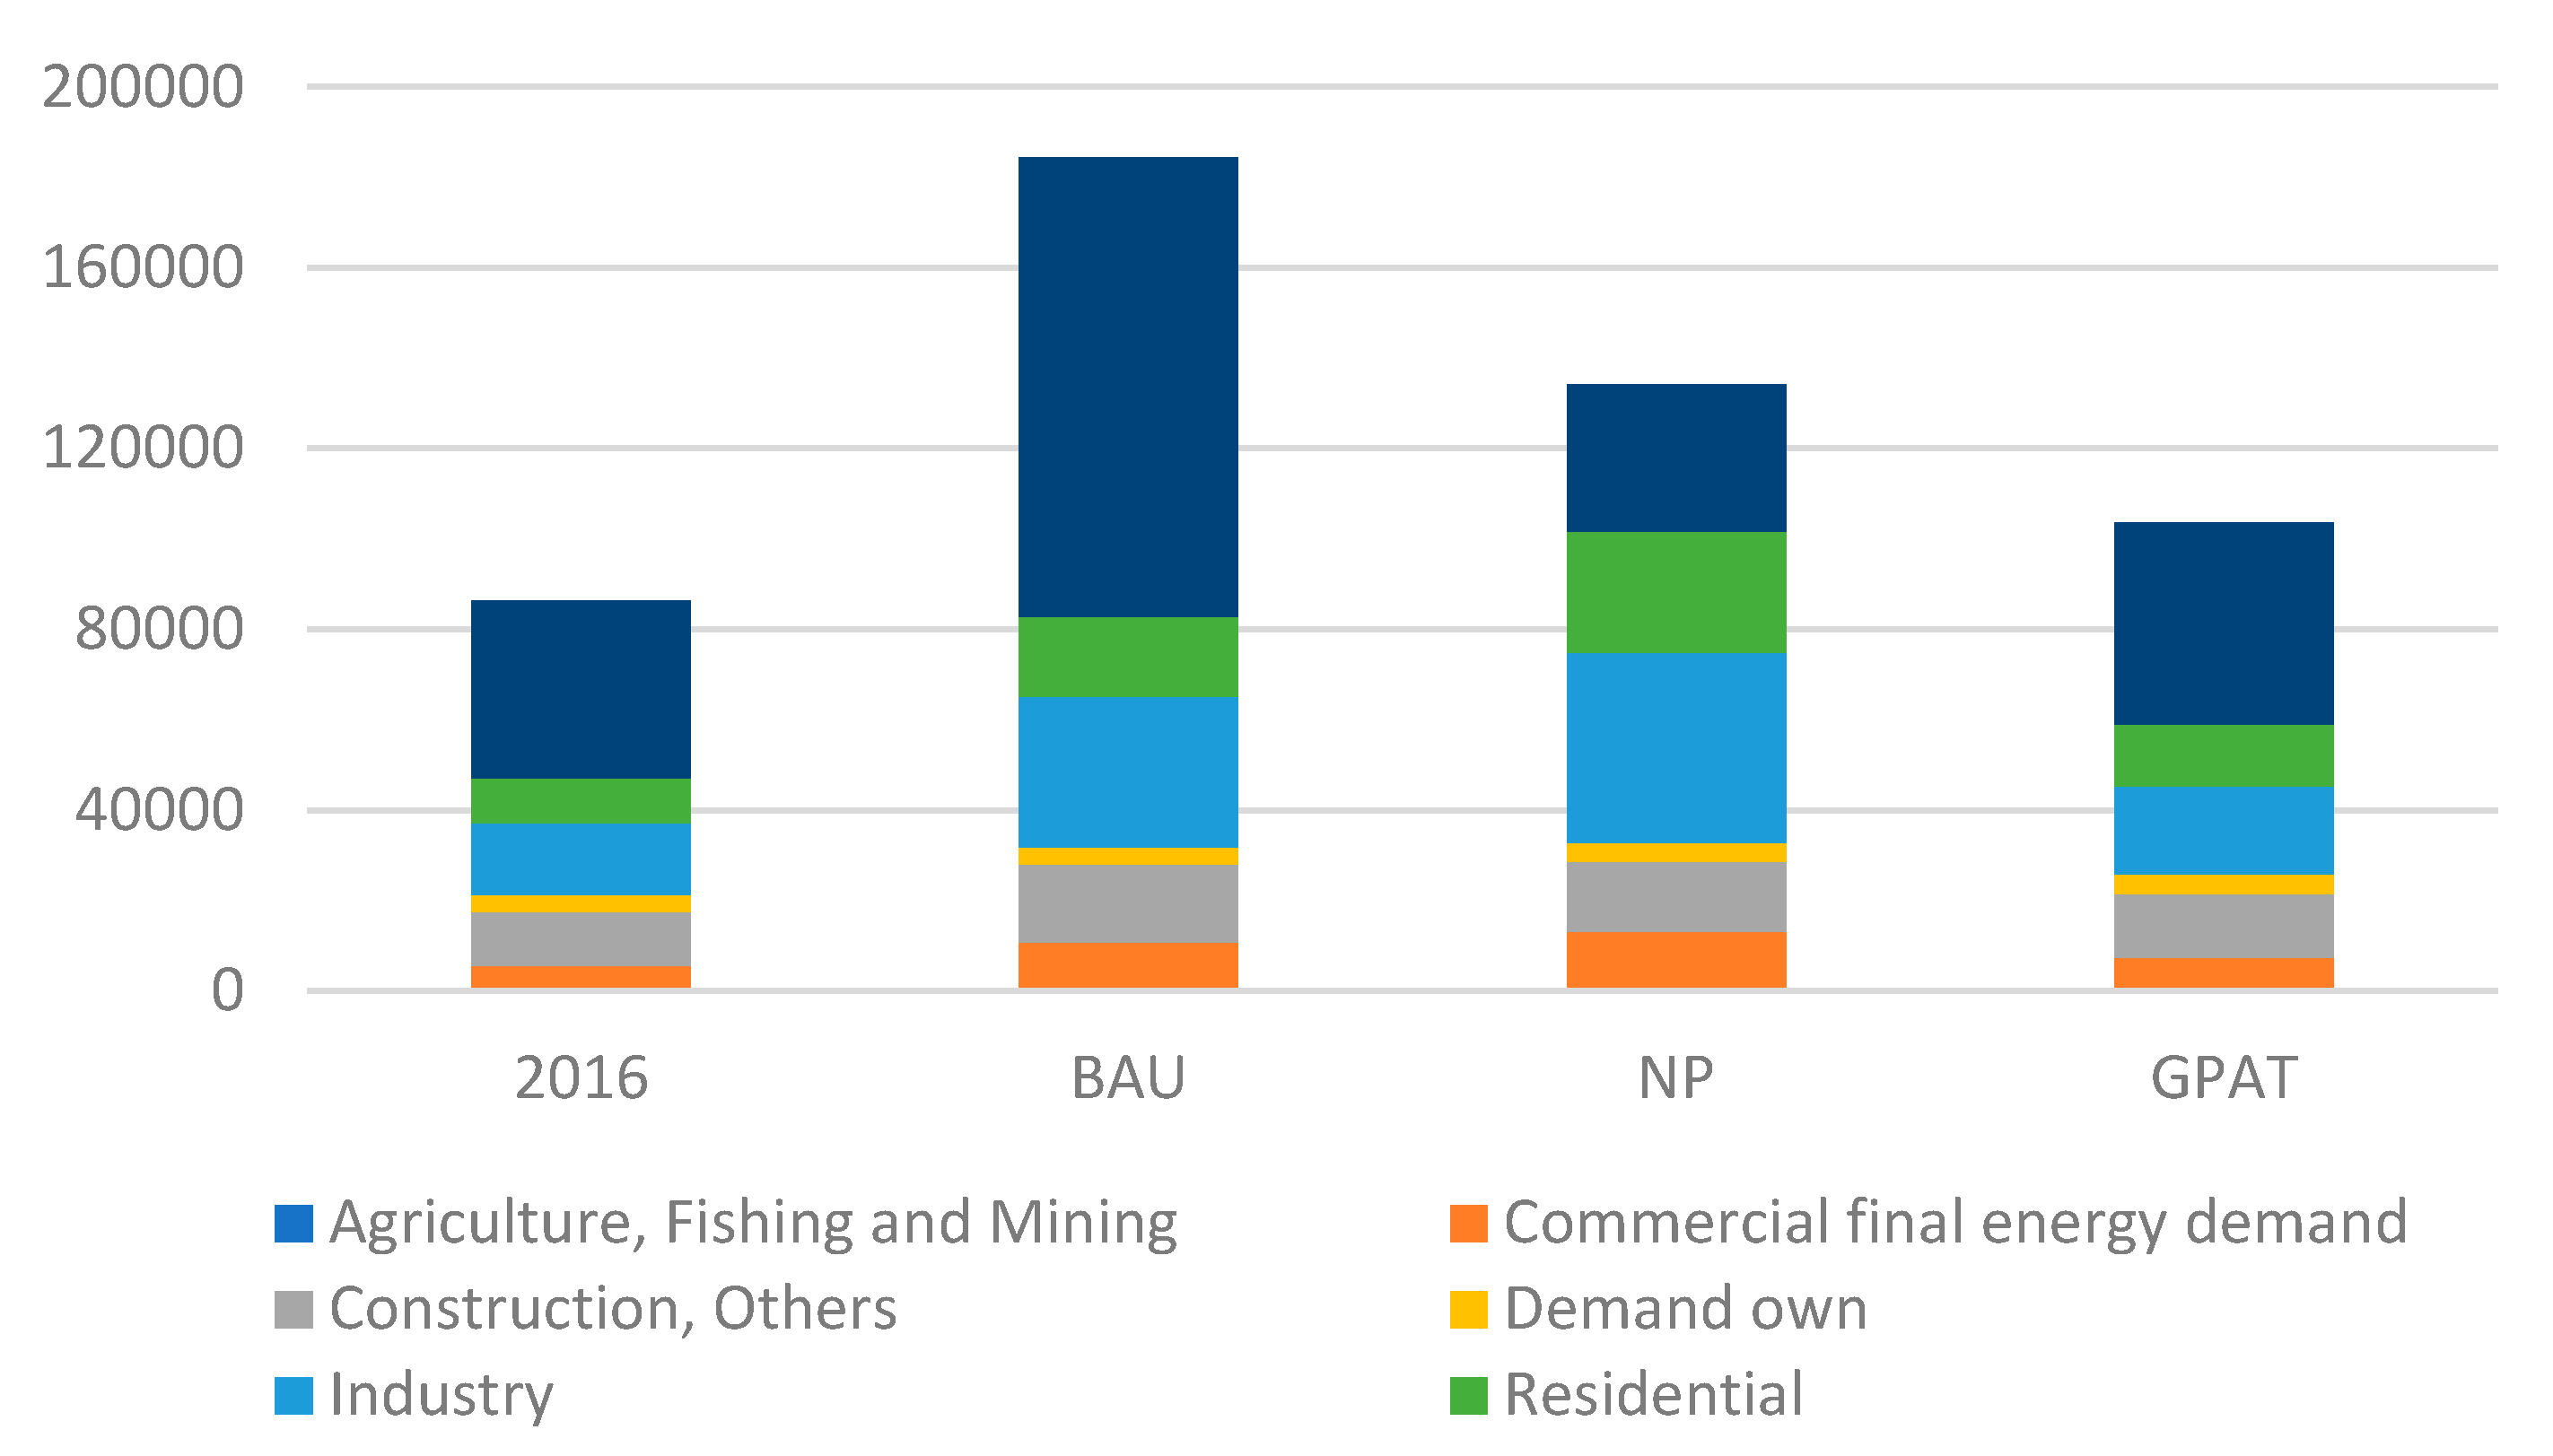
| Final energy demand (KOB) | 86,400.80 | 184,345.00 | 134,193.00 | 103,521.00 |
| PIB per capita (USD 2007 per habitant) | 4355.61 | 6223.09 | 6648.99 | 6283.12 |
| CO2 emissions (KT CO2) | 36,073.50 | 75,182.60 | 43,938.30 | 42,191.40 |
| Carbon emissions per capita (TCO2) | 2.20 | 3.89 | 2.33 | 2.46 |
| Carbon emissions/GDP (kgCO2/USD 2007) | 0.51 | 0.63 | 0.35 | 0.39 |
| Energy intensity (BEP thousands USD 2007) | 1.21 | 1.51 | 1.07 | 0.96 |
© 2020 by the authors. Licensee MDPI, Basel, Switzerland. This article is an open access article distributed under the terms and conditions of the Creative Commons Attribution (CC BY) license (http://creativecommons.org/licenses/by/4.0/).
Share and Cite
Arroyo M., F.R.; Miguel, L.J. Low-Carbon Energy Governance: Scenarios to Accelerate the Change in the Energy Matrix in Ecuador. Energies 2020, 13, 4731. https://doi.org/10.3390/en13184731
Arroyo M. FR, Miguel LJ. Low-Carbon Energy Governance: Scenarios to Accelerate the Change in the Energy Matrix in Ecuador. Energies. 2020; 13(18):4731. https://doi.org/10.3390/en13184731
Chicago/Turabian StyleArroyo M., Flavio R., and Luis J. Miguel. 2020. "Low-Carbon Energy Governance: Scenarios to Accelerate the Change in the Energy Matrix in Ecuador" Energies 13, no. 18: 4731. https://doi.org/10.3390/en13184731
APA StyleArroyo M., F. R., & Miguel, L. J. (2020). Low-Carbon Energy Governance: Scenarios to Accelerate the Change in the Energy Matrix in Ecuador. Energies, 13(18), 4731. https://doi.org/10.3390/en13184731