Article

Systemic Evaluation of the Effects of Regional Self-Supply Targets on the German Electricity System Using Consistent Scenarios and System Optimization

by
Charlotte Senkpiel
1,* and
Wolfgang Hauser
2
1
Fraunhofer Institute of Solar Energy Systems, 79110 Freiburg, Germany
2
ZIRIUS—Center for Interdisciplinary Risk and Innovation Studies, University of Stuttgart, 70174 Stuttgart, Germany
*
Author to whom correspondence should be addressed.
Energies 2020, 13(18), 4695; https://doi.org/10.3390/en13184695
Submission received: 15 July 2020 / Revised: 19 August 2020 / Accepted: 20 August 2020 / Published: 9 September 2020

Abstract

:
This paper analyses the effects of regional renewable electricity self-sufficiency targets on the power system in Germany. For this purpose, an interdisciplinary approach from social sciences and energy system modelling was chosen, which allows considering qualitative factors such as public acceptance or political stability. Following the concept of context scenarios, consistent raw scenarios are generated by a cross-impact balance analysis (CIB), and the scenarios are quantified by the unit commitment and expansion cost minimisation model ENTIGRIS considering power plants, storages, and the electricity grid. This approach enables an understanding of the system framework conditions and their relationships and allows the combination of qualitative and quantitative scenario descriptors. The most important factors for setting regional self-sufficiency targets were identified through interviews. The main system effects identified are: The regional distribution of generation capacities is strongly influenced by a more demand-oriented installation of generation capacities. This leads to less grid reinforcement, but higher rates of curtailment. In all scenarios, higher utilization of the PV roof potential instead of ground mounted could be observed. The total system costs are increasing only slightly with regional self-supply targets. In general, it was found that the influence of regional self-sufficiency targets is less pronounced in scenarios that already achieve high national RES shares than in scenarios that achieve lower shares, since technology, storage and grid expansion measures are necessary anyway to achieve high RES shares. Overall, the effects here are rather small and the regional objective is not associated with major disadvantages for the system. In a future characterised by stagnation, the system can benefit from regional targeting, as higher renewable shares and lower costs can result. The main conclusion therefore is that regional target setting seem to be beneficial for the overall power system, in terms of system cost, national RE share, acceptance and CO2-emissions.

1. Introduction

Almost 190 countries have signed the Paris Agreement, which aims to keep the global temperature rise well below 2 °C and limit it to 1.5 °C [1]. The European Green Deal sets the goal for Europe of becoming climate neutral by 2050 [2]. The German government has declared an intention to achieve an 80–95% renewable energy share in net electricity generation by 2050. In addition to the national targets, targets are also set at the local level (regional self-supply targets), e.g., by municipalities or cities that want to achieve 100% RE supply. This development can be observed globally. The ICLEI (local governments for sustainability) network, for example, connects local governments or regions to support regional activities, e.g., in the form of an action plan to achieve 100% renewable cities or regions [3]. Setting 100% renewable energy targets can lead to a paradigm shift in national energy policies, as previously analysed by [4]. In Germany for example these targets are communicated using local climate action plans and financed primarily by the “Nationale Klimaschutzinitiative”, a funding program initiated in 2008 by the Federal Ministry for the Environment, Nature Conversation, Building and Nuclear Safety [5]. In Germany 72 regions on rural districts level have set targets aiming to reach 100% renewable energy by 2050 [5]. Local climate action plans are supposed to help exploit the local potential of renewable energies, as opposed to the centrally regulated auction mechanisms, which aim to exploit the potential at the most economic sites. Numerous studies (e.g., [6,7,8,9,10,11]) analyse how 100% renewable targets can be achieved for specific regions in different countries. On the other hand, the quantification of effects (e.g., on system costs, optimal technology distribution, storage, and grid expansion) on the overall national electricity system, resulting from regional self-supply targets being set, have hardly been presented in the literature so far. To gain a deeper understanding of the effects of regional self-supply targets on the national electricity system, this paper develops different plausible scenarios, combining qualitative factors such as the acceptance and quantitative factors like prices for renewable energy technologies and quantifies the effects on the national system by using a numeric optimisation model (ENTIGRIS) for the power system for the example of Germany. The following research questions are addressed in the paper:
What are plausible scenarios that contain the enabling factors of regional self-supply factors?
What are the effects of the local self-supply targets on the national energy system?
To answer the research questions first interviews were conducted, to identify factors (e.g., public acceptance, fuel prices, etc.) that influence a regional renewable energy target setting. In a second step, a prioritisation of the factors was made in a workshop. Then a cross-impact balance analysis [12] has been performed to identify different consistent scenarios, including different shares of regional self-supply. To quantify the effects of decentralised renewable targets on the national electricity system, the scenarios were finally optimised using the ENTIGRIS model. For each scenario variants with and without regional self-sufficiency, targets were calculated to enable a quantification of the effect on the national power system concerning generation technologies, storage and grid expansion and operation (e.g., CO2-emissions and curtailment), as well as their regional distribution and the total system cost.

2. Literature Review

The literature review is divided into three parts. First, the state of the literature on the concept of autarky or self-sufficiency is addressed to classify how the terms are understood in literature and how this concept is to be classified from a social science perspective. The second part illustrates the state of the art of scenario design for energy system modelling, with a focus on the integration of social science in numerical modelling. The third part gives a literature review on the numerical analysis of the decentralisation of renewable energies in the energy system.

2.1. Energy Autarky and Autonomy

Autarky and autonomy have become prominent terms in the debate about (regional) energetic self-supply. While often used interchangeably, these terms focus on different aspects of independence. The meaning of the individual terms is rooted in philosophy and their use can be traced back to the time of the Greek polis. Autonomy stresses the freedom to act in accordance with one’s own intention, autarky focuses on independence from external resources [13]. Following this understanding, we will use the terms autarky, self-sufficiency, and self-supply synonymously and refrain from using the term autonomy in this context. Energy self-sufficiency can be understood in terms of time (at any time) or on the balance sheet, a distinction that is easy to show when considering electricity: On a balance sheet basis, a community is self-sufficient when it can generate the amount of electricity necessary to meet demand over a defined period (for example a year). To be considered power efficient, a community would need to be able to meet the electricity demand at all times [14]. Therefore, reaching power self-supply is a more challenging goal. Consequently, most projects promoting or discussing energy-autarky are limited to self-supply of electricity on a balance sheet basis (see [13,15]). If autarky is so difficult to achieve and to measure, why has the term gained such prominence in the debate about future energy systems? Reference [16] demonstrate empirically, that, from a psychological point of view, the concept of autarky, has a positive effect on the public acceptance of centralized and decentralized energy systems. The authors show that households are willing to pay more if the balance sheet limit of the self-sufficient energy supply is drawn at their house boundaries than if it includes the neighbourhood or even a small town. Reference [17] report results of quantitative interviews showing that many energy stakeholders on the community level have different understandings of the meaning of the term autarky, but agree that the term evokes positive connotations in the public and can be used as a fresh and successful marketing instrument for renewables. Reference [15] conducted a quantitative survey with representatives of 109 municipalities and report that the most important drivers for a positive attitude towards energy self-sufficiency are the desire for greater independence from private utility companies, environmental awareness, and the perceived benefit of higher tax revenues. For most of the interviewees energy-autarky was not a discrete goal, but a by-product of a rising share of renewables in the local energy system. An empirical study by [18] on the social acceptance of distributed energy systems found that the perceived opportunities of distributed energy systems are on average greater than the challenges that arise from these systems.

2.2. Scenarios and Energy System Modeling

Energy system modelling is a common and useful way to analyse the effects of regional self-supply targets on the national energy system. However, [19] points to the major shortcoming that the social sciences are greatly underrepresented in energy system modelling, since society plays a major role in the energy transition process. In general, a wide variety of energy system models (ESMs) exists with different characteristics related to different research questions, as [20] illustrated using a model review of 75 energy system models. Within the context of these ESMs, a variety of energy scenarios have already been developed. Traditional model-based energy scenarios focus on the technical and energy-economic aspects of possible pathways and analyze these in great detail. However, they mostly neglect the interplay of these aspects with determinants of the future energy system outside these realms. To sufficiently parameterize the ESM almost any such scenario has to make assumptions about developments outside the immediate energy system (i.e., the future demographics, consumer behavior, political landscape, jurisdiction, and general economic development) therefore, these descriptors are rarely subject to sensitivity analysis even though the influence of these framework assumptions on model results is well known. It is important to stress that neglecting the descriptors does not decouple them from the resulting scenarios, but ignores the uncertainty of these descriptors [12]. A promising approach for including social descriptors and qualitative information in quantitative scenario modeling comes from the field of environmental scenario analysis and is usually referred to as “Story and Simulation (SAS)” [21]. The “basic idea of SAS is first to construct a broad set of qualitative storylines, to translate the driving forces of the storylines into quantitative sets of input parameters for the numerical model, and to use these sets for scenario simulation.” [12]. While SAS has become the state-of-the-art method in creating scenarios about environmental change, it has been criticized for two major drawbacks; criticism also shared by the original developers of SAS. Firstly, the qualitative storyline suffers from limited reproducibility, as it is often developed during expert workshops. Secondly, the conversion of storylines to numerical or formalized model inputs always requires interpretation [12]. These drawbacks can be improved by applying a cross-impact-balance analysis (CIB) [22] to construct the storylines, which ensures traceability and enhances internal consistency [23]. In recent years, CIB analysis has been widely applied predominantly in the field of climate change (e.g., [24,25]), and energy research (e.g., [26,27]). In the field of energy research, the combination of CIB constructed storylines and numeric simulation is referred to as context-scenario [12]. A comprehensive description of the CIB approach follows in Section 3.1.

2.3. Decentralization or Autarky in Energy Modeling

In the following section, the literature on mathematical modelling of decentralization or autarky is presented. The paper by [14] assessed the effects of a high degree of self-supply for a region in Austria, using an energy system model that minimizes total system cost. They found that high targets led to an increase in biomass production and full use of rooftop photovoltaic (PVr), resulting in high costs for the consumers, while local food and feed production declined. The impact on the overall energy system is not addressed in this work. Reference [28] carried out a study in which a comparison between decentral and central structures was done using energy system modeling considering 12 regions in Germany. They concluded that the system cost is only slightly higher in the decentral scenario. Reference [29] analyzed different scenarios considering different degrees of autarky having one extreme scenario, which assumes power autarky. They conclude that power autarky can be achieved in rural regions when only regarding the electricity demand of households and e-mobility. More RE and storage installations are necessary for Southern Germany compared to Northern Germany. If the electricity demand of the industry, trade, and service is additionally considered, autarky in rural areas cannot be achieved. In urban areas, autarky cannot be achieved in all investigated cases. The question of decentral or central energy supply plays a significant role in terms of grid infrastructure planning and is addressed in [30]. The meta-study deals with the topic of decentralization, the regionalization of generation and flexibility capacities as well as the implications on necessary grid expansion for Germany. Different modeled scenarios are compared and the authors point out that the total system cost will be higher if the degree of decentralized self-optimization increases due to higher necessary generation and storage capacities associated with higher area consumption. On a different note, they also point out a positive impact of decentralization on acceptance. Reference [31] analyzed the decentralization dynamics using a system dynamics approach. They found that network effects and pilot projects enhance the decentral transition of the energy system. In contrast to the national perspective [17] analyzed different forms of autarky for Baden-Württemberg and a region within Baden-Württemberg, as a combination of CIB and the TIMES model. The model results show the feasibility of relative self-supply with electricity for Baden-Württemberg by 2050 and estimate the resulting additional costs in comparison to an energy system achieving only EU ETS-goals at roughly 200 € per person per year.
The literature review shows that the topic of renewable energy target setting at a decentralized and centralized level has already been addressed by various disciplines and perspectives. Nonetheless, the effects of regional self-supply targets on the national system, in terms of infrastructure, power plant operations, and costs have yet to be undertaken. This paper can contribute to this research gap by coupling the CIB method and energy system modelling to address the question of how regional self-supply targets influence the national energy system.

3. Methodology

To answer the research questions adequately, an interdisciplinary approach was chosen. Numerical power system models are suitable for depicting the distribution of generation, storage, and grid infrastructures and the total system costs and thereby determining the effects on power plant deployment and expansion, and thus for mapping the systemic effects. To ensure that the underlying conditions are consistent, contain a holistic storyline, and at the same time provide a link to the numerical model, the CIB approach is best suited for scenario design. Therefore, we think that the chosen methodology is well suited, although it is of course conceivable that other methods could be used. To follow this approach, first, scenarios are developed using only consistent combinations of scenario descriptors, which can be qualitative (e.g., acceptance of RE) and quantitative (e.g., electricity demand). This approach is labelled context scenarios [22]. While the storylines are constructed following CIB, the numerical simulation is computed by the power system model ENTIGRIS. The quantitative scenario descriptors can be integrated directly into ENTIGRIS, which optimizes the operation and expansion of electricity generation and storage technologies as well as the high and highest voltage grid under cost-minimizing terms. The analysis of the results from the model enables the quantification of the effects on the national electricity system. The CIB approach as well as the power system model and it’s parametrisation are described in detail in the following sections.

3.1. Developing Consistent Scenarios Using Cross-Impact Analysis (CIB)

As mentioned earlier, the scenarios were constructed following the context scenario approach and applying the cross-impact-balance method ([13,32]). The main steps for such a CIB-analysis are described in [32].
To (a) identify the most important factors influencing the electricity self-supply rate of communities and regions to include in the analysis, a literature study, expert interviews, and a workshop were conducted. While the literature study and the interviews with experts and practitioners were conducted to gather preferably multifarious factors, the workshop was held to rank these influences and select the most important ones. After the literature study and interviews, a list with more than 30 possible descriptors was compiled and sent to project members and interviewees asking for additions. The resulting list was then ranked by individuals from both groups and the ranking was discussed in a separate workshop to consolidate a final list of the 15 most important descriptors.
The (b) construction of different variants for each descriptor was mainly based on a literature review. For each descriptor at least two (mostly 3) variants were defined, describing possible developments in the respective field. The descriptors were reviewed by energy system analysts and practitioners. An overview of all descriptors and their variants is displayed in Table A1.
To evaluate the cross-impacts between the different descriptor-variants, a three-day workshop was conducted with all project members and additional experts, during which the relation of each descriptor-variant to all other descriptor-variants was discussed by a group of about 10 experts. Further insight from practitioners could not be gathered at this workshop due to scheduling conflicts so that practitioners willing to contribute were invited to do so via face-to-face interviews or by telephone. The cross-impacts between the descriptor-variants were rated on a scale from −3 (“strongly hindering”) to +3 (“strongly promoting”), considering how the realization of one descriptor-variant would influence the realization of one variant of another descriptor, if the state of the other descriptors was unknown (see [22]).
(c) Applying the CIB-algorithm to the cross-impact matrix resulted in 17 fully consistent scenarios and 2219 scenarios with an inconsistency value of 1. “The consistency score can be calculated out of the impact balances of a scenario […]. For every descriptor the difference between the impact score of the state selected and the maximum impact score of the other states of the same descriptor is calculated. […] The minimum of all individual descriptor consistency scores is considered as the consistency score for the entire scenario. The inconsistency score of a descriptor and/or scenario respectively assumes this score in reverse. [33].” Since the fully consistent scenarios showed many vacancies regarding the descriptor-variants and the large ratio of scenarios with the inconsistency of 1 vs. scenarios with an inconsistency of 0 (“fully consistent”), it was decided to include the former in the analysis. Generally, such a steep increase hints at a rather mutable system; here it also originates from the very subtle feedback from national descriptors on the global descriptors fuel-prices, CAPEX of generation technology storage. To provide a general overview of the scenarios, they were subjected to a multiple correspondence analysis (MCA), a statistical method for representing latent structures in datasets in low-dimensional spaces (see e.g., [27,34]). The final selection of scenarios to be calculated had to fulfill the following criteria: (a) be scattered all over the MCA-plot, especially covering the first principal axis, since most of the variance is captured here (Figure 1 shows that the selection omits extremely high and extremely low values of this dimension; this is because these scenarios show no variation in the RE deployment of the different type of regions), (b) cover as many descriptor-variants as possible (especially important for coupling descriptors), (c) include pairs of scenarios with similar global context and national RE shares enabling the analysis of (de-)centralization effects, (d) consist of a concise number of scenarios, (e) consist of preferably fully consistent scenarios.
To be transparent, it would have been preferred if the final selection had been achieved by applying a clustering algorithm, but the solutions achieved with this approach performed rather bad on criteria 2 and 3, while, naturally, scoring very good on criteria 1 and 4. Thus, the final selection could not be automated and was arrived at through iterative discussion of different scenario sets formed by clustering results and variations of these results. During this process, one or more scenarios were replaced with hand-picked scenarios to better fulfil criteria 2–3. The selected scenarios and their positioning on the MCA-plot are shown in Figure 1.

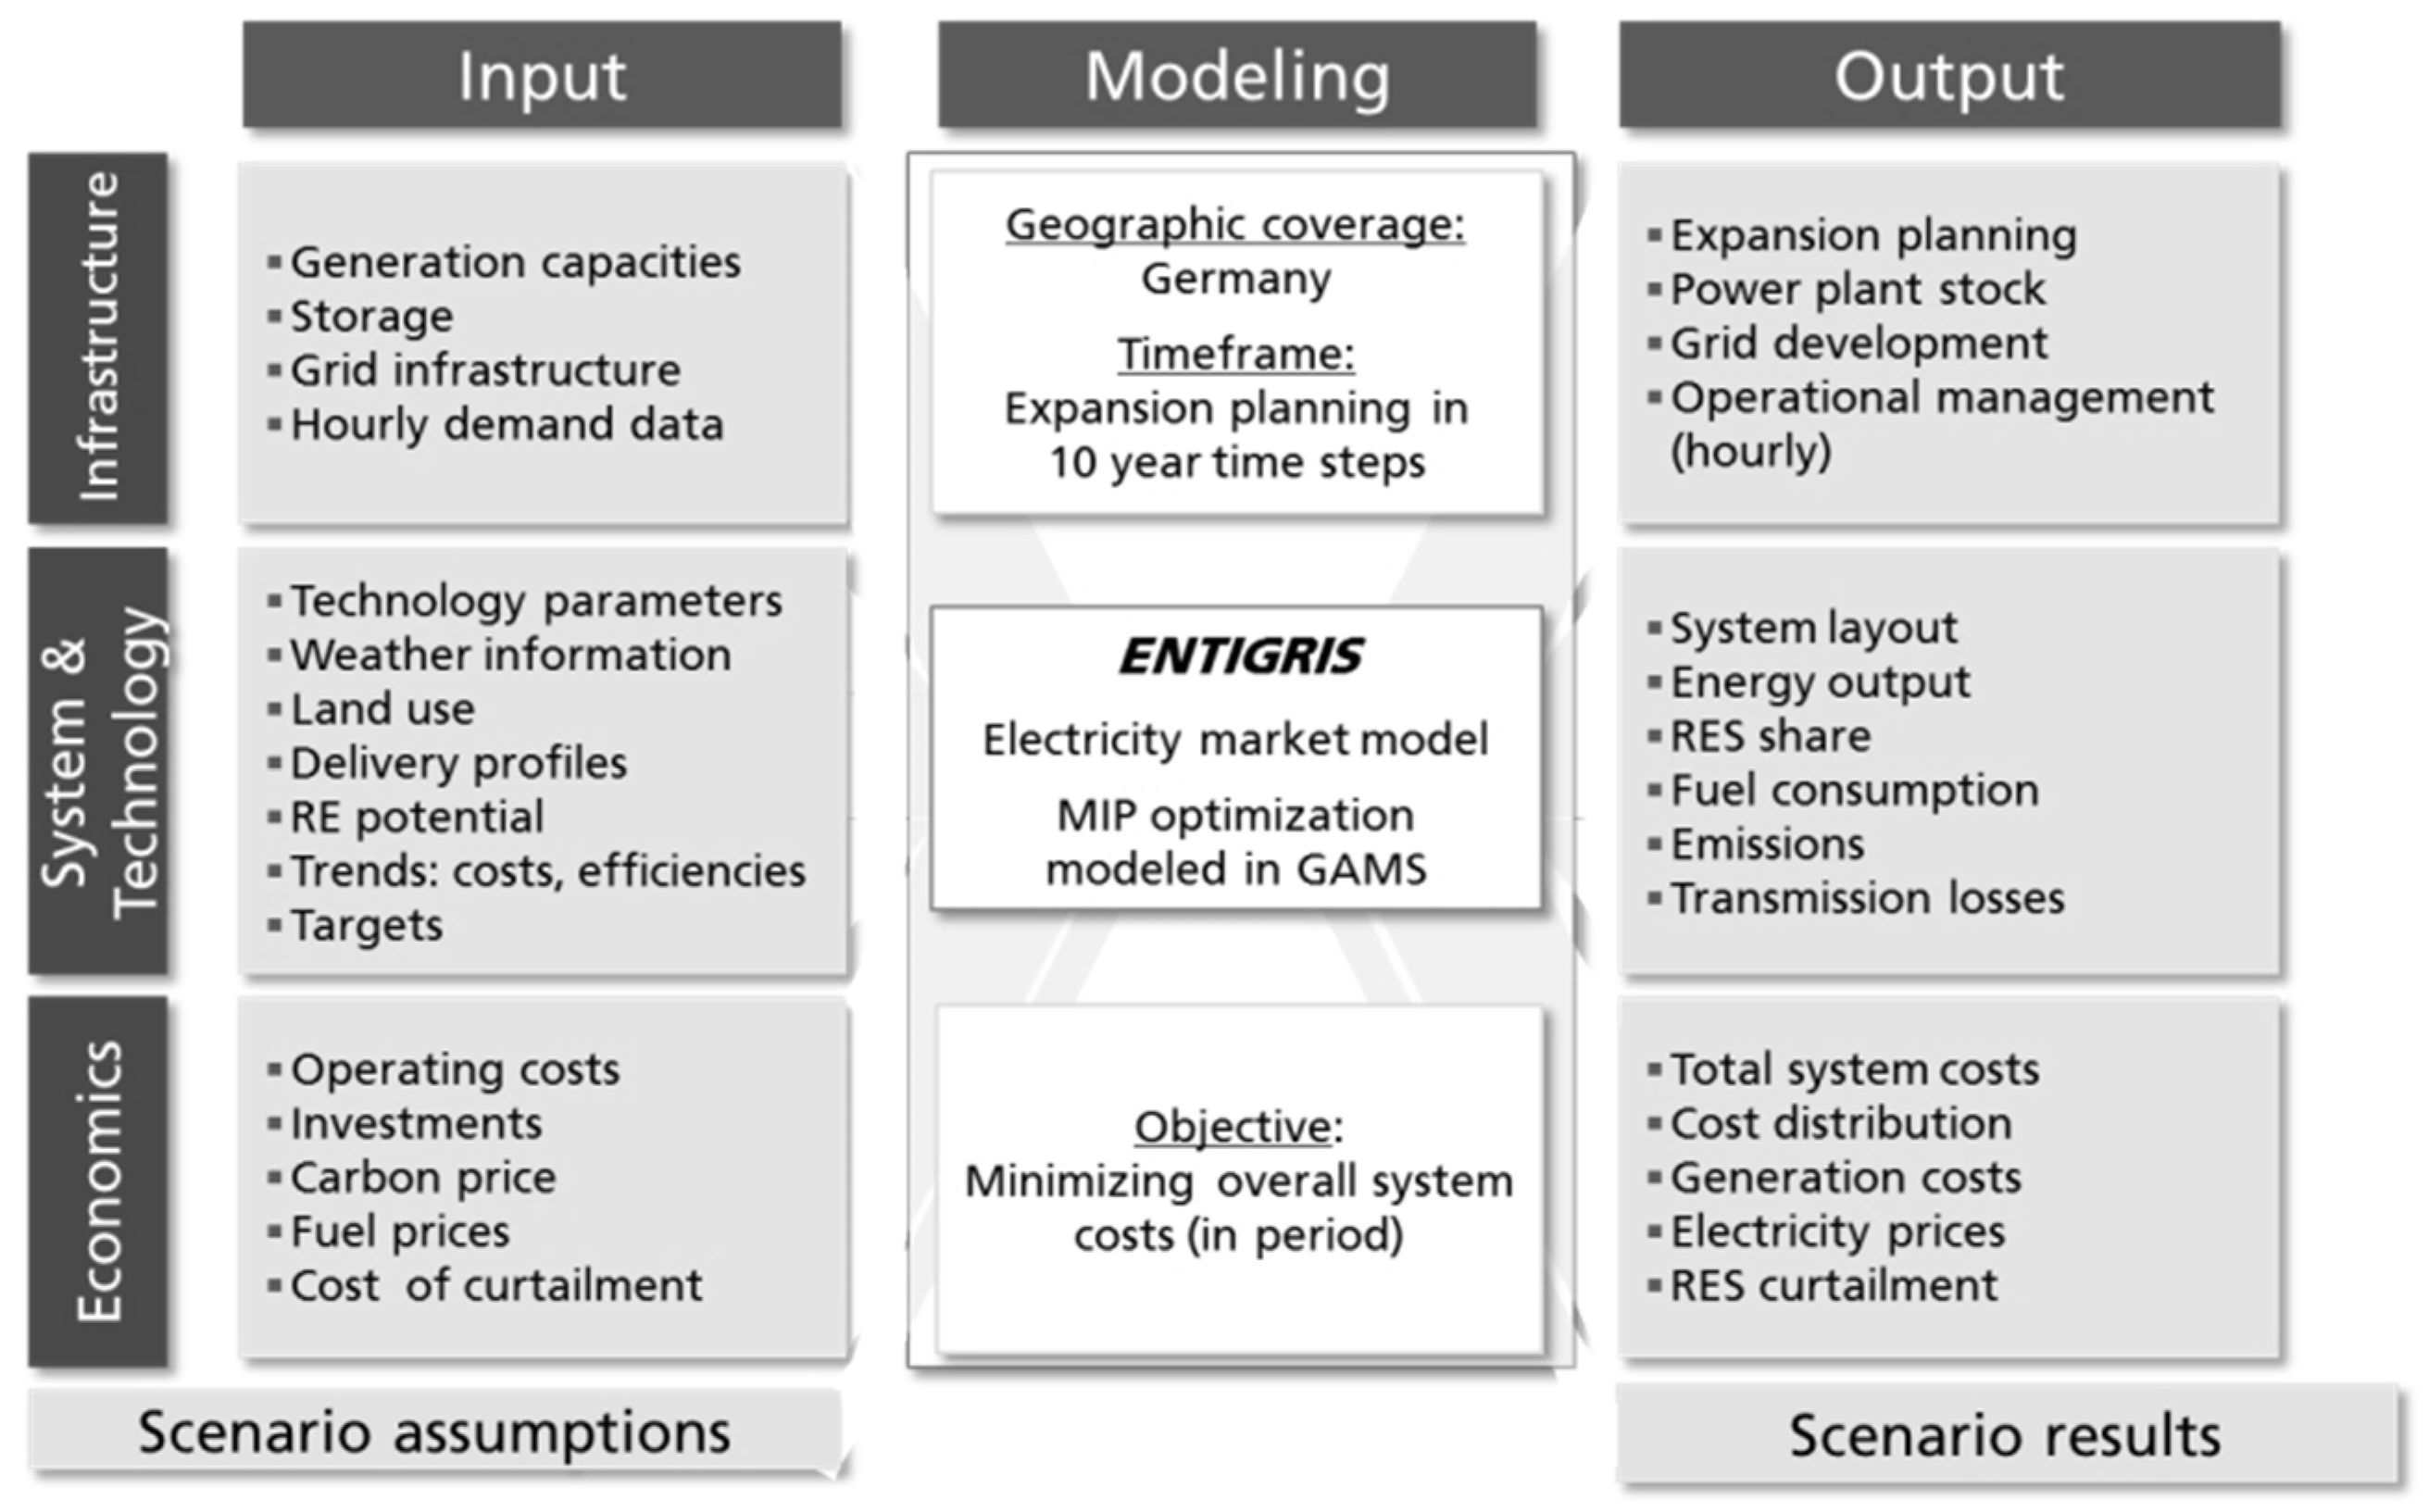
3.2. Power System Model ENTIGIS

The ENTIGRIS model aims to minimize the total system cost of the operation and expansion planning of the electricity system, taking into account the generation and storage technologies as well as the high and highest voltage grid ([35,36,37]). The main model structure is displayed in Figure 2.
The optimization problem:
min c . t = y t e c n e w c . a t e c , y + t t e c c . v a r t e c , t + y t e c c . f i x t e c , y + t t e c c . f u e l t e c , t + t t e c c . C O 2 t e c , t + t t e c c . l c t e c , t + t c o r c . t m c o r , t
The total cost (c.t) is minimized. These are the sum of the overall annuity cost (c.a) per new installed technology capacities (tecnew), which are renewable and conventional generation technologies, storage systems and the high and highest voltage grid per year (y), the sum of the variable cost (c.var) per technology and hour (t), the sum of the fix cost (c.fix) per technology and year, the sum of the hourly fuel cost (c.fuel) and CO2-emission cost (c.CO2) per technology, the sum of the hourly load change cost of conventional power plants (c.lc) and the sum of the hourly transmission cost (c.tm) per corridor (cor).
The demand (d) in each region (r) for every hour has to be equal to the hourly generation of generating technologies (pt,tecgen,r) plus the discharge of storage (pt,tecstor,dis) and the hourly imports into the region (p.impt,r) minus the charge of storage (pt,tecstor,dis) and the hourly exports into the region (p.expt,r) (2).
d t , r = p t , t e c g e n , r + p t , t e c s t o r , d i s , r + p . i m p t , r p t , t e c s t o r , c h , r p . e x p t , r
The model optimizes the years 2020, 2030, 2040 and 2050, taking into account representative days of the seasons, extreme time steps as well as time steps relevant for grid expansion in perfect foresight. For the introduced research questions the model was parameterized for Germany. The model considers the existing infrastructure (generation capacities, storage capacities and the high and highest voltage grid), the area potential for the construction of new power plants (Section 4.1), which is based on geographic information system (GIS) calculations, as well as normalized generation time series based on [38,39] and the electricity demand in hourly resolution, which is distributed regionally based on normalized demand according to [40]. The mentioned parameters are at the regional resolution of rural districts (NUTS3) level. The structure of the model enables calculations in different regional resolutions by clustering NUTS3-regions into bigger regions. A developed grid clustering algorithm [41] is applied to reduce the grid by the regional clustering of the NUTS3 regions.
The operation of the high and highest voltage grid is represented in the model as a transport model, in which the balance of each region can be equalized by import and export between interconnected regions, limited to 70% of the grid capacity, to ensure n-1 criteria. The grid losses are represented by transport costs (3), where cv is the costs for grid losses in €, P is the transferred power in kW, Pn is the nominal grid capacity in kW, R is the line resistance in Ω, U N is the nominal grid voltage in kV, Δ t is the time difference in hours and p is the price for the electricity loss in € per kWh.
c v = P ( P n R / U N 2 ) Δ t p
The grid expansion within the model considers three options: (1) upgrade from 220 kV to 380 kV lines, (2) adding a 380 kV line to an existing system when there is potential and (3) adding a new corridor system with 380 kV lines between two model regions. Within the model, one virtual line between two neighboring regions is considered instead of every single line. This is owed to the findings of [34], who reported that the detection of overloads via a DC load flow model of every single line only resulted in marginal improvements compared to the aggregated virtual line in ENTIGRIS. The cost of the grid expansion depends on line length. Therefore a cost function for each virtual line for each expansion option (upgrade, line adding, and new line) is calculated in advance and the specific cost function is implemented in ENTIGRIS. The corridor and expansion option specific cost function is assumed to be linear. The slope of the curve is defined by the two points of minimum expansion capacity (shortest line) and the maximum expansion capacity (aggregated line length of total potential) and the corresponding costs. The ordinate is defined by the shortest line length. Within the optimization model, a minimum line capacity expansion of the shortest line for each of the expansion categories needs to be ensured, which turns the optimization problem into a mixed-integer problem.
In addition to the national RE targets, self-supply targets are implemented for each of the regions. The self-supply targets are defined as a minimum condition, whereby the electricity demand in the respective optimization year must be covered by renewable electricity (wind, PV, hydropower, and biogas). The assumed self-sufficiency rates for the modelling are derived in the following section. The question of actual realization depends on further factors, such as current framework conditions, local acceptance, or investment behaviour.

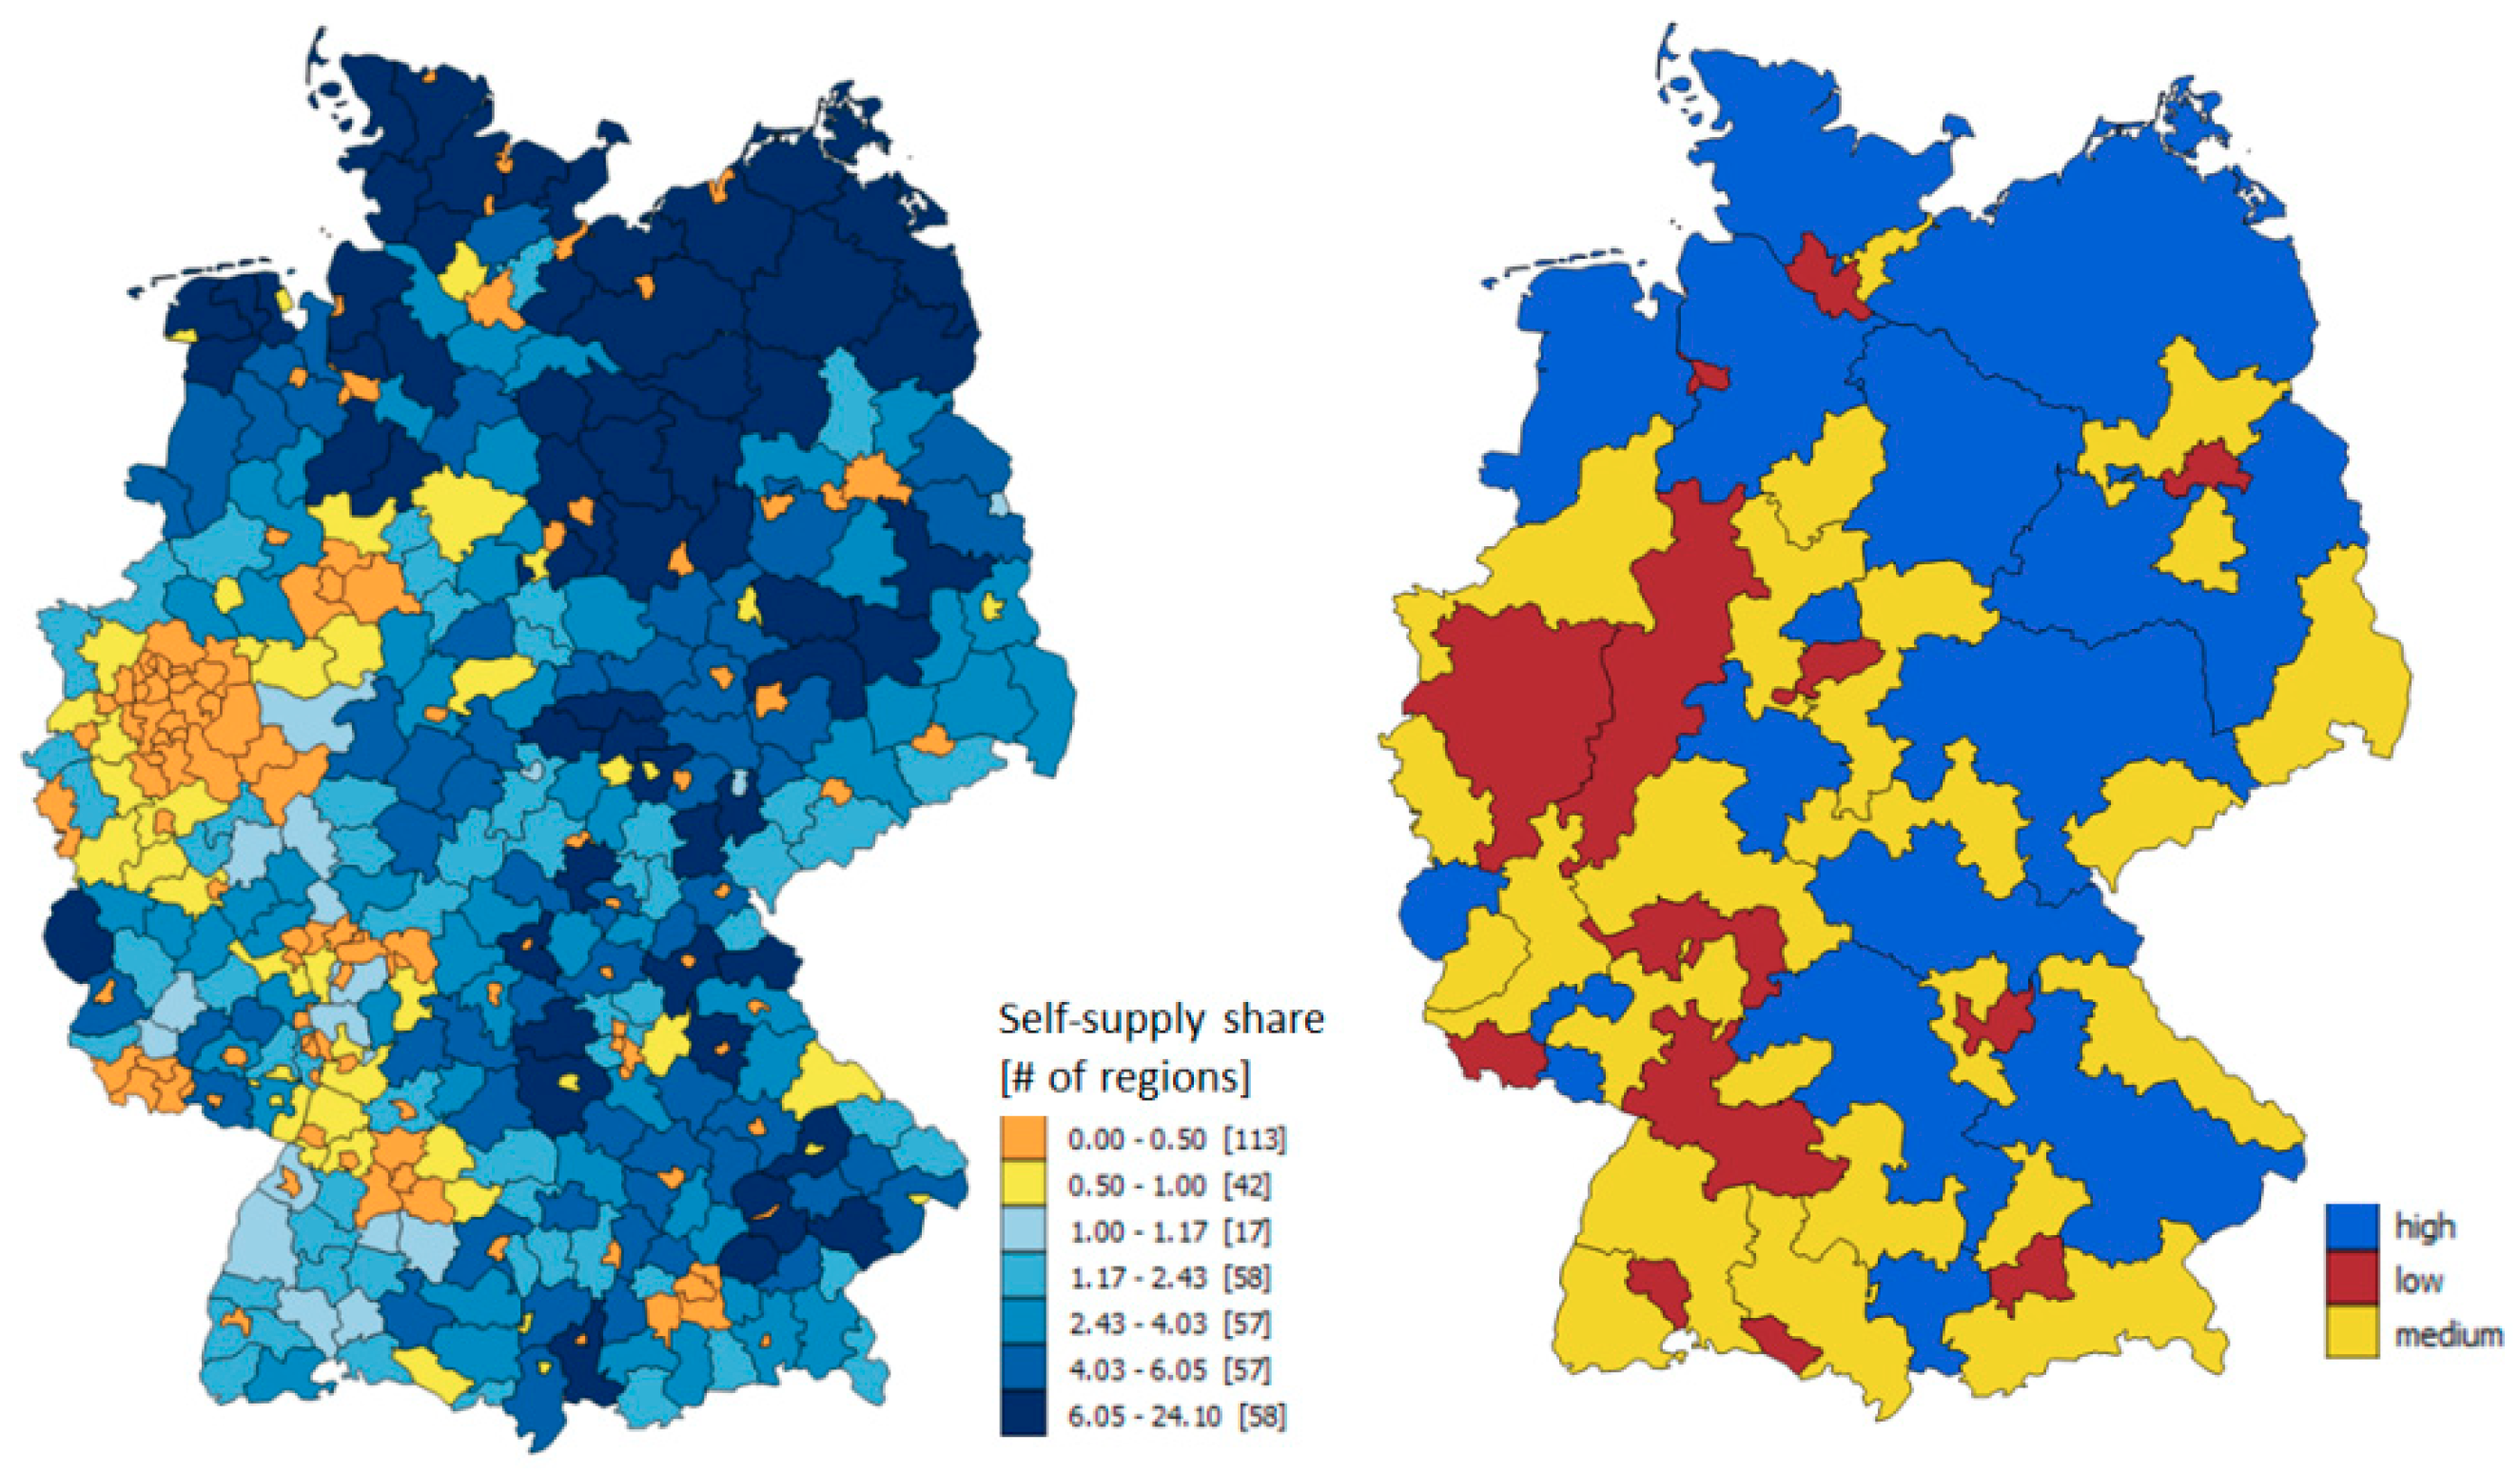
3.3. Self-Supply Potential and Regional Clustering for Targets

In this paper, the basis for evaluating the effects of regional self-supply targets is the allocation of targets to the regions. In reality, numerous regions in Germany have already set self-supply targets. An analysis of the current self-supply rate and the potential self-supply rate of these regions shows no strong relation between the target setting and the potential [5]. However, the potential is crucial for defining varying degrees of possible self-supply. One main constraint of ENTIGRIS is that not all of the 402 NUTS3 regions within Germany can be optimized, due to computational constraints. Therefore, different methods for clustering the regions were tested, combining criteria of the grid infrastructure, the current rate of self-supply, and the existing targets, but the weighting of the factors concerning each other could not be elevated. However, the combination of these factors did not provide satisfactory cluster results due to very inhomogeneous area sizes. The real target setting itself is uncertain since it changes over time based on varying local factors. Therefore, clustering based on renewable self-supply potential, a factor that remains constant in the future, is the most suitable approach. A high sector coupling development, according to the descriptors, results in 1000 TWh electricity demand in 2050, serves as the basis for calculating the potential self-supply rates, illustrated in Figure 3 (left).
An average self-supply rate of 1.7 can be achieved in Germany, whereas around 40 percent of the NUTS3 regions have a self-supply rate below one. Those regions are city-states and urban areas. The rural areas have a rather high self-supply potential. All regions are clustered into three categories; high potential self-supply rate (>3), medium (0.8–3), and low (<0.8). This results in a total of 49 regions (Figure 3 right). For further analysis, three different self-supply targets are defined according to the variance of the self-supply rates in each regional category: low regions (stagnation—no targets, medium 15% and high 30% self-supply rate), medium regions (stagnation—no targets, medium 60% and high 100% self-supply rate) and for high regions (stagnation—no targets, medium 100% and high 200% self-supply rate) (balance-sheet basis).

3.4. The Temporal Resolution of the Model

A days clustering method is applied to reduce calculation time. The clustering method of k-medios is applied in Python according to [42], to identify the days most representative for each season. In the clustering algorithm, the normalized demand in 2015 for each hour, the normalized PV south and east-west orientated generation curve as well as the normalized wind generation curve for 2015 are considered on NUTS3 level. Besides, the extreme time steps are considered (the hours with minimum and maximum renewable generation as well as minimum and maximum demand in Germany). Furthermore, selected hours that are crucial for grid expansion are considered as well. For this purpose, Germany is divided into North and South. Eight different hours are identified during which, for example, the renewable generation potential is high in the North and low in the South, while demand is low in the North but high in the South. Having identified the representative days and additional hours, the normalized wind and PV generation profiles are calibrated according to the full load hours of the whole year in each NUTS 3 region, ensuring the correct proportion between wind and PV. For the scenario calculation of each optimization year (2020, 2030, 2040, and 2050) two representative days per season plus an additional 12 h are considered (in total 816 h).

4. Consistent Scenarios

The construction and selection of plausible scenarios were described in Section 3.1. In this chapter, the five selected scenarios and their storylines will be presented in detail after a brief qualitative system overview. Figure 1 displays the position of the five selected scenarios among the 2236 scenarios with a maximum inconsistency score of 1 on the MCA-plot; positions of the 17 fully consistent scenarios are marked by x. Based on the MCA, analysis dimension 1 can be interpreted as a fuzzy scale of progression/stagnation of RE deployment; higher values are associated with higher RE shares, higher policy stability, and a higher public acceptance of RE. Dimension 2 is mostly capturing economic growth and electricity demand; low values on this dimension imply lower GDP and lower electricity demand. Although the MCA captures a large amount of variance, the interpretation of the dimensions is rather fuzzy, since the trade-off between explained variance vs. clear interpretation of the dimensions was decided here in favor of the former.
Table 1 displays the plausible scenarios that were identified for the analysis. They range from rather conservative scenarios to very progressive scenarios.

4.1. Qualitative System Analysis

For a condensed overview of the system interactions, the most active and most passive descriptors in the system will be addressed in this chapter, as well as the question which variants can be added to the set of consistent scenarios or pushed into vacancy by forcing other descriptor variants based on the cross-impact balance matrix. Forcing a descriptor variant means maintaining a certain variant, ignoring all impacts from other descriptors, and thus simulating strong external interventions. We focus on influences eliminating or enabling certain variants for the whole scenario set since the description of changes in the shares of certain variants would feign accuracy contradictory to scenario methods and qualitative analysis.
In CIB, cross impacts between descriptor variants are coded by assigning a promoting or hindering effect of each descriptor variant on the realization of any other descriptor variant on a scale of +3 (strongly promoting) to −3 (strongly hindering); independence between descriptor variants is coded by assigning 0. On this basis, it is possible to identify the descriptor variants exerting the most influence on the system by adding the moduli of all impacts a descriptor variant exerts on other descriptor variants (active-sum); likewise, the descriptor variants receiving the greatest influence from other descriptor variants can be identified by adding the moduli of all impacts affecting a certain descriptor variant (passive-sum). National renewable energy share and public acceptance of energy transition are the descriptors influencing most of the other descriptors in this system; while the former receives as many impacts as it contributes, the latter is much less prone to influences from other descriptors. The least passive descriptors are oil-price, CAPEX generation technologies, and CAPEX storage because the world market determines them and all the other descriptors are related to the national scale. The most passive descriptors are planning legislation, national electricity demand, and national renewable energy share.
Overall, it can be observed that medium and high fuel prices, a high national share of RE and CAPEX for generation and storage technologies are the quantitative descriptor variants limiting the contingency of the scenario set the most. This analysis also highlights the importance of public acceptance for the future energy system, since it is the qualitative descriptor which makes the most variants of other descriptors disappears from the set of consistent scenarios.

4.2. Storylines

In, the following chapter the storylines of the chosen scenarios are described based on the descriptor specifications. The supranational developments in the “Stagnation and skepticism central” scenario are driven by low fuel prices and the high CAPEX of storage and generation technologies, which hinder the dispersion of renewables, while the former also facilitates economic growth. The government tries to counter this development by providing greater policy stability, promoting central planning, and supporting high CO2-prices at EU-level. However, these measures fail to propel the share of renewable electricity generation over 60% in this scenario, since they are unable to counter the effects of high CAPEX and low fuel prices. This is further owed to current centralization efforts and emphasis on speeding up planning legislation, which reduces the possibilities of participation and lower public acceptance of renewables. Consequently, sector-coupling remains at a very low level and electricity demand more or less stagnates. Since the importance of regional added value, as well as regional communitarisation, diminishes and energy policy is centralized, regions do not strive to fully exploit their potential for renewables, resulting in a medium increase in high-potential and mid-potential regions and stagnation in low-potential regions.
While the “Stagnation and scepticism decentral” scenario shows a similar global context regarding fuel prices and CAPEX, economic growth in Germany is rather low and thus, the political consequences differ: since, under these circumstances, the government does not promote higher CO2-prices and public acceptance of renewables is already low, the government tries to counter this development by pursuing stronger means of participation regarding planning law while simultaneously transferring competencies to the local level. Overall, these measures cannot entirely counteract the relatively high costs of renewables, so that the share of renewables stays relatively low, even though electricity demand more or less stagnates since sector-coupling is uneconomical in this context. Decentralized energy policy and rising regional communitarisation would also allow for significant increases in regional self-supply. However, these effects are countered by high CAPEX and low public acceptance of renewables, resulting in the same distribution of renewables as described above.
The global context in the “Adaption and optimism” scenario differs significantly from the two former scenarios: while the CAPEX for storage and generation is on a comparable level, fuel prices are a lot higher in this scenario. Since the national economy is growing steadily, the government can successfully promote CO2-price increases, which is further facilitated by the strong public support for renewables. Additionally, sound economic development reduces the urge to frequently adjust the legal framework, thus promoting investments in renewables and sector coupling technologies. As a result, electricity demand is rising to a medium level. Since operating costs for conventional technologies are so high that renewables are economically superior, planning legislation can focus on acceptance and legitimation instead of speeding up expansion. This focus strengthens public support and promotes regional networks, which leads to an adjournment of competency to the regional level. Coupled with the rising importance of regional added value these circumstances further the deployment of renewables to a medium level of self-supply for mid-potential and low-potential regions; high-potential regions have a significant advantage over the other types of regions concerning local deployment of renewables. They are also expected to have a stronger intrinsic motivation to reach high levels of self-supply, which they can implement under these conditions.
Medium fuel prices, a moderate reduction of generation technologies CAPEX, and a strong decrease of storage CAPEX frame the global context in the “Completion and enthusiasm central” scenario. National economic growth is moderate, public support of renewables is strong due to the relatively high operating prices of conventional technologies and high policy stability. Latter also facilitates investments in renewables as well as sector coupling technologies, which in turn increases electricity demand. Against a background of reduced importance of regional added value and diminishing regional communitarisation, energy policy is centralized, and planning legislation can focus on speeding up the deployment of renewables without provoking a significant backlash. This results in a high share of RE, despite increasing electricity demand. Compared to the previous scenarios, the regions have less economic incentives to pursue the deployment of RE. Nevertheless, to fulfil a high share of RE, regional self-supply rates are similar under centralized planning.
A strong decrease in storage and generation technologies CAPEX, as well as low fuel prices, characterizes the global context of the “Completion and enthusiasm decentral” scenario. Under these circumstances, a cycle of policy stability and strong economic growth can be established at the national level. Low fuel prices and a positive public opinion towards renewables facilitate the establishment of high CO2-prices. These add an economic pull to the technological push on the deployment of RE and sector coupling technologies. In the face of these strong drivers, planning legislation can focus on legitimation and acceptance building instead of increasing deployment speed. Thus further strengthening the positive public attitude, local networks, and support for a shift of competencies to the local level. Against this background, almost all potential for RE is made available, except for the potential associated with the highest costs—located in the low-potential regions.

5. Electricity Market Model Results and Discussion

With only the coupling descriptors as model input, the scenarios (Table 1) are optimized using ENTIGRIS. Variations are calculated for each scenario (Table 2) that differs in the setting of regional and national targets. The A’ variant is not considering regional self-supply targets and serves as a reference case. In this variant national targets are forced to stay within a 5% range, meaning that the national RE share is forced to be 60–65% in the stagnation scenarios, 80–85% in the adaption scenario and 95–100% in the completion scenarios to be consistent with the storylines. Variant A refers to the consistent scenarios (defined in Table 1) for which the regional targets correspond to the storylines. In this variant, the national goals are set as a minimum condition to prevent the development of infeasibilities that can arise from setting both regional and national RE targets. Variant B is also calculated, whereby self-supply targets for each region are assumed to be 100%. If the target exceeds the region’s potential, the maximum potential is defined as the target. In both variants A and B the national RE-share can be higher than in the A’ variant, as the reginal targets, as a model constraint, may lead to higher national RE shares than defined in the storylines. Since the CIB was carried out before the numerical simulation, the expert judgment had to anticipate the model results concerning the cross-effects between the model parameters. This has resulted in a discrepancy between the national share of renewables and the simultaneous achievement of regional self-sufficiency targets. In principle, this discrepancy could have been eliminated by the second cycle of CIB and numerical simulation, which was not possible here due to time constraints. To quantify the effect of the regional self-supply targets the deviations between A and B towards A’ are analysed.
The percentage deviation of the general energy system parameter of the scenario variations is displayed in Table 3 and serves as an overview of the effects of the regional self-supply targets. In the following subchapters, each of the parameters will be described in more detail. It is important to note that the scenarios are not intended for comparison with each other because they differ in several descriptors. Therefore, the result analysis focuses on the effects that result from setting self-supply targets for each scenario.

5.1. System Design and Operation
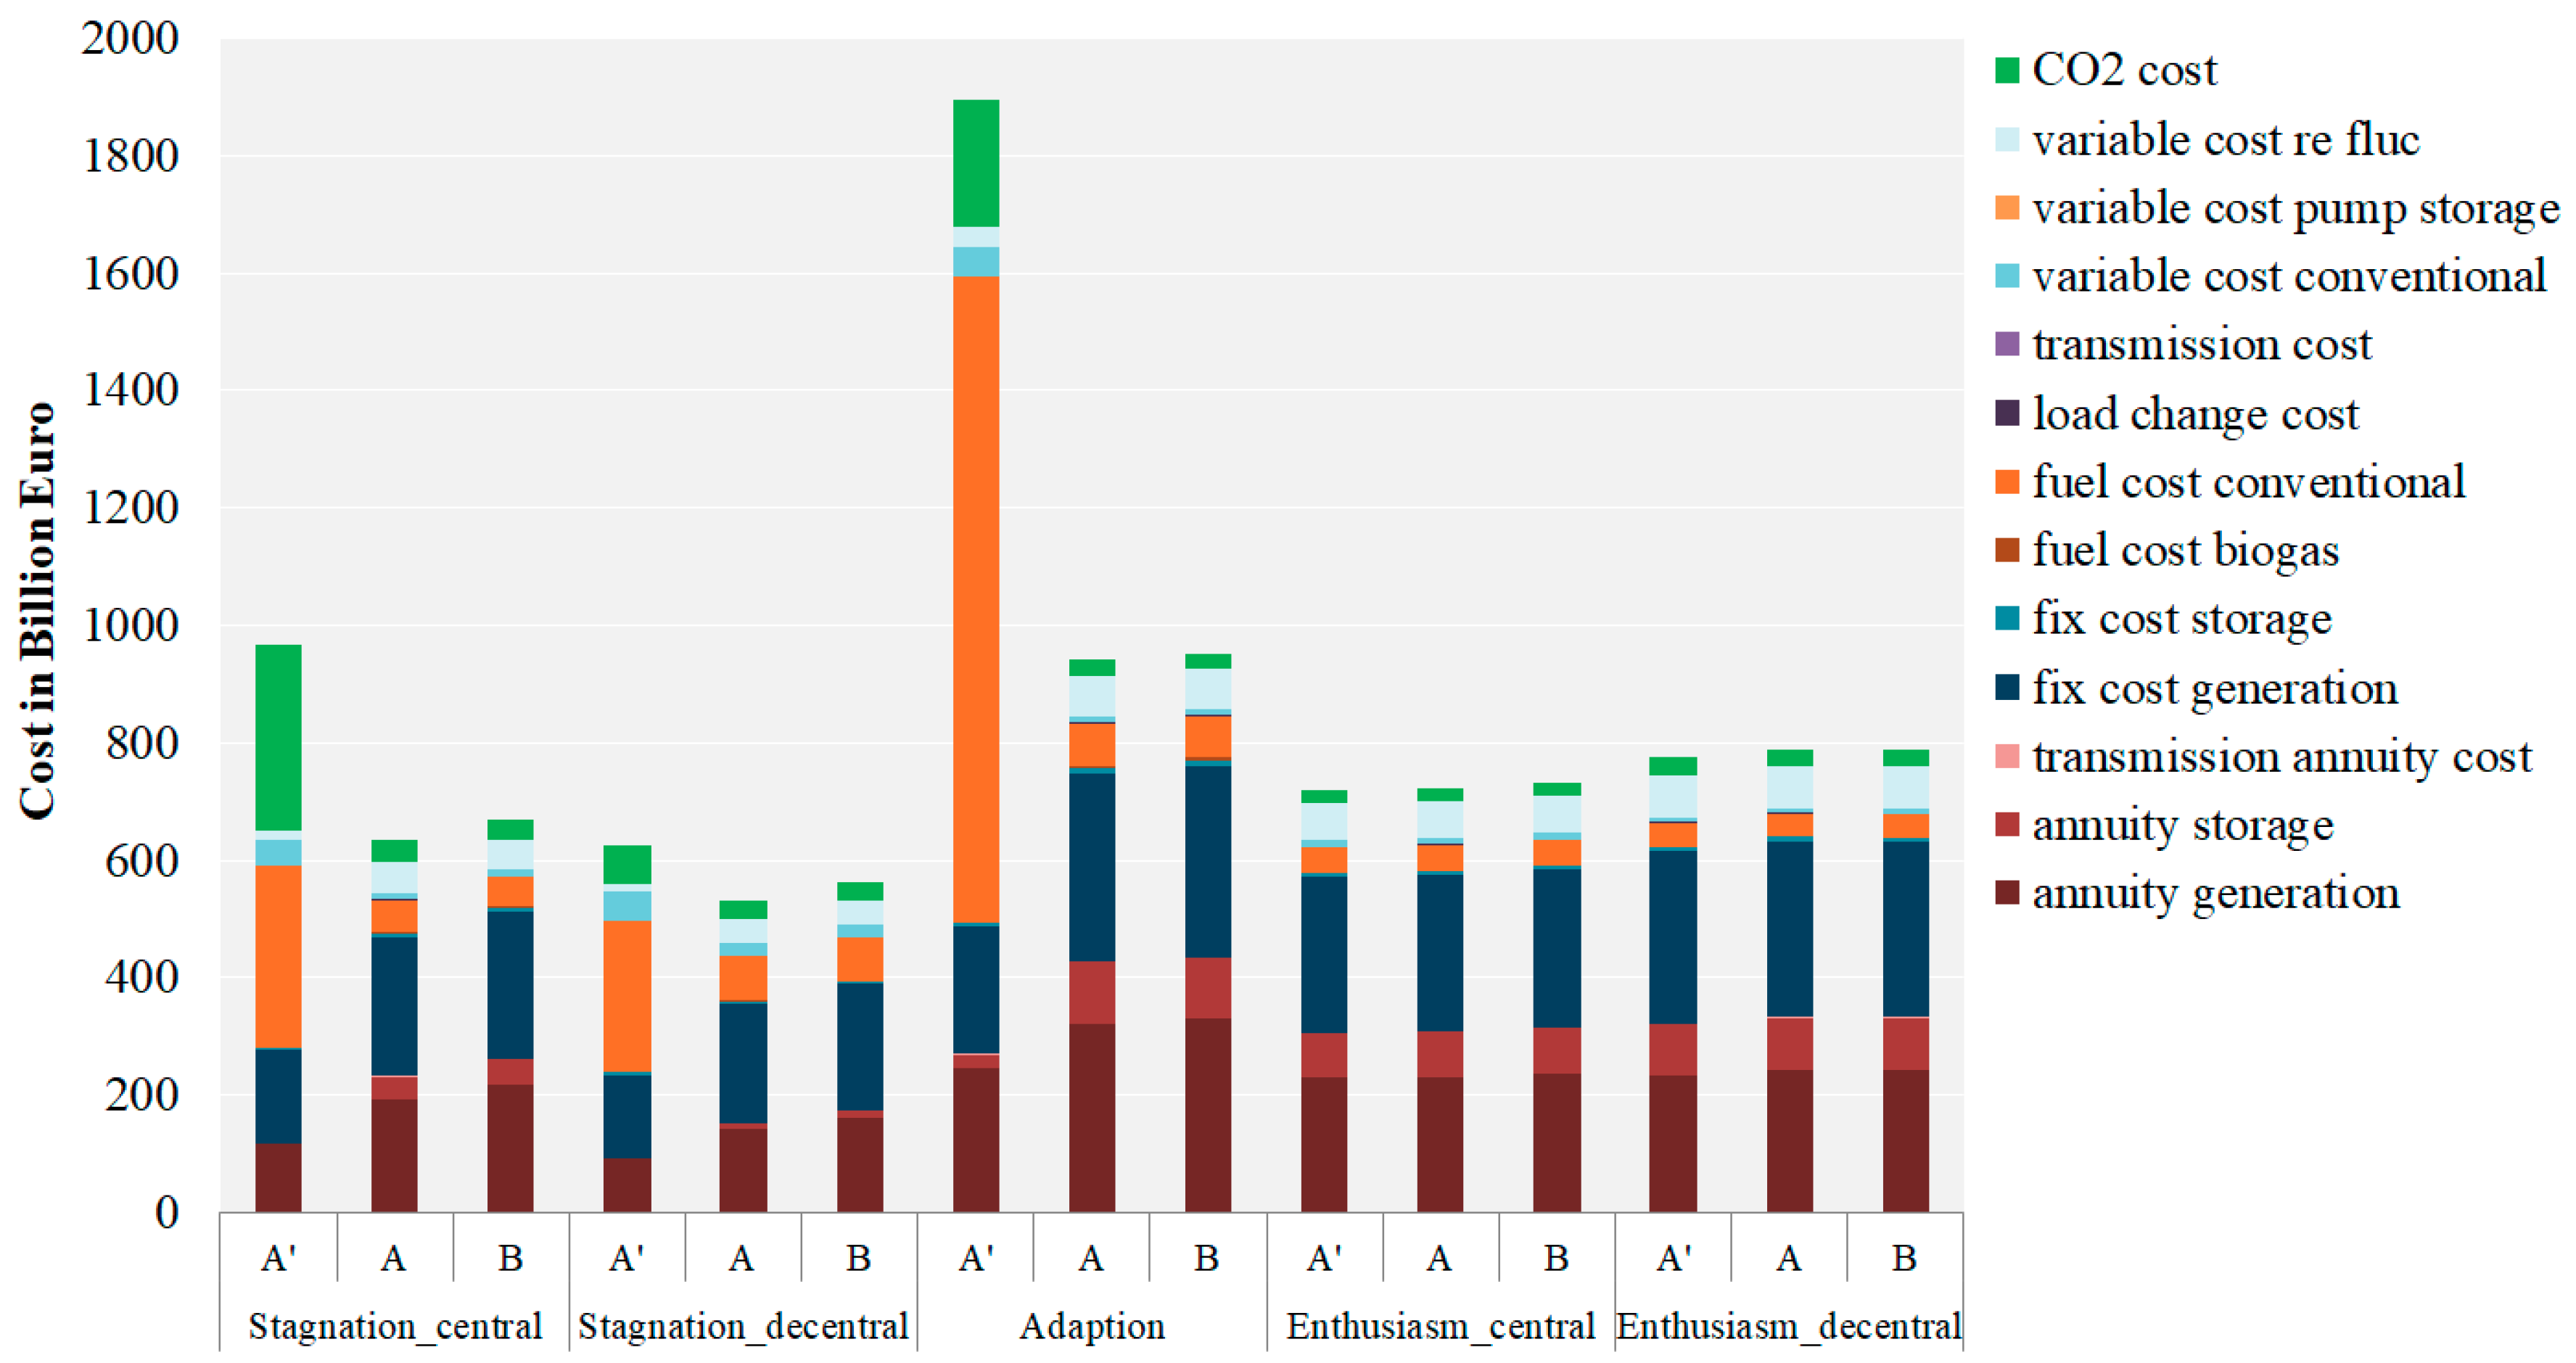
One main difference of the system design is the national renewable energy share. Table 3 shows that, according to the storylines, the stagnation scenarios have RE-shares of 60–65% and the adaption scenario of 85% (without regional targets), as this has been set as a model constraint (see introduction of chapter 5) to be consistent with the storylines. The variants with regional targets, having only a minimum national RE share constraint, result in the national share of renewables up to 99% in the central stagnation and the adaption scenario (based on a high CO2 price). In the decentralized stagnation scenario, the national share of renewables is around 90%. In contrast, there is a marginal impact by regional self-supply targets in the completion scenarios, as all variants have high national RE-shares.
The generation shares per technology are listed in Table 4 for all scenarios and variants.
One main effect that can be observed is the influence of the degree of sector-coupling on the total installed capacities. In the “stagnation” scenarios, without regional targets, and with a demand for electricity of 500 TWh, approx. 200 GW of generation capacity is installed. In the “Adaptation” and “Completion Central” scenarios, approx. 450–500 GW are installed with a demand of 800 TWh. In the “Completion decentral” scenario, which represents a high degree of sector coupling, around 670 GW are installed. Another observation is that in 2050 wind power plants (40–58%) and ground-mounted PV systems (PVgm) (22–53%) have the highest share of installed capacity and generation in all scenarios. The conventional power plant stock consists mainly of combined cycle gas turbine (CCGT) power plants, as those have a rather low CO2-emission factor and are relatively flexible. Only in the “Stagnation” and “Adaption” scenarios without regional targets do conventional technologies have a significant share, with around 60 GW (about twice as much capacity as today) in the stagnating systems and 84 GW in the adapting system.
In both “stagnation” scenarios, CCGT power plants provide around 30–35% of generated electricity. One main difference between these two scenarios without regional targets is that in the decentral scenario 23% Wind and 42% PVgm-installations are in the system, while in the central scenario 22% PVgm and 40% wind power plants are installed. The reason for that is that the central scenario has constant CAPEX, while the decentral one has a medium price decline, which is higher for PV plants than for wind power plants.
The main effects of setting self-supply targets on the regional level are: (1) Total generation capacity is increasing distinctly in the “Stagnation” and “Adaption” scenario (see Table 3), while the effect is marginal in the “completion” scenarios, as high RE shares are already achieved at the national level. (2) In all variants, without regional targets, almost no new PVr installations are made, because PVgm systems are preferred due to lower costs. Once targets have been set, a strong increase in PVr installations is observed, particularly in the “Completion” scenarios, to exploit regional potentials. Nevertheless, PVr only provides a relatively small share of the electricity generation (max 4%). (3) The installed capacity of CCGT power plants is significantly reduced in the non-completing scenarios (up to 50 GW in the adapting scenario). (4) The capacity of wind power plants is the largest of all other technologies in all scenarios. (5) Comparing the two stagnating scenarios, the high CO2-price in the central scenario leads to the higher wind and PVgm capacities requiring an increase in storage capacities. Meanwhile, in the decentral scenario with low CO2-prices, PVgm power plants are now being reduced due to higher shares of CCGT power plants that are still in the system. (6) The higher share of renewables associated with the regional goals leads to a significant increase in storage capacity and usage in the “Stagnation” and “Adaptation” scenarios to ensure system stability (in the central stagnation scenario, the increase in the renewable share from 65% to 99% triples the storage requirement). (7) Storage needs and usage are only marginally affected in the completion scenarios. (8) The effect of the self-supply targets on the electricity curtailment, i.e., surplus energy can be dumped at zero cost in ENTIGRIS, shows that in most cases the regional self-supply targets cause an increase of curtailment, as the optimal distribution and operation of the technologies is restricted by the regional targets. (9) In all scenarios, CO2-emissions decrease from 2020 on. The highest total CO2-emissions are in the “Adaption” scenario without regional targets, related to the increasing demand for sector-coupling technologies and the generation share of 28.5% CCGT, 14% hard coal, and 6.5% lignite accumulated over all years. The decentralised “Stagnation” scenario has overall roughly the same total emissions as the “adaption” scenario, related to 34% CCGT, 17.7% hard coal, and 8% lignite due to low CO2-prices. The influence of the regional targets is that in all scenarios (except the “Completion” scenarios) between the variants (A’, A and B) a drastic CO2-emission reduction is achieved due to higher RE-shares (around 80% less in the stagnation central scenario and the adaption scenario and halving in the decentral stagnation scenario). (10) In nearly all scenarios, the regional self-supply targets lead to a significant reduction of the necessary grid reinforcement, related to a more demand-oriented distribution of generation and storage capacity. The highest total reinforcement is in the adaption scenario without targets, with 146 lines, which is reduced by 54 lines in the scenario with 100% targets.

5.2. System Costs

Table 5 shows the total and specific system costs (per generated electricity and capita) as the sum of all costs over the years from 2020 until 2050. The scenarios have different underlying cost assumptions for CO2 prices, fuel prices, and the CAPEX of RE technologies and storage technologies (Table A2). The assumptions concerning fixed costs are listed in Table A3, variable costs in Table A4, and grid costs in Table A5. The breakdown of the total system cost by type and year is illustrated in Figure 4.
The main findings are 1. Comparing the total system cost, the scenario “Adaption” (without targets) is by far the most expensive one due to high fuel cost developments and the constraint that 80–85% national RE share need to be meet and therefore fossil fuel prices as well as CO2-prices need to be paid. 2. Based on the model results the lowest levelized electricity cost (€cent2018/kWh) are in the decentral “Completion” scenario. A comparable magnitude of total system cost is between the central and the decentral “Completion” scenario, despite electricity demand being 200 TWh higher in the decentral scenario. 3. The regional self-supply targets lower the total system cost in the “Stagnation” and “Adaption” scenario significantly, as regional self-supply targets result in lower conventional power plant shares and fuel and CO2-cost can be saved using renewable energies. The decline in CO2- and fuel prices is much more pronounced than the increase of annuity costs and fixed costs of renewable energy technologies and storage. In the “Adaption” scenario, the targets lead to a halving of the cost, in the central “Stagnation” scenario costs are lowered by one-third. 4. In the “Completion” scenarios, the regional self-supply targets have only marginal increasing effects on the total system costs.

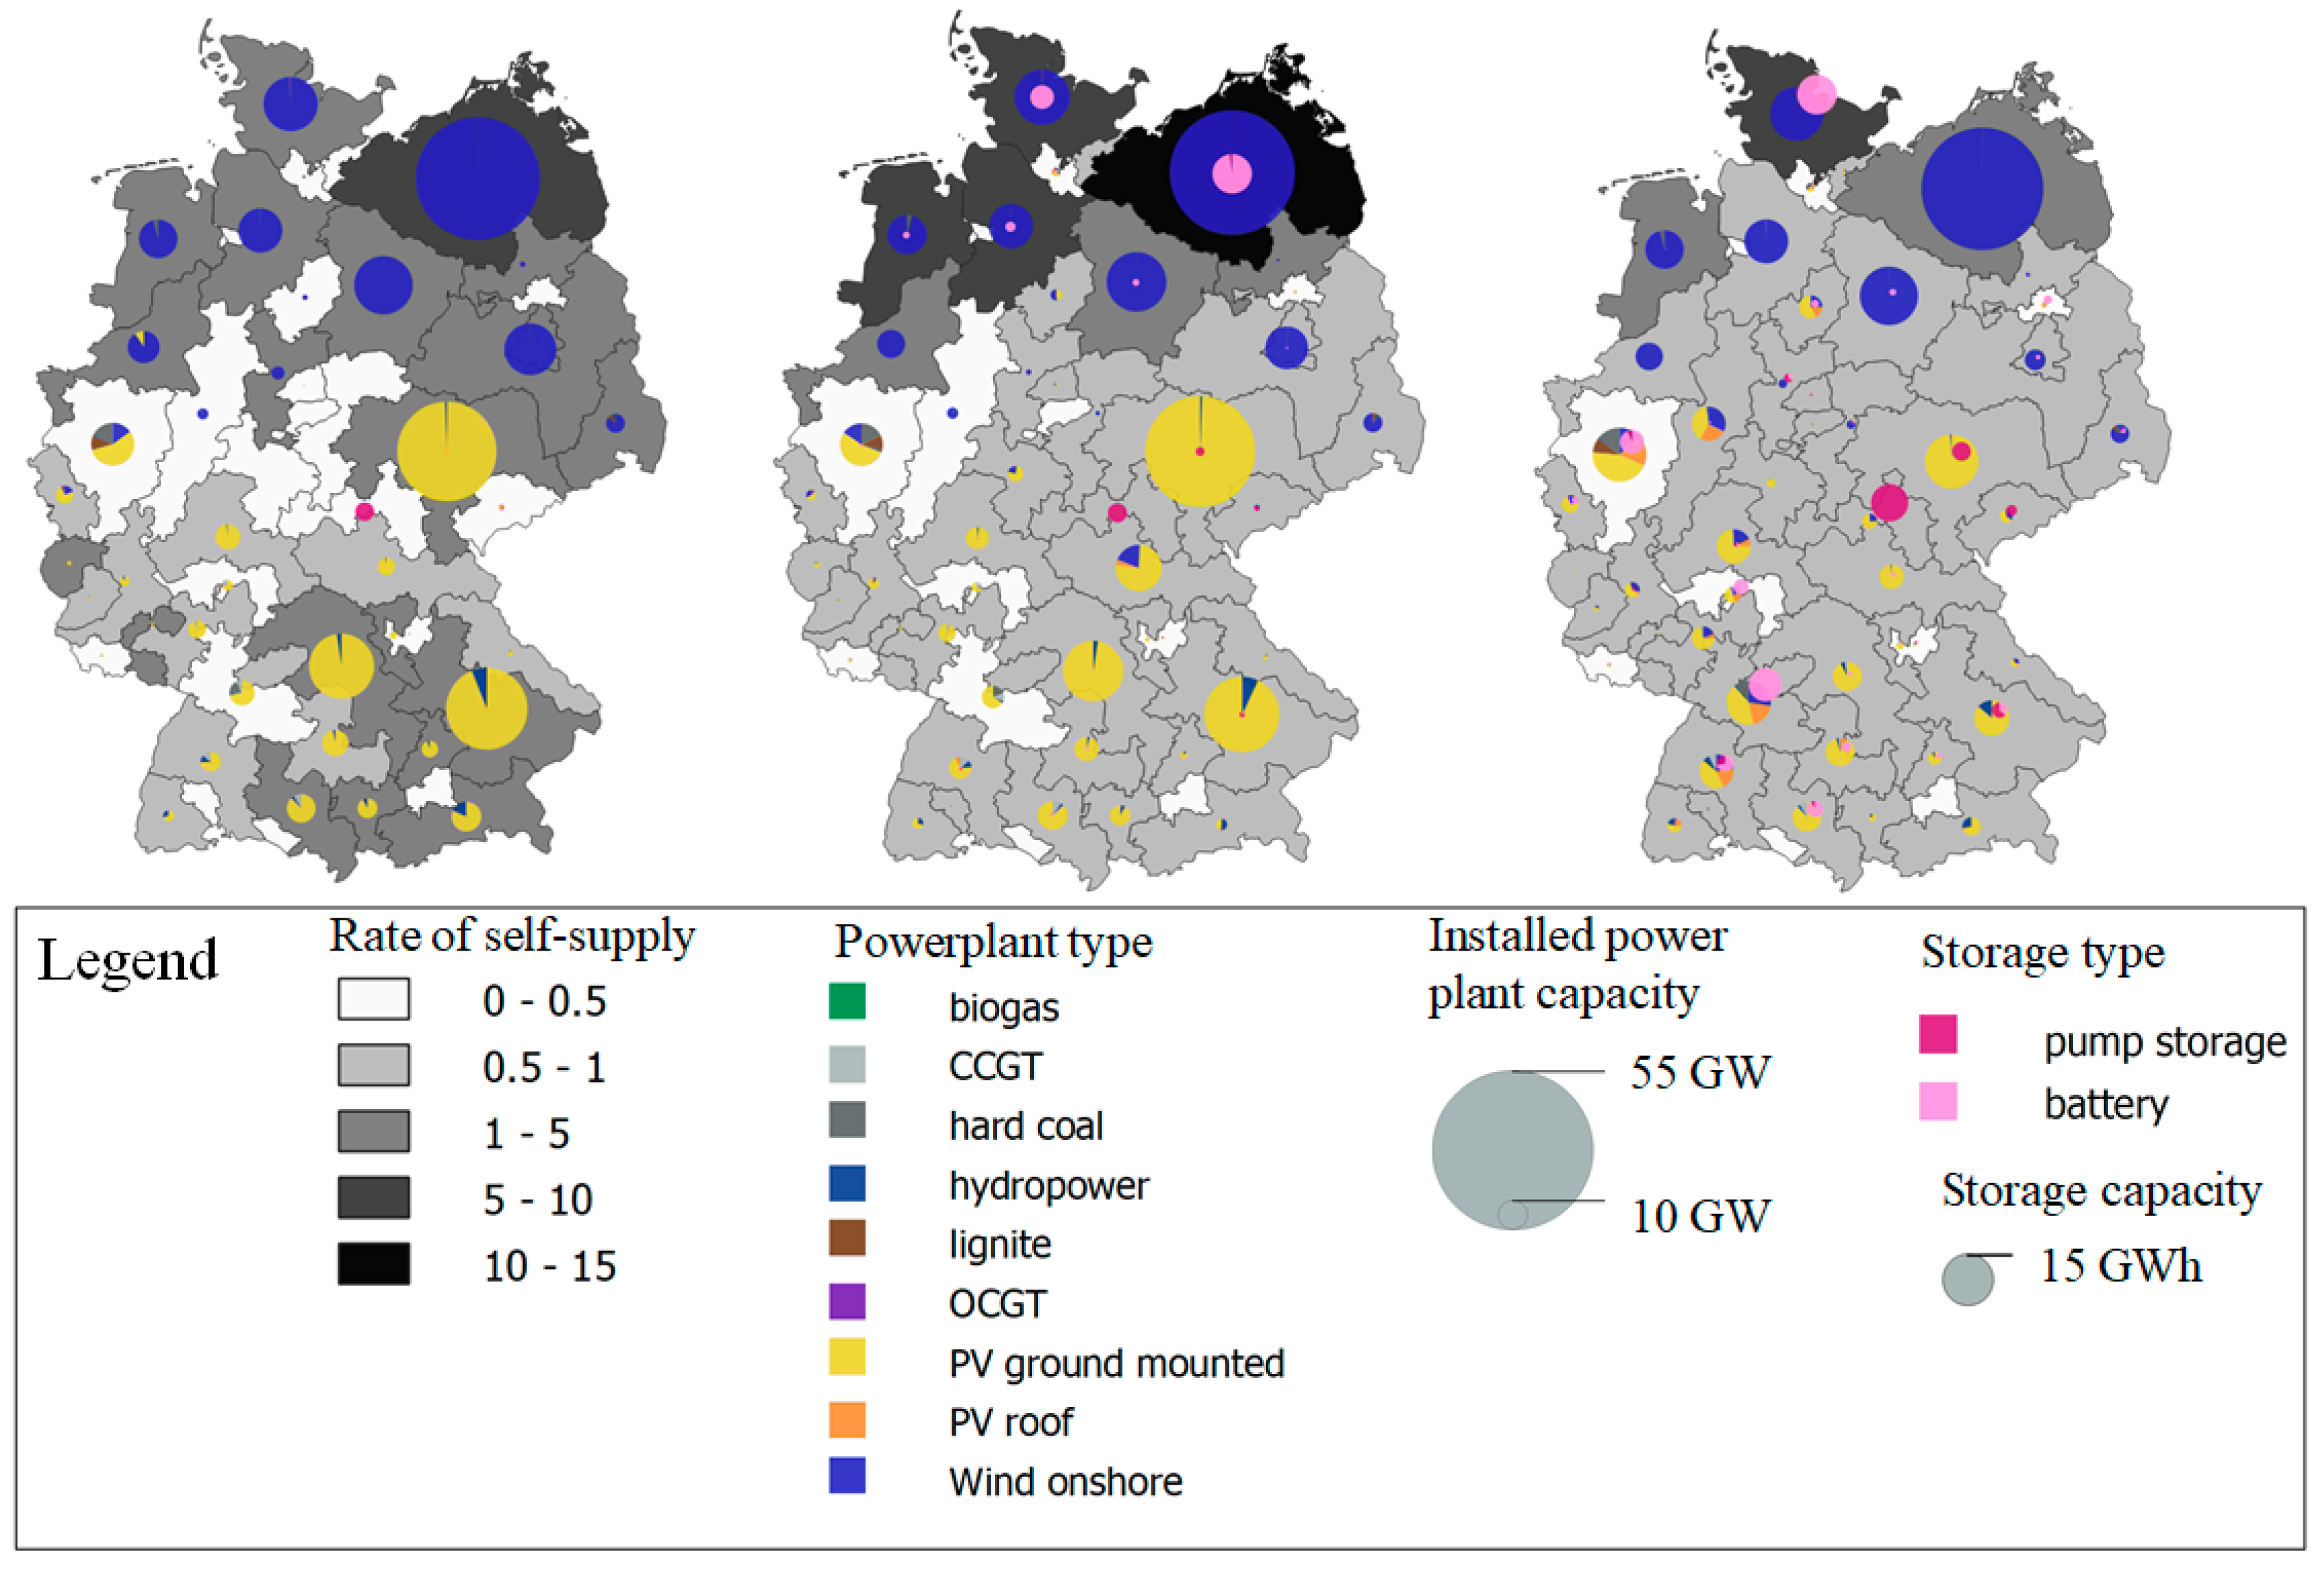
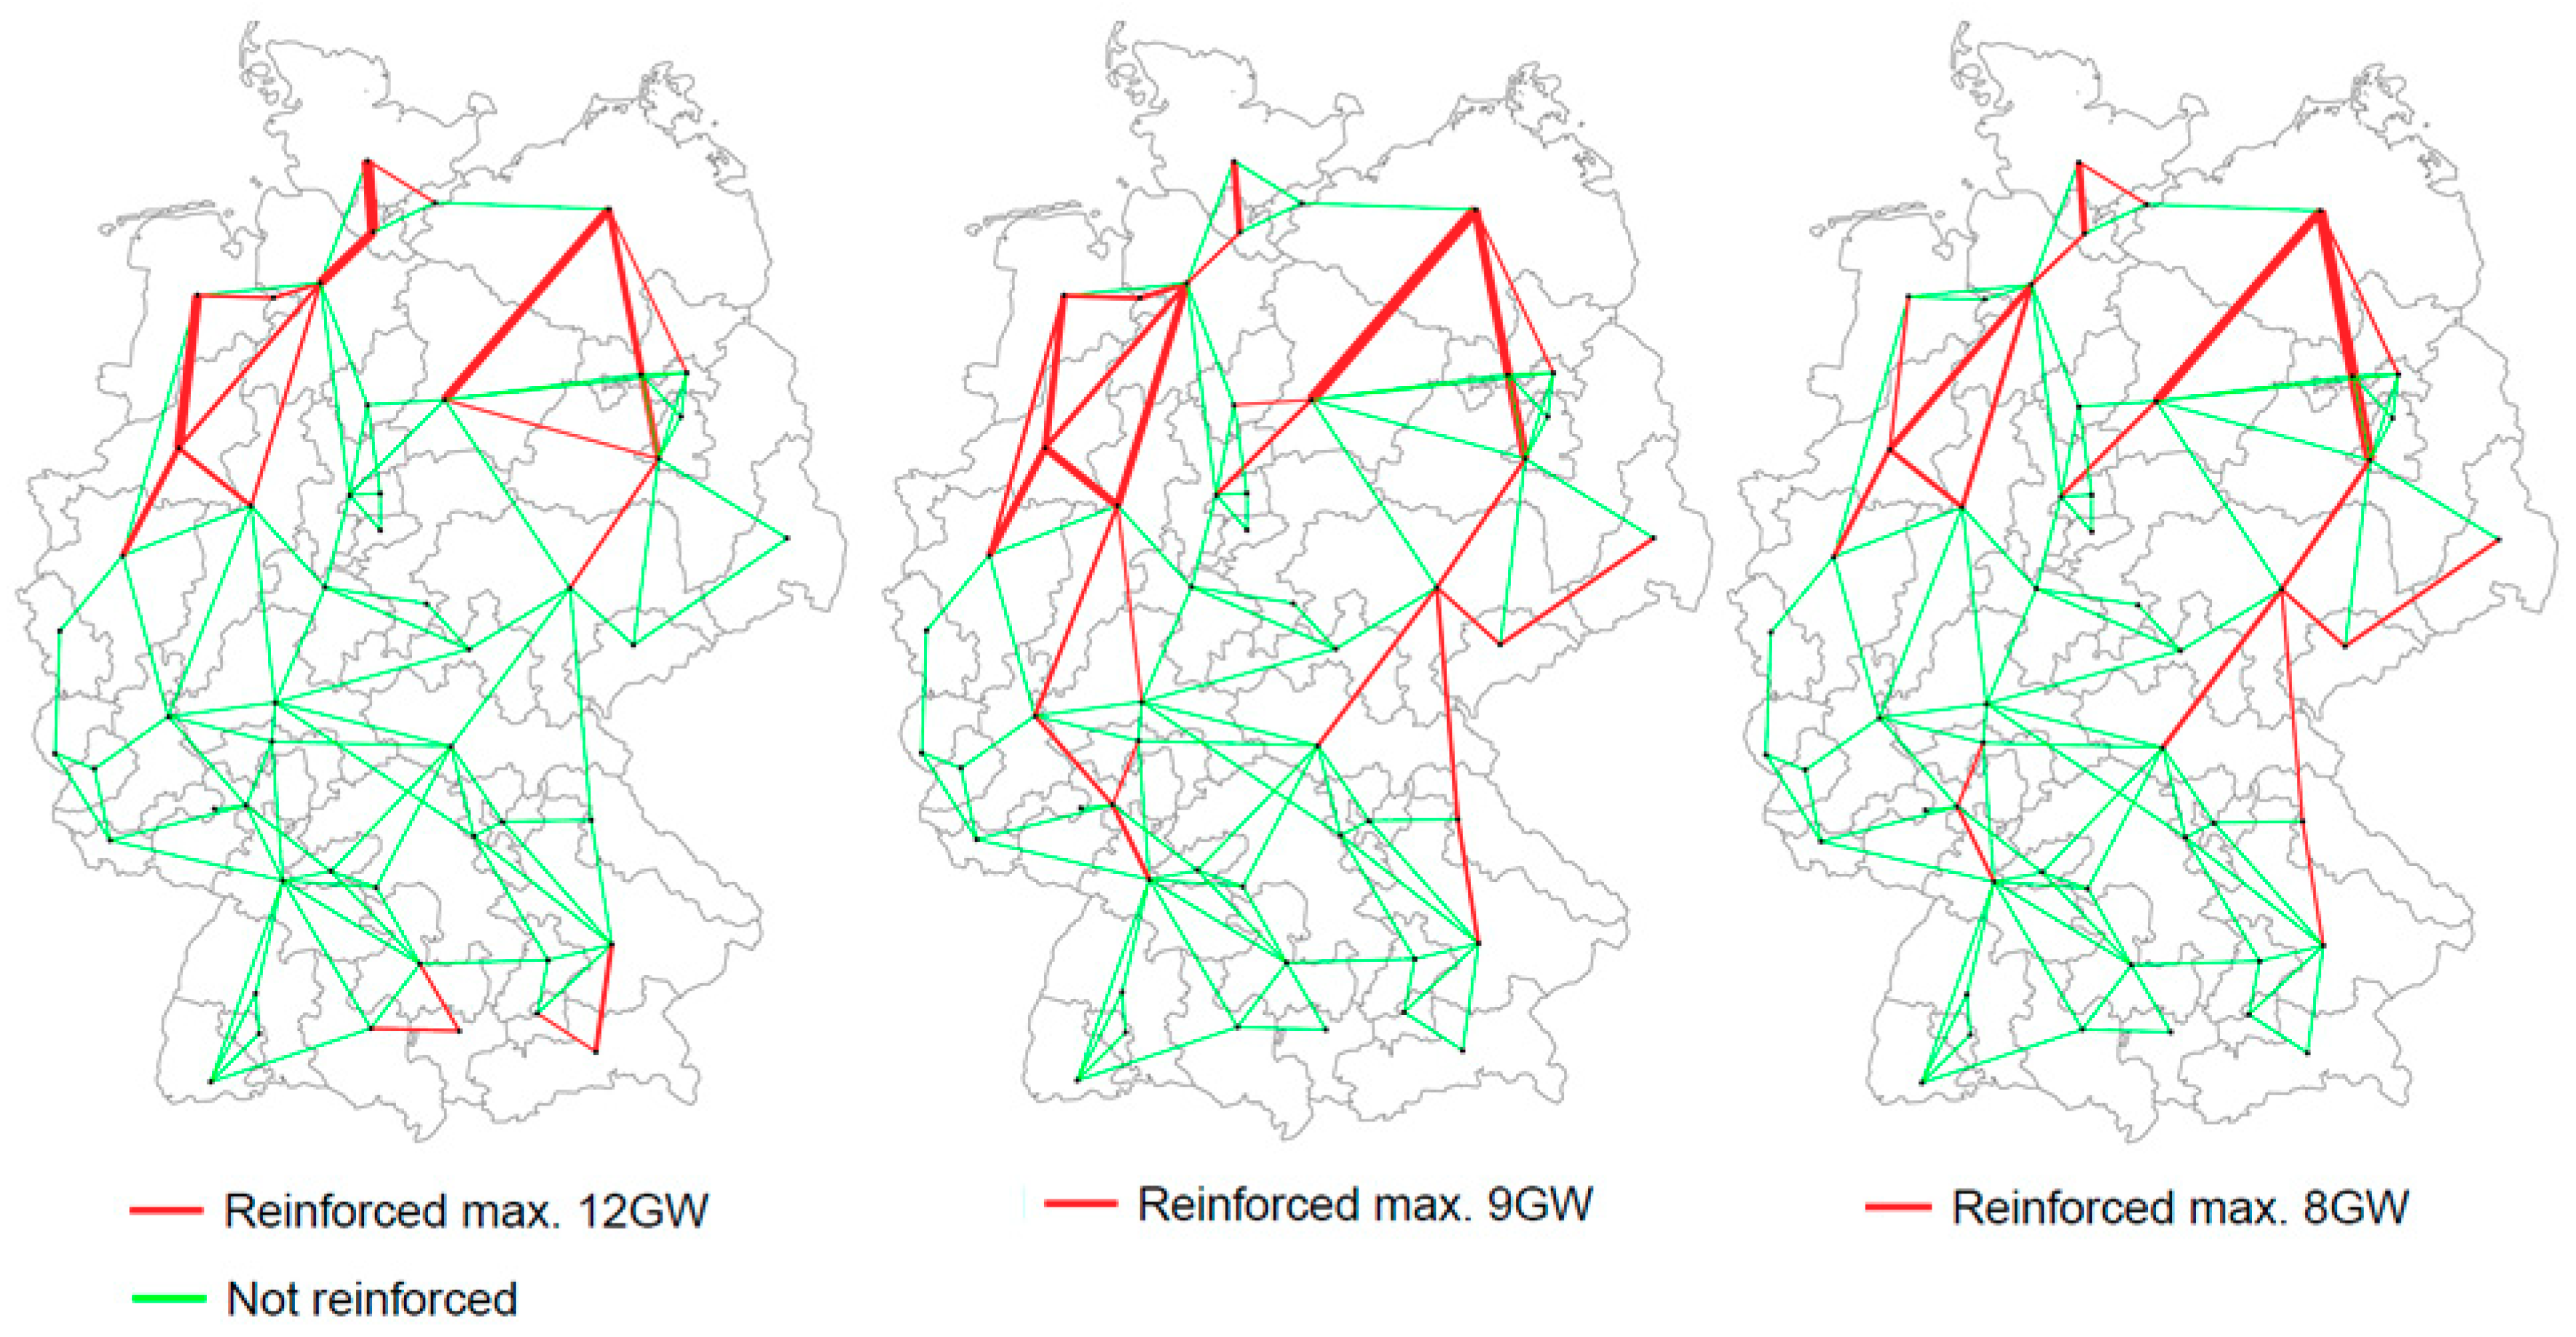
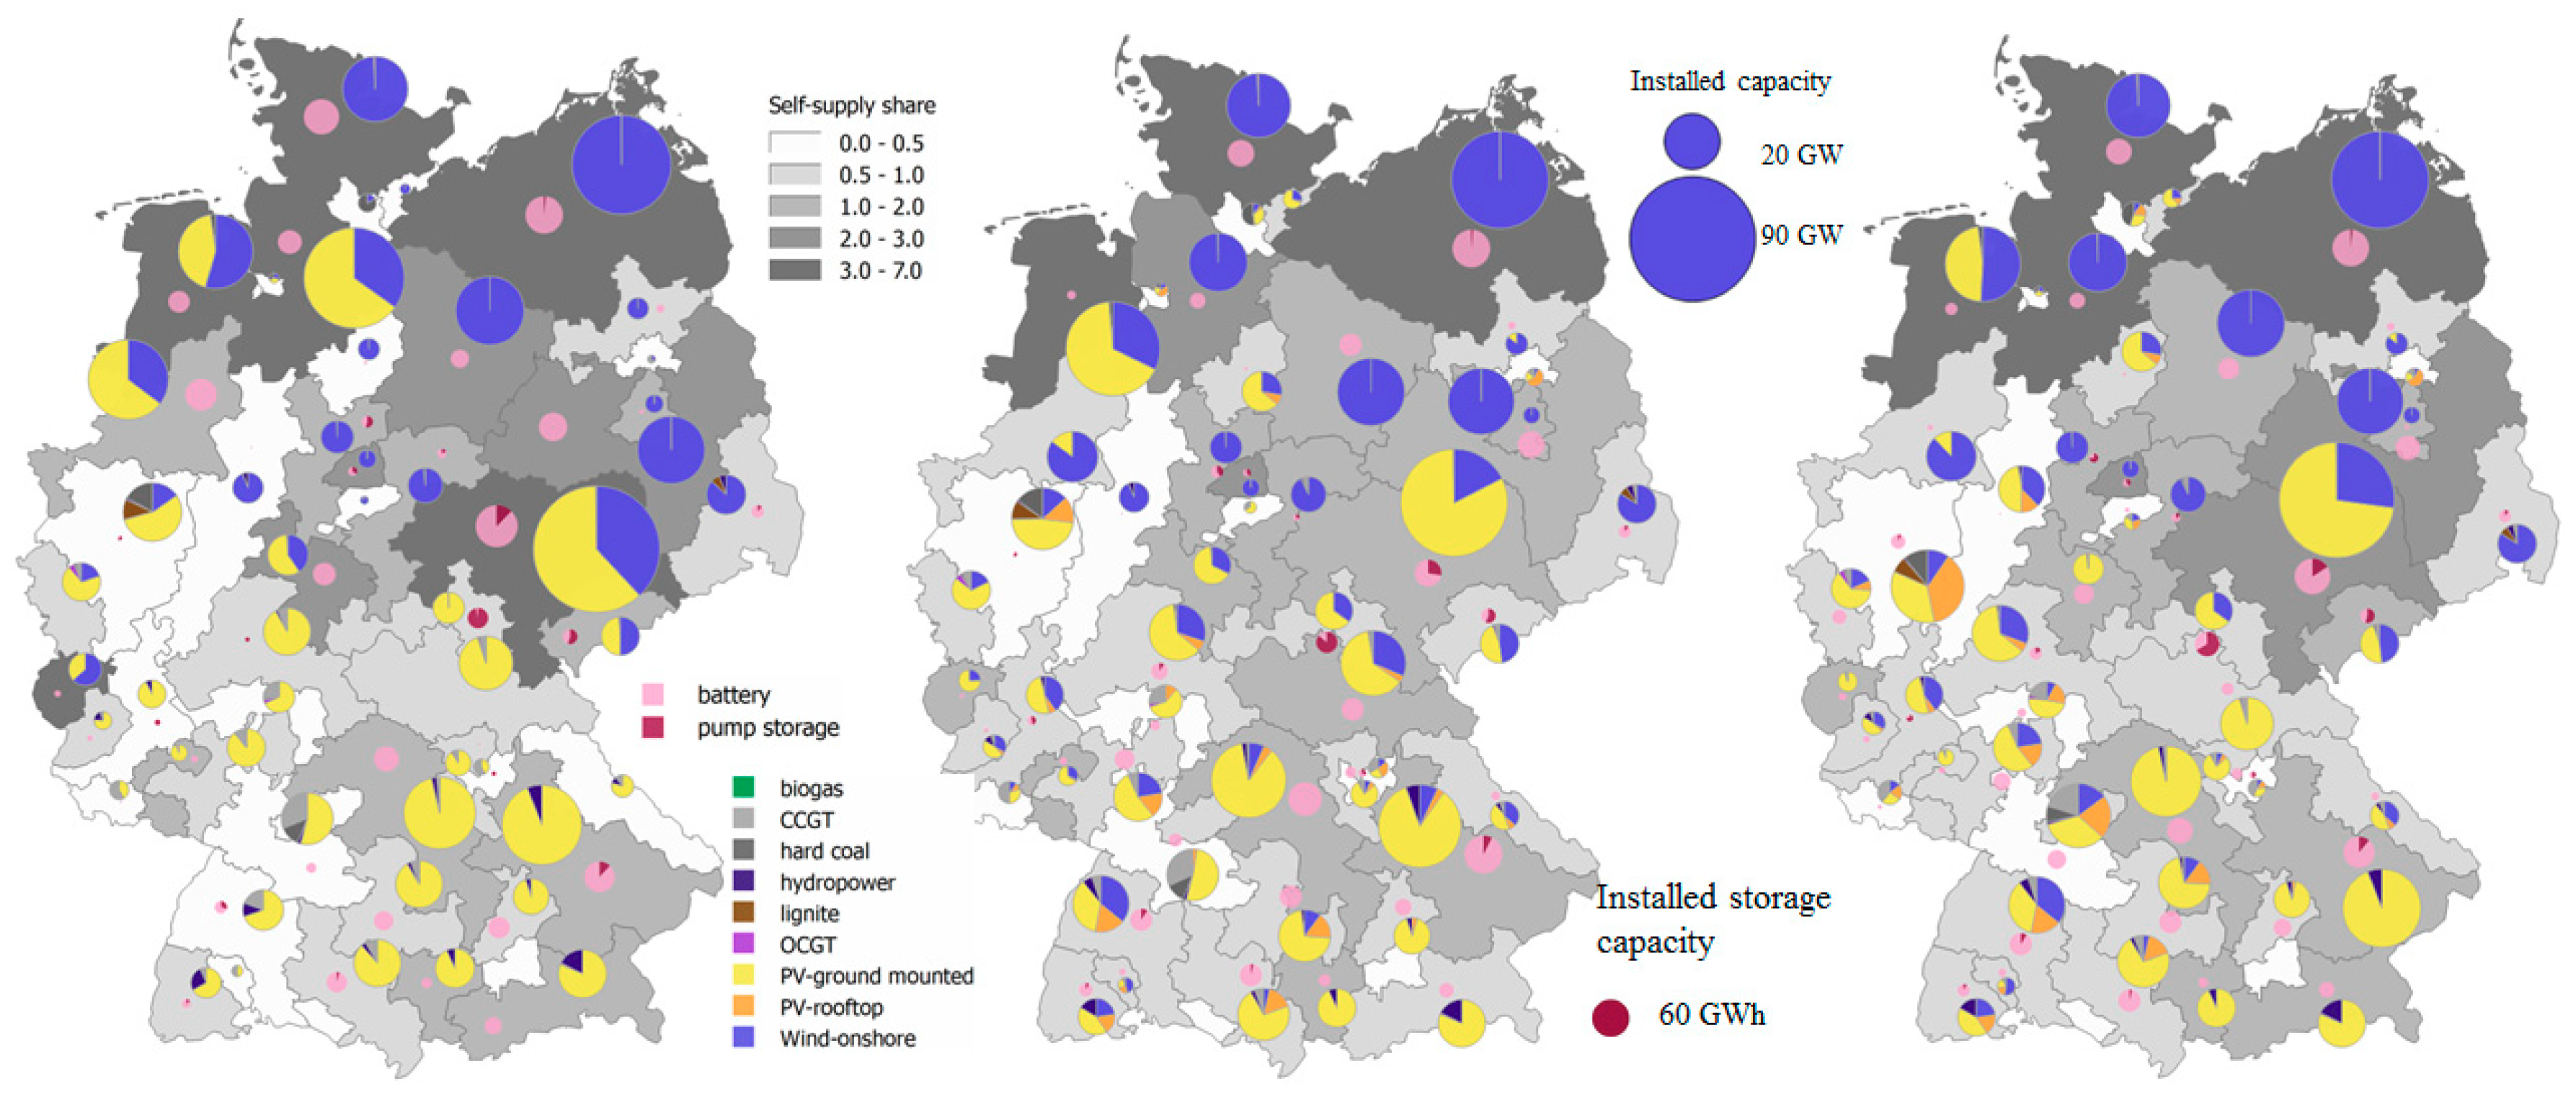
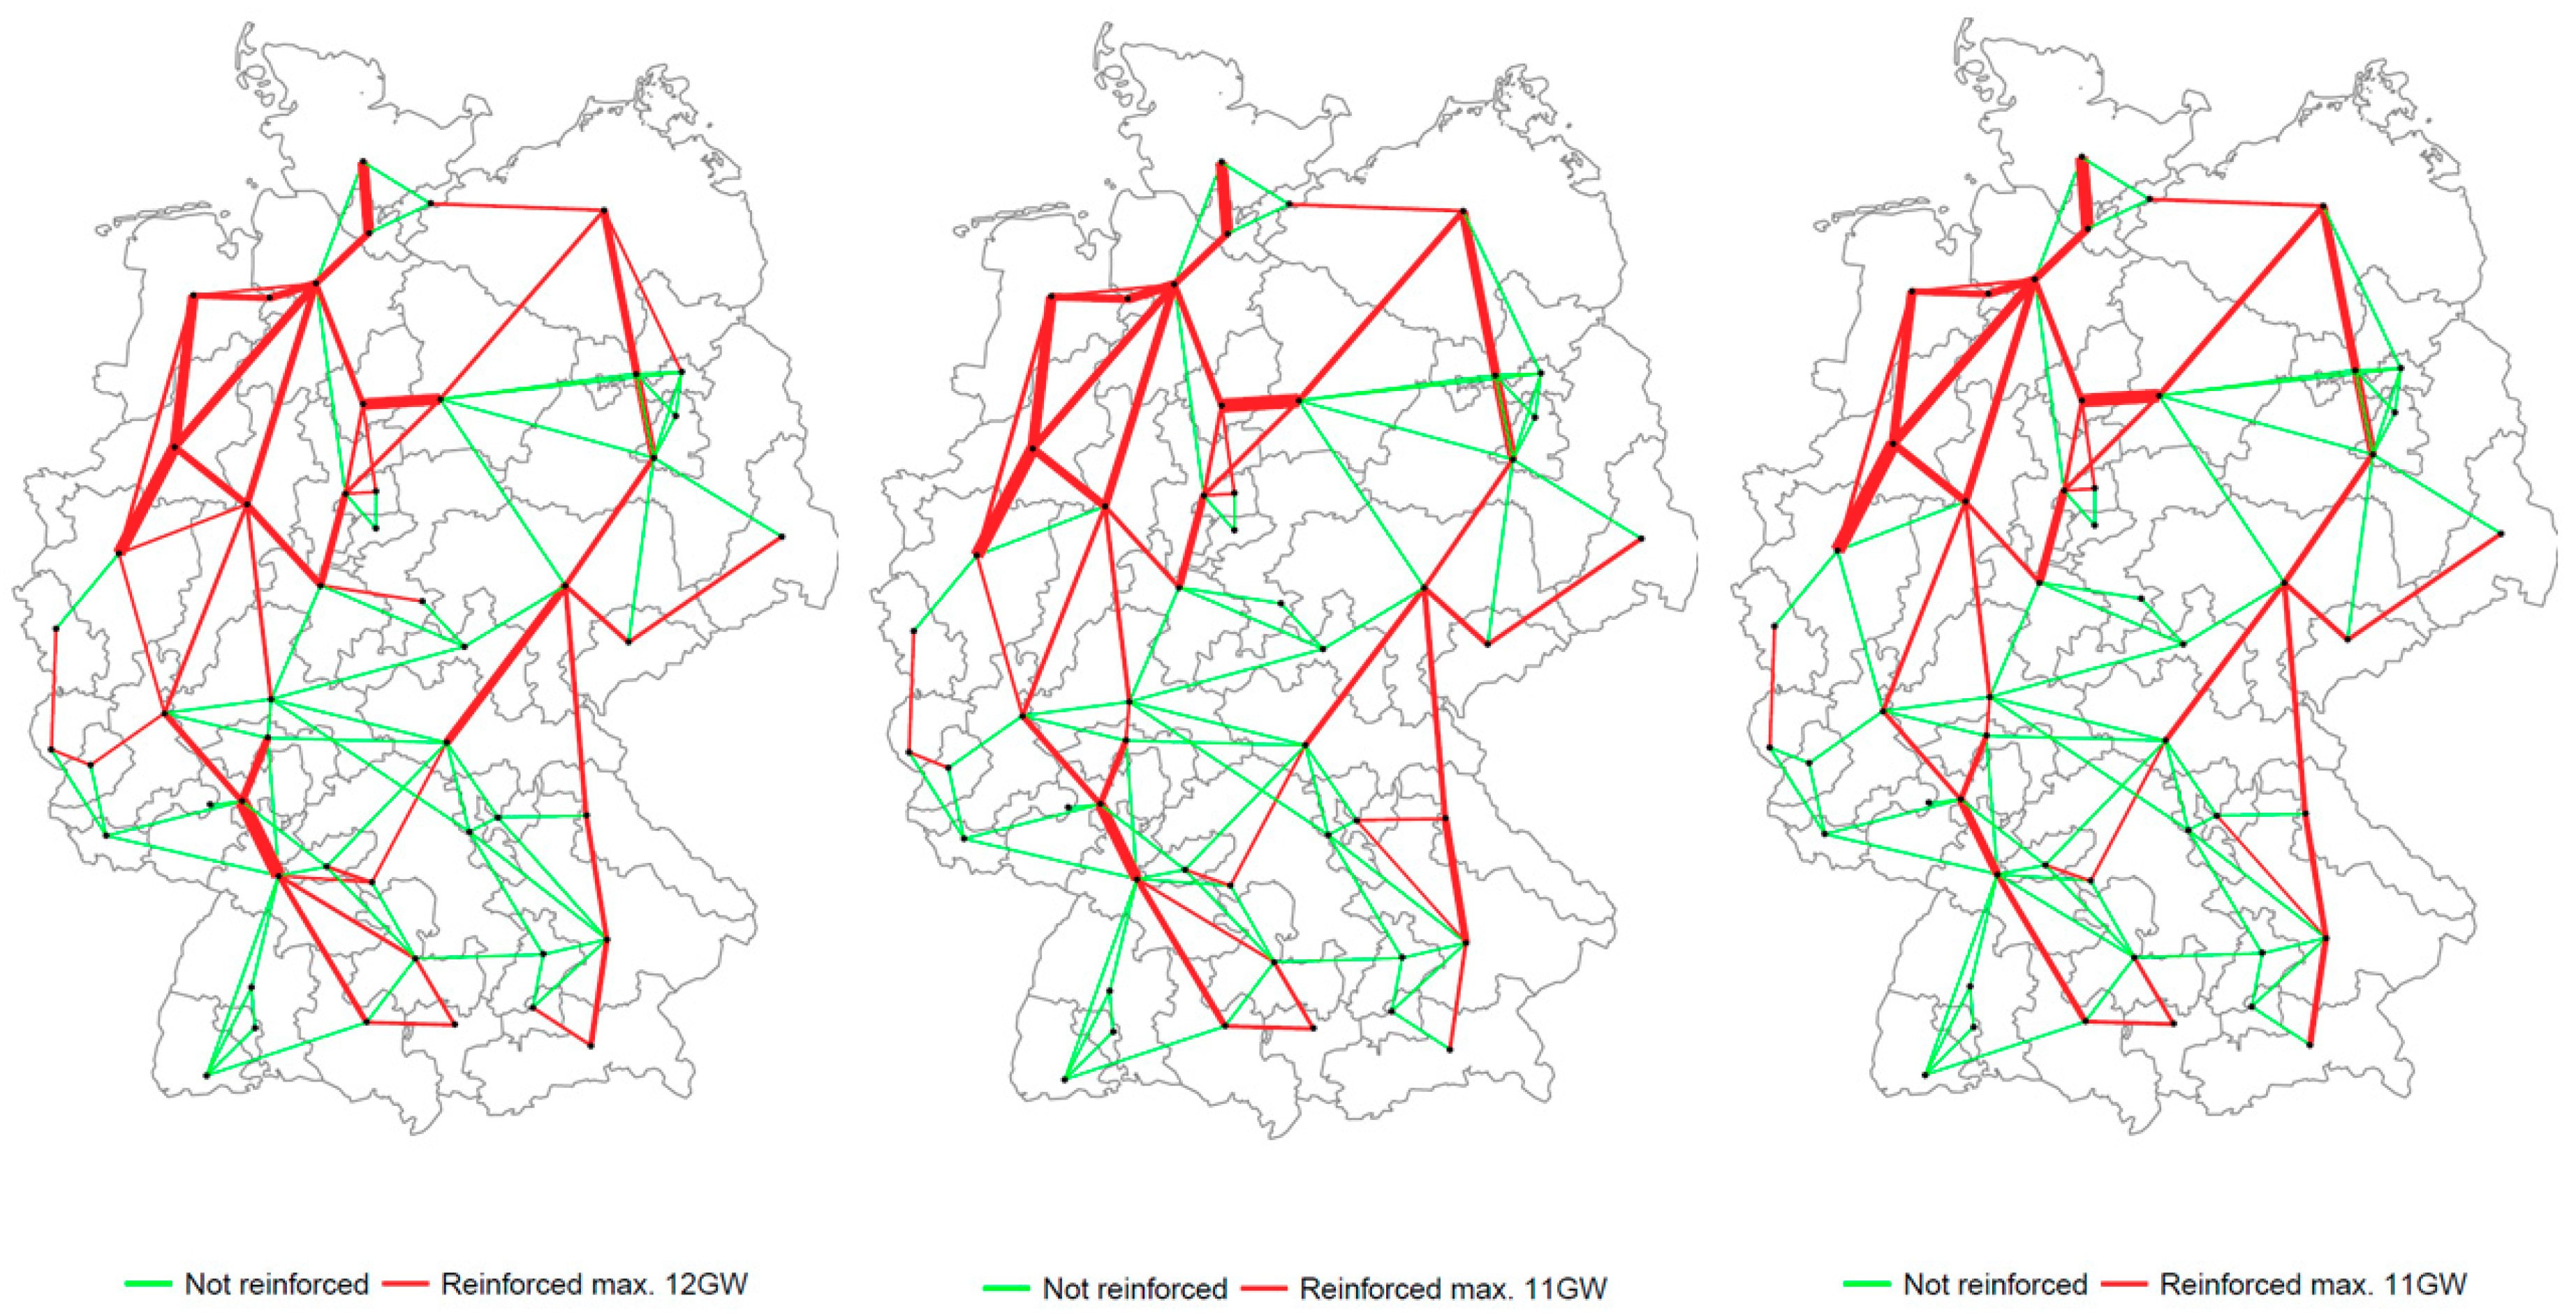
5.3. Regional Distribution of Technologies

The data analysis showed that in all scenarios the distribution of generation and storage technologies shifted towards the load centers. To illustrate these effects, the central “Stagnation” scenario is plotted in Figure 5 displaying the regional technology distribution (storage and generation) and the self-supply shares for the three scenario variants.
The main findings for the central “Stagnation” scenario are: (1) The rate of self-supply increases significantly with regional self-supply shares (in A’ 43, in A 34 and in B 11 regions have self-supply shares below 100%) (2) The North is the main supplier of wind power, while the Centre and South are the main suppliers of PV. (3) Especially in the variant with 100% targets, the installed capacities are harmonized based on the load and the technology mix is diversified. (4) The storage capacities increase by factor 3 and are located close to the RE generation. (5) Grid reinforcement increases in regions that achieve medium self-supply shares (variant A), as the north-south corridors in West and East Germany are strengthened, whereas the 100% target variation leads to reduced grid reinforcement measures, as generation and storage capacities are more evenly distributed (Figure 6).
The analogous plots for the “Completion” decentral scenarios to illustrate the differences between a scenario with today’s demand and the demand in a scenario with a high degree of sector coupling can be found in Figure A1 and Figure A2. In the “Completion” scenario, the effects are not as pronounced as in the “Stagnation” scenario, since the high demand for electricity and the national share of renewables of more than 95% lead to a system in which most of the potential needs have to be exploited anyway. This means that renewable energies are being expanded in all regions. This, in turn, leads to a grid expansion, which is much more pronounced as in the “Stagnation” scenario.

5.4. Model Limitations

In the following, the model approach will be critically reflected. The model covers a high regional resolution and at the same time optimizes the expansion and technology operation including generators, grids and storage facilities. The model requires long computing times (about 3 weeks for a scenario run with the assumptions made). This inevitably means that simplifications must be made in order to keep the model complexity and the associated computing time reasonable. One simplification is, that the model only focuses on the power system. Effects of an increased sector coupling are represented by an increasing demand for electricity but sector coupling effects are not exogeniously included in the model. Regarding the optimized time steps, an approach has been chosen to select representative days (in hourly resolution) as well as extreme hours and grid expansion relevant hours, nevertheless this is a simplification. Additionally part load behaviour is not integrated in the model.
Another point that should be brought up again at this point is the comparison between the scenario variants. To avoid contradictions between national and regional RE targets in the solution space of the optimisation only a minimum national RE share has been implemented, when regional targets are set. In contrast in the variant without regional self-supply targets the national renewable energy share are implementes as a small range to meet the storyline of the CIB. Therefore, the comparison of both variants has to be interpreted in a way that under all scenario assumptions (without regional targets) a system can emerge which is not optimal from the overall system perspective because the national share is forced by the model condition to be in a certain range.

6. Conclusions

The key question of the article is how and whether regional targets of renewable energies, like 100% renewables, affect the entire national electricity system in terms of technology distribution and expansion, overall system costs and power plant operation, in comparison to a cost-optimal designed system on a national basis. Therefore, a methodology is applied that enables the quantification of effects related to the setting of regional self-supply targets using plausible scenarios, designed by CIB analysis, and the power system model ENTIGRIS. This interdisciplinary approach enables the understanding of the system framework conditions and their relations as a combination of qualitative descriptors, such as the acceptance of RE technologies or policy stability, and quantitative descriptors, such as cost and prices or electricity demand variations. This combination allows quantification of the effects on the electricity system in terms of system development (the expansion of generation technologies, storage technologies, and grid expansion) and system operation, ensuring the consistency of scenario assumptions.
The qualitative system analysis has shown that centralization using institutionalization of climate protection is prevented, which for our study means that the specification of decentralization is set, in the following cases: On a global scale medium or high fuel prices and moderately or strongly decreasing CAPEX of generation and storage technologies. On a national scale either positive public acceptance of the energy transition, weak GDP, or decreasing policy stability prohibits a more centralised system. The analysis also highlights the importance of public acceptance for the future energy system, since it is the qualitative descriptor which makes the most variants of other scenarios descriptors disappear from the set of consistent scenarios.
Five scenarios were selected for numerical power system modelling, ranging from a future in which stagnation and scepticism are dominating and a future in which completion of renewable energies and enthusiasm is dominated. In these scenarios, the share of RE in the electricity supply of Germany in the year 2050, ranges from 60% to 95%. Thus, from either side of the spectrum, one scenario with increasing as well as one with decreasing regional institutionalization was selected. To isolate the effect of regional self-supply targets from the varying contexts, each of the five scenarios were computed once with regional renewables energy targets and once with only national targets. The main effects resulting from scenario calculations containing regional renewable self-supply targets are:
(1)
If regional self-supply targets are set, the regional distribution of generation capacities is strongly influenced compared to the national target setting. This means that the regional generation capacities are closer to the respective demand, which in most cases leads to a reduced grid reinforcement, but higher curtailment rates of renewables. The findings of [30] are supported since our analysis also found that regional self-supply targets lead to significant differences in grid planning.
(2)
In all scenarios, the regional targets lead to stronger exploitation of the PV rooftop potential, which is in line with [14]. In the comparison variants with the national targets, on the other hand, ground-mounted PV systems were preferred due to their lower costs.
(3)
The effects can be divided into two different scenario categories (stagnation and adaption as well as completion). In “stagnation” scenarios, the regional self-sufficiency targets lead to an increase in the national renewable energy share. The additional costs due to an increase of renewable energies and storage capacity, which was also found by [29,30] are more than offset by the savings in fuel costs and CO2 costs in comparison to their reference scenario achieving smaller shares of 60–80% of national renewable electricity. The lower costs do not apply generally and are also in contrast to [29,30], who result in higher system costs. But in cases where for example low acceptance hinders the system to exploit more renewable potential nationally, the scenario results show that the costs can be lower if regional efforts for renewables are undertaken. This leads to the conclusion that regional self-supply targets can be beneficial to the system, which is in accordance with [3], who found that the opportunities of distributed energy systems are on average greater than the challenges these systems face.
(4)
In a future system, in which enthusiasm and high shares of renewables are also targeted nationally (depicted by “Completion” scenarios), the regional self-supply targets only lead to marginal effects in the power system: The grid expansion is reduced, but curtailment increases, while the cost increases slightly (by 2%). The findings of [28], who conclude that the system cost is only slightly higher, correspond to the “Completion” scenarios. Refs. [17,30] result in significantly higher system costs. This is not so pronounced in our study. In other words, if high renewable energy shares are the national target, it makes no significant difference, if regional targets are set or not. Because a large expansion of renewable capacity, storage facilities, and grids is necessary anyway to meet the demand for electricity with high renewable targets. Therefore, even in such a future, regional renewable energy targets would not entail significant disadvantages for the system.
In summary, regional targets for renewable energy can either have only little systemic impact or the system can even benefit greatly, as the overall share of renewable energy can be increased by regional targets, which could even save costs, so that the conclusion can be drawn that political support for regional objectives seems appropriate.

Author Contributions

Conceptualization, C.S. and W.H.; methodology, C.S. and W.H.; software C.S.; validation, C.S. and W.H.; formal analysis C.S. and W.H.; investigation W.H.; data curation C.S.; writing—original draft preparation, C.S. and W.H.; writing—review and editing, C.S. and W.H.; visualization, C.S. and W.H.; project administration, C.S.; funding acquisition, C.S. and W.H. All authors have read and agreed to the published version of the manuscript.

Funding

This research was funded by the Federal Ministry of Education and Research—BMBF, grant number 03EK3557A”.

Acknowledgments

We thank Shivenens Shammugam, Christopn Kost and Sven Längle for the many helpful discussions and support in the project. We would also like to thank the four anonymous reviewers for their helpful comments.

Conflicts of Interest

The authors declare no conflict of interest.

Appendix A

Table A1. Overview of descriptors and variants.
DescriptorsVariants
National renewable energy sharelow (60%)medium (~80%)high (~95%)
Global fuel priceslow (~50 $/bl)medium (~100 $/bl)high (~240 $/bl)
National CO2-pricelow (20 €/t)medium (80 €/t)high (200 €/t)
National GDPweak (0.6%/a)moderate (1.4%/a)strong (2.0%/a)
Electricity demand in 2050decreasing (500 TWh)increasing (800 TWh)strongly increasing (1.000 TWh)
Global CAPEX generation technologiesSee Table A2See Table A2See Table A2
Global CAPEX storagestrong decrease
(Batteries:
2030: 250 €/kWh
2050: 100 €/kWh
Power-to-Gas(H2):
2030: 1.140 €/kW
2050: 200 €/kW)
moderate decrease
(Batteries:
2030: 400 €/kWh
2050: 200 €/kWh
Power-to-Gas(H2):
2030: 1.370 €/kW
2050: 350 €/kW)
weak decrease
(Batteries:
2030: 550 €/kWh
2050: 300 €/kWh
Power-to-Gas(H2):
2030: 1.610 €/kW
2050: 500 €/kW)
Self-supply with electricity (Low potential regions)stagnation
At least 75% of the regions have a self-supply rate above 5% by 2050
medium increase
The regions have an average self-supply rate of ~35% by 2050
strong increase
The regions have an average self-supply rate of 80% by 2050
Self-supply with electricity (Medium potential regions)stagnation
At least 75% of the regions have a self-supply rate above 11%
medium increase
The regions have an average self-supply of 60% by 2050
strong increase
The regions have an average self-supply rate of 100% by 2050
Self-supply with electricity (High potential regions)stagnation
At least 75% of the regions have a self-supply rate above 50% by 2050
medium increase
All regions have an self-supply rate of at least 100% by 2050
strong increase
All regions have a self-supply rate above 200% by 2050
Public acceptance of energy transitionpositivebalancednegative
Policy stabilitydecreasingconstantincreasing
Planning legislationfocus on speeding upfocus on public acceptance and legitimationdominated by lobby interestsfocus on compromise between speeding up and public acceptance
Importance of regional added valueincreasingdecreasing
Regional institutionalisation of climate protectioncentralization of energy politicsbalanced developmentre-communalisation of energy politics
Regional communitarisationdecreasingincreasing
Table A2. Assumptions of CAPEX cost per technology in the different descriptor variants in €2018/kW.
Descriptor Variant.ConstantModerate DecreaseStrong Decrease
Technology/Year202020302050202020302050202020302050
biogas300020001500300020001500300020001500
ccgt700
hydro4800
ocgt500 375
pv-gm700 618537373552403107
pv-r1100 971842583897693286
wind-onshore1528144314001478129312001378993800
Table A3. Assumptions of fix cost per technology.
TechnologyYearValueUnitSourceComment
hard coal power plant2000–20190.03% of CAPEX[43]
hard coal power plant2020–20500.026% of CAPEX[43]
battery2000–20500.02% of CAPEX[44]related to discharging unit
biomass2000–20500.04% of CAPEX[45]
combined cycle gas turbine2000–20500.03% of CAPEX[43]1–4% of CAPEX (compared with [45] lower range considered)
lignite power plant2000–20500.031% of CAPEX[43]
photovoltaics ground-mounted2000–20500.025% of CAPEX[45]
photovoltaics on rooftops2000–20500.025% of CAPEX[45]
open cycle gas turbine2000–20190.015% of CAPEX[43]1–4% of CAPEX (compared with [45] lower range considered)
open cycle gas turbine2020–20500.035% of CAPEX[43]1–4% of capex (compared with [45] lower range considered)
run of river and water storage2000–205011.92015/kW/a[46]10.40 GBP per kW
uranium power plant2000–205068.52015/kW/a[46]60.00 GBP per kW
pump storage2000–2050112016/kW/a[44]related to discharging unit
wind onshore2000–2050322018/kW/a [45,47] € per MW Windreport is between 30–60 with variable cost share of 0.5 cent and 1600 VLH an average of 40 € per mw is calculated
Table A4. Variable cost assumptions per technology.
TechnologyValueUnitSourceComment
uranium power plant5.72015/MWh [46]0.0005 GBP per kWh
pump storage0.52016/MWh[44]
wind onshore52018/MWh[45,47]
open cycle gas turbine32018/MWh[45]
hard coal power plant52018/MWh[45]
combined cycle gas turbine42018/MWh[45]
lignite power plant52018/MWh[45]
Table A5. Cost assumptions for the grid.
Grid MeasureValueUnitSource
Upgrade 220 to 380 kV 200,0002015/km [48]
380 kV on existing system200,0002015/km[48]
New corridor with 380 kV line1,500,0002015/km[48]
Variable transmission cost3.7ct/kWh
Figure A1. Self-supply share, regional distribution of generation technologies and storage capacities in the year 2050 in the scenario “Completion and enthusiasm—decentral” for the variant A’ (no self-supply targets) (left), A (middle) and B (right).
Energies 13 04695 g0a1
Figure A2. Overlaying grid expansion in the year 2050 in the scenario “Completion and enthusiasm—decentral” for the variants no self-supply targets (left), plausible self-supply targets (middle) and 100% self-supply targets (right).
Energies 13 04695 g0a2

References

  1. European Union. Paris Agreement. Available online: https://ec.europa.eu/clima/policies/international/negotiations/paris_en (accessed on 3 August 2020).
  2. European Comission. Communication from the commission to the European Parliament, the European Council, the Council, the European Economic and Social Committee and the Committee of the Regions. The European Green Deal. 2019. Available online: https://eur-lex.europa.eu/legal-content/EN/TXT/?uri=COM%3A2019%3A640%3AFIN (accessed on 30 July 2020).
  3. ICLEI—Local Governments for Sustainability. Local and Regional Governments and ICLEI. Available online: https://iclei.org/en/our_network.html (accessed on 20 August 2020).
  4. Hohmeyer, O.H.; Bohm, S. Trends toward 100% renewable electricity supply in Germany and Europe: A paradigm shift in energy policies. Wires Energy Environ. 2015, 4, 74–97. [Google Scholar] [CrossRef]
  5. Senkpiel, C.; Shammugam, S.; Biener, W.; Hussein, N.S.; Kost, C.; Kreifels, N.; Hauser, W. Concept of evaluating chances and risks of grid autarky. In Proceedings of the 2016 13th International Conference on the European Energy Market (EEM), Porto, Portugal, 6–9 June 2016; IEEE: Piscataway, NJ, USA, 2016; pp. 1–5, ISBN 978-1-5090-1298-5. [Google Scholar]
  6. Hauber, J.; Ruppert-Winkel, C. Moving towards Energy Self-Sufficiency Based on Renewables: Comparative Case Studies on the Emergence of Regional Processes of Socio-Technical Change in Germany. Sustainability 2012, 4, 491–530. [Google Scholar] [CrossRef] [Green Version]
  7. Waenn, A.; Connolly, D.; Gallachóir, B.Ó. Investigating 100% renewable energy supply at regional level using scenario analysis. Int. J. Sustain. Energy Plan. Manag. 2014, 3, 21–32. [Google Scholar] [CrossRef]
  8. Jurasz, J.K.; Dąbek, P.B.; Campana, P.E. Can a city reach energy self-sufficiency by means of rooftop photovoltaics? Case study from Poland. J. Clean. Prod. 2020, 245, 118813. [Google Scholar] [CrossRef]
  9. Doering, M. Assessment of Storage Options for Reduction of Yield Losses in a Region with 100% Renewable Electricity. Energy Procedia 2015, 73, 218–230. [Google Scholar] [CrossRef] [Green Version]
  10. Morel, J.; Obara, S.Y.; Morizane, Y. Operation Strategy for a Power Grid Supplied by 100% Renewable Energy at a Cold Region in Japan. J. Sustain. Dev. Energy Water Environ. Syst. 2014, 2, 270–283. [Google Scholar] [CrossRef]
  11. Child, M.; Bogdanov, D.; Breyer, C. The Baltic Sea Region: Storage, grid exchange and flexible electricity generation for the transition to a 100% renewable energy system. Energy Procedia 2018, 155, 390–402. [Google Scholar] [CrossRef]
  12. Weimer-Jehle, W.; Buchgeister, J.; Hauser, W.; Kosow, H.; Naegler, T.; Poganietz, W.; Pregger, T.; Prehofer, S.; von Recklinghausen, A.; Schippl, J.; et al. Context scenarios and their usage for the construction of socio-technical energy scenarios. Energy 2016, 111, 956–970. [Google Scholar] [CrossRef]
  13. Deutschle, J.; Hauser, W.; Sonnberger, M.; Tomaschek, J.; Brodecki, L.; Fahl, U. Energie-Autarkie und Energie-Autonomie in Theorie und Praxis. Z. Energ. 2015, 39, 151–162. [Google Scholar] [CrossRef]
  14. Schmidt, J.; Schönhart, M.; Biberacher, M.; Guggenberger, T.; Hausl, S.; Kalt, G.; Leduc, S.; Schardinger, I.; Schmid, E. Regional energy autarky: Potentials, costs and consequences for an Austrian region. Energy Policy 2012, 47, 211–221. [Google Scholar] [CrossRef]
  15. Engelken, M.; Römer, B.; Drescher, M.; Welpe, I. Transforming the energy system: Why municipalities strive for energy self-sufficiency. Energy Policy 2016, 98, 365–377. [Google Scholar] [CrossRef]
  16. Ecker, F.; Hahnel, U.J.J.; Spada, H. Promoting Decentralized Sustainable Energy Systems in Different Supply Scenarios: The Role of Autarky Aspiration. Front. Energy Res. 2017, 5, 11. [Google Scholar] [CrossRef] [Green Version]
  17. Brodecki, L.; Tomaschek, J.; Wiesmeth, M.; Gutekunst, F.; Siebenlist, A.; Salah, A.; Baumann, M.; Graf, R.; Brethauer, L.; Horn, R.; et al. Analyse des Energie-Autarkiegrades unterschiedlich großer Bilanzräume mittels integrierter Energiesystemmodellierung. Forschungsbericht. 2017. Available online: https://www.google.com/url?sa=t&rct=j&q=&esrc=s&source=web&cd=1&ved=2ahUKEwjnyYmSmKXjAhUBaFAKHS5eCuIQFjAAegQIARAC&url=http%3A%2F%2Ffachdokumente.lubw.baden-wuerttemberg.de%2Fservlet%2Fis%2F122354%2Fbwe13033_bwe13034_final.pdf%3Fcommand%3DdownloadContent%26filename%3Dbwe13033_bwe13034_final.pdf%26FIS%3D203&usg=AOvVaw3P4buL_QB6BuCKd0TKx_bT (accessed on 8 July 2019).
  18. Seidl, R.; Von Wirth, T.; Krütli, P. Social acceptance of distributed energy systems in Swiss, German, and Austrian energy transitions. Energy Res. Soc. Sci. 2019, 54, 117–128. [Google Scholar] [CrossRef]
  19. Sovacool, B.K. Diversity: Energy studies need social science. Nature 2014, 511, 529–530. [Google Scholar] [CrossRef]
  20. Ringkjøb, H.-K.; Haugan, P.M.; Solbrekke, I.M. A review of modelling tools for energy and electricity systems with large shares of variable renewables. Renew. Sustain. Energy Rev. 2018, 96, 440–459. [Google Scholar] [CrossRef]
  21. Alcamo, J. Scenarios as Tools for International Environmental Assessments; The Official Publications Office of the European Communities: Luxembourg, 2001. [Google Scholar]
  22. Weimer-Jehle, W. Cross-impact balances: A system-theoretical approach to cross-impact analysis. Technol. Forecast. Soc. Chang. 2006, 73, 334–361. [Google Scholar] [CrossRef]
  23. Kosow, H. The Best of both Worlds? An Exploratory Study on Forms and Effects of New Qualitative-Quantitative Scenario Methodologies. 2016. Available online: https://elib.uni-stuttgart.de/bitstream/11682/9032/1/Kosow_2016_The_best_of_both_worlds_Dissertation.pdf (accessed on 28 March 2019).
  24. Schweizer, V.J.; O’Neill, B.C. Systematic construction of global socioeconomic pathways using internally consistent element combinations. Clim. Chang. 2014, 122, 431–445. [Google Scholar] [CrossRef] [Green Version]
  25. Drakes, C.; Laing, T.; Kemp-Benedict, E.; Cashman, A. Caribbean Scenarios 2050: GoLoCarSce Report. Cermes Tech. Rep. 2017, 82, 33. [Google Scholar]
  26. Vögele, S.; Rübbelke, D.; Govorukha, K.; Grajewski, M. Socio-technical scenarios for energy-intensive industries: The future of steel production in Germany. Clim. Chang. 2019, 45, 786. [Google Scholar] [CrossRef]
  27. Weimer-Jehle, W.; Prehofer, S.; Vögele, S.; Buchgeister, J.; Hauser, W.; Kopfmüller, J.; Naegler, T.; Poganietz, W.-R.; Pregger, T.; Rösch, C.; et al. Context scenarios -A concept for coping with context uncertainty and complexity and its applications in the Helmholtz Research Alliance ENERGY-TRANS. In Die Energiewende Verstehen –Orientieren –Gestalten. Erkenntnisse aus der Helmholtz-Allianz ENERGY-TRANS.; Schippl, J., Grunwald, A., Renn, O., Eds.; Nomos Verlagsgesellschaft: Baden-Baden, Germany, 2017. (In German) [Google Scholar]
  28. Breyer, C.; Müller, B.; Möller, C.; Gaudchau, E.; Schneider, L. Vergleich und Optimierung von zentral und dezentral orientierten Ausbaupfaden zu einer Stromversorgung aus Erneuerbaren Energien in Deutschland. 2013. Available online: https://www.bvmw.de/fileadmin/pdf-archiv/Studie_zur_dezentralen_Energiewende.pdf.pdf (accessed on 11 January 2019).
  29. Peter, S. Modellierung Einer Vollständig auf Erneuerbaren Energien Basierenden Stromerzeugung im Jahr 2050 in Autarken, Dezentralen Strukturen. Climate Change. 2013. Available online: http://www.uba.de/uba-info-medien/4572.html (accessed on 25 January 2019).
  30. Matthes, F.C.; Flachsbarth, F.; Vogel, M.; Cook, V. Decentralization, Regionalization and Power Lines. Metastudy about Assumptions, Insights and Narratives. 2018. Available online: https://www.oeko.de/fileadmin/oekodoc/Decentralization-regionalization-and-power-lines.pdf (accessed on 11 January 2019).
  31. Kubli, M.; Ulli-Beer, S. Decentralisation dynamics in energy systems: A generic simulation of network effects. Energy Res. Soc. Sci. 2016, 13, 71–83. [Google Scholar] [CrossRef]
  32. Weimer-Jehle, W.; Kosow, H. Gesellschaftliche Kontextszenarien als Ausgangspunkt für modellgestützte Energieszenarien; KIT Scientific Publishing: Karlsruhe, Germany, 2011. [Google Scholar]
  33. Weimer-Jehle, W. Key Figures Used in the Analysis of CIB Scenarios: Cross-Impact Balance Analysis—Guideline no. 4. Available online: http://cross-impact.de/Ressourcen/Guideline_No_4.pdf (accessed on 28 March 2019).
  34. Le Roux, B.; Rouanet, H. Multiple Correspondence Analysis; SAGE Publications, Inc.: Thousand Oaks, CA, USA, 2010; ISBN 9781412968973. [Google Scholar]
  35. Fraunhofer, I.S.E. Power System Model for Expansion Planning and Unit-Commitment. Available online: https://www.ise.fraunhofer.de/en/business-areas/energy-system-technology/energy-system-analysis/energy-system-models-at-fraunhofer-ise/entigris.html (accessed on 14 August 2020).
  36. Kost, C. Renewable Energy in North Africa: Modelling of Future Electricity Scenarios and the Impact on Manufacturing and Employment. 2015. Available online: http://publica.fraunhofer.de/eprints/urn_nbn_de_0011-n-3563620.pdf (accessed on 27 March 2017).
  37. Kost, C.; Hartmann, N.; Senkpiel, C.; Schlegl, T.; Zampara, M.; Capros, P. Resdegree. Towards an Energy System in Europe Based on Renewables—Model Based Analysis of Greece and Germany by Coupling a European wide Demand and Supply Model (PRIMES) with a Regional and Temporal High Resolution Bottom-up Investment and Unit-Commitment Model (RESlion). 2015. Available online: http://www.e3mlab.eu/e3mlab/index.php?option=com_content&view=article&id=513:2014-2015-qres-degreeq&catid=38:energy-policy-projects&Itemid=59&lang=en (accessed on 21 August 2020).
  38. Reeg, M.; Nienhaus, K.; Pfenning, U.; Roloff, N.; Hauser, W.; Wassermann, S.; Weimer-Jehle, W.; Klann, U.; Kast, T. AMIRIS—An Agent-based Simulation Model for the Analysis of Market Integration of Renewable Energy under various Policy Frameworks. In Proceedings of the 2012 23rd International Workshop on Database and Expert Systems Applications, Vienna, Austria, 3–7 September 2012. [Google Scholar]
  39. Pfenninger, S.; Staffell, I. Long-term patterns of European PV output using 30 years of validated hourly reanalysis and satellite data. Energy 2016, 114, 1251–1265. [Google Scholar] [CrossRef] [Green Version]
  40. Hülk, L.; Wienholt, L.; Cußmann, I.; Müller, U.P.; Matke, C.; Kötter, E. Allocation of annual electricity consumption and power generation capacities across multiple voltage levels in a high spatial resolution. Int. J. Sustain. Energy Plan. Manag. 2017, 13, 79–92. [Google Scholar] [CrossRef]
  41. Biener, W.; Senkpiel, C.; Shammugam, S.; Garcia Rosas, K.R.; Linke, M.; Eibl, O. Impact of grid reduction on modelling accuracy of line usage rates. J. Phys. Conf. Ser. 2018, 977, 12001. [Google Scholar] [CrossRef]
  42. Bauckhage, C. NumPy/SciPy Recipes for Data Science: K-Medoids Clustering; Technical Report; University of Bonn: Bonn, Germany, 2015. [Google Scholar]
  43. Görner, K.; Sauer, D.U. Konventionelle Kraftwerke. Technologiesteckbrief zur Analyse, Flexibilitätskonzepte für die Stromversorgung 2050. 2017. Available online: http://www.acatech.de/fileadmin/user_upload/Baumstruktur_nach_Website/Acatech/root/de/Publikationen/Materialien/ESYS_Technologiesteckbrief_Konventionelle_Kraftwerke.pdf (accessed on 28 March 2018).
  44. Jülch, V. Comparison of electricity storage options using levelized cost of storage (LCOS) method. Appl. Energy 2016, 183, 1594–1606. [Google Scholar] [CrossRef]
  45. Kost, C.; Shammugam, S.; Jülch, V.; Nguyen, H.-T.; Schlegl, T. Studie: Stromgestehungskosten Erneuerbare Energien (März 2018). 2018. Available online: https://www.ise.fraunhofer.de/content/dam/ise/de/documents/publications/studies/DE2018_ISE_Studie_Stromgestehungskosten_Erneuerbare_Energien.pdf (accessed on 22 March 2018).
  46. Pfenninger, S.; Keirstead, J. Renewables, nuclear, or fossil fuels? Scenarios for Great Britain’s power system considering costs, emissions and energy security. Appl. Energy 2015, 152, 83–93. [Google Scholar] [CrossRef] [Green Version]
  47. Fraunhofer, I.W.E.S. Windenergie Report Deutschland 2016. 2017. Available online: http://publica.fraunhofer.de/eprints/urn_nbn_de_0011-n-4456098.pdf (accessed on 13 October 2017).
  48. ÜNB. Netzentwicklungsplan Strom 2025, Version 2015. 2015. Available online: https://www.netzentwicklungsplan.de/sites/default/files/paragraphs-files/NEP_2025_1_Entwurf_Teil1_0.pdf (accessed on 27 April 2018).
Figure 1. Position of the five selected scenarios among the 2236 consistent scenarios on the MCA-Plot. Fully consistent scenarios are marked by x.
Energies 13 04695 g001
Figure 2. Simplified scheme of the ENTIGRIS power system model [35].
Energies 13 04695 g002
Figure 3. Potential regional self-supply for assumed 1000 TWh electricity demand (left) and the clustered regions for the model according to the defined self-supply category (high–medium–low) (right).
Energies 13 04695 g003
Figure 4. Cumulated total system cost by cost component, scenario, and variant (A’, A and B).
Energies 13 04695 g004
Figure 5. Self-supply share, regional distribution of generation technologies and storage capacities in the year 2050 in the scenario “Stagnation and scepticism—central” for the variant A’ (left), A (middle) and B (right).
Energies 13 04695 g005
Figure 6. Overlaying grid expansion in 2050 in the scenario “Stagnation and scepticism—central” for the variants A’ (left), A (middle), and B (right). Green lines indicate no grid reinforcement; red indicates that the grid was reinforced.
Energies 13 04695 g006
Table 1. The five selected plausible scenarios for computation.
Scenario Name
Stagnation and Skepticism—Central
(1)
Stagnation and Skepticism—Decentral
(2)
Adaption and Optimism
(3)
Completion and Enthusiasm—Central
(4)
Completion and Enthusiasm—Decentral
(5)
ConsistencyFully ConsistentFully Consistent Fully ConsistentInconsistency of 1Fully Consistent
Coupling Descriptors
National renewable energy (RE) share in 2050low (60%)low (60%)medium (80%)high (95%)high (95%)
Global Fuel priceslowlowhighmediumlow
National CO2-pricehigh (200 €/ton)low (20 €/ton)medium (80 €/ton)medium (80 €/ton)high (200 €/ton)
National GDPstrongweakstrongmoderatestrong
National electricity demanddecreasing
(500 TWh)
decreasing
(500 TWh)
increasing
(800 TWh)
increasing
(800 TWh)
strong increase
(1.000 TWh)
Global CAPEX generation technologiesconstantmoderate decreaseconstantmoderate decreasestrong decrease
Global CAPEX storagelow decreaselow decreaselow decreasestrong decreasestrong decrease
Self-supply with electricity (low potential regions)stagnationmedium—15%medium—15%medium—15%medium—15%
Self-supply with electricity (medium potential regions)medium—60%medium—60%medium—60%medium—60%high—100%
Self-supply with electricity (high potential regions)medium—100%medium—100%high—200%high—200%high—200%
Qualitative Descriptors
Public acceptance of energy transitionnegativenegativepositivepositivepositive
Policy stabilityhigherlowhigherhigherhigher
Planning legislationspeeding uplegitimation/acceptancelegitimation/acceptancespeeding uplegitimation/acceptance
Importance of regional added valuedecreasingincreasingincreasingdecreasingincreasing
Institutionalization of climate protectioncentralizationre-municipalisationre-municipalisationcentralizationre-municipalisation
Regional communitarisationdecreasingenhancementenhancementdecreasingenhancement
Table 2. Modelled scenario variations.
Scenario VariationRegional Self-Supply TargetsNational RE Targets
A’Without targetsDefined as range (target + 5%)
AWith plausible targets (Table 1) (minimum constraint)Defined as a minimum target
BWith 100% targets (minimum constraint)Defined as a minimum target
Table 3. Percentage deviation of the scenarios (A/A’ | B/A’) with and without self-supply targets for general energy system parameter.
Percentage Deviation ofStagnation and Skepticism—CentralStagnation and Skepticism—DecentralAdaption and OptimismCompletion and Enthusiasm—CentralCompletion and Enthusiasm—Decentral
A’ABA’ABA’ABA’ABA’AB
National RE-Share in 2050 [%]659899618890859999999999989999
Installed generation capacity (in 2050)1.32 ** | 1.49 **1.22 ** | 1.34 **1.12 ** | 1.14 **1.01 | 1.001.03 | 1.02
Installed flexibility capacity (in 2050)3.16 *** | 3.29 ***1.92 *** | 1.93 ***2.16 *** | 2.10 ***0.99 | 0.991.00 | 1.00
CO2-emissions (all years)0.23 *** | 0.21 ***0.51 *** | 0.50 ***0.24 *** | 0.23 ***1.00 | 1.001.01 | 1.00
Curtailment (in 2050)9.10 *** | 10.11 ***2.79 *** | 3.68 ***1.65 *** | 1.68 ***1.03 | 0.941.18 ** | 1.13 **
Reinforced Grid capacity1.09 * | 0.64 **1.01 | 0.36 **0.76 ** | 0.64 **0.79 ** | 0.63 **0.87 ** | 0.86 **
Number of reinforced grid lines 1.07 *| 0.64 **0.98 ** | 0.33 ***0.81 ** | 0.63 **0.79 ** | 0.63 **0.89 ** | 0.86 **
Total system cost0.66 ** | 0.69 **0.85 ** | 0.90 *0.50 *** | 0.50 ***1.00 | 1.021.02 | 1.02
Deviations ≥ 1.5 are marked with ***; deviations ≥ 1.1 are marked with **; deviations ≥ 1.05 < 1.1 are marked with *.
Table 4. Shares of electricity generation per technology in 2050 in percent for the A’, A, and B variant.
Generation Share in 2050Stagnation and Skepticism—CentralStagnation and Skepticism—DecentralAdaption and OptimismCompletion and Enthusiasm—CentralCompletion and Enthusiasm—Decentral
Scenario Variant A’ABA’ABA’ABA’ABA’AB
biogas0.00.00.00.02.52.20.00.00.30.00.00.00.00.00.0
ccgt35.00.10.128.45.55.08.70.30.30.30.30.30.10.10.1
hardcoal0.11.61.08.34.63.54.90.20.20.60.80.61.51.01.1
hydropower4.84.74.74.74.84.73.03.03.03.03.03.02.42.42.4
lignite0.00.00.53.20.00.02.00.30.30.00.00.00.00.00.0
PV gm12.215.820.023.422.619.219.425.824.035.835.831.037.935.133.1
PV roof0.00.03.60.00.34.10.00.32.20.00.94.00.02.94.2
wind onshore47.977.770.132.159.761.362.070.169.760.359.361.158.158.559.2
Curtailment (% of total generation)17726747766691111
Storage use(% of total generation)091005561212161616161616
Table 5. Modelled total and specific system cost (related to the sum of electricity demand over the years 2020–2050) from 2020 until 2050 for all scenarios for the scenario variants A, A’ and B.
Stagnation and skepticism—CentralStagnation and skepticism—DecentralAdaption and OptimismCompletion and Enthusiasm—CentralCompletion and Enthusiasm—Decentral
Scenario VariantA’ABA’ABA’ABA’ABA’AB
Cost in billion €20189676346686265335631894940953721724733775788788
Cost €2018/capita/a389255269252215227763378384290292295312317317
Cost in €cent2018/kWh6.54.24.54.23.63.89.74.84.93.73.73.83.43.53.5

