Validation and Evaluation of an Estimation Method for Deep Thermal Structures Using an Activity Index in Major Geothermal Fields in Northeastern Japan


Abstract
1. Introduction
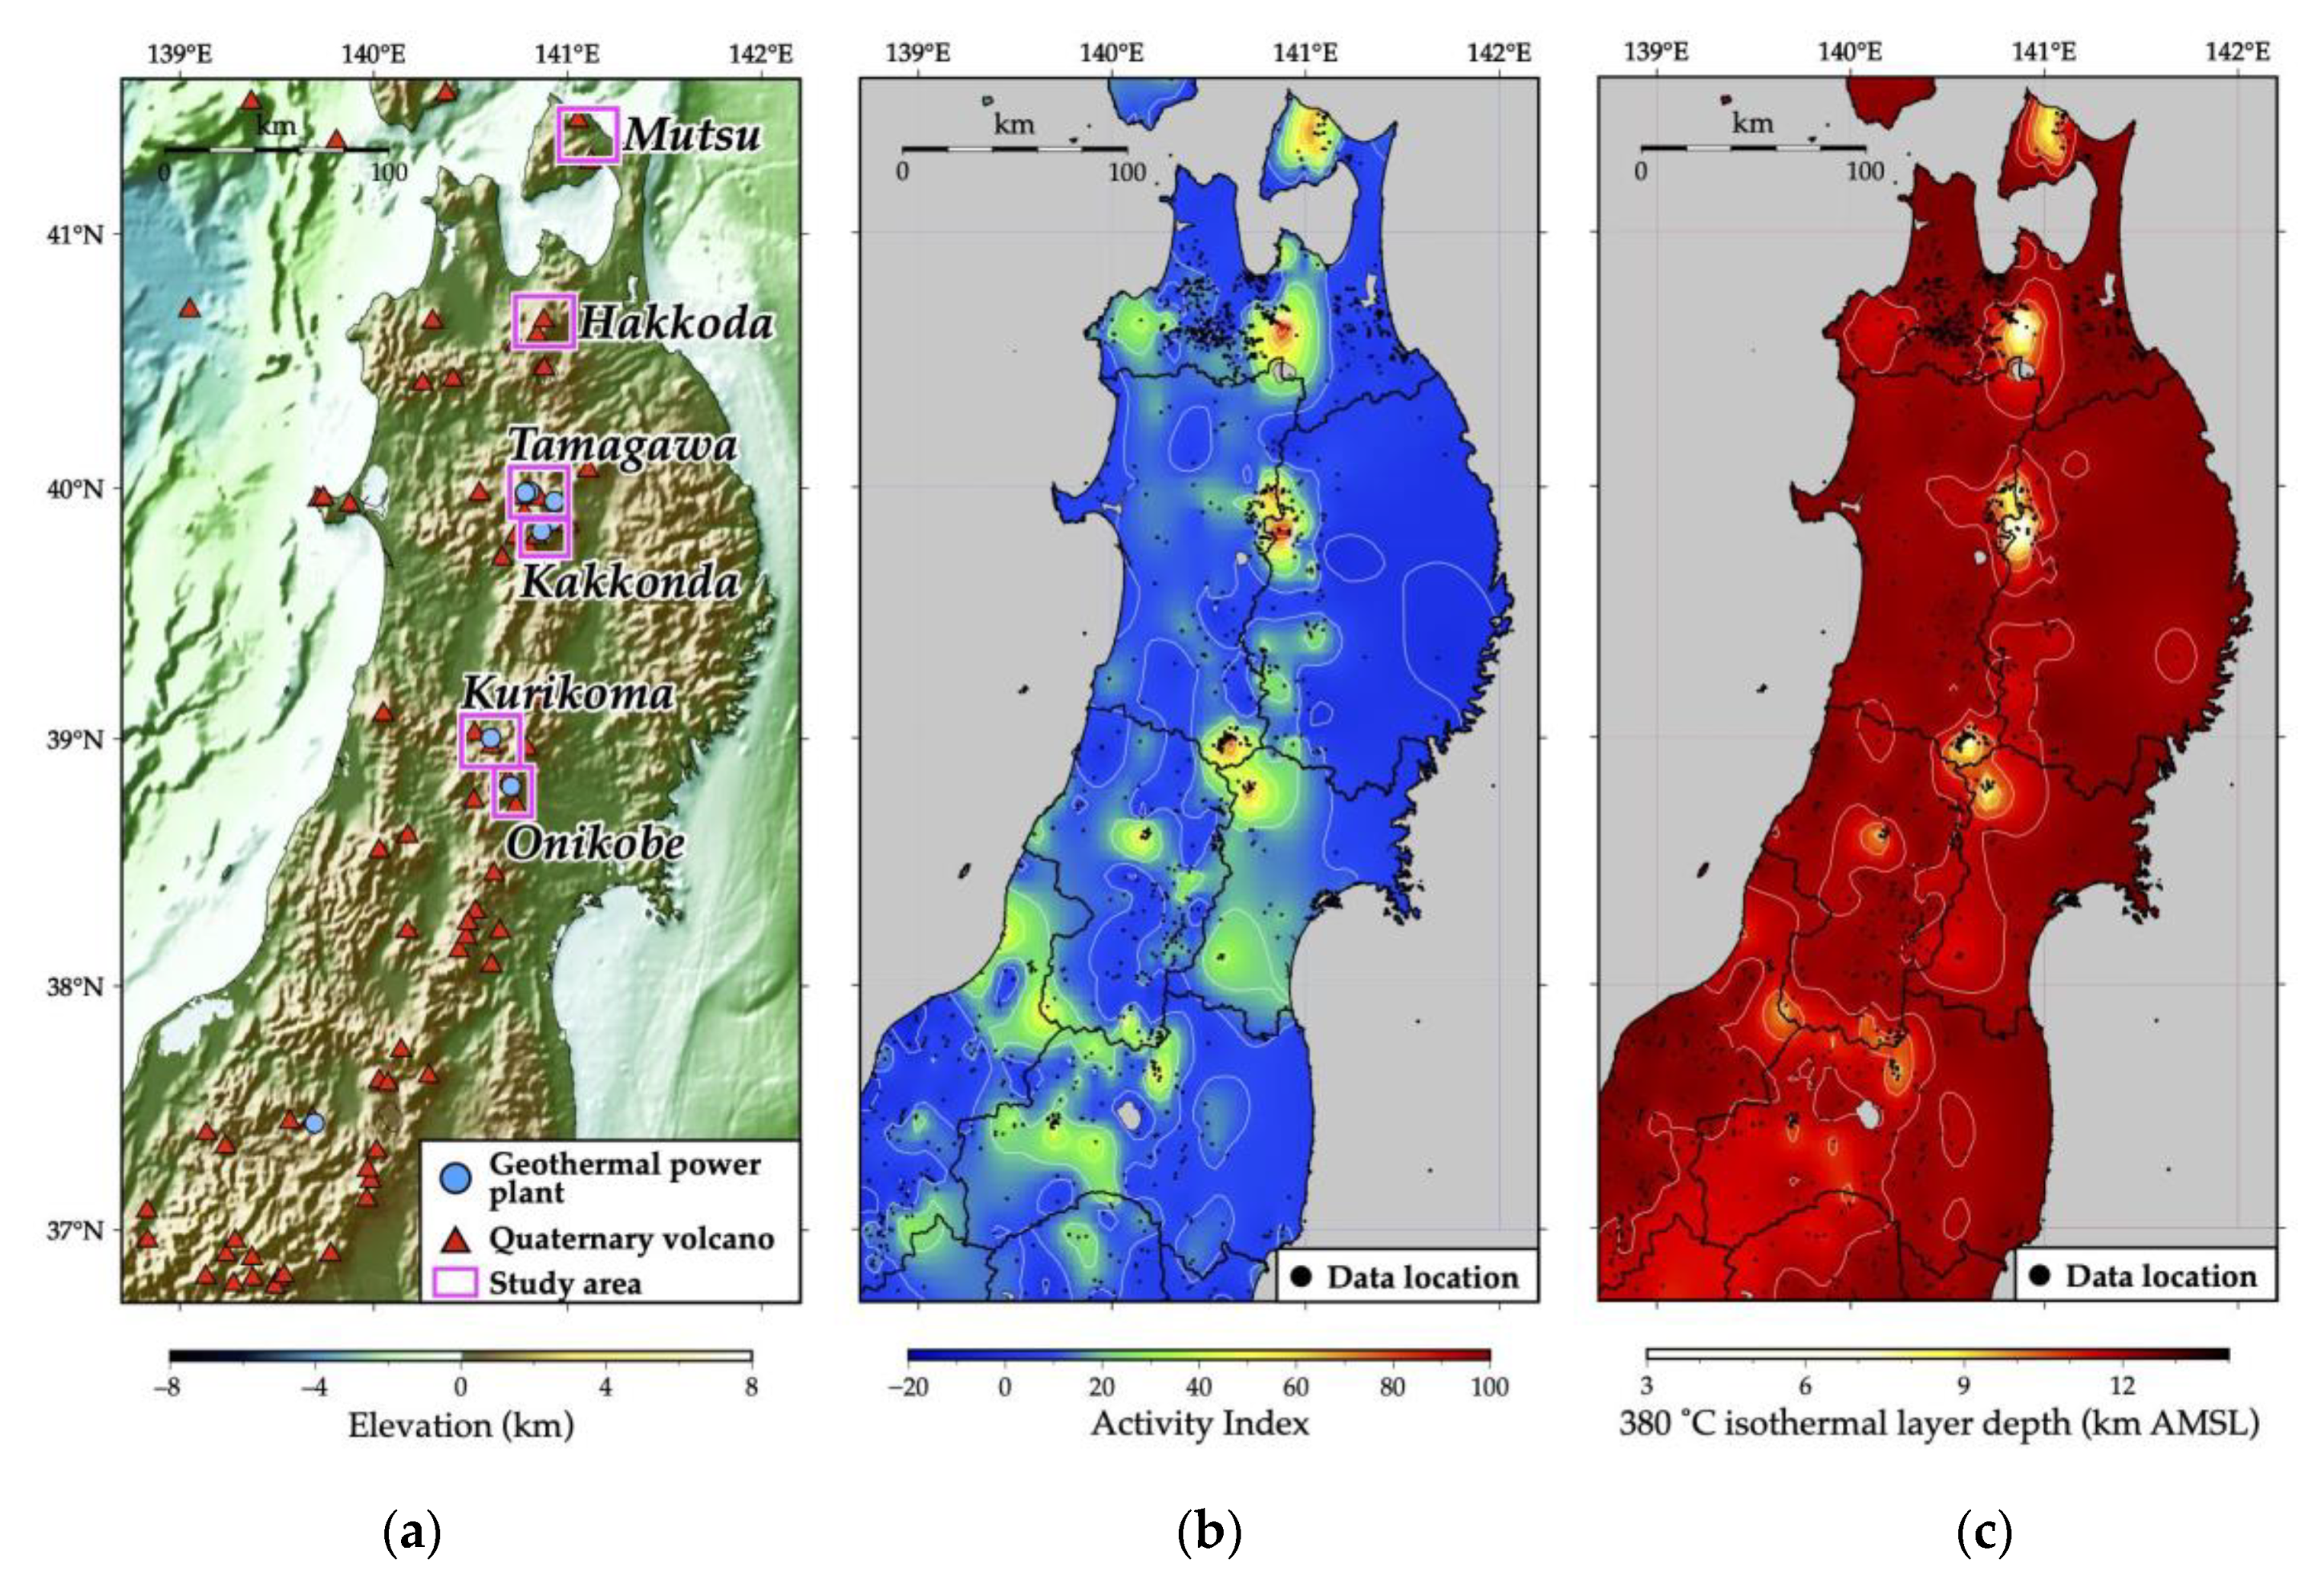
2. Geothermal Data for Estimation of Subsurface Thermal Structure in Northeastern Japan
3. Methods and Results
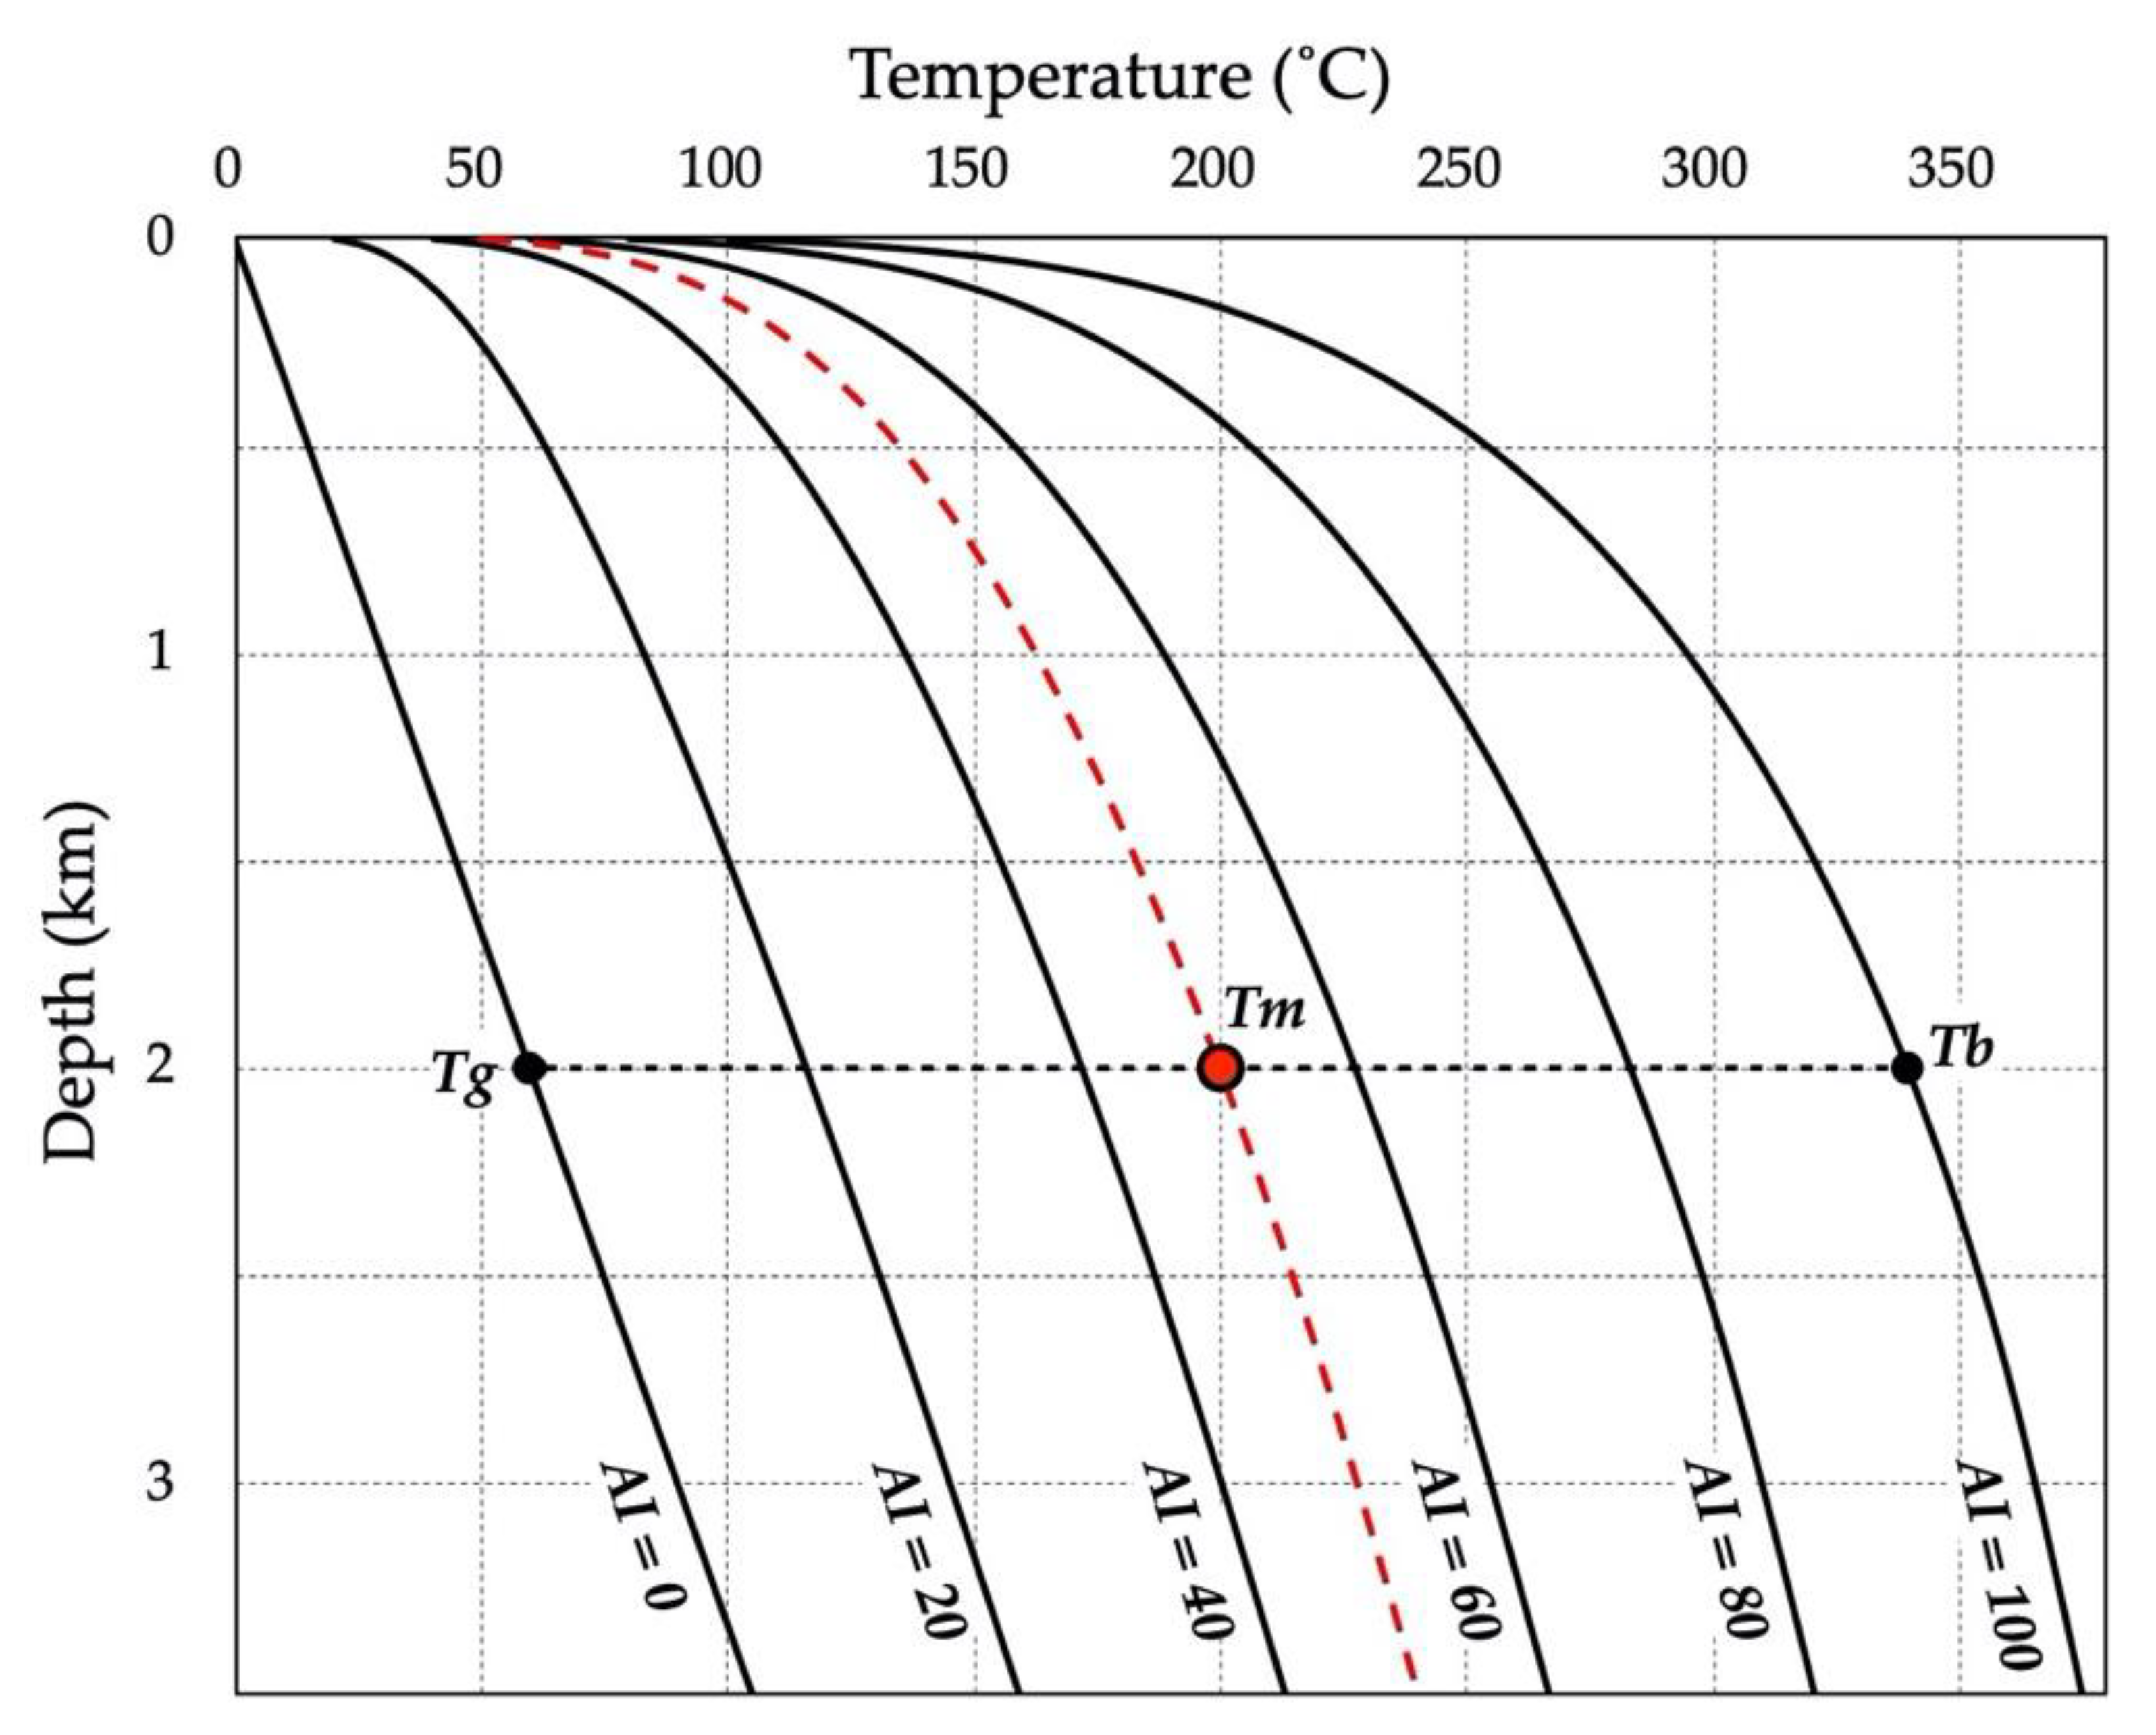
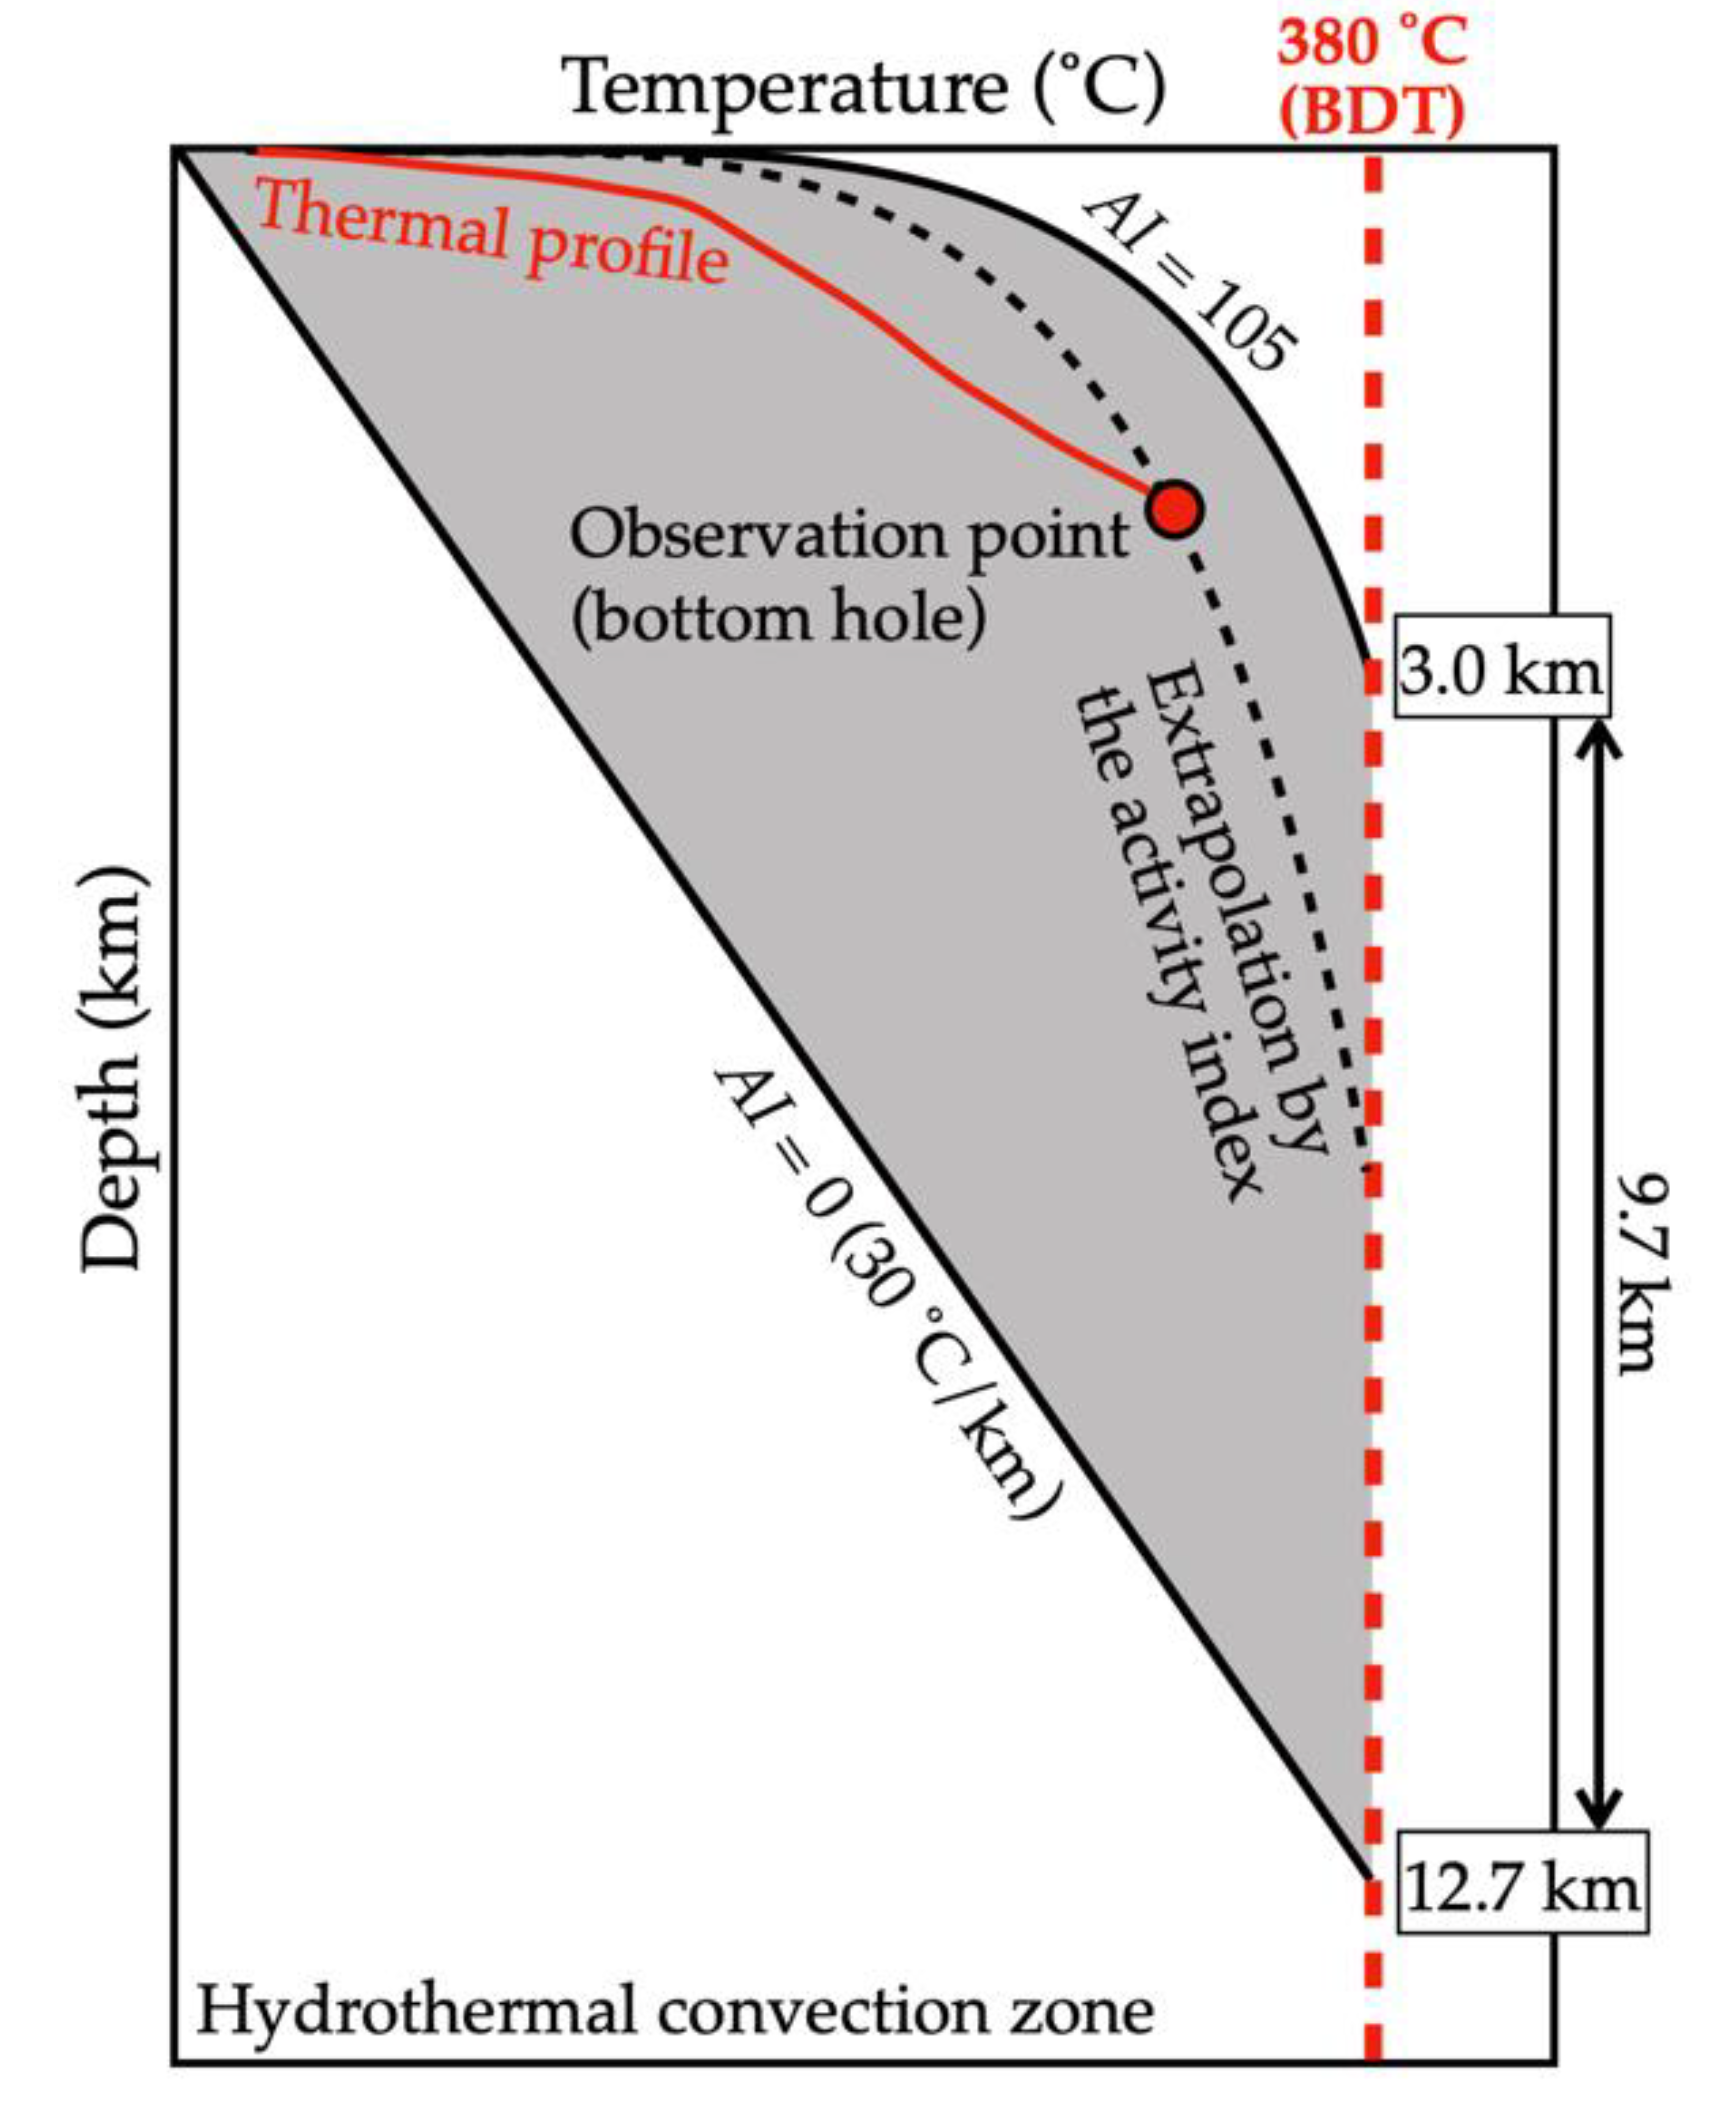
3.1. Activity Index
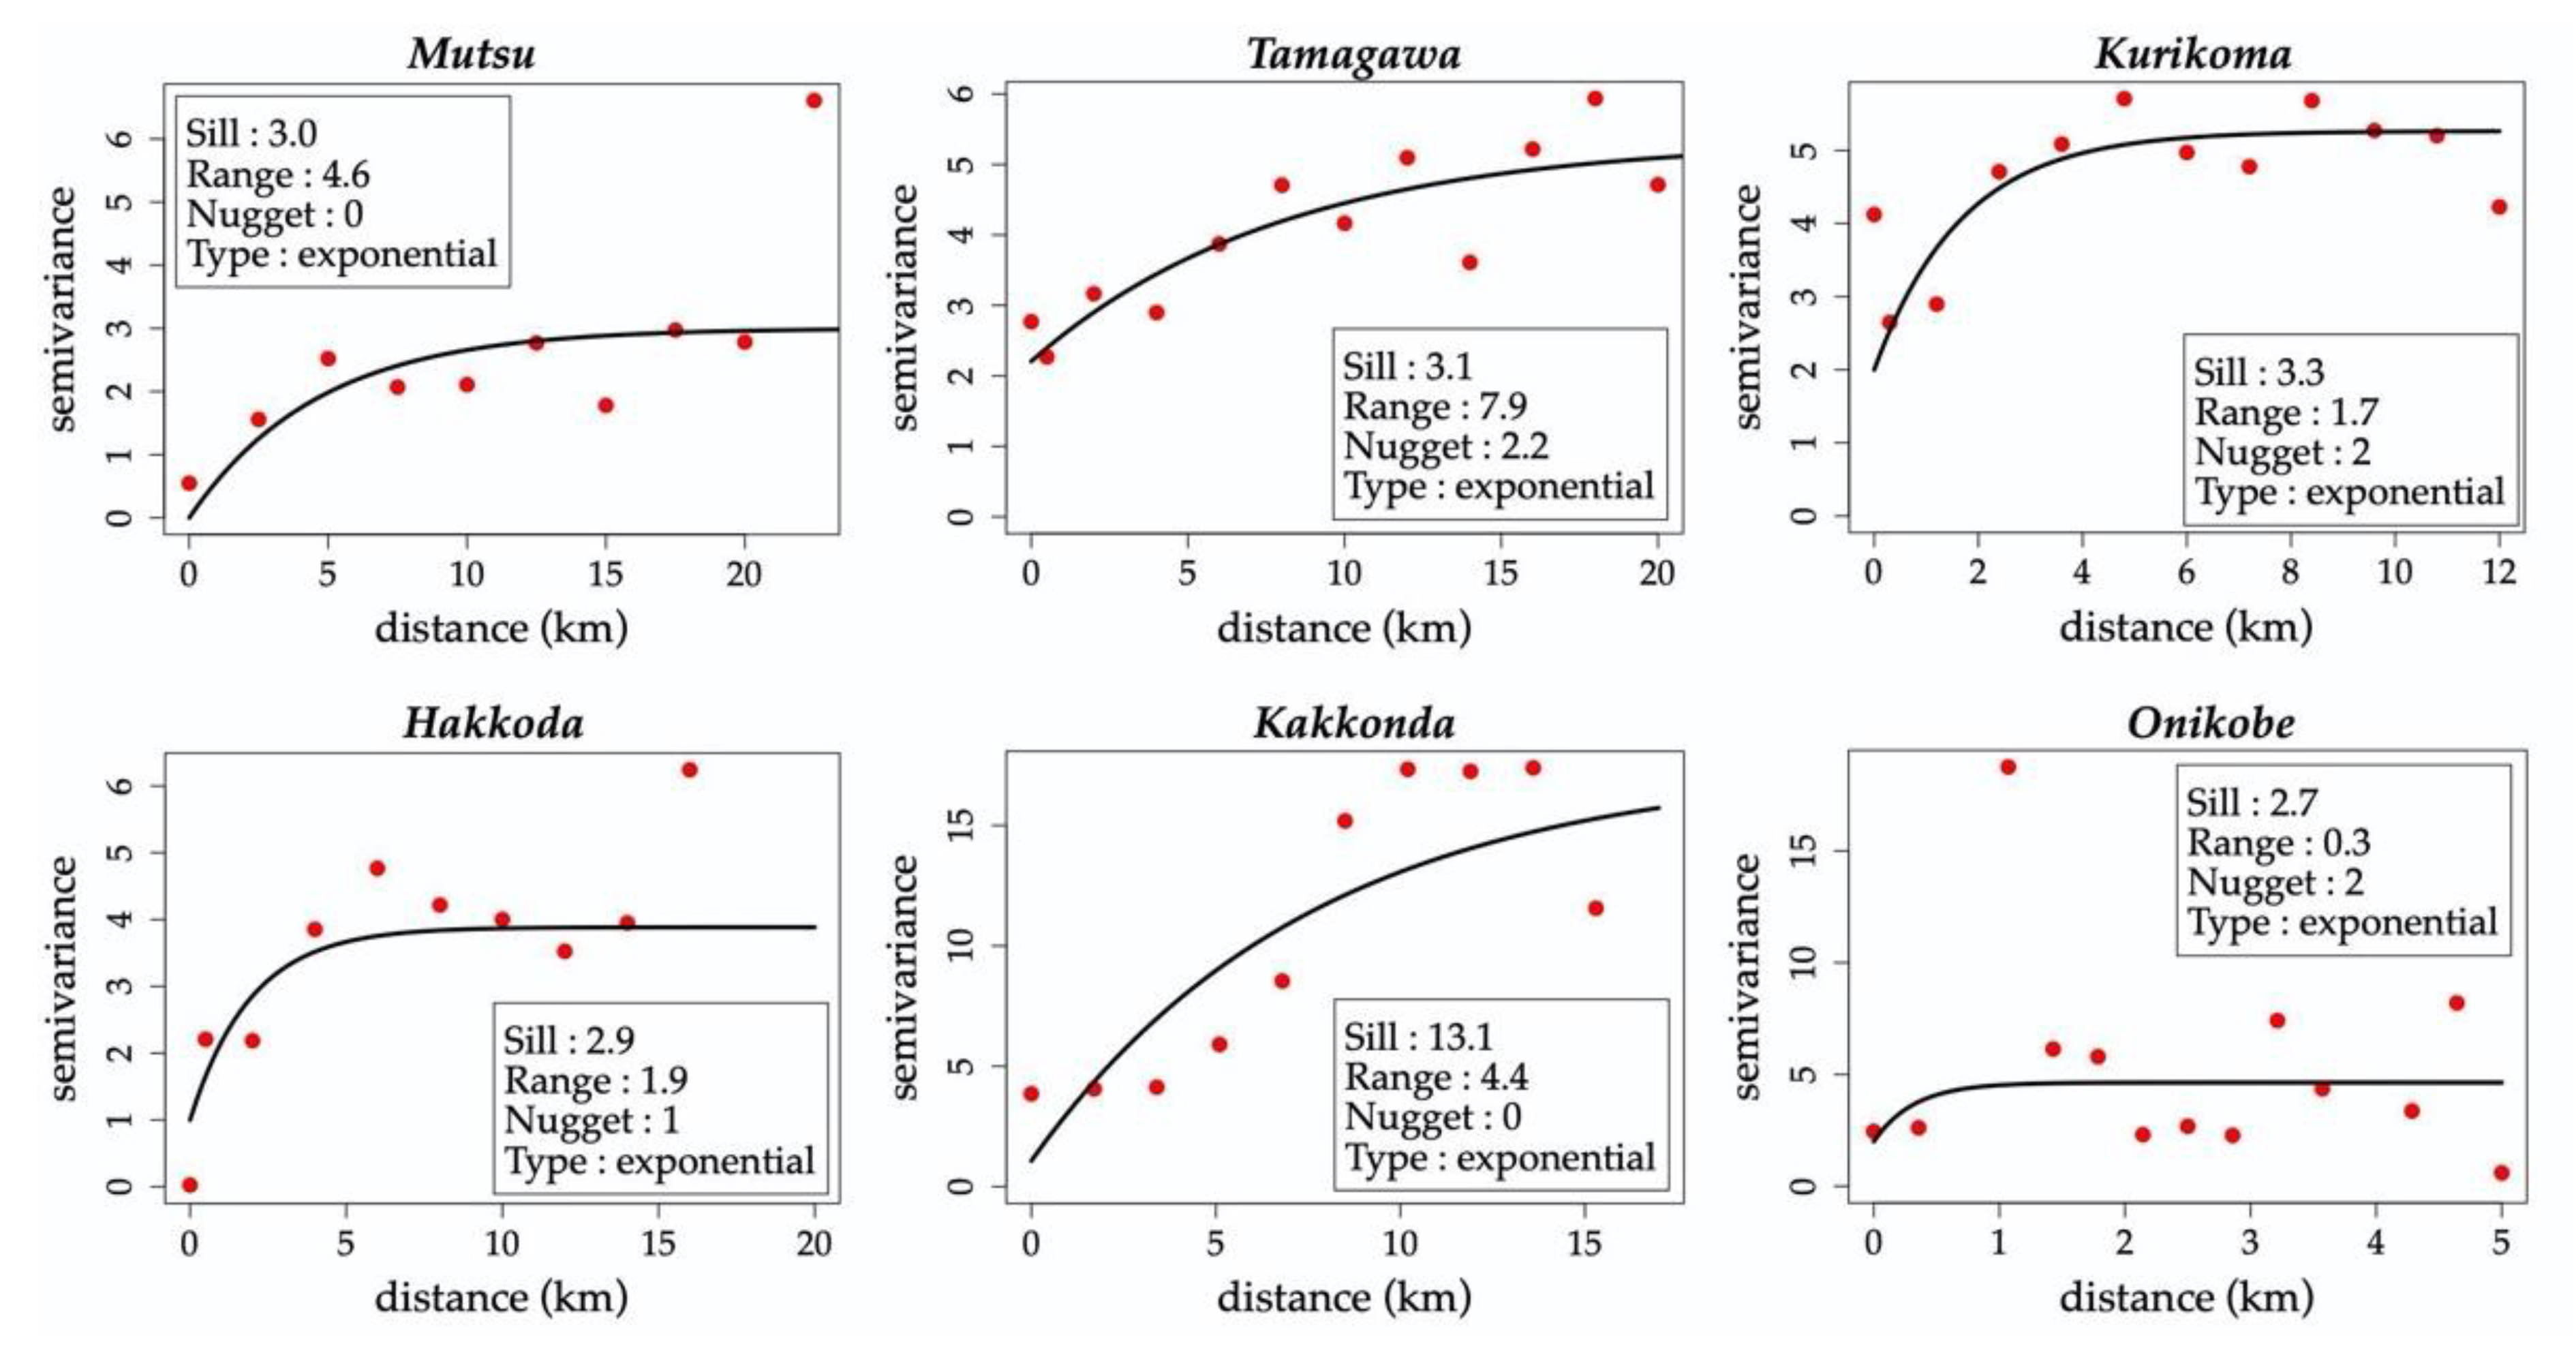
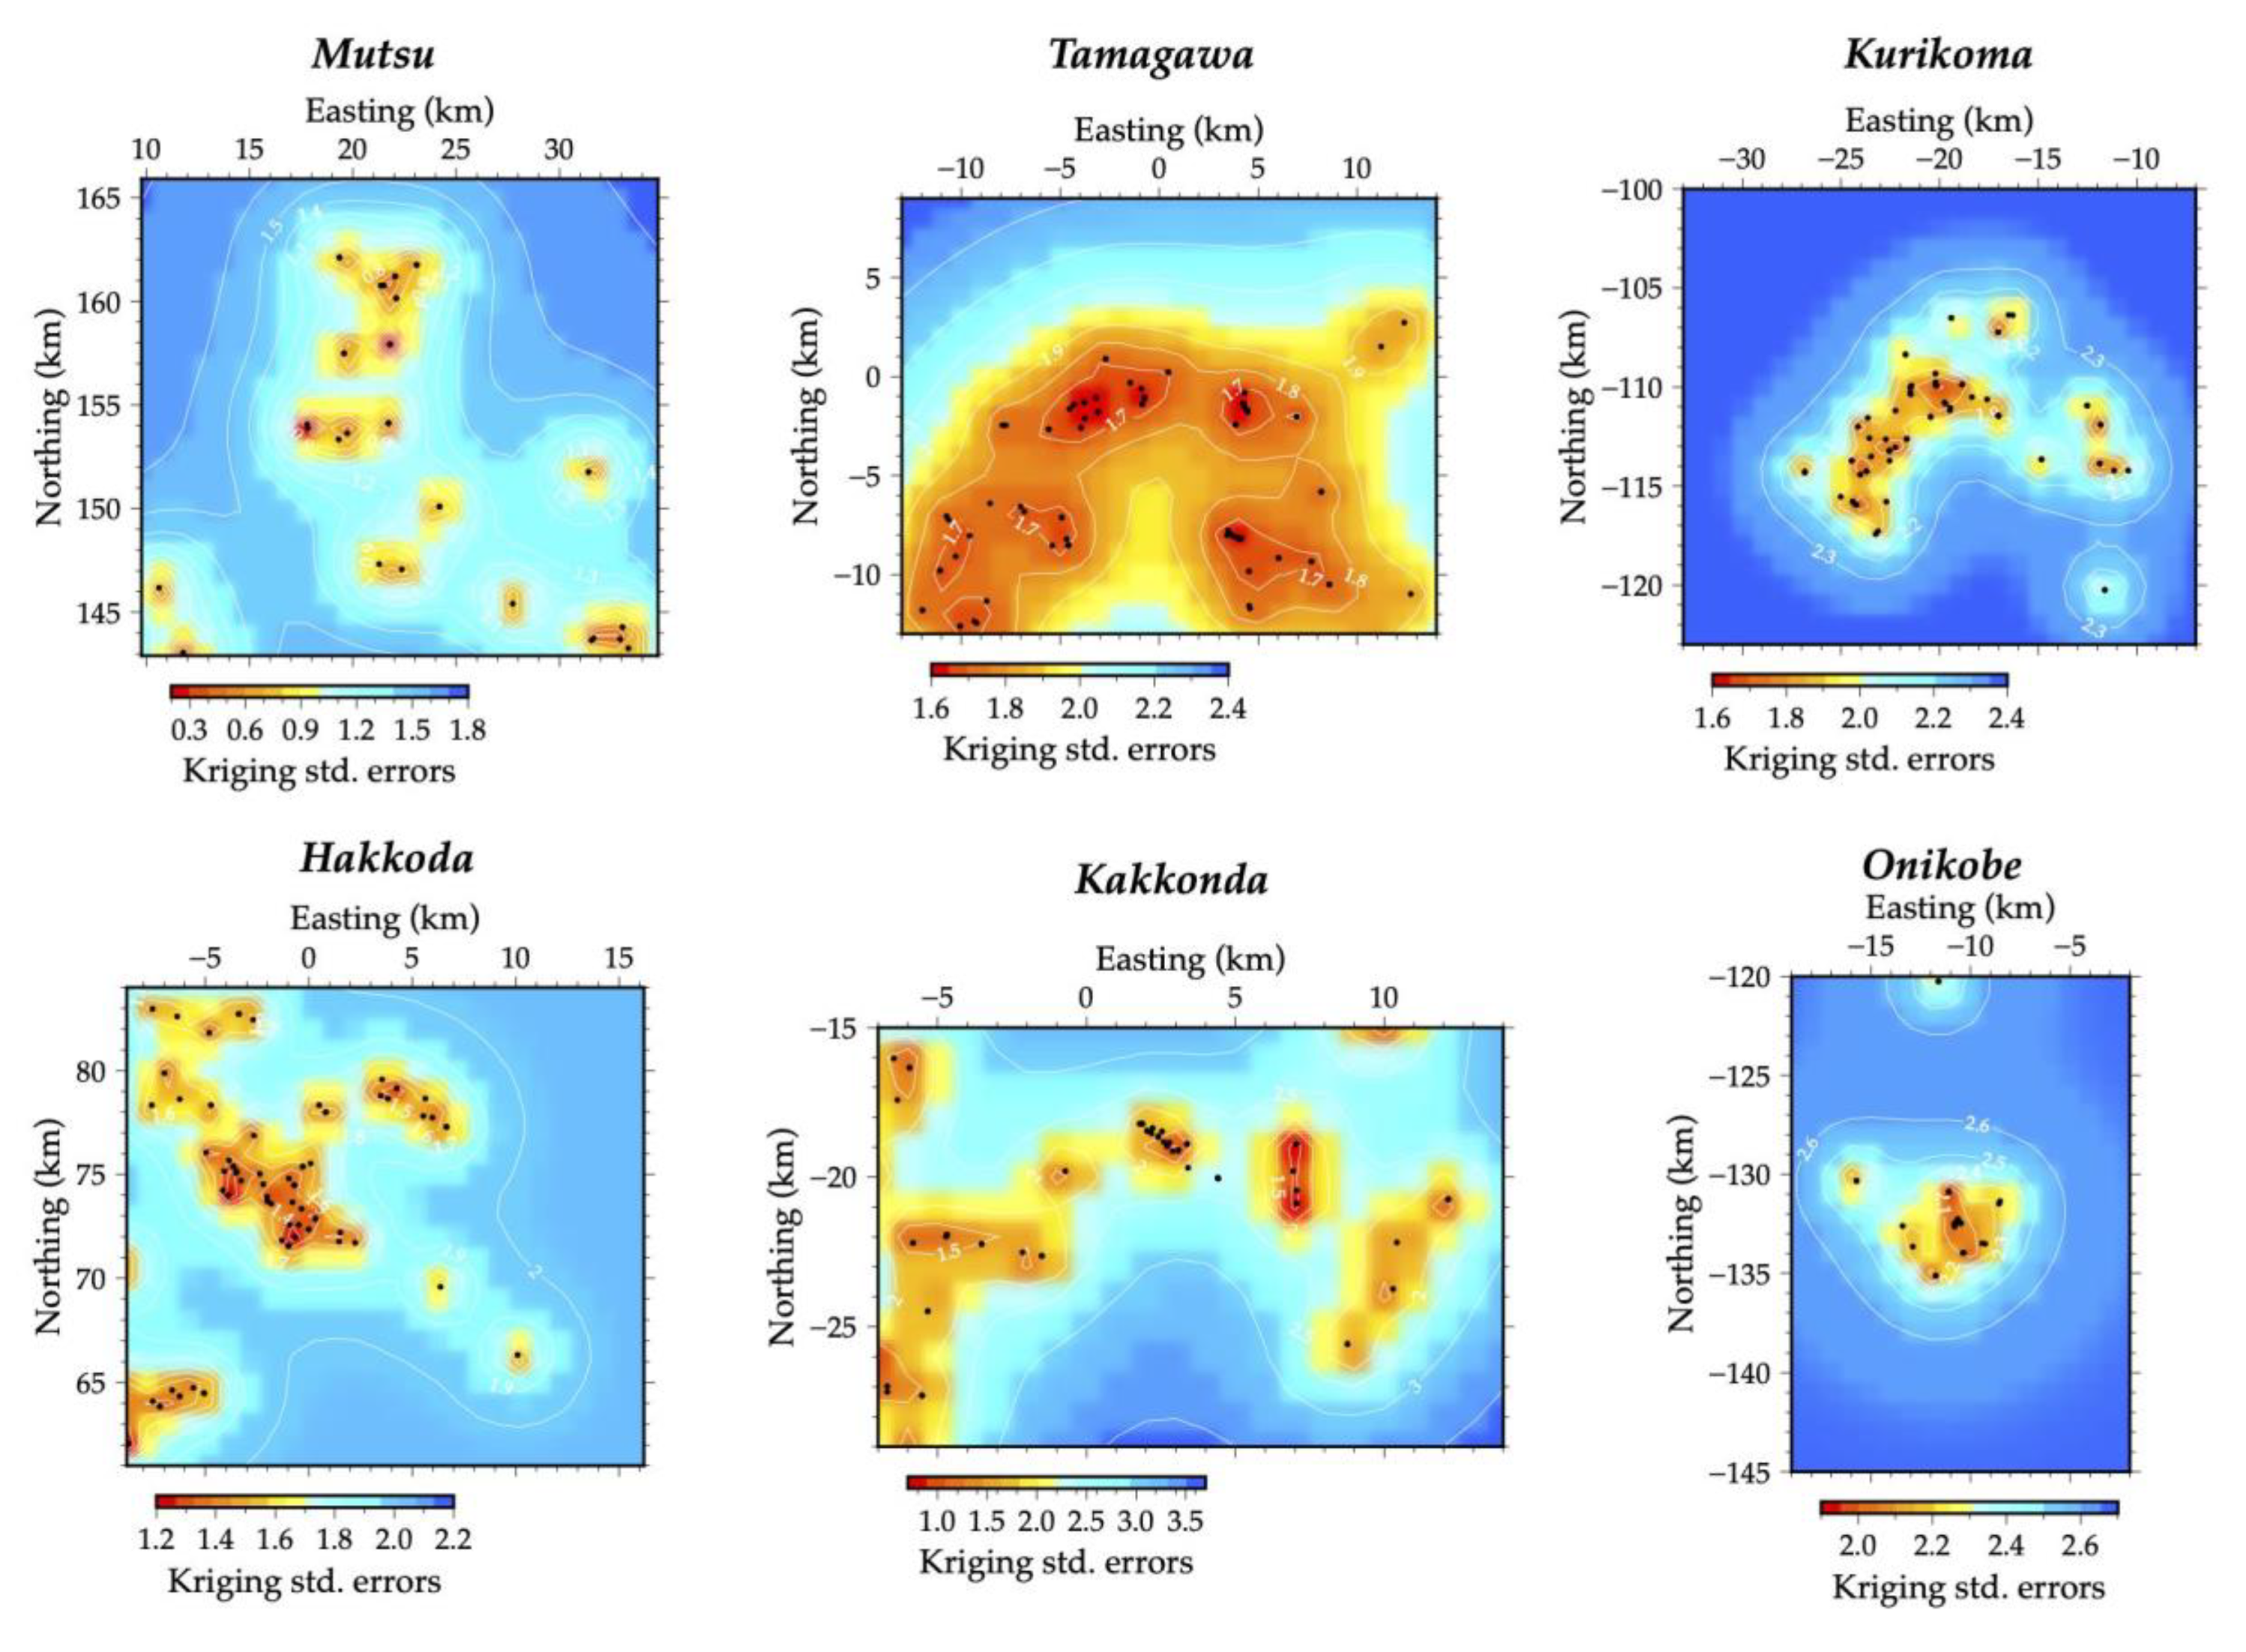
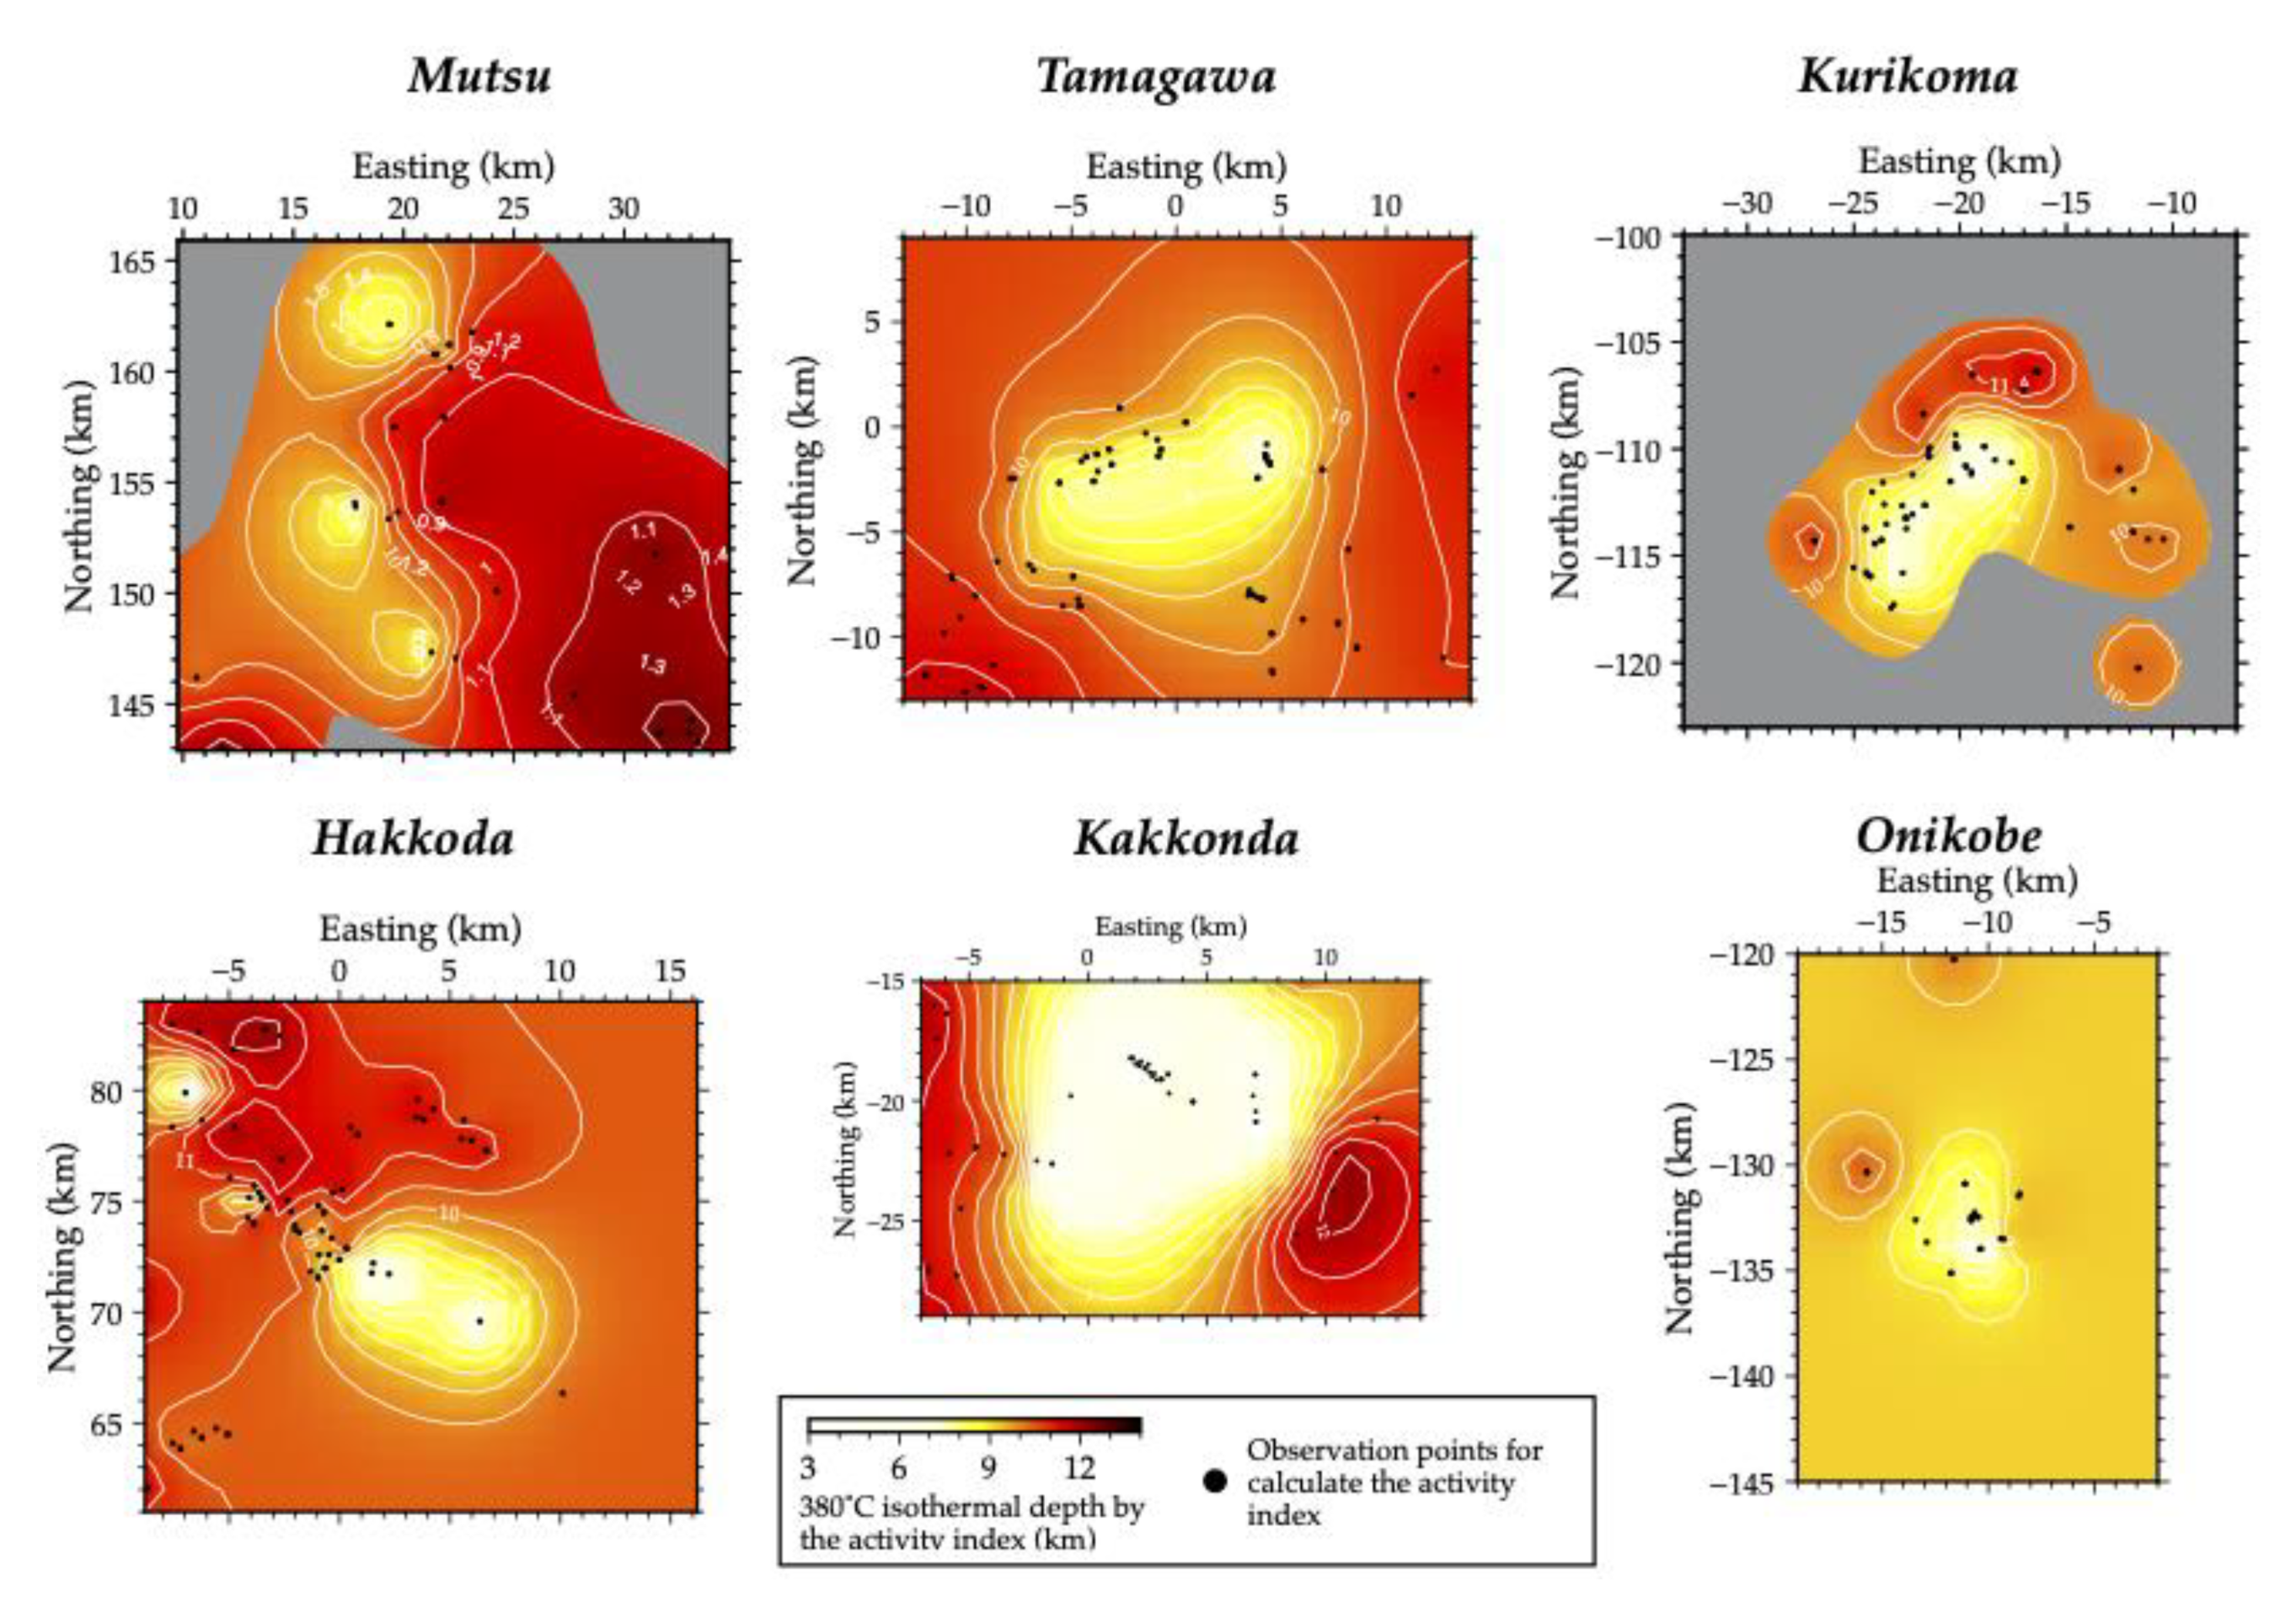
3.2. Kriging
4. Discussion
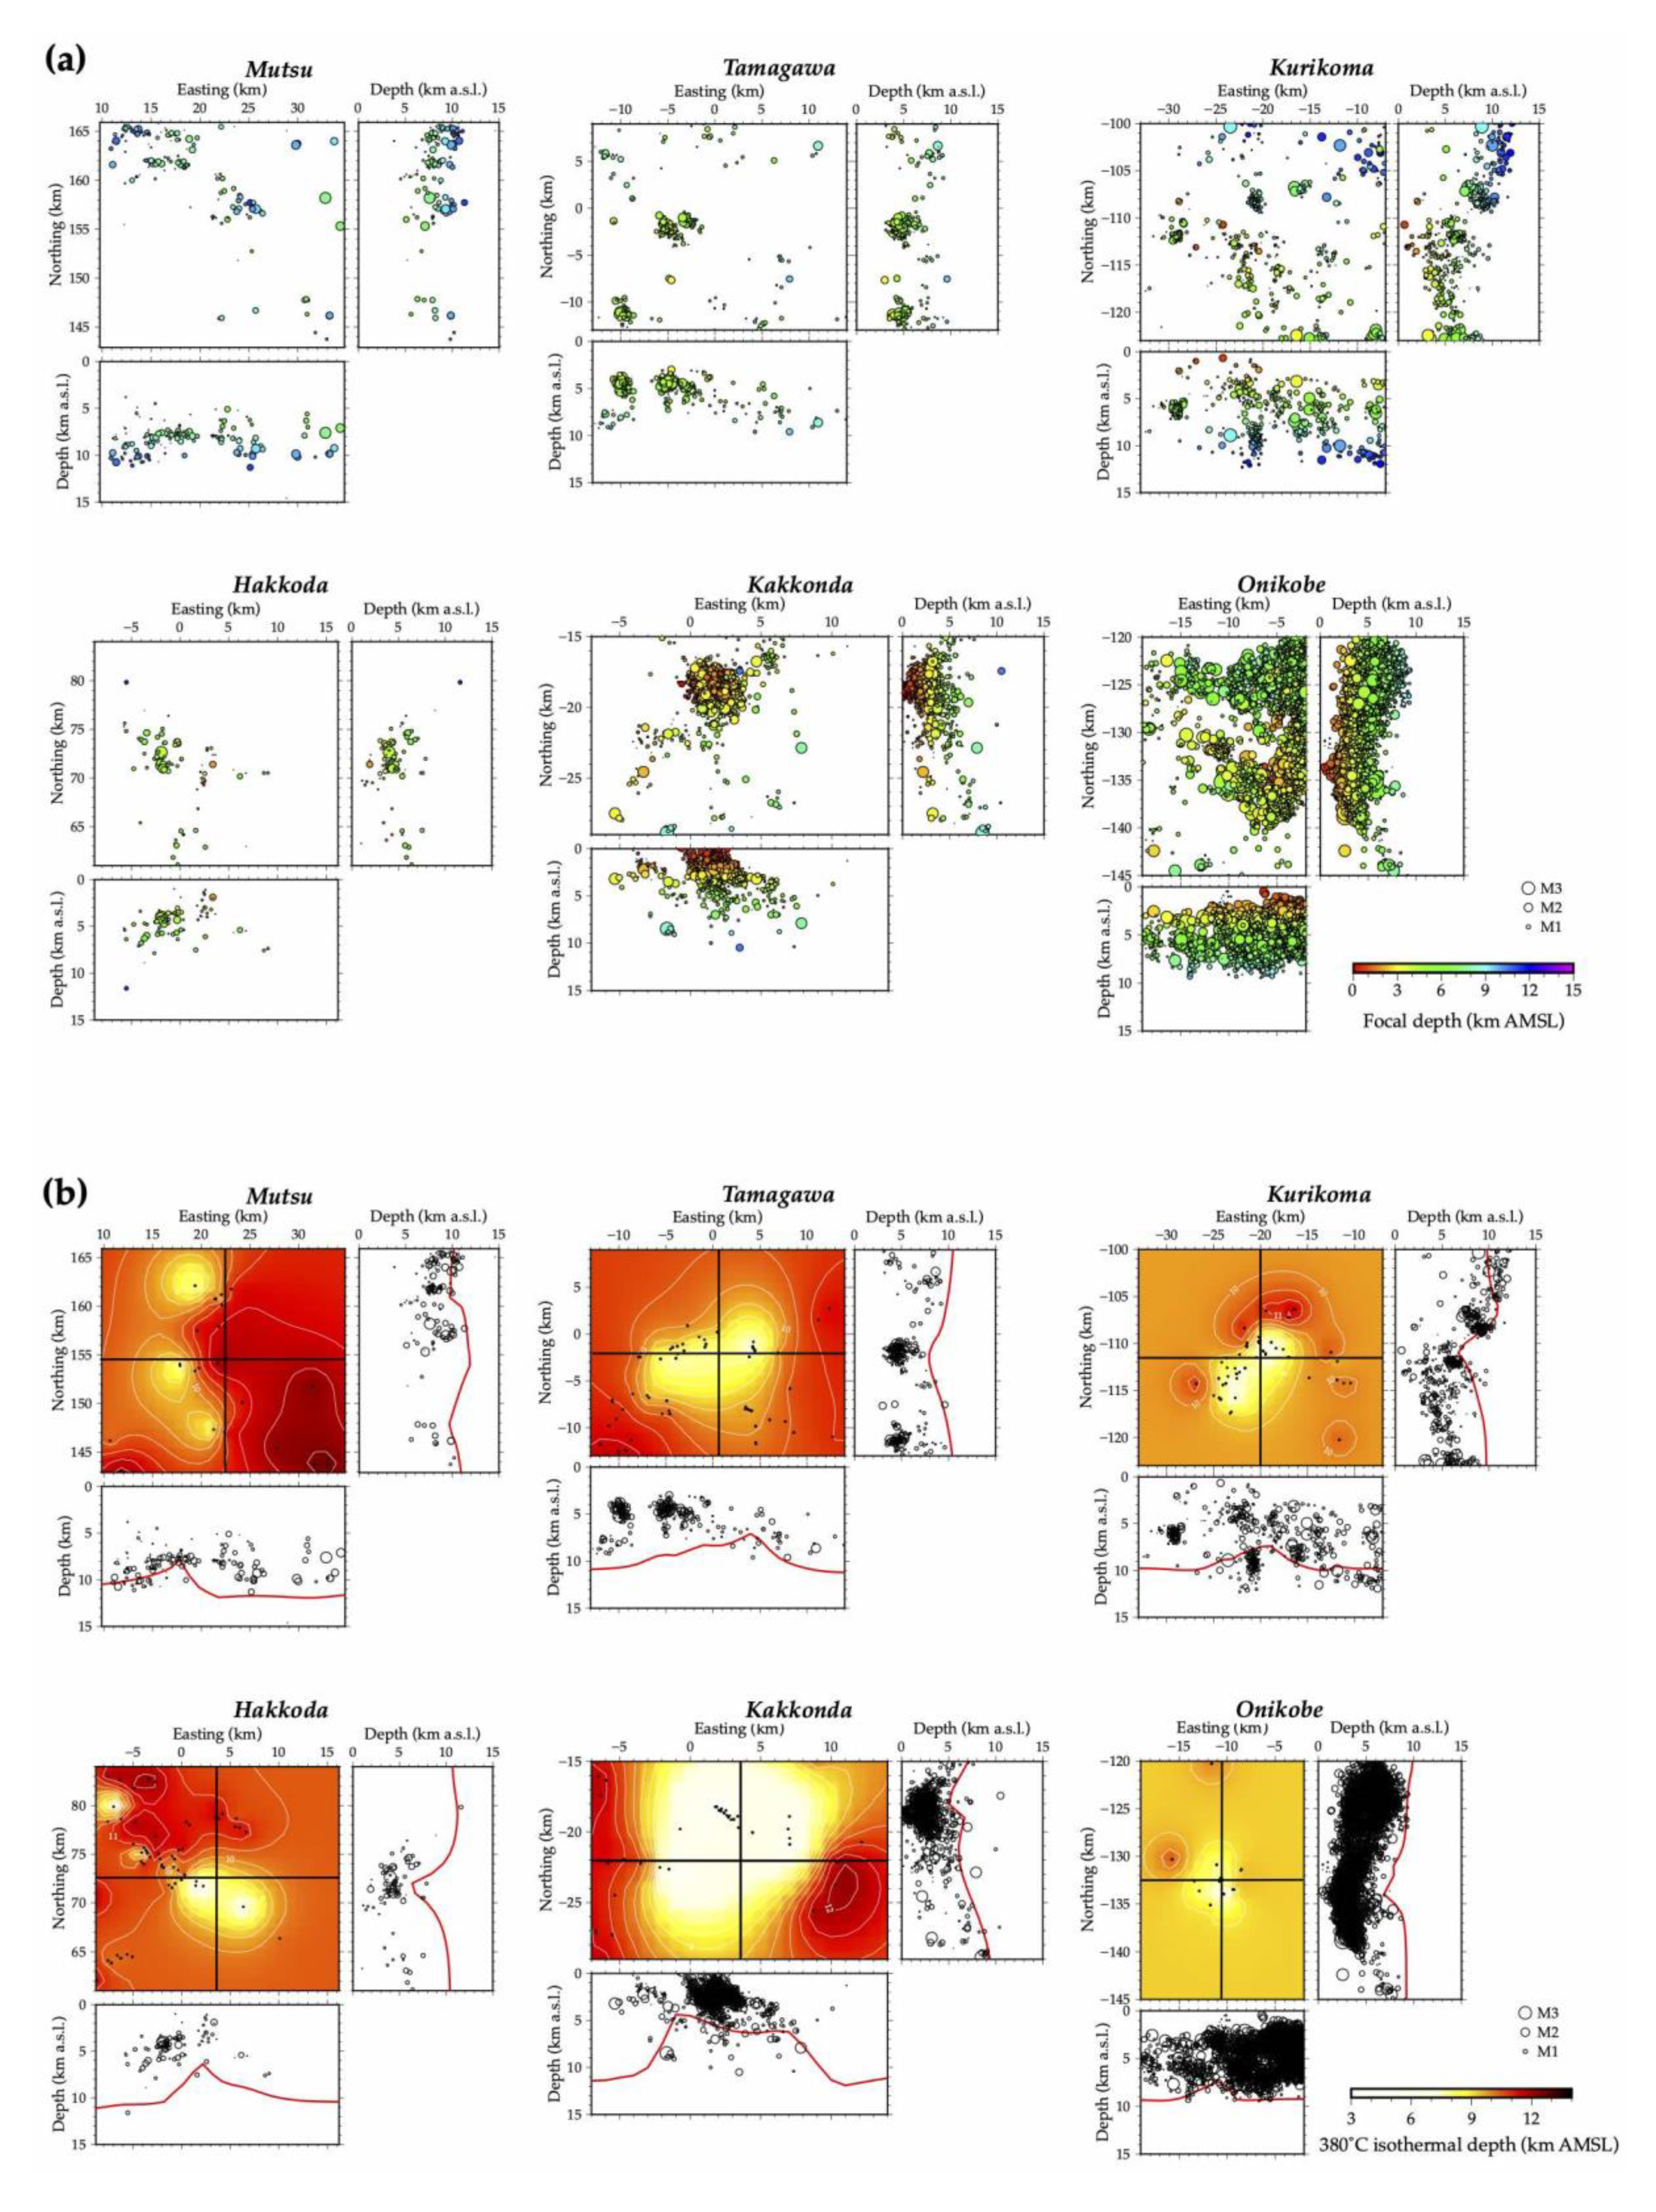
4.1. Verification of Thermal Structure by Comparison with Seismicity
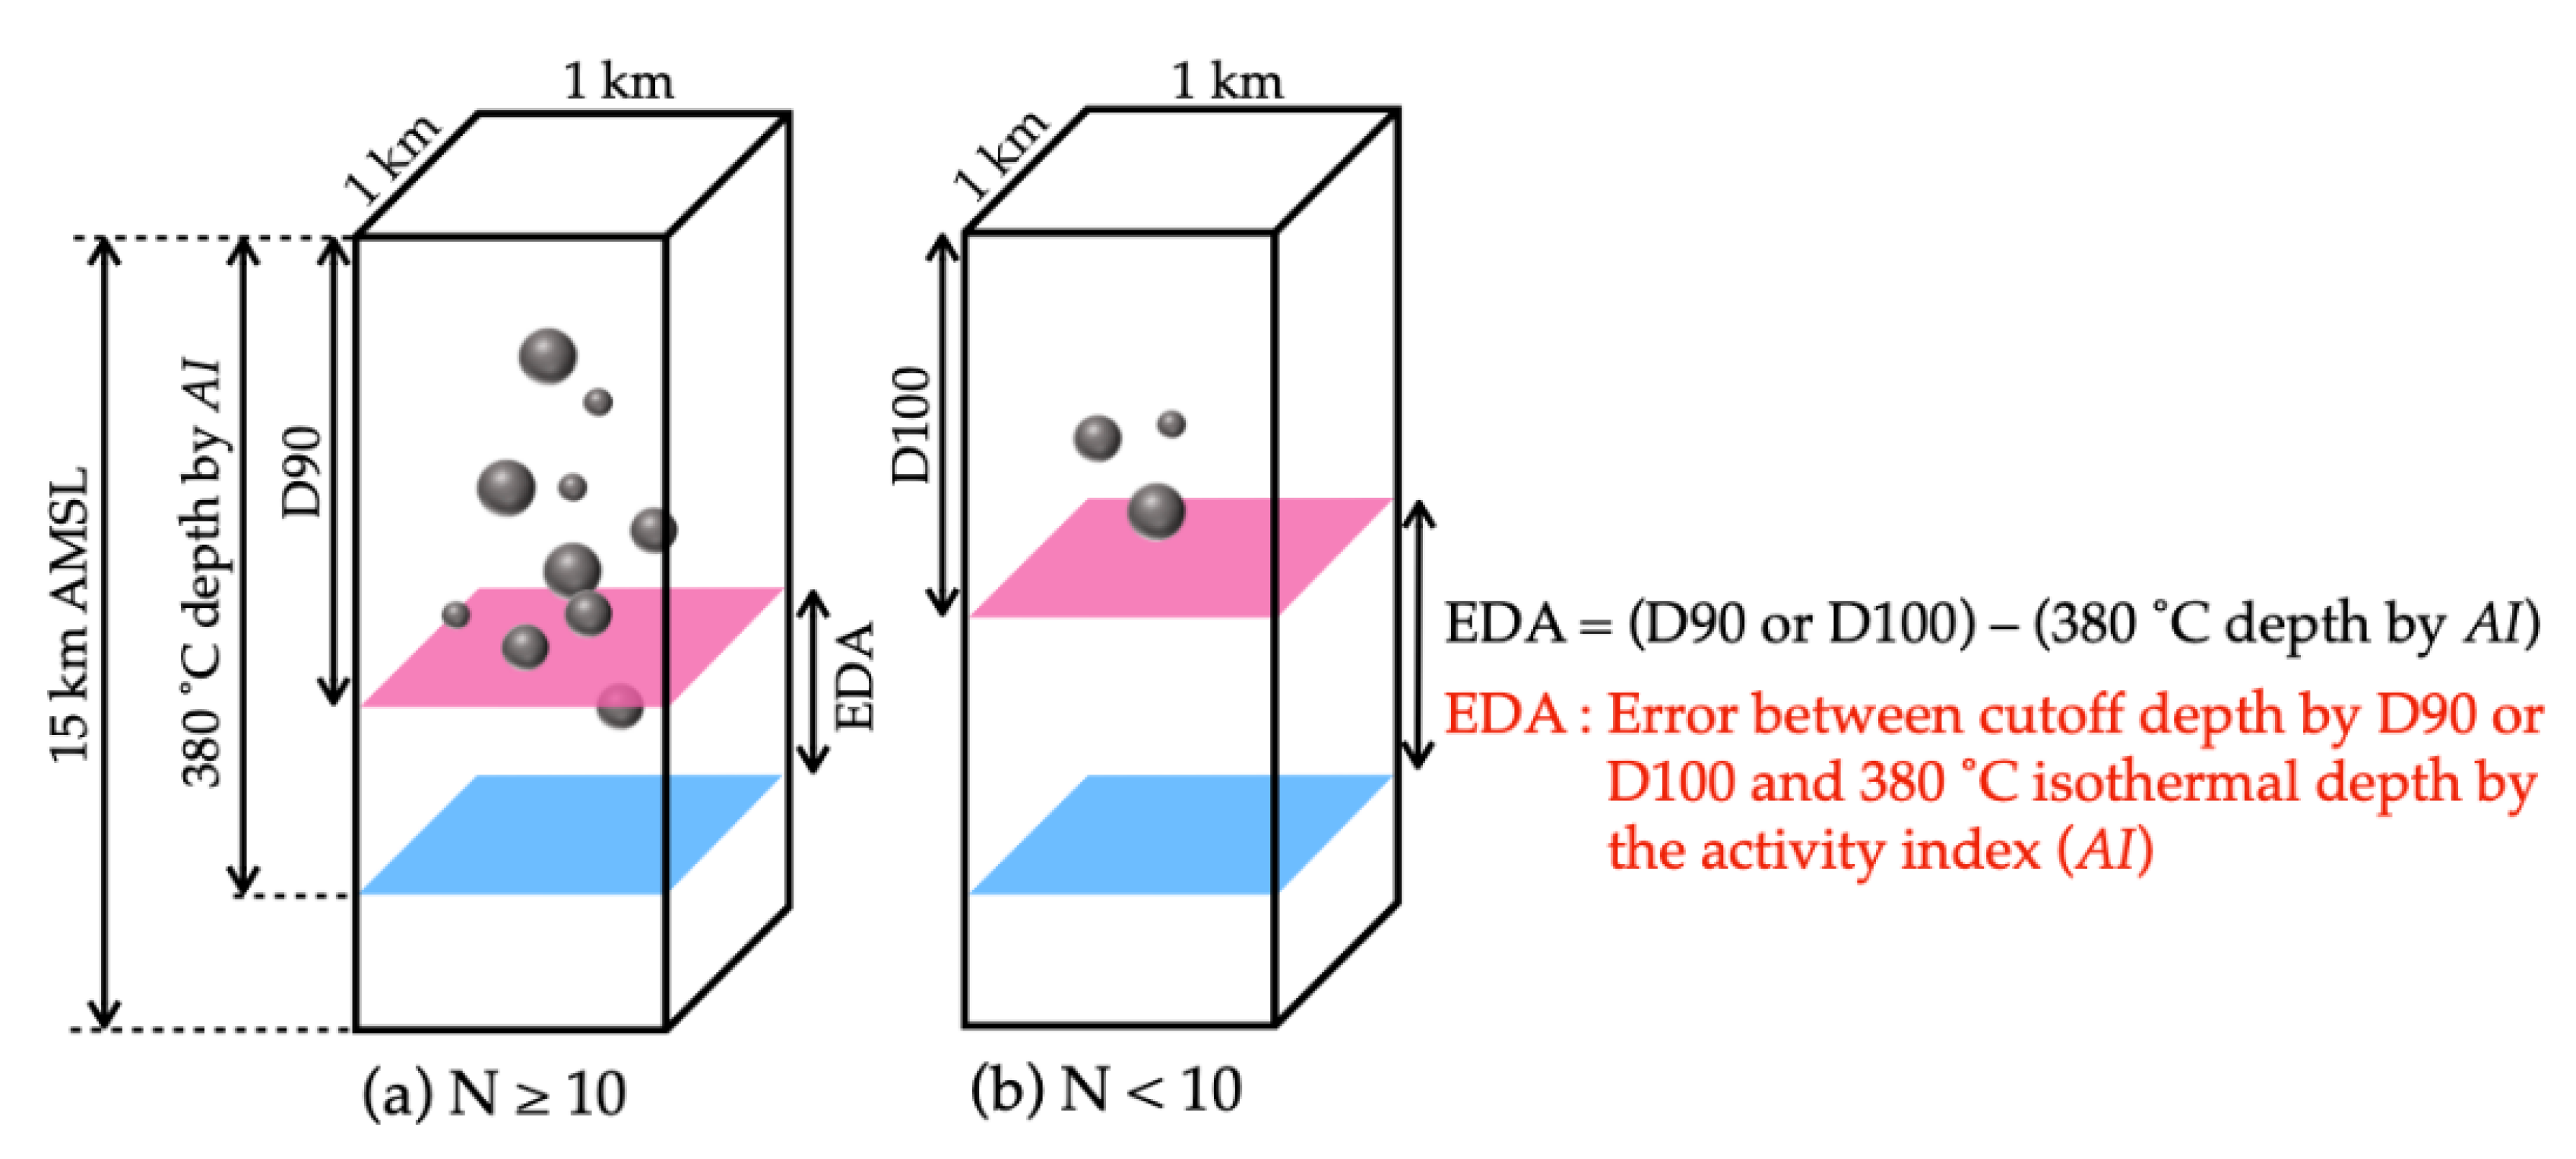
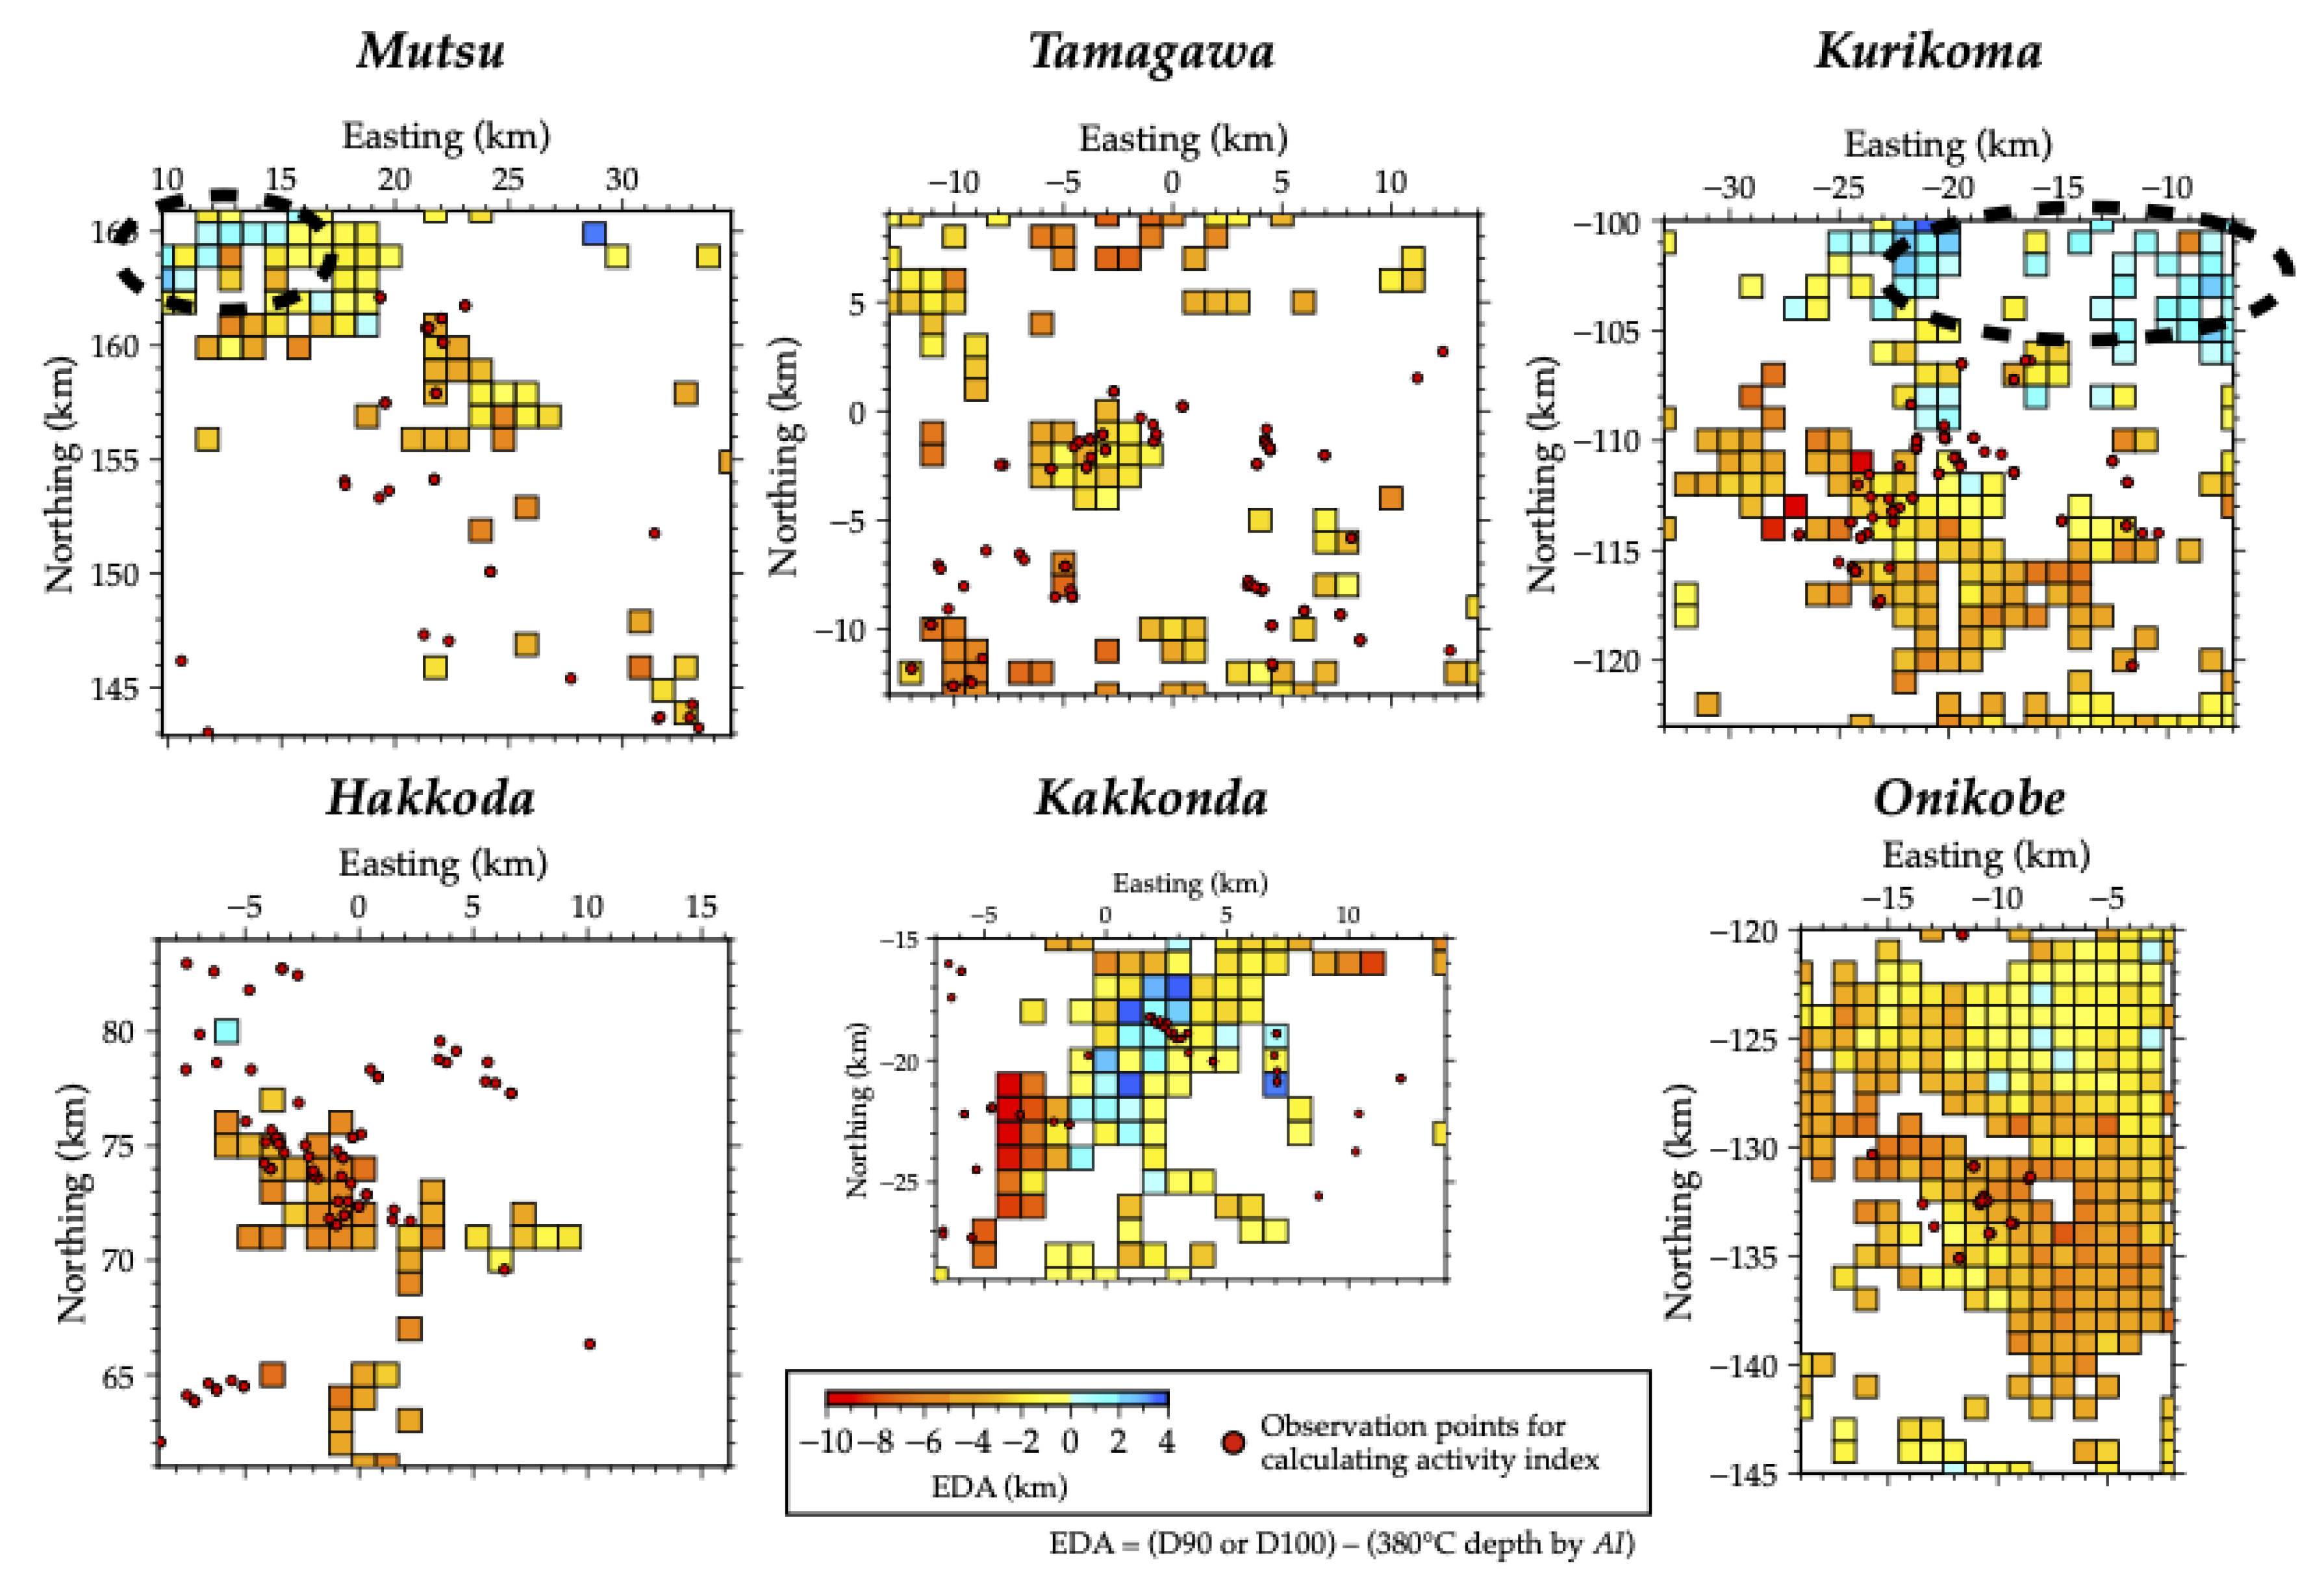
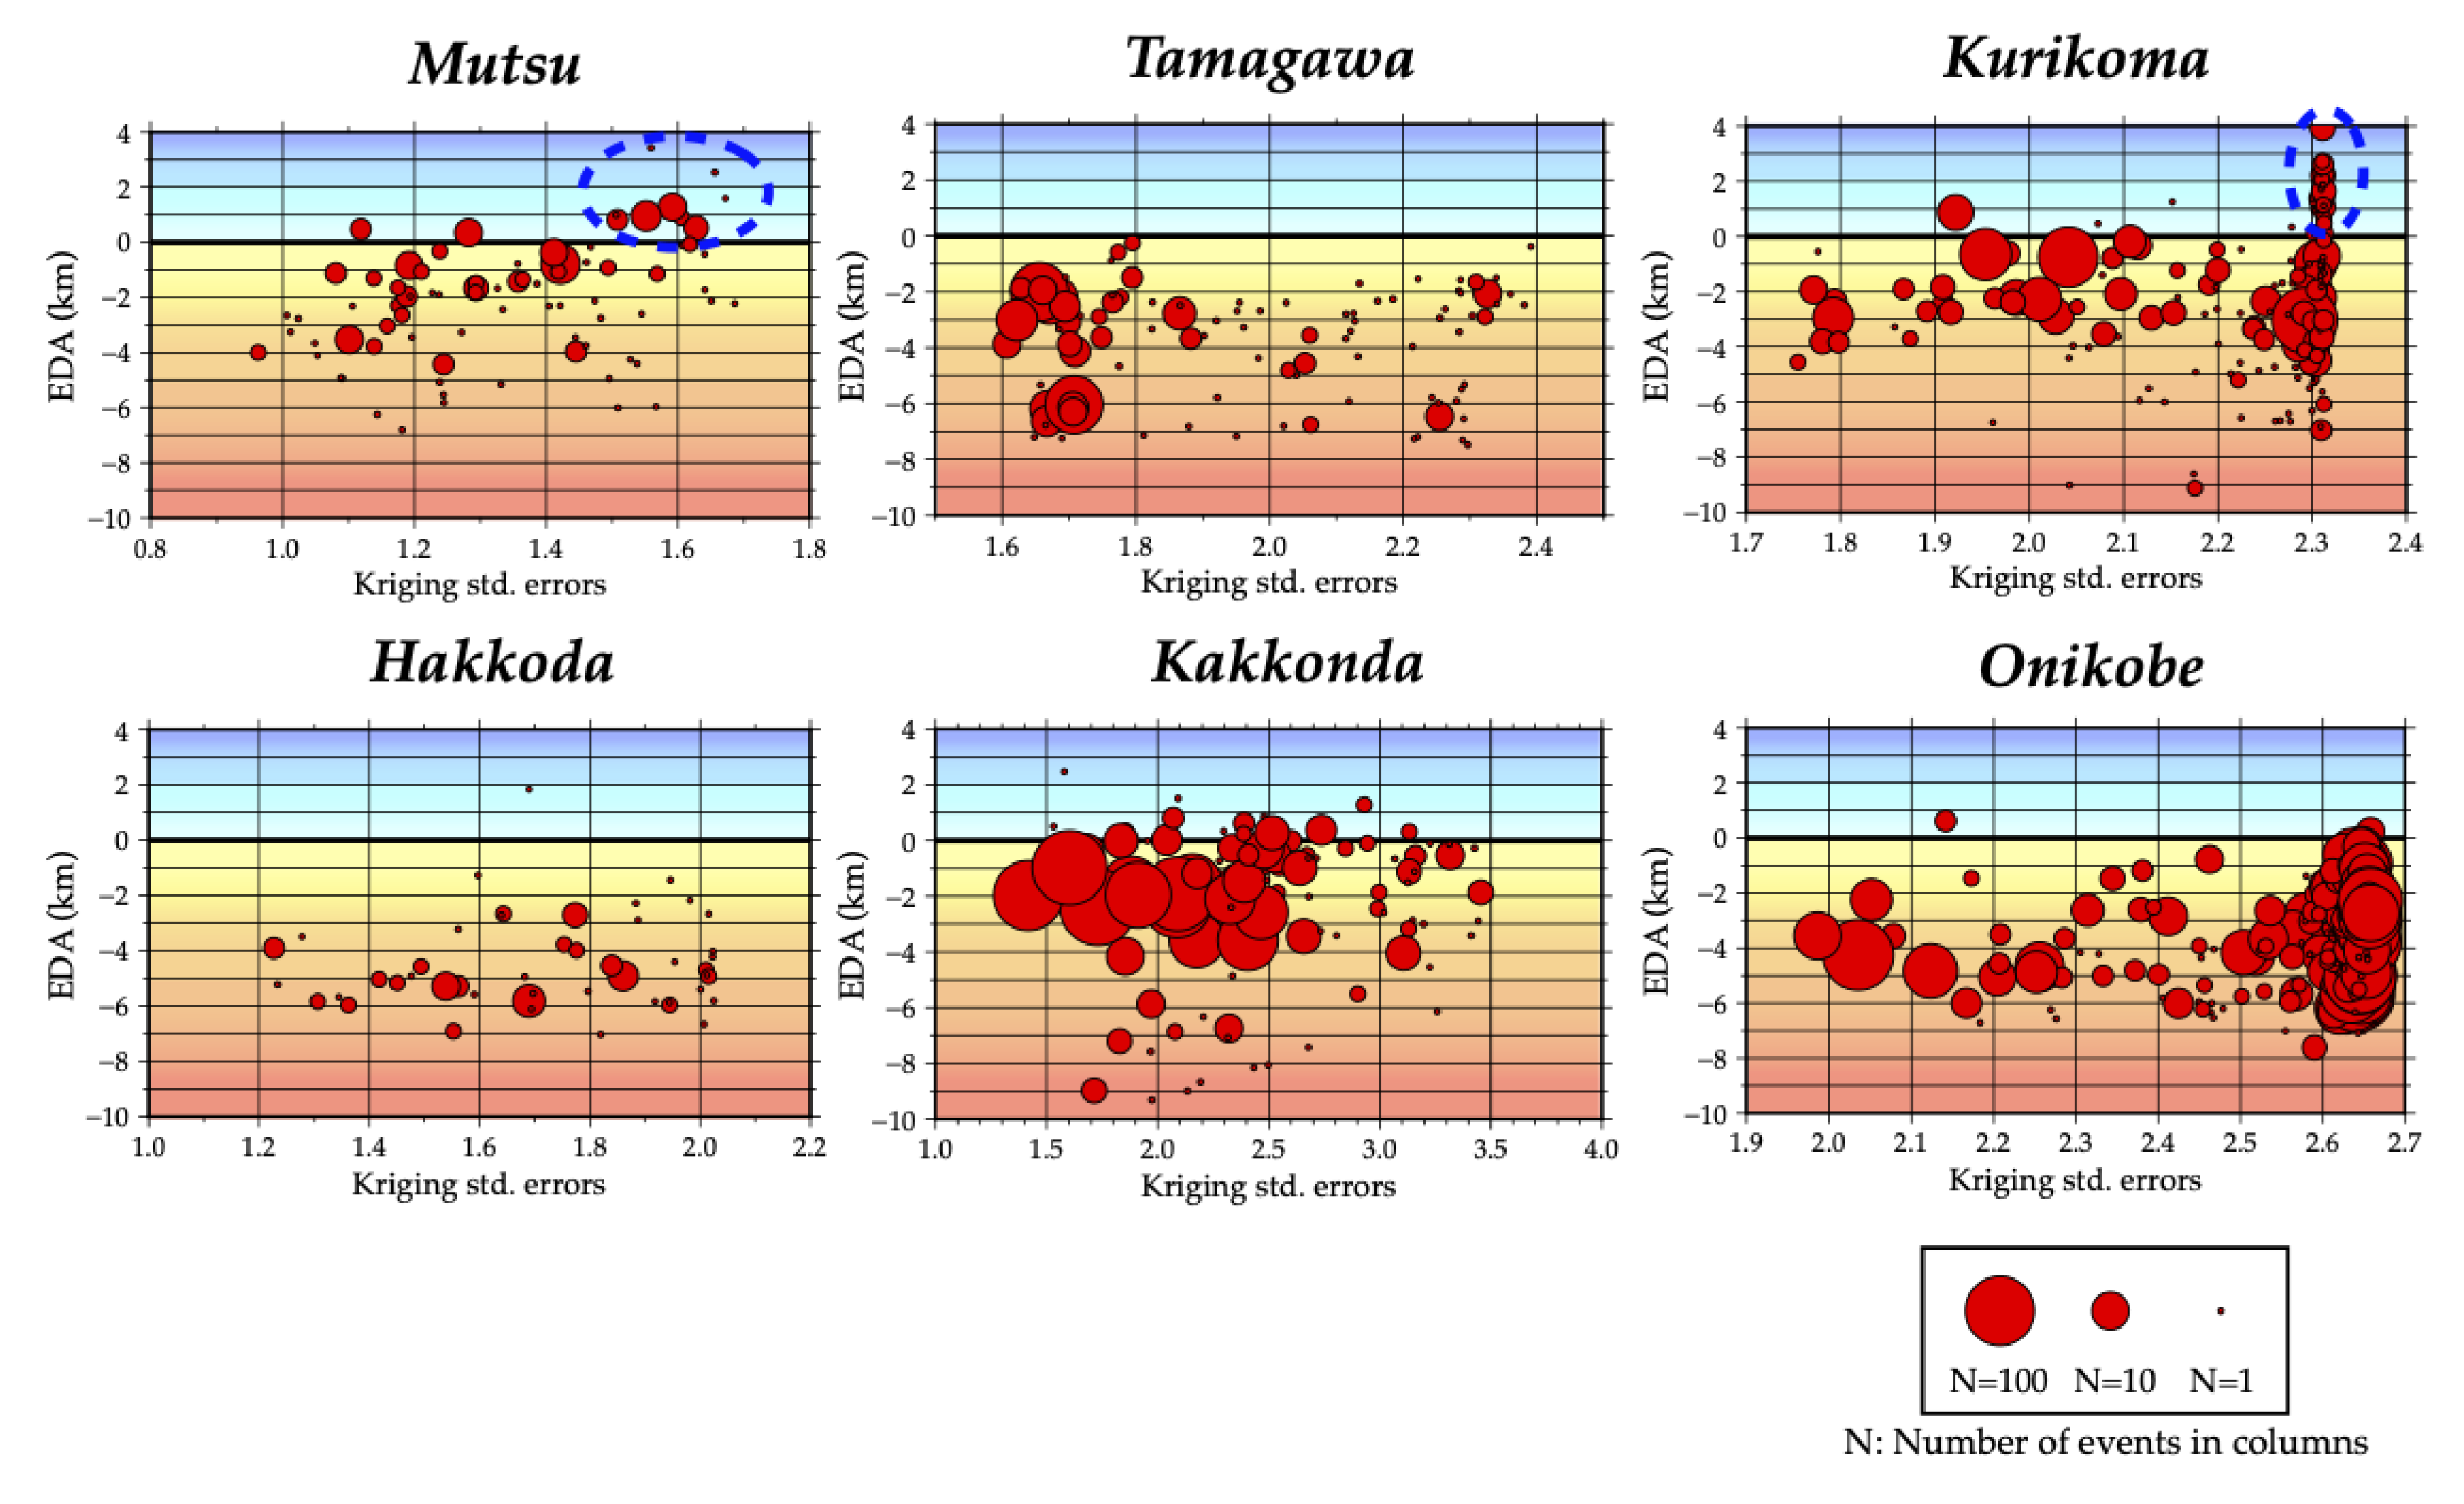
4.2. Evaluation of the Estimation Method for Subsurface Thermal Structure Using the Activity Index
5. Conclusions
Author Contributions
Funding
Acknowledgments
Conflicts of Interest
References
- Reinsch, T.; Dobson, P.; Asanuma, A.; Huenger, E.; Poletto, F.; Sanjuan, B. Utilizing Supercritical Geothermal Systems: A Review of Past Ventures and Ongoing Research Activities. Geotherm. Energy 2017, 5, 1–25. [Google Scholar] [CrossRef]
- Muraoka, H.; Asanuma, H.; Tsuchiya, N.; Ito, T.; Mogi, T.; Ito, H. The Japan Beyond-Brittle Project. Sci. Drill. 2014, 17, 51–59. [Google Scholar] [CrossRef]
- Ogawa, Y.; Ichiki, M.; Kanda, W.; Mishina, M.; Asamori, K. Three-Dimensional Magnetotelluric Imaging of Crustal Fluids and Seismicity around Naruko Volcano, NE Japan. Earth Planets Space 2014, 66, 1–13. [Google Scholar] [CrossRef]
- Asanuma, H.; Mogi, T.; Tsuchiya, N.; Watanabe, N.; Naganawa, S.; Ogawa, Y.; Fujimitsu, Y.; Kajiwara, T.; Osato, K.; Shimada, K.; et al. Status Report on the Japanese Supercritical Geothermal Project for FY2017. Geotherm. Resour. Counc. 2018, 42, 2366–2370. [Google Scholar]
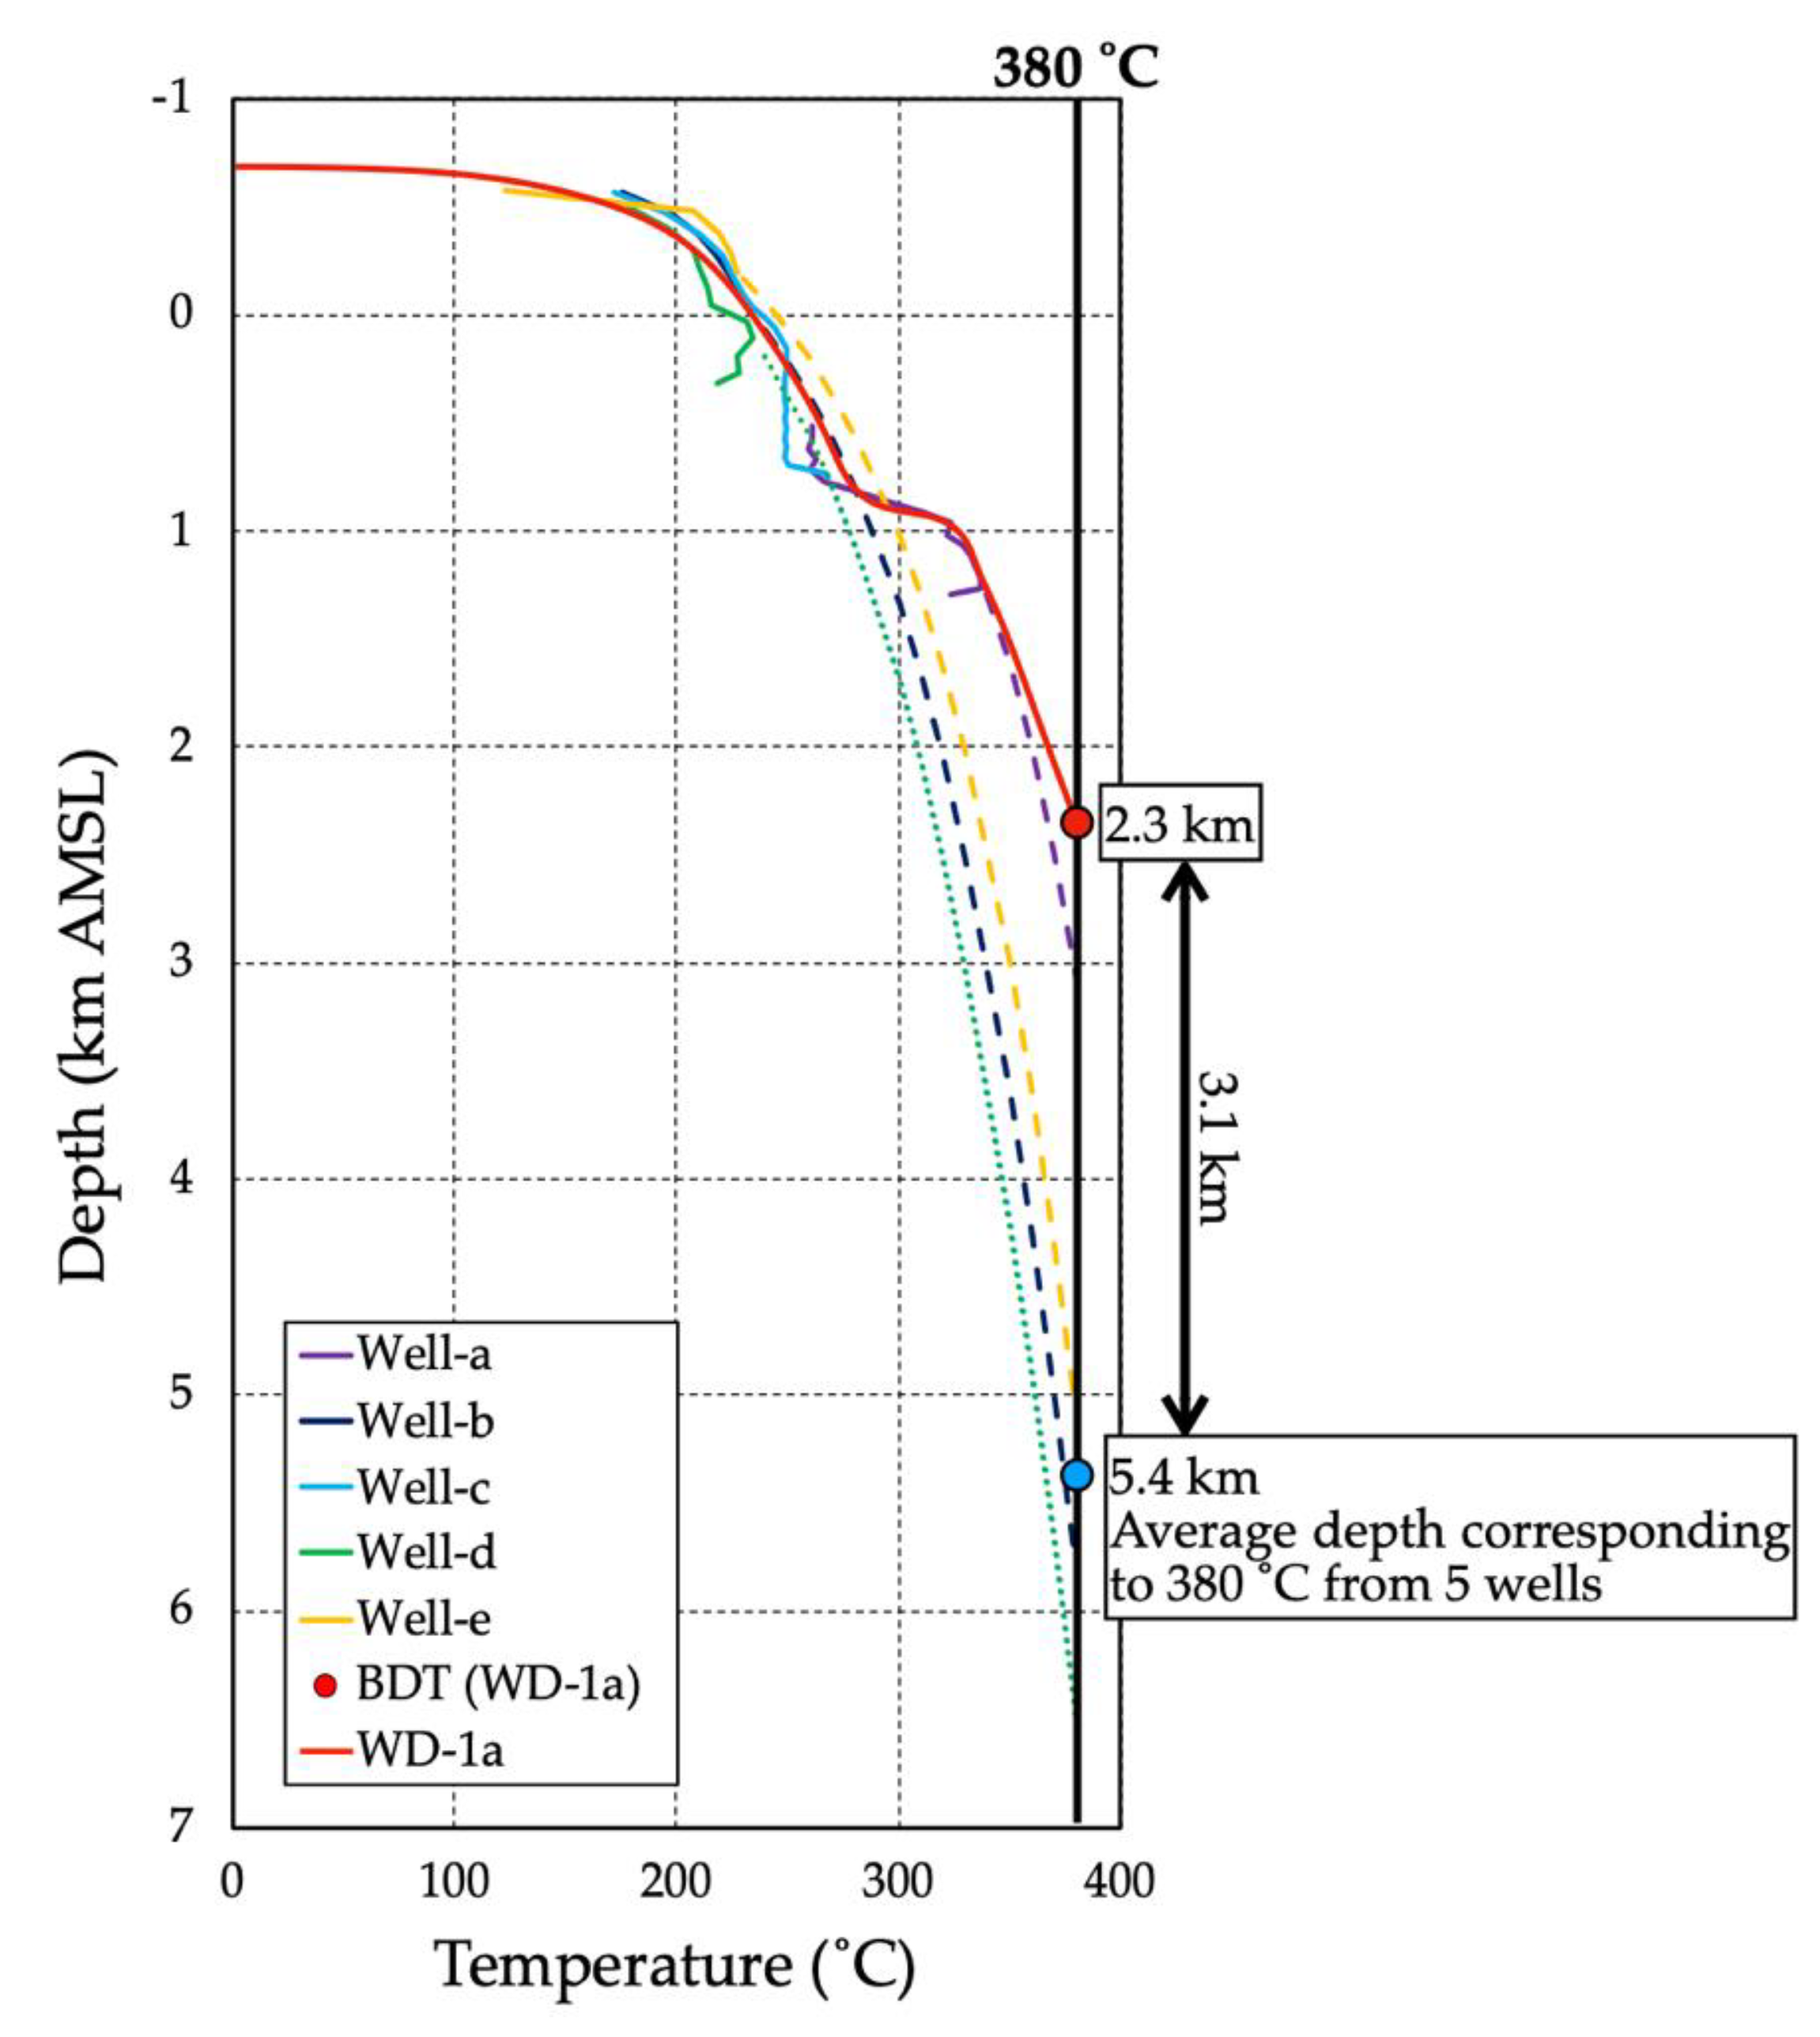
- Ikeuchi, K.; Doi, N.; Sakagawa, Y.; Kamenosono, H.; Uchida, T. High-Temperature Measurements in Well WD-1a and the Thermal Structure of the Kakkonda Geothermal System, Japan. Geothermics 1998, 27, 591–607. [Google Scholar] [CrossRef]
- Muraoka, H.; Uchida, T.; Sasada, M.; Yagi, M.; Akaku, K.; Sasaki, M.; Yasukawa, K.; Miyazaki, S.; Doi, N.; Saito, S.; et al. Deep Geothermal Resources Survey Program: Igneous, Metamorphic and Hydrothermal Processes in a Well Encountering 500 °C at 3729 m Depth, Kakkonda, Japan. Geothermics 1998, 27, 507–534. [Google Scholar] [CrossRef]
- Hayashi, M.; Taguchi, S.; Yamasaki, T. Activity Index and Thermal History of Geothermal Systems. Geotherm. Resour. Counc. 1981, 5, 177–180. [Google Scholar]
- Bredehoeft, J.D.; Papadopulos, I.S. Rates of Vertical Groundwater Movement Estimated from the Earth’s Thermal Profile. Water Resour. Res. 1965, 1, 325–328. [Google Scholar] [CrossRef]
- Ishitsuka, K.; Mogi, T.; Sugano, K.; Yamaya, Y.; Uchida, T.; Kajiwara, T. Resistivity-Based Temperature Estimation of the Kakkonda Geothermal Field, Japan, Using a Neural Network and Neural Kriging. IEEE Geosci. Remote Sens. Lett. 2018, 15, 1154–1158. [Google Scholar] [CrossRef]
- Suzuki, Y.; Ioka, S.; Muraoka, H. Determining the Maximum Depth of Hydrothermal Circulation Using Geothermal Mapping and Seismicity to Delineate the Depth to Brittle-Plastic Transition in Northern Honshu, Japan. Energies 2014, 7, 3503–3511. [Google Scholar] [CrossRef]
- Ministry of the Environment, Japan. The state of use of hot springs in Japan in the fiscal year 2018. Available online: http://www.env.go.jp/nature/onsen/pdf/2-4_p_1.pdf (accessed on 2 June 2020).
- Geothermal Potential Map in Japan, Digital Geoscience Map GT-4 (CD-ROM); Geological survey of Japan, the National Institute of Advanced Industrial Science and Technology (AIST): Tsukuba, Japan, 2009. (In Japanese)
- Tanaka, A.; Yano, Y.; Sasada, M.; Okubo, Y.; Umeda, K.; Nakatsuka, N.; Akita, F. Compilation of Thermal Gradient Data in Japan on the Basis of the Temperatures in Boreholes. Bull. Geol. Surv. Japan 1999, 50, 457–487, (In Japanese with English abstract). [Google Scholar]
- Sakagawa, Y.; Umeda, K.; Suzuki, M.; Kajiwara, T.; Uchida, Y. Database on the Temperature Profiles of Boreholes in Japan. Zishin 2004, 57, 63–67, (In Japanese with English abstract). [Google Scholar]
- Muraoka, H.; Sakaguchi, K.; Tamanyu, S.; Sasaki, M.; Shigeno, H.; Mizugaki, K. Atlas of Hydrothermal Systems in Japan; Geological Survey of Japan, the National Institute of Advanced Industrial Science and Technology (AIST): Tsukuba, Japan, 2007; (In Japanese with English abstract). [Google Scholar]
- Haas, J.L., Jr. The Effect of Salinity on the Maximum Thermal Gradient of a Hydrothermal System at Hydrostatic Pressure. Econ. Geol. 1971, 66, 940–946. [Google Scholar] [CrossRef]
- Hayashi, M. The Target for Exploration of Deep High-Temperature Geothermal Reservoirs. J. Geotherm. Res. Soc. Japan 1982, 4, 81–90, (In Japanese with English abstract). [Google Scholar]
- Wessel, P.; Smith, W.H.F.; Scharroo, R.; Luis, J.; Wobbe, F. Generic Mapping Tools: Improved Version Released. Eos Trans. Am. Geophys. Union 2013, 45, 409–420. [Google Scholar] [CrossRef]
- Shoji, T.; Koike, K. Lecture Note: Geostatistics Kriging—Estimation of Spatial Data Taking Account of Error. J. Geotherm. Res. Soc. Japan 2007, 29, 183–194. (In Japanese) [Google Scholar]
- Chiles, J.P.; Delfiner, P. Geostatistics: Modeling Spatial Uncertainty, 2nd ed.; John Wiley & Sons: New York, NY, USA, 1999; pp. 150–230. [Google Scholar]
- Okada, Y.; Kasahara, K.; Hori, S.; Obara, K.; Sekiguchi, S.; Fujiwara, H.; Yamamoto, A. Recent progress of Seismic Observation Networks in Japan Hi-net, F-net, K-NET and KiK-net. Earth Planets Space 2004, 56, 15–28. [Google Scholar] [CrossRef]
- Ohta, Y.; Ohzono, M.; Miura, S.; Iinuma, T.; Tachinaba, K.; Takatsuka, K.; Miyao, K.; Sato, T.; Umino, N. Coseismic Fault Model of the 2008 Iwate-Miyagi Nairiku Earthquake Deduced by a Dense GPS Network. Earth Planets Space 2008, 60, 1197–1201. [Google Scholar] [CrossRef]
- Tanaka, A. Geothermal Gradient and Heat Flow Data in and Around Japan (II): Crustal Thermal Structure and its Relationship to Seismogenic Layer. Earth Planets Space 2004, 56, 1195–1199. [Google Scholar] [CrossRef]
- Omuralieva, A.M.; Hasegawa, A.; Matsuzawa, T.; Nakajima, J.; Okada, T. Lateral Variation of the Cutoff Depth of Shallow Earthquakes beneath the Japan Islands and Its Implications for Seismogenesis. Tectonophys 2012, 518–521, 93–105. [Google Scholar] [CrossRef]
- Ito, K. Cutoff Depth of Seismicity and Large Earthquakes near Active Volcanoes in Japan. Tectonophys 1993, 217, 11–21. [Google Scholar] [CrossRef]
- The R Project for Statistical Computing. Available online: https://www.R-project.org/ (accessed on 2 June 2020).


© 2020 by the authors. Licensee MDPI, Basel, Switzerland. This article is an open access article distributed under the terms and conditions of the Creative Commons Attribution (CC BY) license (http://creativecommons.org/licenses/by/4.0/).
Share and Cite
Suzuki, Y.; Muraoka, H.; Asanuma, H. Validation and Evaluation of an Estimation Method for Deep Thermal Structures Using an Activity Index in Major Geothermal Fields in Northeastern Japan. Energies 2020, 13, 4684. https://doi.org/10.3390/en13184684
Suzuki Y, Muraoka H, Asanuma H. Validation and Evaluation of an Estimation Method for Deep Thermal Structures Using an Activity Index in Major Geothermal Fields in Northeastern Japan. Energies. 2020; 13(18):4684. https://doi.org/10.3390/en13184684
Chicago/Turabian StyleSuzuki, Yota, Hirofumi Muraoka, and Hiroshi Asanuma. 2020. "Validation and Evaluation of an Estimation Method for Deep Thermal Structures Using an Activity Index in Major Geothermal Fields in Northeastern Japan" Energies 13, no. 18: 4684. https://doi.org/10.3390/en13184684
APA StyleSuzuki, Y., Muraoka, H., & Asanuma, H. (2020). Validation and Evaluation of an Estimation Method for Deep Thermal Structures Using an Activity Index in Major Geothermal Fields in Northeastern Japan. Energies, 13(18), 4684. https://doi.org/10.3390/en13184684