Article

Effect of Impulse Polarity on a New Grounding Device with Spike Rods (GDSR)

by
Abdul Wali Abdul Ali
,
Nurul Nadia Ahmad
and
Normiza Mohamad Nor
*
Faculty of Engineering, Multimedia University, Cyberjaya 63100, Malaysia
*
Author to whom correspondence should be addressed.
Energies 2020, 13(18), 4672; https://doi.org/10.3390/en13184672
Submission received: 23 July 2020 / Revised: 22 August 2020 / Accepted: 7 September 2020 / Published: 8 September 2020
(This article belongs to the Section F: Electrical Engineering)

Abstract

:
The characterizations of grounding systems subjected to high impulse conditions are known to be dependent on the polarity, current to peak time and discharge time, as well as the electrical properties of the soil, and the grounding electrodes themselves. It is therefore important to investigate the behavior of grounding systems under high impulse conditions under negative impulse polarity, and compare it with positive impulse polarity results. Experimental test results for the same grounding systems installed with various earth electrodes at several sites under positive impulse polarity have previously been presented. In comparison, this paper presents the results of negative impulse polarity injected on the same grounding systems. It is found that a significant difference between positive and negative impulse polarities is observed for the grounding systems installed at high soil resistivity.

1. Introduction

Impulse polarity has been known to affect the performance of many dielectric materials, such as oil, gas and solid insulators [1,2,3,4,5], as well as other materials, namely conductive water [6,7,8], soil or grounding systems [9,10,11,12,13,14,15,16]. Among these, the typical observations on the differences due to impulse polarities are, in terms of streamer propagation, that such streamers exhibit a distinctive treelike shape for a positive impulse, as compared to resembling a bush under a negative impulse for all solid samples [5]. A leader streamer was found to propagate from the live terminal of the rod to the ground when a positive polarity was applied to the gaps of a rod-plane with barriers made of dielectric material, whereas a leader was found to propagate from the ground to the rod-plane when applied with negative impulse polarity [3]. There were higher breakdown voltages for negative polarity than for positive impulse polarity for a rod–rod gap in air [2], where there were larger differences between positive and negative breakdown voltages in larger gap spacing. Similarly, lower breakdown voltage in positive impulse polarity was seen for a CF31/N2 gas mixture in a highly non-uniform electric field, compared to negative impulse polarity [2].
Though most electrical equipment experiences breakdown at lower voltage under positive rather than negative impulse polarity [2,3,5], some impulse tests on high voltage applications show higher breakdown voltage in positive impulse polarity as compared to negative impulse polarity [7]. Zhao et al. [2] found that in a slightly non-uniform field, and with a shorter electrode gap of 5 mm, breakdown voltage under positive impulse polarity is higher than breakdown voltage under negative impulse polarity. Similarly, Darveniza [6] found lower breakdown voltage in negative impulse than positive impulse polarity for an air gap between the Cross-linked Polyethylene (XLPE) insulated conductors.
For the study of soil characterizations under both impulse conditions, many studies [9,10,11,12,13,14,15,16] have highlighted the differences in impulse polarity, in terms of impulse resistance and breakdown voltage. A notable photographic observation was performed by Cabrera [10], who obtained the photographic information of sand discharges when subjected to DC and impulse conditions. It was observed in his study [10] that under positive applied DC, the streamers propagated from the high voltage electrode to the ground, and vice versa when the applied voltage was under negative polarity. Similar observations were seen under impulse conditions, where under positive impulse, the main discharge channel was from the live terminal of the electrode to the ground, and when the test cell was subjected to negative impulse polarity, the discharges seemed to propagate from the grounded electrode to the high voltage electrode. On the other hand, Loboda and Scuka [12] found that impulse resistance values of various soils subjected to various front times of impulse voltages, from 2 to 10us, were not affected by impulse polarity. Similarly, Petropoulos [9] found that impulse resistance values had a small dependence on impulse polarities for both types of active electrodes used in his experiment: a spherical electrode and a spherical electrode fitted with points or spikes. Similarly, higher impulse resistance of grounding electrodes when subjected to negative impulse polarity in comparison to positive impulse polarity was observed by Mohamad Nor et al. [13]. They [13] also observed a slightly higher breakdown voltage under negative rather than positive impulse polarity. On the other hand, some studies [15,16,17] recently published on the investigations of grounding systems under high impulse conditions by field measurements found that the dependency of grounding systems on impulse polarities was on the steady-state of the ground resistance value, Rdc. Reffin et al. [15] found that under negative impulse polarity, higher impulse resistance was observed than for impulse resistance under positive impulse polarity for an Rdc of 52 Ω, whereas impulse resistance values were independent of the polarity effect for grounding systems with Rdcs of 14 and 4 Ω. Similar observations were noted by Abdul Ali et al. [16], that negative impulse polarity caused higher impulse resistance values than positive impulse polarity for four grounding systems with Rdc values ranging from 18 to 76 Ω. For a lower Rdc value of 15 Ω, impulse resistance was found not to be affected by impulse polarity, and for an Rdc value of 11 Ω, a reversal was seen, where there was higher impulse resistance under positive than negative impulse polarity.
In conclusion, some studies found lower breakdown voltage and lower impulse resistance values of grounding systems when subjected to positive impulse polarity. On the other hand, some studies showed that impulse polarity was very much dependent on the Rdc values of the grounding systems. Generally, for high voltage applications, testing under positive rather than negative impulse polarity is more crucial, since breakdown normally occurs at lower voltage for positive impulse polarity. Thus, many tests on electrical equipment are performed under positive polarity. However, due to inconclusive observations noted in some studies, where there is a lower breakdown voltage under negative impulse polarity, especially in low Rdc, it is therefore important to explore the soil characteristics under negative impulse polarity. It has also been discovered that tropical countries such as Malaysia have more than 90% of their collected lightning strike data from 2004 to 2015 in the form of negative lightning strikes [18], which inspires the need to further study grounding system characteristics under negative impulse polarity. In grounding systems, higher current magnitudes with lower voltage levels to cause breakdown are preferred in order to allow a high level of discharge of currents into the ground. Given that the large percentage of lightning strikes in Malaysia consist of negative polarity, which is known to cause a higher breakdown voltage for electrical applications, it may not be advantageous for the grounding systems to have a high breakdown voltage and a lower current being discharged to the ground under negative impulse polarity. In addition, this study is anticipated to gear towards an improvement in the design of grounding systems in the future, particularly in the dimension of grounding electrodes under negative impulse polarity.
This paper presents the results of experimental work performed on six earth electrodes, installed at three field sites under negative impulse polarity, which are compared to the results for positive impulse polarity presented previously in [17]. It is revealed from the study that under negative impulse polarity, higher Zimpulse and slower discharge time are observed than for the Zimpulse and discharge time of positive impulse polarity for earth electrodes installed at high soil resistivity (site 2).

2. Experimental Arrangement

Using the same earth electrodes for remote earth, voltage and current probes, impulse generating test circuits and test procedures as in [17], impulse tests under negative impulse polarity with increasing current magnitudes were performed right after the positive impulse polarity tests. Figure 1 shows the experimental arrangement used in this study for all three sites. An impulse generator was used, where a range of voltage levels from 30 to 210 kV were applied to the ground electrodes under test. A current transformer (CT) with the ratio of 0.01 VA−1 and a resistive divider with a 3890:1 ratio were used for current and voltage measurement respectively, which were captured in Digital Storage Oscilloscopes (DSOs). All the cables were placed above the ground, with an insulation rod of 1 m length, to provide enough clearance from the ground. The test set up and measurements were based on the patent filed in [19].

3. Test Results

The results are presented in Table 1 and Table 2, showing the soil resistivity values and steady-state earth resistance value (Rdc) respectively, as presented in [17]. Voltage and current traces for negative impulse polarity similar to those captured in [17] for positive polarity were observed (see Figure 2 and Figure 3). Comparative results between the positive and negative impulse polarities were studied based on current rise time, discharge time and impulse resistance values, as in [17].

3.1. Time to Peak Current

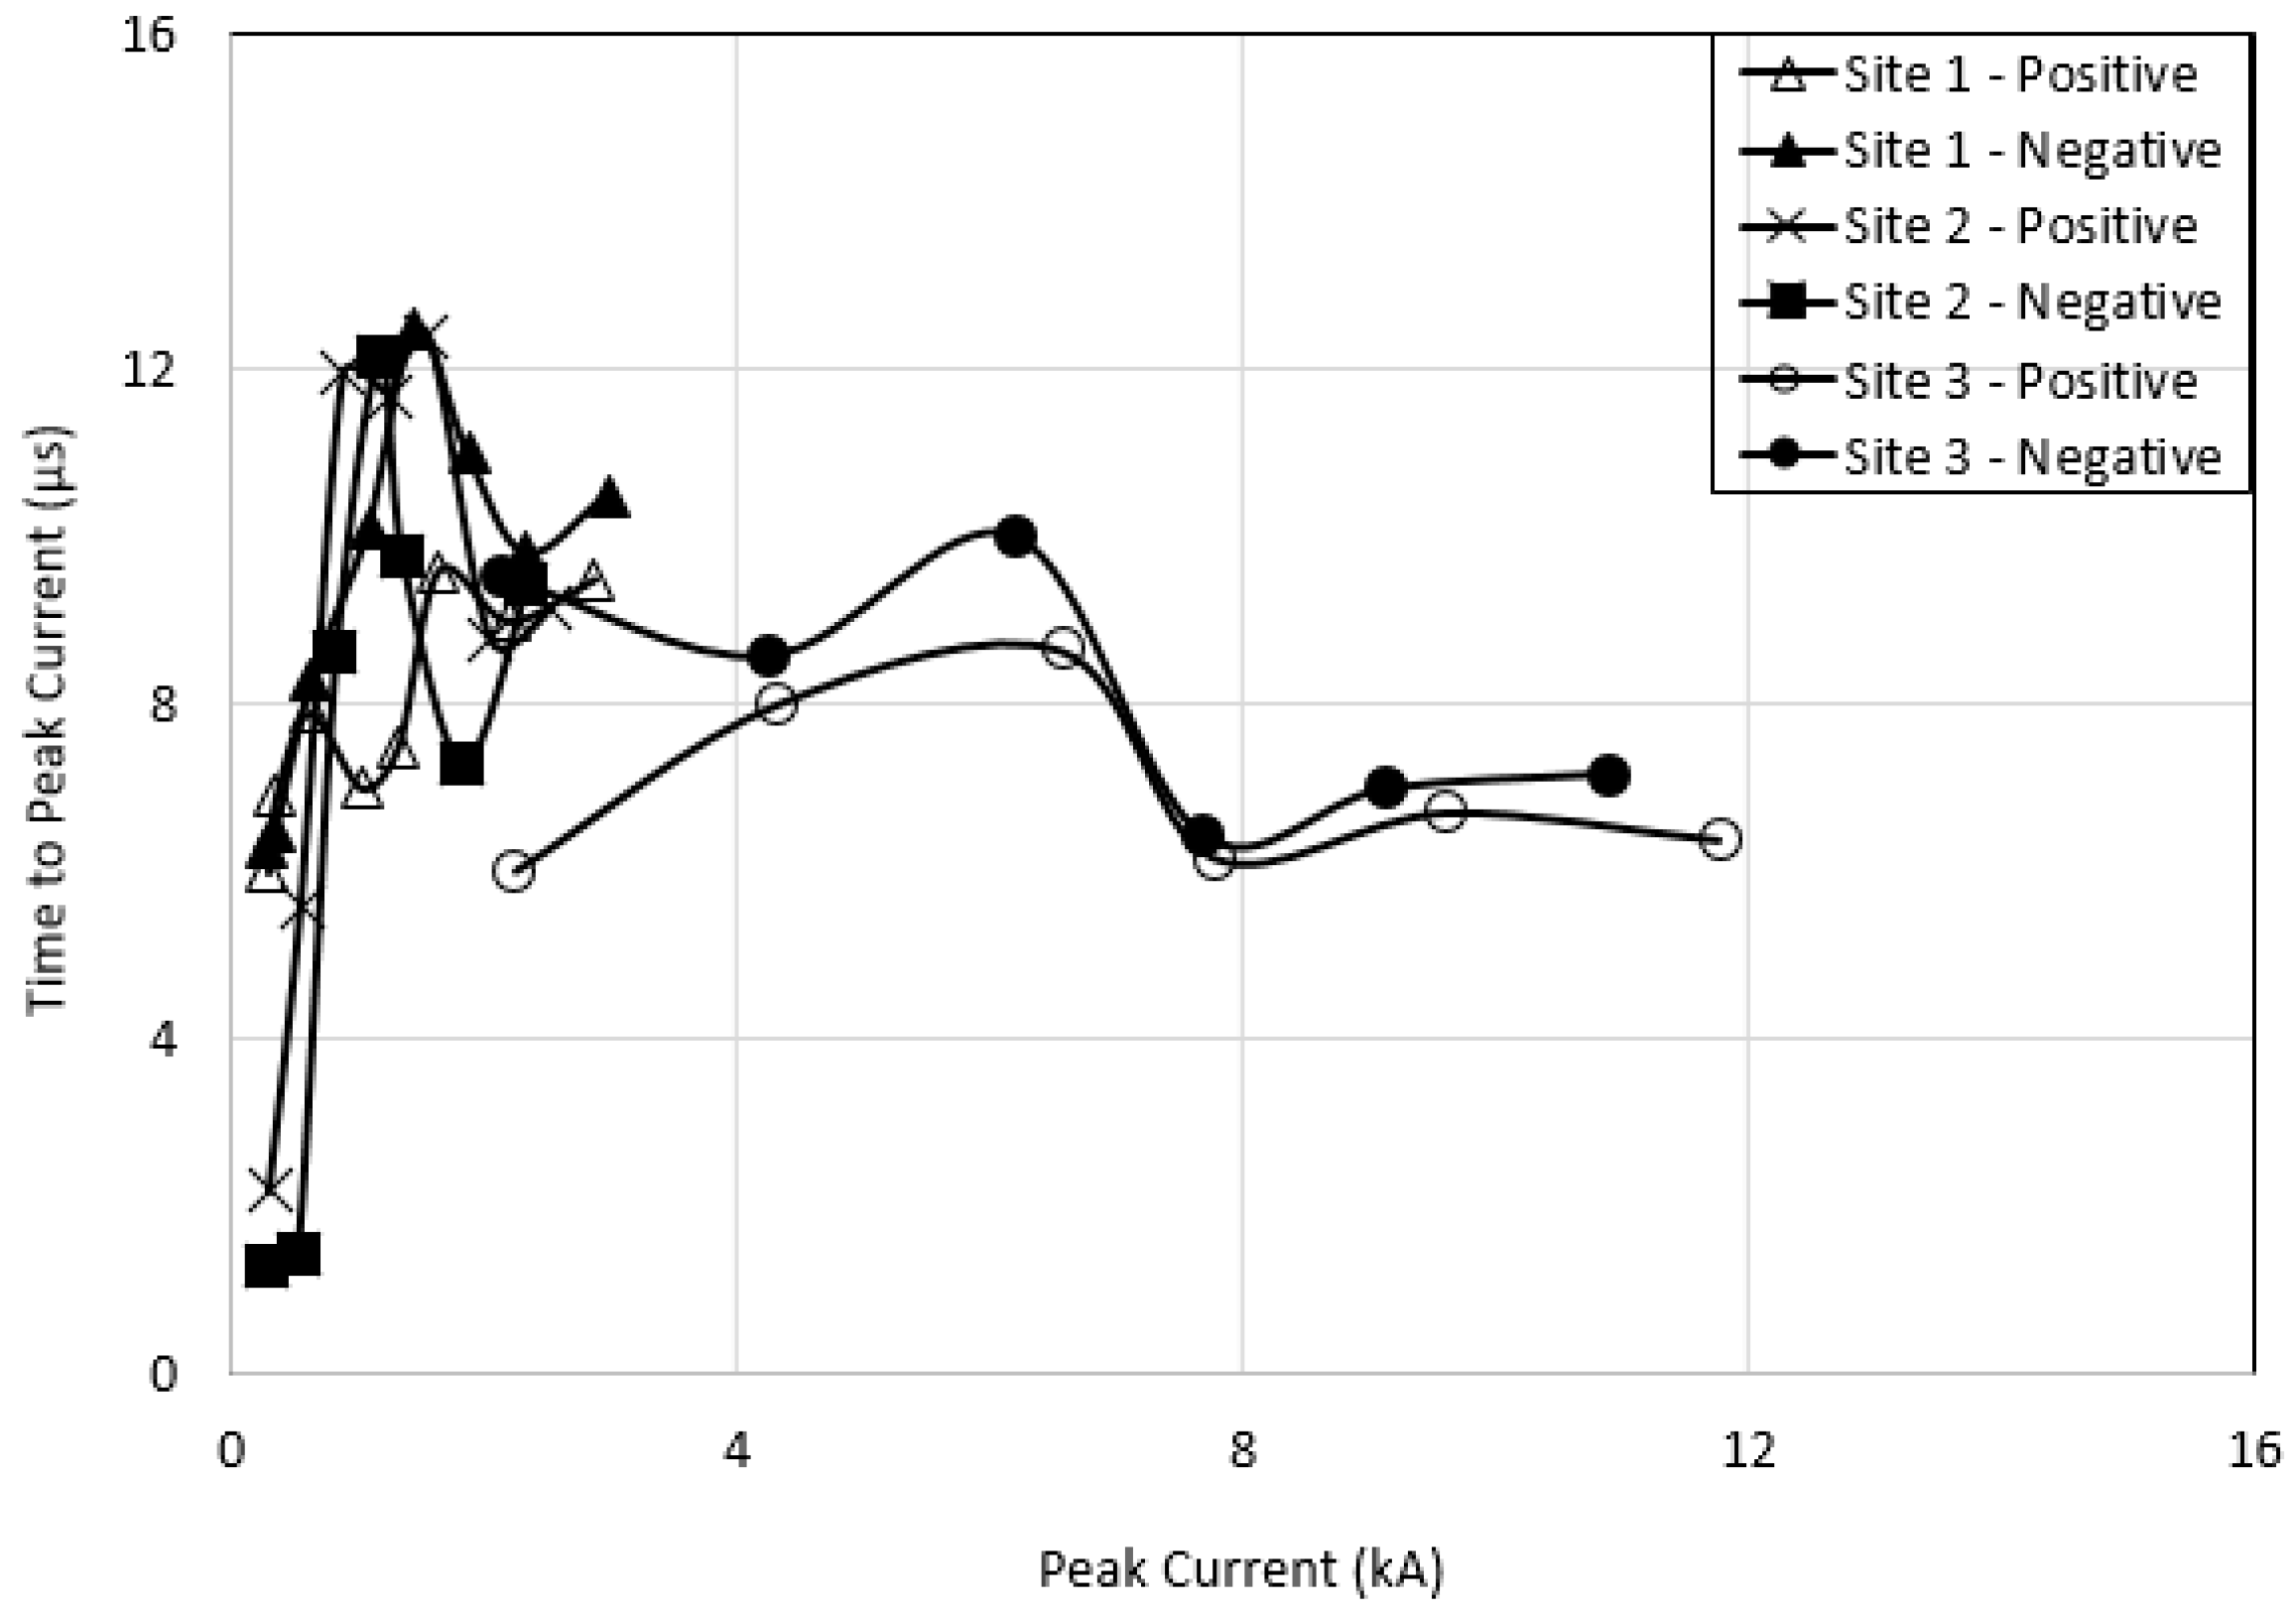
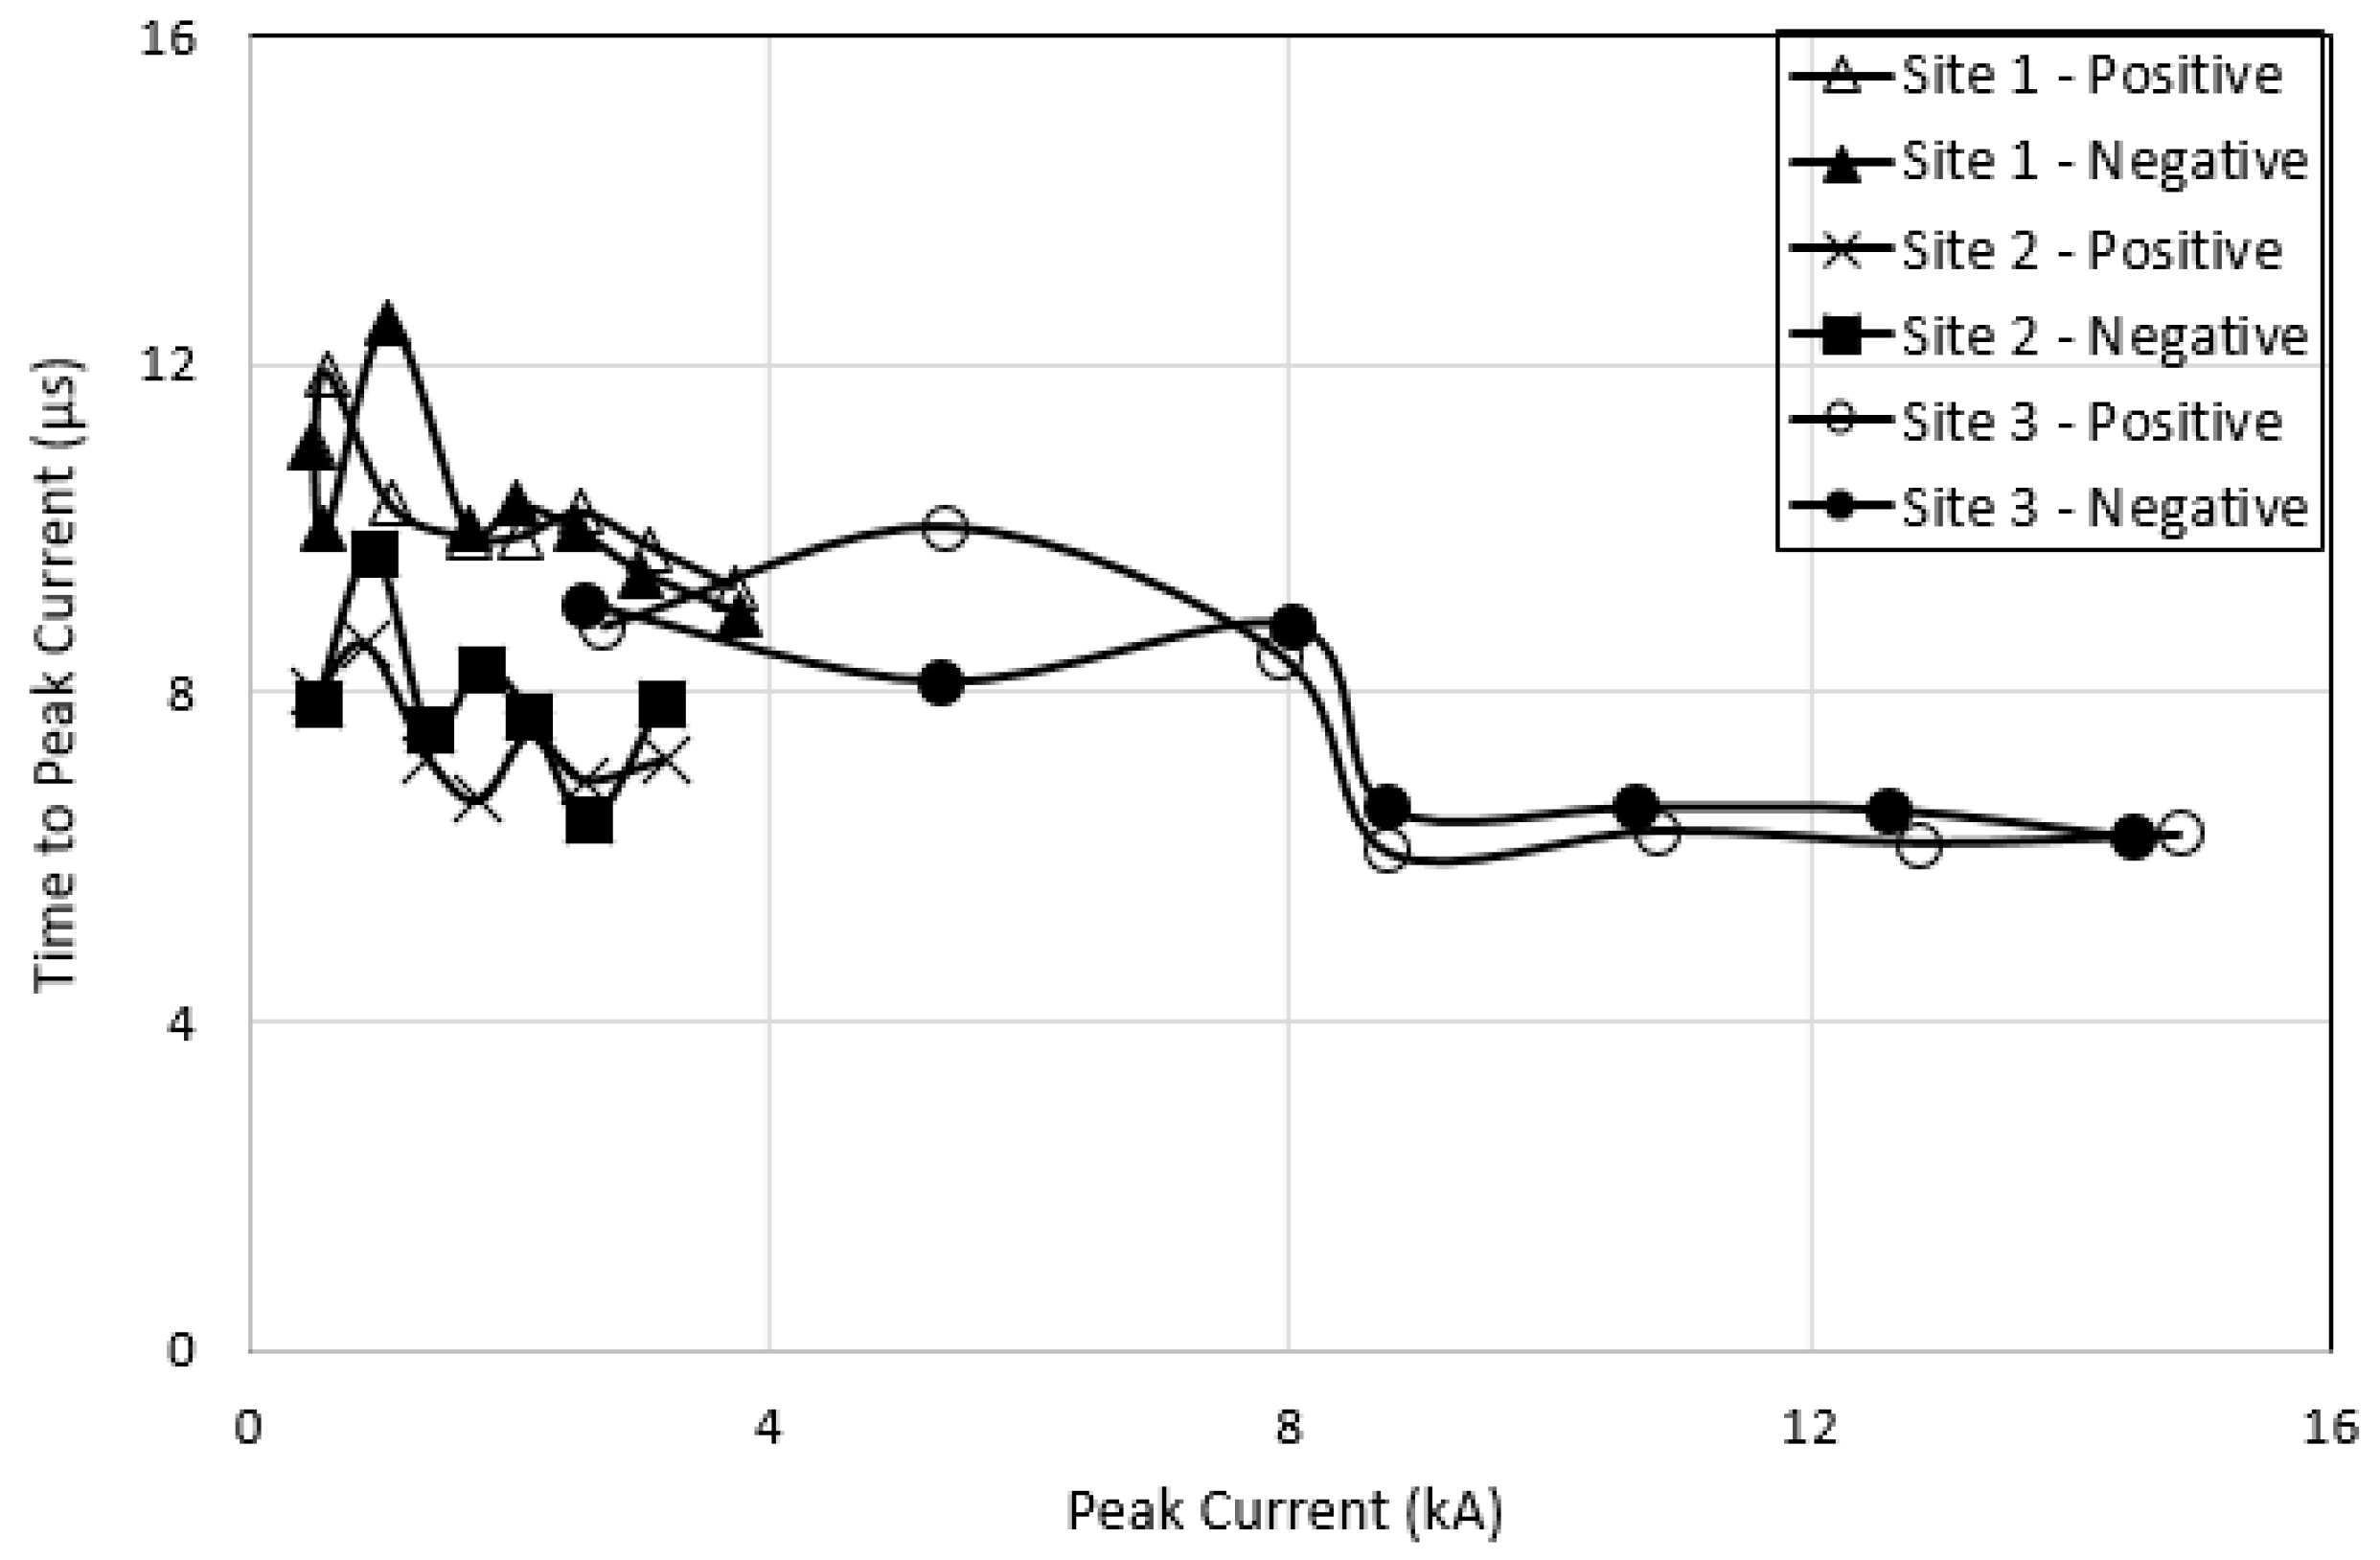
Time to peak current versus peak current plots for all tested grounding systems under positive impulse polarity have been presented in [17]. In this section, time to peak current versus peak current is compared between the positive and negative impulse polarities for all grounding systems. Figure 4, Figure 5 and Figure 6 show the plots of time to peak current of negative impulse polarities for sites 1, 2 and 3 respectively. It can be seen from the figures that the growth rate of conduction is slower at low current magnitudes, and current magnitudes are almost constant for all earth electrodes at higher current magnitudes, with current magnitudes above 2, 3 and 9 kA for sites 1, 2 and 3 respectively. The trend of slower time to peak current at low current magnitudes is similar to the values obtained under positive impulse polarity, as presented in [17]. It was also observed that earth electrodes installed at site 1 had the highest time to peak current, which can be seen in Figure 7, Figure 8, Figure 9, Figure 10, Figure 11 and Figure 12 for earth electrodes 1, 2, 3, 4, 5 and 6 respectively. It was also observed that there was no specific pattern per se on a relation of impulse polarity on the time to peak current, as can be seen in Figure 7, Figure 8, Figure 9, Figure 10, Figure 11 and Figure 12 for earth electrodes 1, 2, 3, 4, 5 and 6 respectively. For some earth electrodes installed at various sites, negative polarity was found to have slower time to peak current and vice versa for the same earth electrode at different sites. Table 3, Table 4, Table 5 and Table 6 summarize the time to peak current for various earth electrodes and soil resistivities under negative impulse polarity, and under both impulse polarities.

3.2. Discharge Time

In [17], the time taken for the current trace to discharge to the ground indicates how effective the grounding systems are; the faster the discharge time, the more effective the grounding systems would be. In this paper, impulse test results are plotted for negative impulse polarities in Figure 13, Figure 14 and Figure 15 for earth electrodes installed at sites 1, 2 and 3 respectively. Similar to those found under positive impulse polarity [17], faster discharge time to zero for a current trace with increasing current shows better conduction at high magnitudes of current. A distinctive difference can be seen from all these figures, where the ranges of discharge times noted for sites 1, 2 and 3 are from 200 to 800 μs, 200 to 1200 μs and 120 to 200 μs respectively. This indicates that the lower the soil resistivity, the lower the Rdc is, hence the more effective the grounding systems are in discharging the current to the ground. In this paper, the discharge time versus applied voltage for each earth electrode installed at various sites under both positive and negative impulse polarities is also plotted, as shown in Figure 16, Figure 17, Figure 18, Figure 19, Figure 20 and Figure 21, for earth electrodes 1, 2, 3, 4, 5 and 6 respectively. The highest discharge time occurred for earth electrodes installed at site 2, followed by sites 1 and 3 for negative impulse polarity. It can be seen that for the same applied voltage and earth electrode, large differences were observed between the discharge times of site 2 and site 1, and site 1 and site 3, where for a certain applied voltage the difference was more than 50%. Results revealed that for site 1, the discharge time was found to be lower for all earth electrodes subjected to negative rather than positive impulse polarity. This was found to be contradictory for the earth electrodes installed at site 2, where it was observed that all earth electrodes installed had slower discharge times when subjected to negative rather than positive impulse polarity. Slower discharge times for grounding systems subjected to negative impulse polarity were also observed for most earth electrodes installed at site 3. However, for earth electrodes 1 and 4 installed at site 3, there was no impulse polarity effect seen in terms of discharge time. In several publications [9,10,11,12,13], lower conduction currents and higher voltage magnitudes are needed to cause the breakdown in grounding systems subjected to negative impulse polarity.
Cabrera et al. [11] observed that for sand grains of a size above 1 mm, and above 10 MΩ, higher voltage causing breakdown was seen when the sand was subjected to negative rather than positive impulse polarity. Contradictorily, for the soil of similar resistivity above 10 MΩ, but with a fine grain size, they [11] found higher breakdown voltage in positive impulse polarity than in negative impulse polarity. No effect was seen in their study of impulse polarity for soil with soil resistivity lower than 10 MΩ [11]. In this study, it was observed that the highest soil resistivity occurred at site 2 and as can be seen in some publications [15,16], the coarser the soil, the higher the soil resistivity. Though no measurement was taken on the soil composition and coarseness of the soil, it is presumed that site 2 may have coarser types of soil due to its high soil resistivity. A rather more significant impulse polarity effect was seen for earth electrodes installed at site 2, in which the grounding systems experienced lower conduction; hence, a slower time for the current to discharge to the ground when subjected to negative impulse polarity.
From the Figures, the differences between the positive and negative impulse polarity were observed for grounding systems with high Rdc (all earth electrodes installed at site 2). This trend could be related to a high electric field in high resistivity soil, hence its relative Rdc, as seen in [17], where the earth electrodes at site 2 had electric field values 70% times higher than the electric field values for sites 1 and 3. Furthermore, this shows that for electrodes with a high electric field, a significant difference can be expected in impulse polarity. Table 7, Table 8, Table 9 and Table 10 summarize the results of discharge times when subjected to a negative impulse, and to both impulse polarities.

3.3. Impulse Impedances, Zimpulse

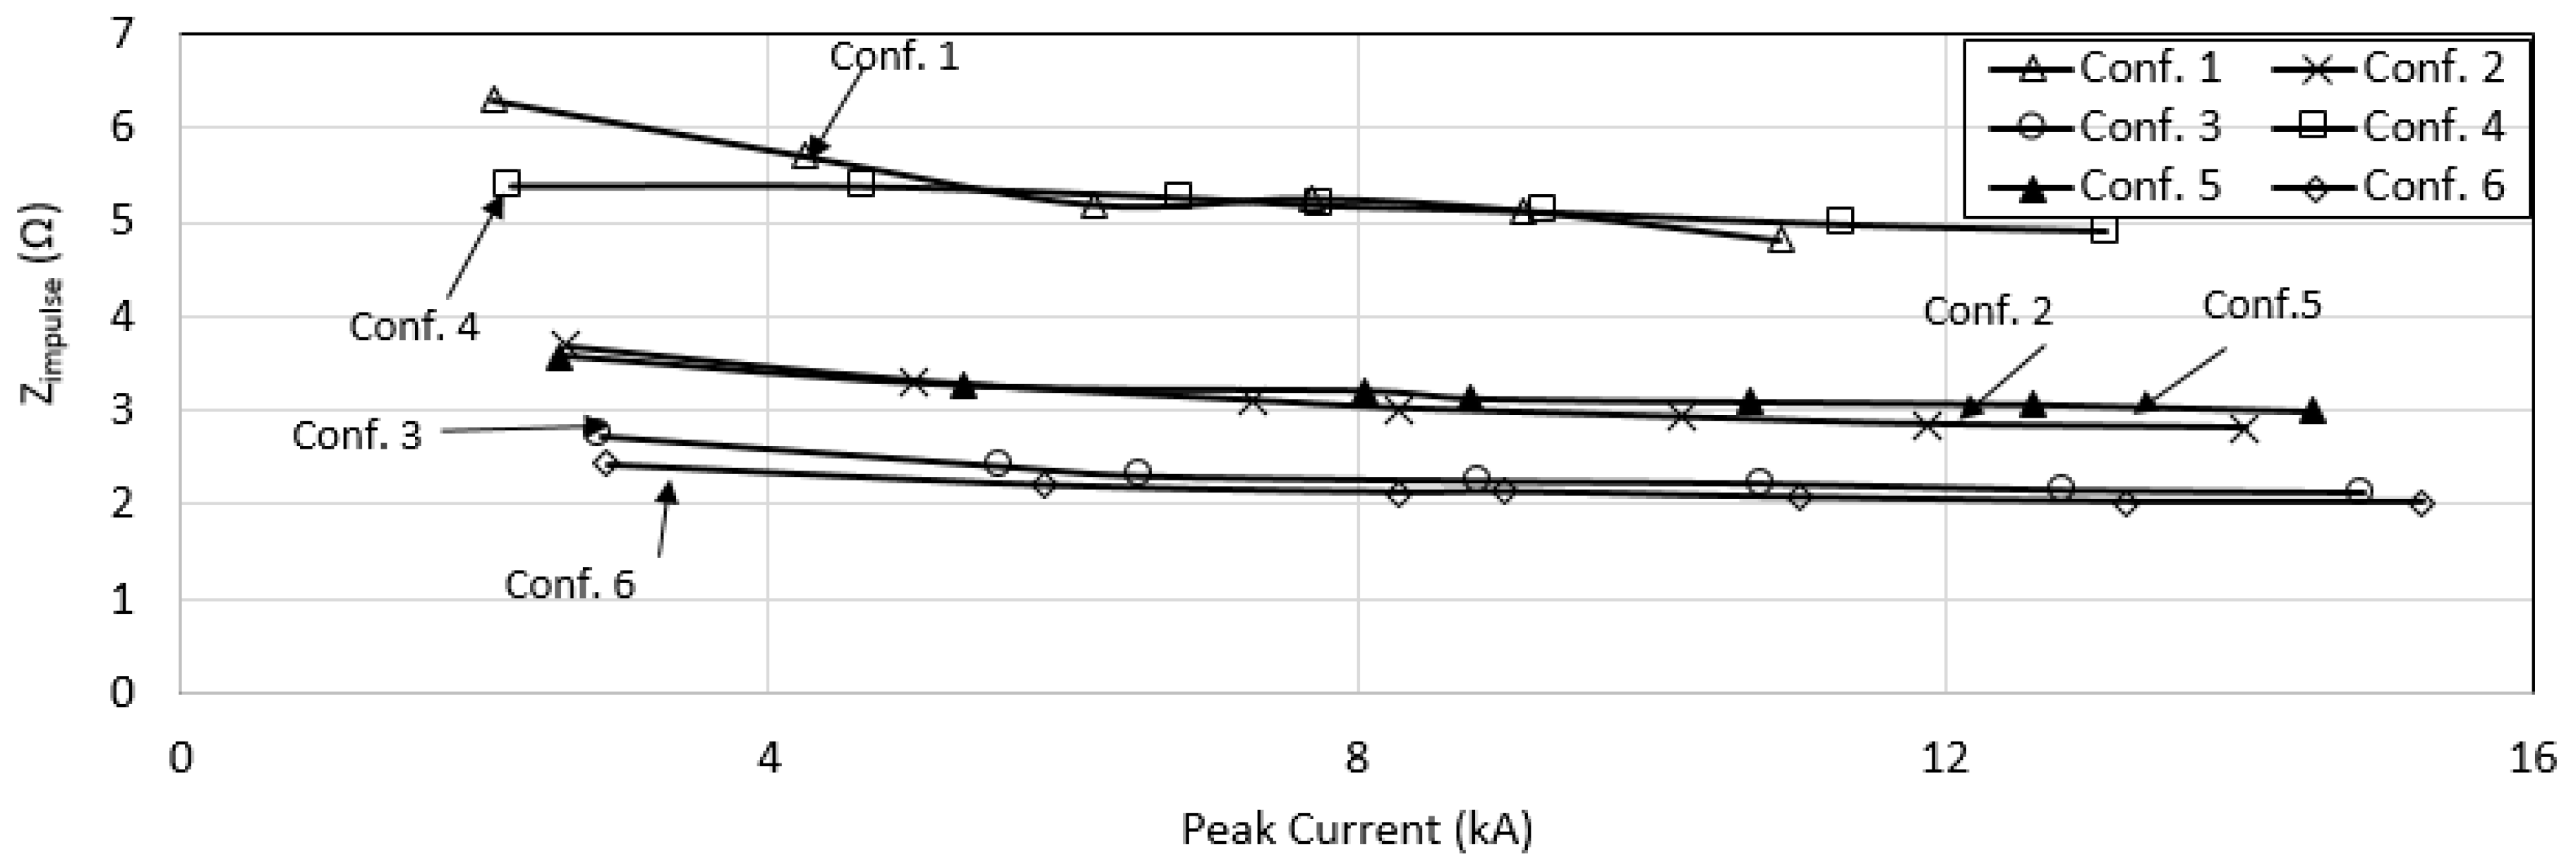
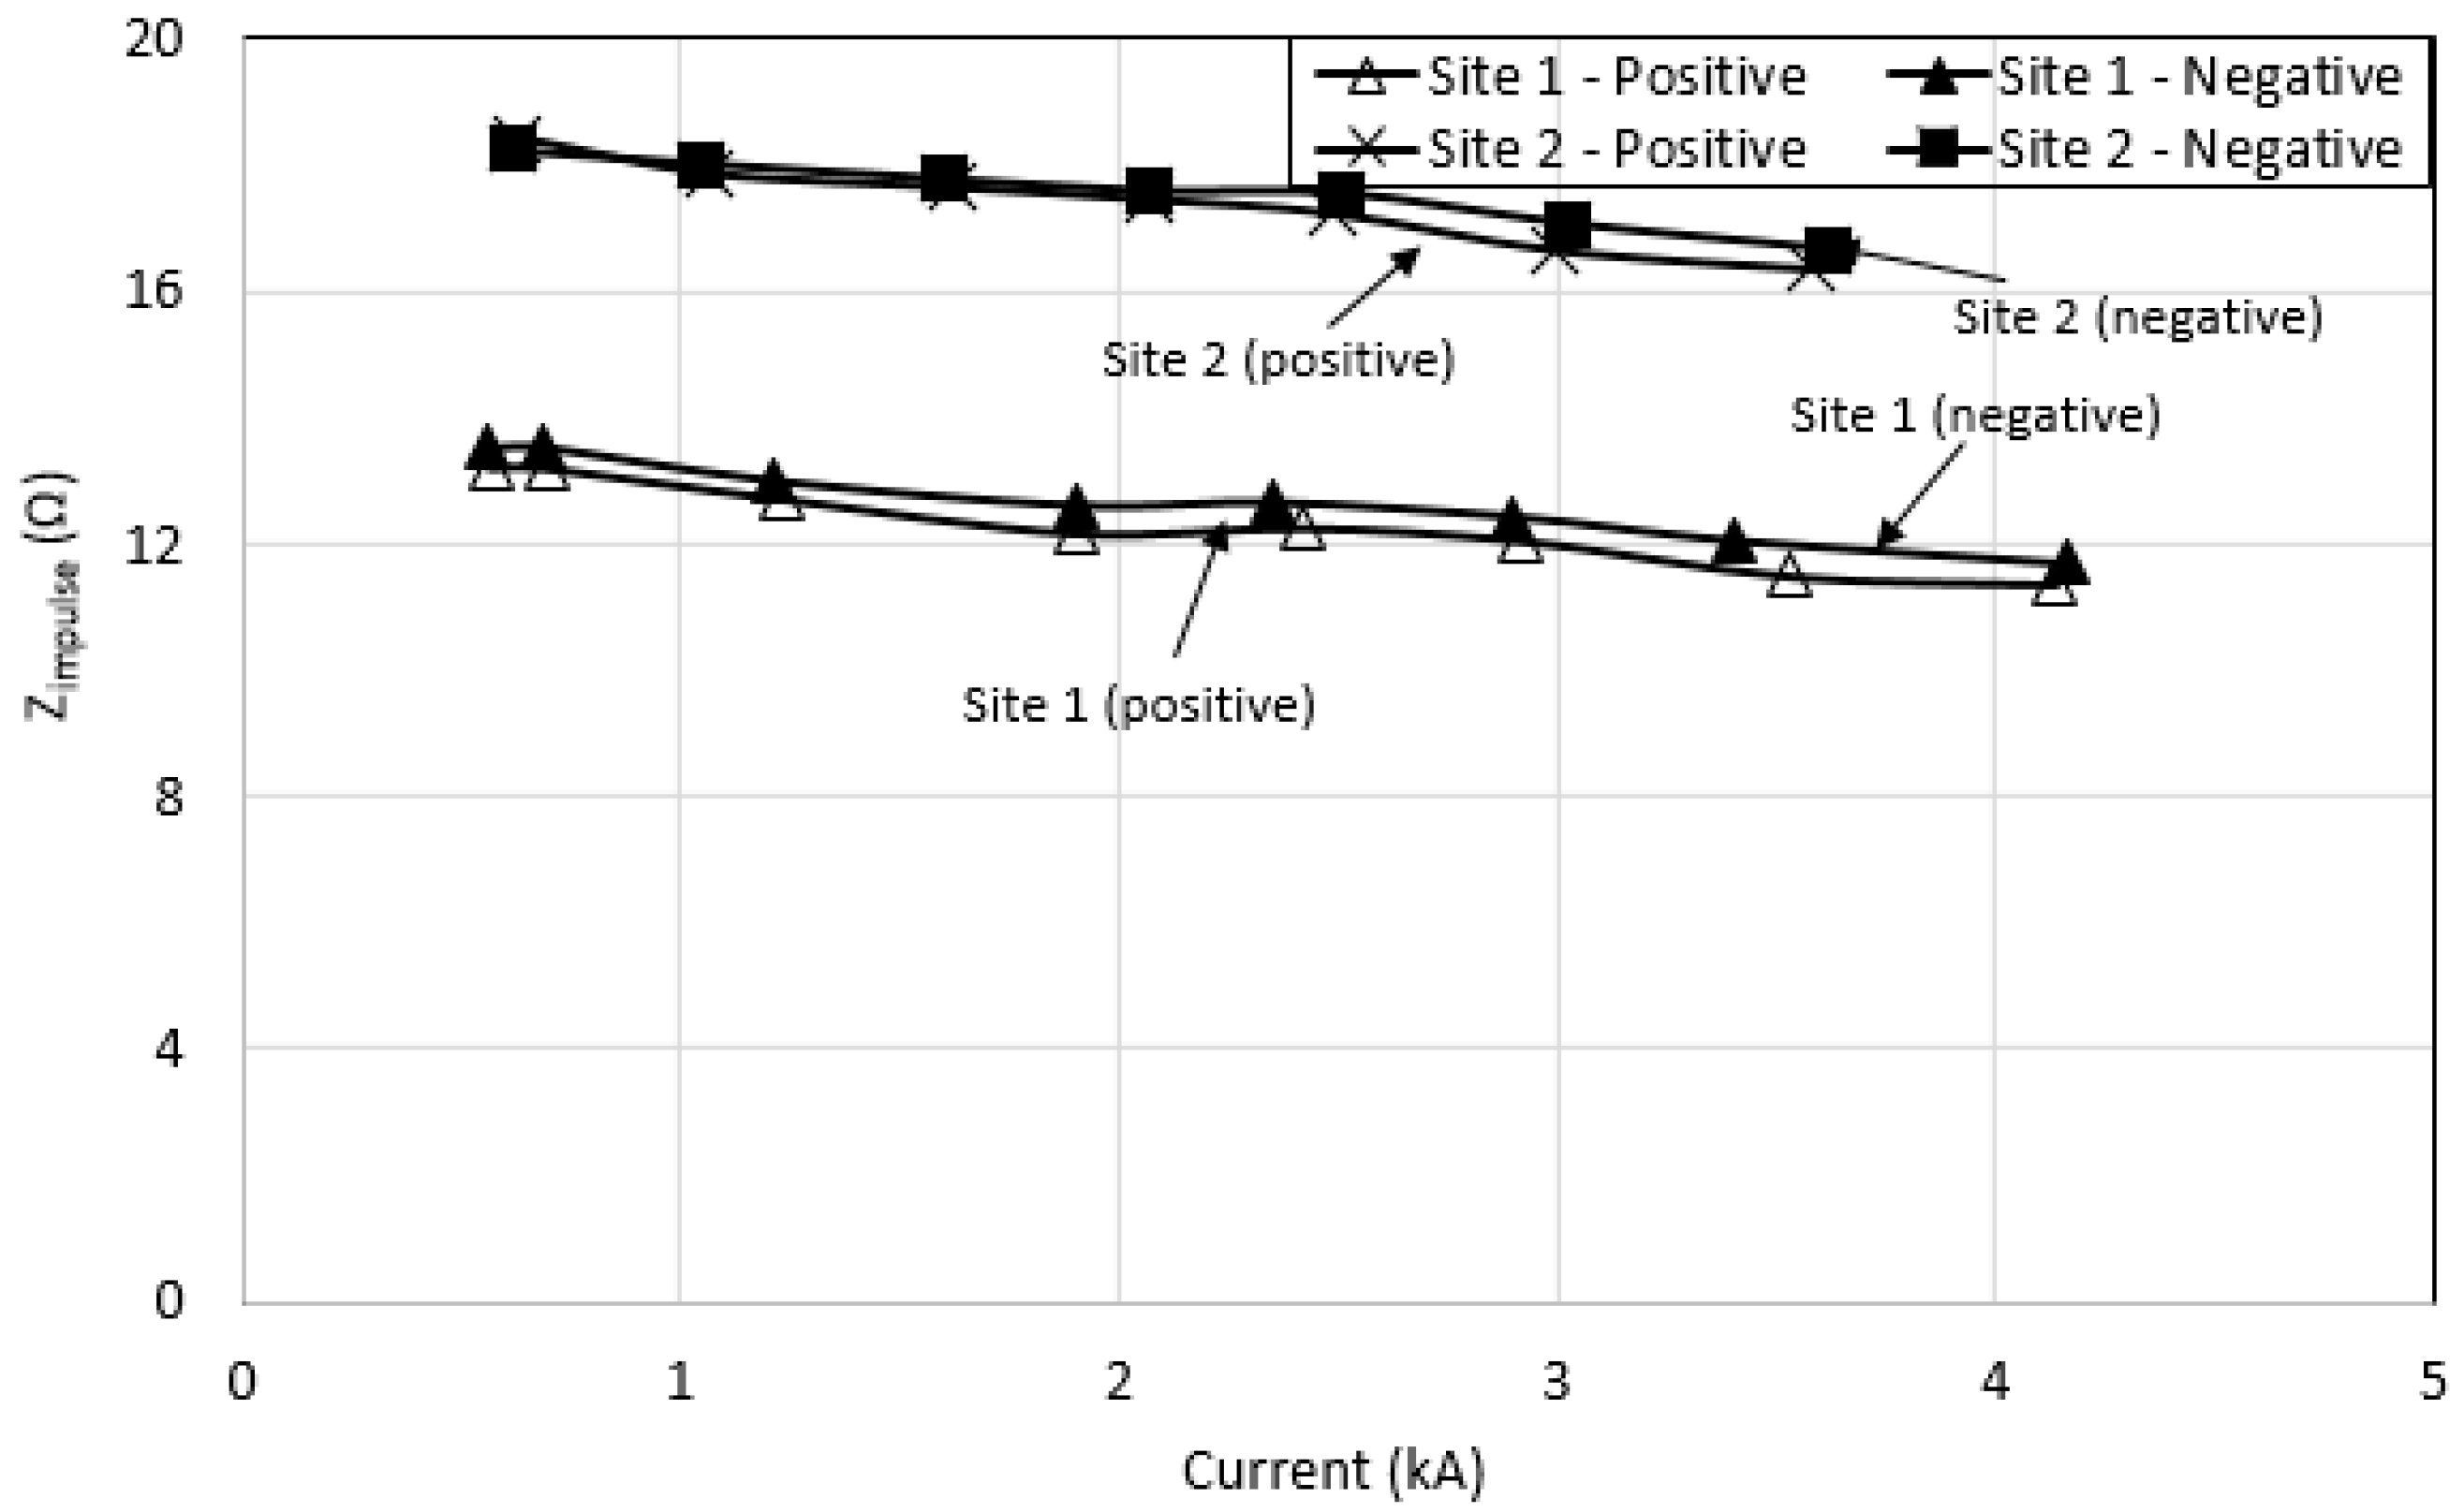
Impulse impedance (Zimpulse) values have been used in several studies [15,16,17] to indicate the degree of reduction of Zimpulse when subjected to high impulse currents. In [17], impulse impedance values for earth electrodes with high Rdc, when subjected to positive impulse polarity, were found to decrease with increasing current magnitudes. Similar trends are seen for negative impulse polarity as shown in Figure 22, Figure 23 and Figure 24 for sites 1, 2 and 3 respectively, where the higher the Rdc, the higher the dependence of Zimpulse to currents. When Zimpulse versus peak current is plotted for each earth electrode at all sites, it is observed that earth electrodes installed at site 2 had the highest Zimpulse, followed by earth electrodes installed at sites 1 and 2 (see Figure 25, Figure 26, Figure 27, Figure 28, Figure 29 and Figure 30 for earth electrodes 1, 2, 3, 4, 5 and 6 respectively). It is also observed that for the same peak current and earth electrodes, large differences in Zimpulse values are seen between earth electrodes installed at sites 2 and 1, and sites 1 to 3; i.e., percentage differences between Zimpulse of sites 1 and 2 for earth electrodes 1, 2, 3, 4, 5 and 6 at a peak current of 2 kA are around 55, 20, 28, 25, 22 and 24% respectively for negative impulse polarity. It is observed that the percentage differences between earth electrodes installed at sites 1 and 2 of Zimpulse are not dependent on the percentage differences of their Rdc values, as presented in Table 2, where the percentage differences between Rdc values for sites 1 and 2 for earth electrodes 1, 2, 3, 4, 5 and 6 are 36, 44, 42, 21, 38 and 39% respectively.
Results of Zimpulse for both positive and negative impulse polarities for site 3 are presented in [16], where it was found that earth electrodes subjected to negative impulses had higher Zimpulse than Zimpulse subjected to positive impulses for earth electrodes with high Rdc (earth electrodes 1, 2, 3 and 4). In this paper, it is observed that grounding systems with high Rdc experienced impulse polarity effects in terms of their Zimpulse. It is found that Zimpulse values under a negative impulse are higher than for a positive impulse, for earth electrodes 1, 2 and 4. For earth electrode 3, only site 2, which had a higher Rdc than that of site 1, experienced an impulse polarity effect. The finding that impulse polarity effects are seen in high resistivity soil is similar to those obtained in [11,15]. The impulse polarity effect trend seen in high resistivity soil could be caused by a high electric field in high resistivity, as seen in an earlier paper [17], where an electric value for earth electrodes installed in site 2 can be up to 70% higher than the electric field of the same earth electrodes installed at sites 1 and 3. Table 11, Table 12, Table 13 and Table 14 summarize the Zimpulse values for various earth electrodes and soil resistivity, subjected to negative and positive impulse polarities.

4. Conclusions

Impulse polarity effects were investigated for various earth electrodes, installed at three sites, where the analysis was done based on their time to peak current, discharge time and Zimpulse. Current dependence of time to peak current was observed, which was higher at low current magnitudes and time to peak current became constant, and was independent of current magnitudes at high magnitudes of current. No specific trend pertaining to impulse polarity on the time to peak current was observed. Discharge time was found to be dependent on current magnitudes, which decreased with increasing currents. However, different discharge times under impulse polarity effects were observed. A significant impulse polarity effect was seen in the discharge time for earth electrodes installed at site 2 (high resistivity soil), where it was found to be slower in negative impulse polarity than in positive impulse polarity. Potentially, this was due to a coarser type of soil with high soil resistivity, providing more air voids than the other two sites (sites 2 and 3), which had no obvious time dependence for current to discharge to zero for different impulse polarities. Different relationships for Zimpulse were also observed, in that Zimpulse values had a high degree of non-linearity for high Rdc, in comparison to lower Rdc. Differences in impulse polarity were also seen in earth electrodes with high Rdc; higher Zimpulse values were seen in negative impulse polarity in high Rdc than positive impulse polarity, with no obvious dependence on impulse polarity seen for earth electrodes with low Rdc. These differences in impulse polarity seen in high Rdc are due to high resistivity. The higher electric field in high resistivity, as seen in earlier publications, leads to higher negative impulse polarity than that of positive impulse polarity in high Rdc. However, there is no observable impulse polarity effect for earth electrodes installed in low resistivity soil (low Rdc).

Author Contributions

Funding acquisition, N.N.A.; Investigation, A.W.A.A., N.N.A. and N.M.N.; Methodology, N.M.N. and N.N.A.; Supervision, N.N.A. and N.M.N.; Writing—original draft, A.W.A.A.; Writing—review and editing, N.M.N. All authors have read and agreed to the published version of the manuscript.

Funding

This research was funded by TELEKOM MALAYSIA RESEARCH AND DEVELOPMENT (TMR&D), grant number MMUE190005.

Conflicts of Interest

The authors declare no conflict of interest.

References

  1. Kuffel, E.; Zaengl, W.S.; Kuffel, J. High Voltage Engineering: Fundamentals; Butterworth-Heinemann: Oxford, UK, 2000. [Google Scholar]
  2. Zhao, S.; Xiao, D.; Xue, P.; Zhong, R. Experimental Research on Polarity Effect of CF3I/N2 Mixtures under Lightning Impulse. IEEE Trans. Dielectr. Electr. Insul. 2018, 25, 1357–1363. [Google Scholar] [CrossRef]
  3. Meyer, H.K.; Mauseth, F.; Pedersen, A.; Ekeberg, J. Breakdown Mechanisms of Rod-Plane Air Gaps with a Dielectric Barrier Subject to Lightning Impulse Stress. IEEE Trans. Dielectr. Electr. Insul. 2018, 25, 1121–1127. [Google Scholar] [CrossRef] [Green Version]
  4. Rapp, K.J.; Corkran, J.; McShane, C.P. Lightning Impulse Testing of Natural Ester Fluid Gaps and Insulation Interfaces. IEEE Trans. Dielectr. Electr. Insul. 2009, 16, 1595–1603. [Google Scholar] [CrossRef]
  5. Hanaoka, R.; Kohrin, T.; Miyagawa, T.; Nishi, T. Creepage Discharge Characteristics over Solid-liquid Interfaces with Grounded Side Electrode. IEEE Trans. Dielectr. Electr. Insul. 2002, 9, 308–315. [Google Scholar] [CrossRef]
  6. Darveniza, M. Electrical Breakdown of Air between Insulated Conductors. In Proceedings of the 6th International Conference on Properties and Applications of Dielectric Materials, Xi’an, China, 21–26 June 2000. [Google Scholar]
  7. Hogg, M.; Timoshkin, I.V.; Given, M.J.; Wilson, M.P.; MacGregor, S.J.; Fouracre, R.A.; Lehr, J.M. Liquid Water Stressed with HV impulses: Effect of Polarity on Transient Pre-breakdown Processes. In Proceedings of the 17th IEEE International Conference on Dielectric Liquids, Trondheim, Norway, 26–30 June 2011. [Google Scholar]
  8. Li, X.; Chen, X.; Li, J. On Polarity Effect of Underwater Impulse Breakdown. In Proceedings of the 20th IEEE International Conference on Dielectric Liquids (ICDL), Roma, Italy, 23–27 June 2019. [Google Scholar]
  9. Petropoulos, G.M. The High-Voltage Characteristics of Earth Resistances. J. IEE Part II 1948, 95, 172–174. [Google Scholar]
  10. Victor, M.; Cabrera, M. Photographic Investigation of Electric Discharges in Sandy Media. J. Electrost. 1993, 30, 47–56. [Google Scholar] [CrossRef]
  11. Victor, M.; Cabrera, M.; Lundquist, S.; Cooray, V. On the Physical Properties of Discharges in Sand under Lightning Impulses. J. Electrost. 1993, 30, 17–28. [Google Scholar] [CrossRef]
  12. Loboda, M.; Scuka, V. On the Transient Characteristics of Electrical Discharges and Ionization processes in soil. In Proceedings of the 23rd International Conference on Lightning Protection Proceedings, Firenze, Italy, 23–27 September 1996; pp. 539–544. [Google Scholar]
  13. Nor, N.M.; Haddad, A.; Griffiths, H. Factors Affecting Soil Characteristics under Fast Transients. In Proceedings of the International Conference on Power Systems Transients-IPST 2003, New Orleans, LA, USA, 28 September–2 October 2003. [Google Scholar]
  14. Nor, N.M.; Ramli, A. Soil Characteristics under Different Impulse Polarity and Earth Electrode’s Dimensions. IEEE Trans. Dielectr. Insul. 2008, 15, 910–914. [Google Scholar] [CrossRef]
  15. Reffin, M.S.; Nor, N.M.; Ahmad, N.N.; Abdullah, S.A. Performance of Practical Grounding Systems under High Impulse Conditions. Energies 2018, 11, 3187. [Google Scholar] [CrossRef] [Green Version]
  16. Ali, A.A.; Ahmad, N.; Nor, N.M.; Reffin, M.; Abdullah, S.S. Investigations on the Performance of a New Grounding Device with Spike Rods under High Magnitude Current Conditions. Energies 2019, 12, 1138. [Google Scholar]
  17. Ali, A.; Ahmad, N.; Nor, N.M.; Idris, N.; Hanaffi, F. Investigations on the Performance of Grounding Device with Spike Rods (GDSR) with the Effects of Soil Resistivity and Configurations. Energies 2020, 13, 3538. [Google Scholar]
  18. Rawi, I.; Kadir, M.A.; Gomes, C.; Azis, N. A Case Study on 500 kV Line Performance Related to Lightning in Malaysia. IEEE Trans. Power Deliv. 2018, 33, 2180–2186, No. 5. [Google Scholar] [CrossRef]
  19. Telekom Malaysia Berhad and Multimedia University. Experiment and Equipment Arrangement (Set Up) for Grounding Assessment under High Impulse Conditions. MALAYSIA—Patent Application No. Pl 2020002177, 30 April 2020. [Google Scholar]
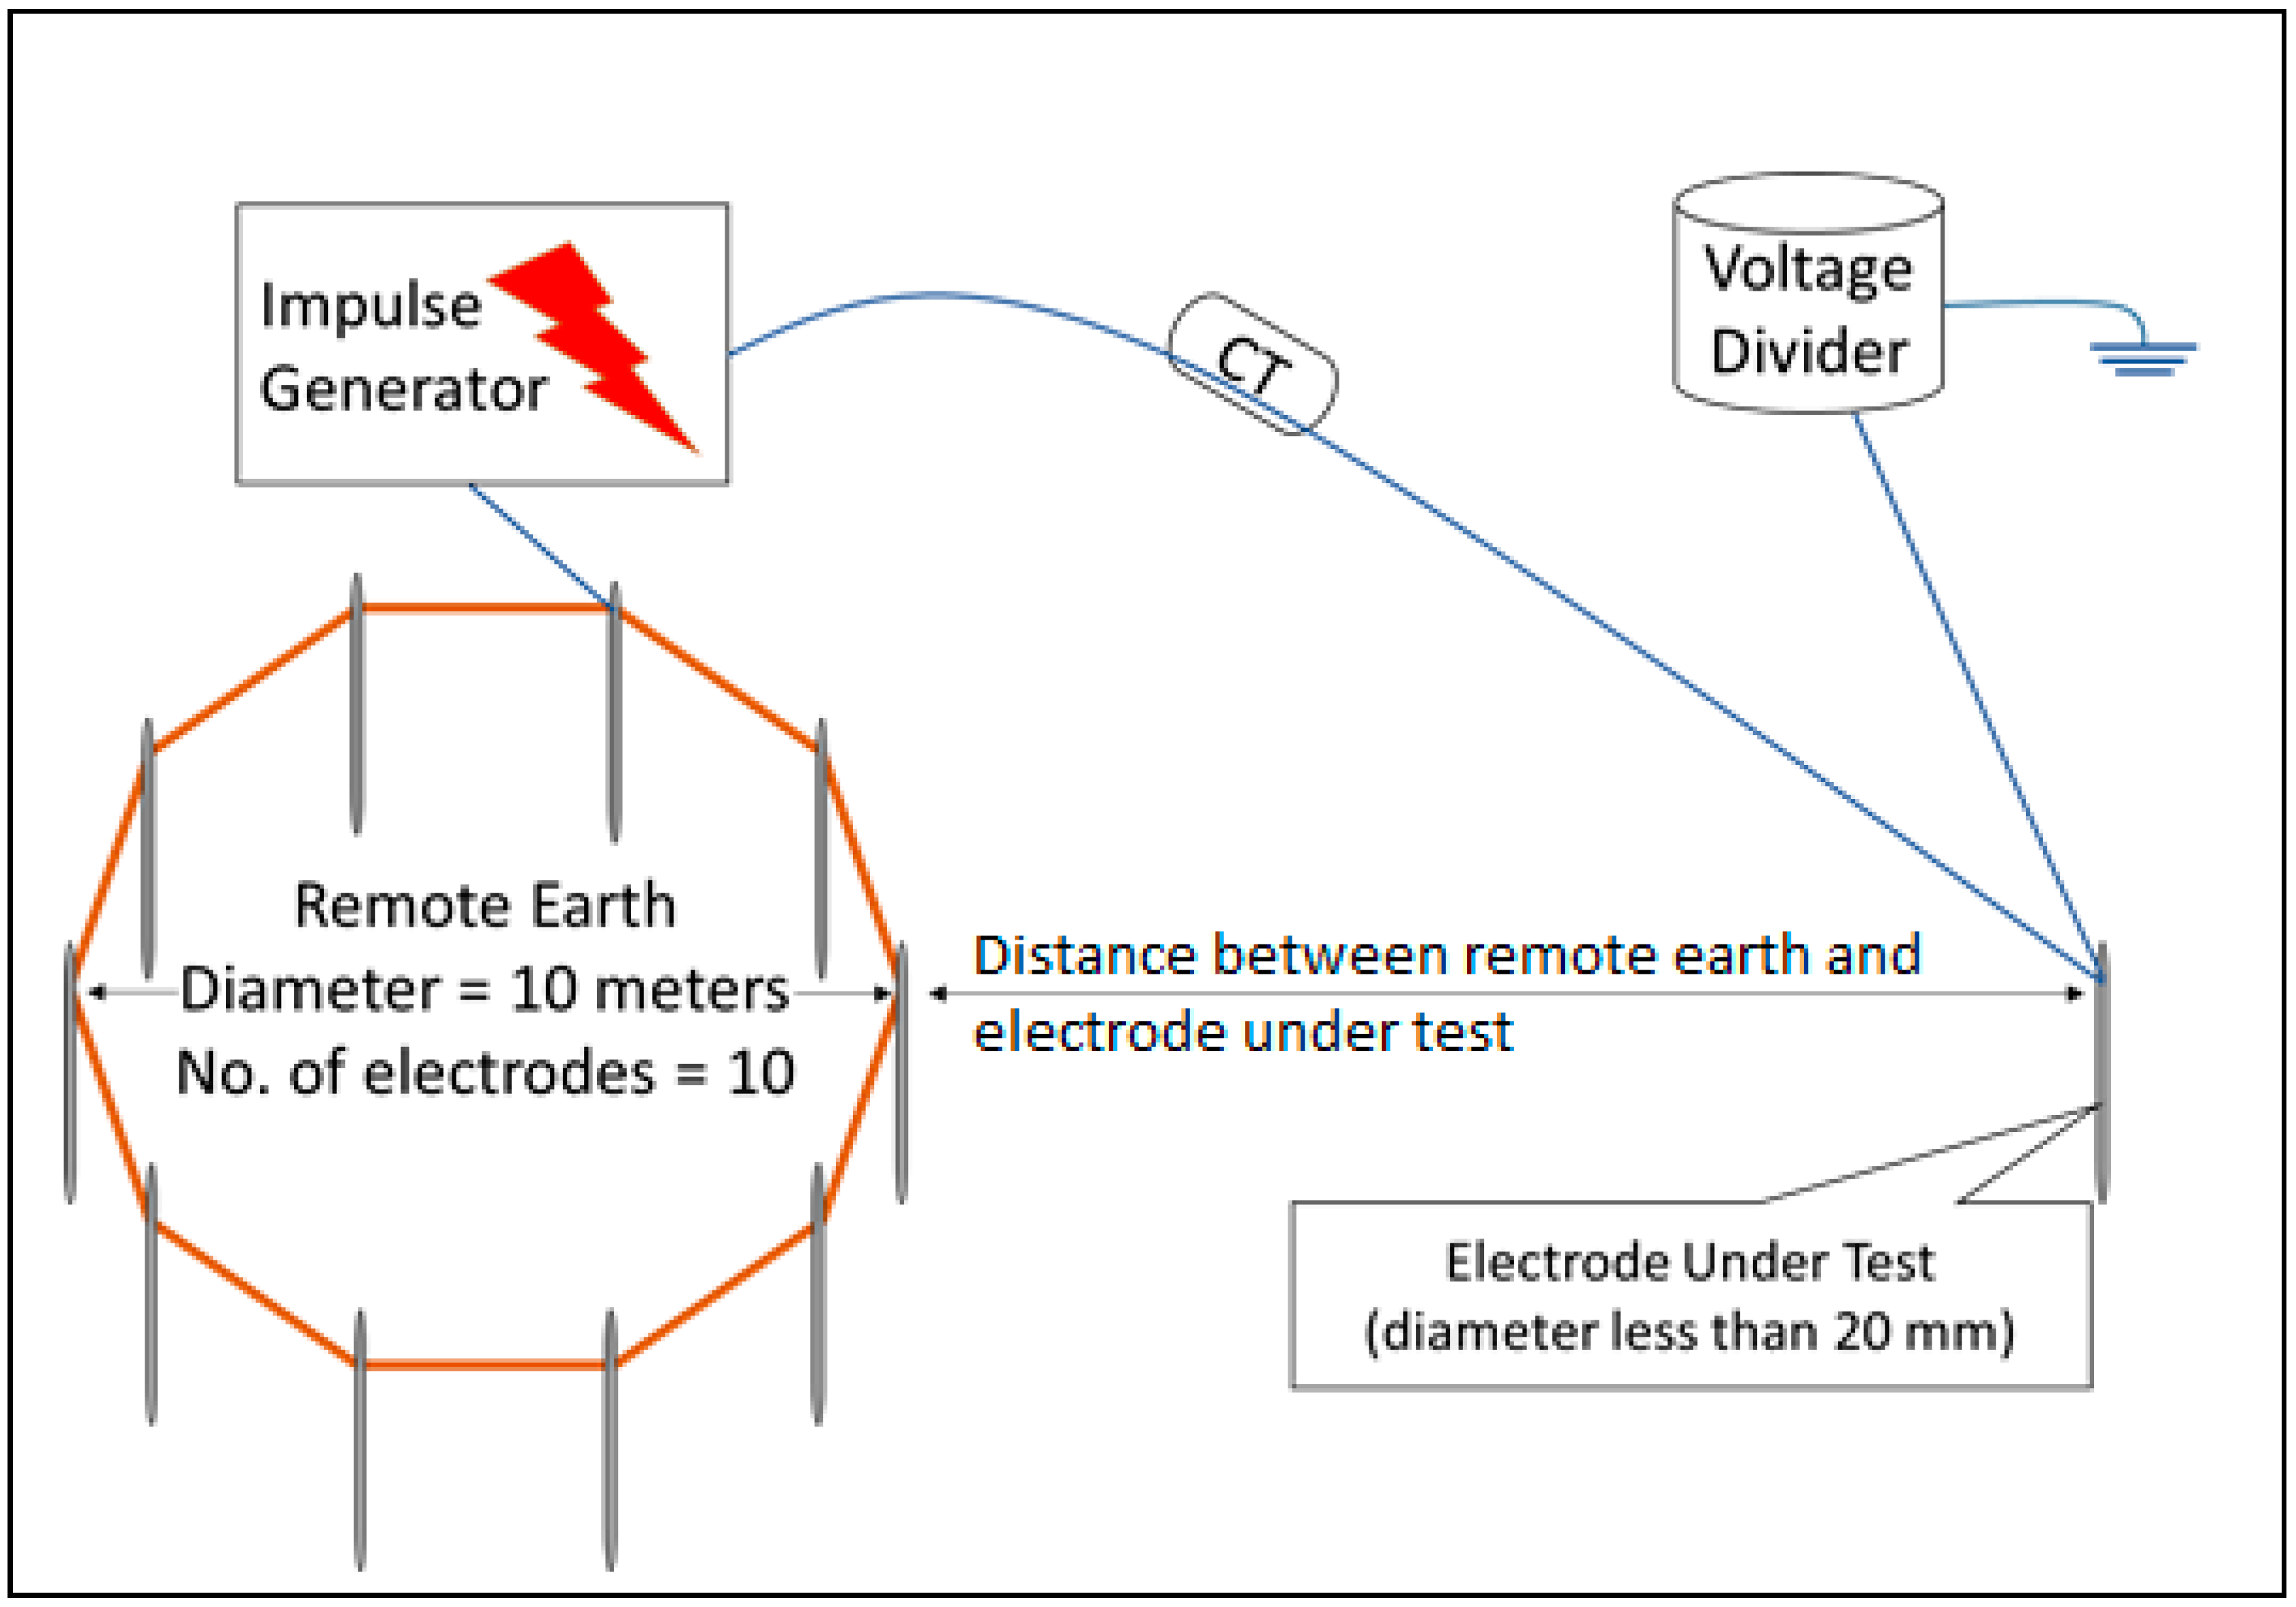
Figure 1. Field test arrangement during impulse tests.
Energies 13 04672 g001
Figure 2. Voltage and current traces for earth electrode 1 installed at site 2, under negative impulse polarity, at charging voltage of 30 kV.
Energies 13 04672 g002
Figure 3. Voltage and current traces for earth electrode 1 installed at site 2, under negative impulse polarity, at charging voltage of 150 kV.
Energies 13 04672 g003
Figure 4. Time to peak current versus peak current for earth electrodes installed at site 1 under negative impulse polarity.
Energies 13 04672 g004
Figure 5. Time to peak current versus peak current for earth electrodes installed at site 2 under negative impulse polarity.
Energies 13 04672 g005
Figure 6. Time to peak current versus peak current for earth electrodes installed at site 3 under negative impulse polarity.
Energies 13 04672 g006
Figure 7. Time to peak current versus peak current for earth electrode 1 installed at all sites under both impulse polarities.
Energies 13 04672 g007
Figure 8. Time to peak current versus peak current for earth electrode 2 installed at all sites under both impulse polarities.
Energies 13 04672 g008
Figure 9. Time to peak current versus peak current for earth electrode 3 installed at all sites under both impulse polarities.
Energies 13 04672 g009
Figure 10. Time to peak current versus peak current for earth electrode 4 installed at all sites under both impulse polarities.
Energies 13 04672 g010
Figure 11. Time to peak current versus peak current for earth electrode 5 installed at all sites under both impulse polarities.
Energies 13 04672 g011
Figure 12. Time to peak current versus peak current for earth electrode 6 installed at all sites under both impulse polarities.
Energies 13 04672 g012
Figure 13. Discharge time versus applied voltage for all earth electrodes installed at site 1 under negative impulse polarity.
Energies 13 04672 g013
Figure 14. Discharge time versus applied voltage for all earth electrodes installed at site 2 under negative impulse polarity.
Energies 13 04672 g014
Figure 15. Discharge time versus applied voltage for all earth electrodes installed at site 3 under negative impulse polarity.
Energies 13 04672 g015
Figure 16. Discharge time versus applied voltage for earth electrode 1, installed at all sites under both impulse polarities.
Energies 13 04672 g016
Figure 17. Discharge time to zero versus applied voltage for earth electrode 2, installed at all sites under both impulse polarities.
Energies 13 04672 g017
Figure 18. Discharge time versus applied voltage for earth electrode 3, installed at all sites under both impulse polarities.
Energies 13 04672 g018
Figure 19. Discharge time versus applied voltage for earth electrode 4, installed at all sites under both impulse polarities.
Energies 13 04672 g019
Figure 20. Discharge time versus applied voltage for earth electrode 5, installed at all sites under both impulse polarities.
Energies 13 04672 g020
Figure 21. Discharge time versus applied voltage for earth electrode 6, installed at all sites under both impulse polarities.
Energies 13 04672 g021
Figure 22. Zimpulse versus peak current for all six earth electrodes, installed at site 1 under negative impulse polarities.
Energies 13 04672 g022
Figure 23. Zimpulse versus peak current for all six earth electrodes, installed at site 2 under negative impulse polarities.
Energies 13 04672 g023
Figure 24. Zimpulse versus peak current for all six earth electrodes, installed at site 3 under negative impulse polarities.
Energies 13 04672 g024
Figure 25. Zimpulse versus peak current for earth electrode 1, installed at sites 1 and 2 under both impulse polarities.
Energies 13 04672 g025
Figure 26. Zimpulse versus peak current for earth electrode 2, installed at sites 1 and 2 under both impulse polarities.
Energies 13 04672 g026
Figure 27. Zimpulse versus peak current for earth electrode 3, installed at sites 1 and 2 under both impulse polarities.
Energies 13 04672 g027
Figure 28. Zimpulse versus peak current for earth electrode 4, installed at sites 1 and 2 under both impulse polarities.
Energies 13 04672 g028
Figure 29. Zimpulse versus peak current for earth electrode 5, installed at sites 1 and 2 under both impulse polarities.
Energies 13 04672 g029
Figure 30. Zimpulse versus peak current for earth electrode 6, installed at sites 1 and 2 under both impulse polarities.
Energies 13 04672 g030
Table 1. Computed soil resistivity data at different locations (reproduced from [17]).
Locationρ1 (Ω·m−1)h1 (m)ρ2 (Ω·m−1)h2 (m)
Site 157.26.0758.1
Site 2160.44.3359.6
Site 334.90.2
Table 2. Measured steady-state earth resistance value (Rdc) for all earth electrodes installed at various locations (reproduced from [17]).
Conf.Earth ElectrodeRdc (Ω) of Ground Electrodes
Site 1Site 2Site 3
1A vertical single rod electrode67.02104.475.52
22 parallel vertical rod electrodes25.0244.827.56
33 parallel vertical rod electrodes16.628.517.81
4GDSR53.067.218.5
5GDSR in parallel with vertical one rod electrode23.437.614.6
6GDSR with spike rods in parallel with two vertical rods16.2126.611.33
Table 3. Summary of the Effect of Earth Electrodes on Time to Peak Current under Negative Impulse Polarity (based on Figure 4, Figure 5 and Figure 6).
SiteTime to Peak Current for Various Earth Electrodes
1For the current magnitudes below 2 kA, time to peak current has no direct relation to Rdc values. However, the time to peak current is around 10 μs, independent of earth electrodes, and constant with increasing currents for higher current magnitudes above 2 kA.
2The time to peak current is dependent on Rdc values; conf. 1 with the highest Rdc takes the slowest time to reach peak current, at lower current magnitudes below 1.8 kA.
The times to peak current are close, around 8 μs, independent of earth electrodes, constant with increasing currents at higher current magnitudes; i.e., above 1.8 kA.
3For the current magnitudes below 6 kA, the time to peak current is around 9 μs, independent of Rdc.
Between 6 and 9 kA, a drop of time to peak current is seen for all earth electrodes.
For the current magnitudes above 9 kA, the time to peak current is around 7 μs, independent of the earth electrodes, constant with increasing currents.
Table 4. Comparison between Negative and Positive Impulse Polarities for Time to Peak Current for Various Earth Electrodes (based on Figure 4, Figure 5 and Figure 6 for negative impulse polarity, and [17] for positive impulse polarity).
SiteComparison between Negative and Positive Impulse Polarities
1Times to peak current for positive impulse polarity are directly dependent on the Rdc of grounding systems, whereas times to peak current for negative impulse polarity are found to occur randomly, and are not directly dependent on Rdc values observed for currents below 2 kA.
Similar time to peak current is seen for both impulse polarities, of 10 μs for current magnitudes above 2 kA.
2The time to peak current is dependent on Rdc values for both impulse polarities for current magnitudes below 2.5 kA for positive polarity, and 1.8 kA for negative impulse polarity.
Time to peak current for the current magnitudes higher than 2.5 and 1.8 kA for positive and negative impulse polarity respectively is constant at 8 μs.
3For high Rdc values, slower time to peak current is seen, and this trend is noted for currents below 9 and 6 kA for positive and negative impulse polarity respectively.
At higher current magnitudes, time to peak current is constant at 7 μs.
Table 5. Summary of the Effect of Soil Resistivity Time to Peak Current for Various Earth Electrodes Subjected to Negative Impulse Polarity (based on Figure 7, Figure 8, Figure 9, Figure 10, Figure 11 and Figure 12).
Earth ElectrodeTime to Peak Current at Various Sites
1Time to peak current for earth electrode 1 installed at sites 1 and 2 is close. As the current magnitude increases, faster time to peak current is seen for earth electrode 1 installed at all sites.
2Earth electrodes 2 to 6 installed at site 1 have the slowest time to peak current. As the current magnitude increases, faster time to peak current is seen for earth electrodes 2 to 6 installed at all sites.
3
4
5
6
Table 6. Comparison between Negative and Positive Impulse Polarities for Time to Peak Current for Various Sites (based on Figure 7, Figure 8, Figure 9, Figure 10, Figure 11 and Figure 12).
Earth ElectrodeComparison between Negative and Positive Impulse Polarities
1Earth electrode 1 installed at site 2 has the slowest time to peak current when subjected to positive impulse. When subjected to negative impulse polarity, the slowest time to peak current is seen for earth electrode 1 installed at site 1. Faster time to peak current is seen when the current magnitudes increase, for all earth electrodes subjected to both impulse polarities.
2
3
4
5
6
Table 7. Summary of the Effect of Earth Electrodes on Discharge Time under Negative Impulse Polarity (based on Figure 13, Figure 14 and Figure 15).
SiteDischarge Time for Various Earth Electrodes
1Faster discharge time with increasing applied voltage for all earth electrodes installed at sites 1 and 2.
2Discharge time is dependent on the values of Rdc; the higher the Rdc, the slower the discharge time.
3Discharge time for all earth electrodes decreases with increasing applied voltage.
Earth electrode 4 has a rather abnormal trend in discharge time, which is found constant for applied voltage levels below 35 kV, and abruptly drops at higher applied voltage levels. For other earth electrodes, discharge time is dependent on Rdc values, with a slower discharge time for earth electrodes with high Rdc.
Table 8. Comparison between Negative and Positive Impulse Polarities for Discharge Current for Various Earth Electrodes (based on Figure 13, Figure 14 and Figure 15, and [17]).
SiteComparison between Negative and Positive Impulse Polarities
1Faster discharge time as the applied voltage increases, and depending on the values of Rdc is seen for both impulse polarities; i.e., faster discharge time for earth electrodes with low Rdc, and slower discharge time for earth electrodes with high Rdc for both positive and negative polarities.
2
3Faster discharge time with increasing applied voltage for negative impulse polarity, whereas it is found to be constant for positive impulse polarity.
Discharge time is dependent on Rdc values for negative impulse, but discharge time is hardly dependent on Rdc values for positive impulse polarity.
Earth electrode 4 has a significant reduction in discharge time for both impulse polarities.
Table 9. Summary of the Effect of Soil Resistivity on Discharge Time for Negative Impulse Polarity (based on Figure 16, Figure 17, Figure 18, Figure 19, Figure 20 and Figure 21).
Earth ElectrodeDischarge Time at Various Sites
1Discharge time decreases with increasing applied voltage for all earth electrodes installed at all sites. It is observed that discharge time is the highest for earth electrodes installed at site 2, followed by sites 1 and 3. Large differences between discharge times for sites 1, 2 and 3; i.e., difference between discharge times for earth electrodes 1 and 2 at site 1 is as large as 400 μs for the same peak current magnitudes.
2
3
4
5
6
Table 10. Summary of the Effect of Soil Resistivity on Discharge Time for Both Impulse Polarities (based on Figure 16, Figure 17, Figure 18, Figure 19, Figure 20 and Figure 21).
Earth ElectrodeComparison between Negative and Positive Impulse Polarities
1Faster discharge time as applied voltage is increased for all earth electrodes installed at all sites for negative impulse polarity, but for positive impulse polarity, only earth electrodes installed at sites 1 and 2 have a similar relationship, that there is faster discharge time at higher applied voltage. For earth electrodes installed at site 3, discharge time is mostly not dependent on applied voltage.
For the same earth electrode, distinctive differences are seen between the discharge times for earth electrodes installed at sites 1 and 2, or between sites 2 and 3 for negative impulse polarity, reaching differences of hundreds of microseconds, while for positive impulse polarity, large differences in discharge time are only observed for earth electrodes installed at sites 2 and 3. Small differences, or close results for time for current to discharge to zero between earth electrodes installed at sites 1 and 2 when subjected to positive impulse.
2
3
4
5
6
Table 11. Summary of the Effect of Earth Electrodes on Impulse Impedance, Zimpulse, under Negative Impulse Polarity (based on Figure 22, Figure 23 and Figure 24).
SiteZimpulse for Various Earth Electrodes
1Higher Zimpulse for earth electrodes with high Rdc installed at all sites.
Zimpulse decreases as the current magnitudes are increased for earth electrodes 1 and 4 (high Rdc).
2
3
Table 12. Summary of the Effect of Earth Electrodes on Impulse Impedance, Zimpulse, under Both Impulse Polarities (based on Figure 22, Figure 23 and Figure 24 and [17]).
SiteComparison between Negative and Positive Impulse Polarities
1Similar trend for both positive and negative impulse polarities are seen, higher Zimpulse for high Rdc, and reduction of Zimpulse is seen most significant for earth electrodes 1 and 4 (high Rdc).
2
3
Table 13. Summary of the Effect of Soil Resistivity on Impulse Impedance, Zimpulse, under Negative Impulse Polarity (based on Figure 25, Figure 26, Figure 27, Figure 28, Figure 29 and Figure 30).
Earth ElectrodesZimpulse at Various Sites
1Higher Zimpulse values for all earth electrodes installed at site 2 than for earth electrodes installed at site 1.
Zimpulse values decrease significantly with increasing magnitudes of current for earth electrode 1 installed at sites 1 and 2, while Zimpulse values are almost linear with increasing current magnitudes for earth electrode 1 installed at site 3 (low soil resistivity).
2
3
4
5
6
Table 14. Summary of the Effect of Soil Resistivity on Impulse Impedance, Zimpulse, under Negative and Positive Impulse Polarities (based on Figure 25, Figure 26, Figure 27, Figure 28, Figure 29 and Figure 30).
Earth ElectrodesComparison between Negative and Positive Impulse Polarities
1For earth electrode 1, installed at site 1, Zimpulse values are higher than for that installed at site 2 when subjected to positive impulse polarity, but for negative impulse polarity, Zimpulse values are higher for earth electrodes installed at site 2, than for those at site 1 for all earth electrodes. For both impulse polarities, Zimpulse decreases significantly as the current increases for all earth electrodes installed at sites 1 and 2, while Zimpulse values are almost constant as the current magnitudes increase for all earth electrodes installed at site 3. A significant difference in Zimpulse between positive and negative polarities is seen for earth electrodes 1 and 4, installed at both sites 1 and 2, which could be due to high Rdc (see Figure 25 and Figure 28).
2
3
4
5
6