1. Introduction
Hydrogen can be produced from a variety of sources and is highly efficient and non-carbon emitting while producing electricity when combined with a proton exchange membrane fuel cell. Sodium borohydride (NaBH
4) has high theoretical gravimetric hydrogen storage capacity of 10.8 wt.%. The operating temperature of NaBH
4 hydrolysis reaction is suitable for proton exchange membrane fuel cells. However, up to now, it has been difficult to meet vehicular application hydrogen storage capacity targets [
1,
2]. Consequently, most research attention has been redirected to the early market applications: Stationary power and 3C portable power [
1,
3,
4,
5,
6]. In order to design cost effective hydrogen storage systems, non-noble metals, such as nickel, cobalt, Co-B, Ni-B, Ni-Co-B [
7,
8,
9,
10,
11,
12,
13,
14] were used as catalysts for NaBH
4 hydrolysis reaction. The kinetics study on NaBH
4 hydrolysis reaction with different kinds of non-noble catalysts have been classified into zero-order [
7,
9,
11,
12,
13,
14,
15], first-order [
8,
15,
16] and Langmuir-Hinshelwood [
15,
17,
18]. In this work, Co-B/IR-120 catalysts were chosen for cost reasons. Synthesis method and the characteristic of Co-B/IR-120 catalysts were proposed by Liu et al. [
19]. The reaction kinetic study of the composition and the surface morphology of Co-B catalysts on the sodium borohydride hydrolysis reaction for hydrogen generation was investigated [
20]. Co/B ratio and surface structure effected the frequency factor and activation energy of the reaction. Chen and Pan [
20] found the optimal hydrogen performance and durability of Co-B/resin catalysts under synthetic conditions.
In the reactor design phase, Liu and Li [
1] and Demirci et al. [
2] have pointed out the design and operation problems of hydrogen generation systems. To solve these design problems, new reactor design concepts and operation methods are continuing to improve in order to overcome the vapour, heat management and hydrogen storage weight problems for portable 3C power generation devices [
4,
5,
17,
21,
22,
23,
24,
25,
26].
In real applications, some prototypes of hydrogen generator units using NaBH
4 have been made: Industrial Taiwan Research Institute and Korean Fuel Cell Research Center have both designed 2 W prototypes for cellular phones [
5,
11]. Nanyang Technological University Fuel Cell Strategic Research Programme has developed 5 W prototypes using a Ru catalyst for micro PEM fuel cell applications [
3]. Oak Ridge National Laboratory successfully developed and tested a 500 W prototype to meet different power requirements [
27]. These prototypes demonstrated the feasibility of the NaBH
4 hydrolysis reaction for hydrogen generation.
The target of US Department of Energy’s fuel cell start-up time is less than 5 s. This means the instantaneous hydrogen generation from sodium borohydride hydrolysis reaction systems must be achieved. In general, the dynamic response time of the hydrogen generation rate of sodium borohydride hydrolysis reaction systems depends on the performance of catalysts (reaction rate) and reactor design (operating temperature, bulk density of reactor). Normally, the dynamic response time of the hydrogen generation rate of sodium borohydride hydrolysis reaction systems is much longer than 5 s. because of the time needs for proceeding the chemical reaction. This means it’s difficult to achieve the start-up time target by the normal operating of the sodium borohydride hydrolysis reaction. Furthermore, few papers have discussed the start-up, re-start and shut down problems of sodium borohydride hydrolysis systems. These problems are important issues for commercialization.
The objective of this work is to propose an operational procedure to generate sufficient hydrogen in response to process demands. In
Section 2, the experiment was set up, and the hydrogen generation from NaBH
4 hydrolysis reaction was tested and recorded. In
Section 3, the steady-state modeling of a packed-bed reactor (PBR) was built to simulate the hydrolysis reaction. The kinetic parameters of the Co-B/IR-200 catalyst were regressed from experimental data. In
Section 4, the dynamic response of the hydrogen generation rate to feed NaBH
4 flowrate was derived. Hydrogen-on-demand systems can be achieved by using a reactant feeding strategy, i.e., a combined impulse function and step function. In
Section 5, the experiment was set-up to validate our simulation result.
2. Experiment
In this work, the hydrogen was generated from the NaBH4 solution hydrolysis reaction with Co-B/IR-120 catalysts. The material, catalysts, and experiment set-up were shown in the following sections.
2.1. Materials
Cobalt(II) chloride hexahydrate (purchased from Alfa Aesar, Haverhill, MA, USA, 98% pure) was dissolved in deionized water to generate Co2+. Catalyst supports are Amberlite IR-120 resins (purchased from Sigma-Aldrich, St. Louis, MO, USA). The functions of sodium borohydride (98% pure, purchased from Sigma-Aldrich, St. Louis, MO, USA) are reduction agent and the reactant of NaBH4 hydrolysis reaction. The pH value of catalyst synthesis is manipulated by using sodium hydroxide (purchased from Shimakyu Co., Samut Sakhon, Thailand, 98% pure). The water used in all our experiments was deionized.
2.2. Catalyst Preparation
The ion exchange and the chemical reduction methods [
19] were used to prepare the Co-B catalyst. The detailed procedures are described below.
In the first stage (the ion exchange method); 0.004 kg of IR-120 resin was washed in deionized water (for purification), drained, and subsequently mixed with 14.3 × 10⁻⁶ m3 of 7.7 wt.% CoCl2. The time and the rotational speed of the stir were set at 1 h and 100 rpm. The protons of the ion exchange resin (IR-120) were replaced by Co2+. At the end of the ion exchange, the excess and un-exchanged Co2+ were washed by the de-ionized water until the solution became colorless.
In the chemical reduction method; the ion exchange resin (Co2+/IR-120) was reduced to Co metal on the IR-120 surface by combining 50 × 10−6 m3 of 10 wt.% NaBH4 with the Co2+/IR-120 in a container. The container was then placed in a heater and the thermostat set at 25 °C and constantly stirred for 1 h at 350 rpm. Then, the Co-B/IR-120 catalyst was washed by de-ionized water until the solution became colorless. Finally, the water in the Co-B/IR-120 catalyst was removed in the vacuum drying oven at 80 °C for 1 day.
2.3. NaBH4 Hydrolysis Reaction Experiment Set-Up
The experiment was set-up to investigate the hydrogen generation rate of the sodium borohydride hydrolysis reaction system. The flow diagram is shown in
Figure 1.
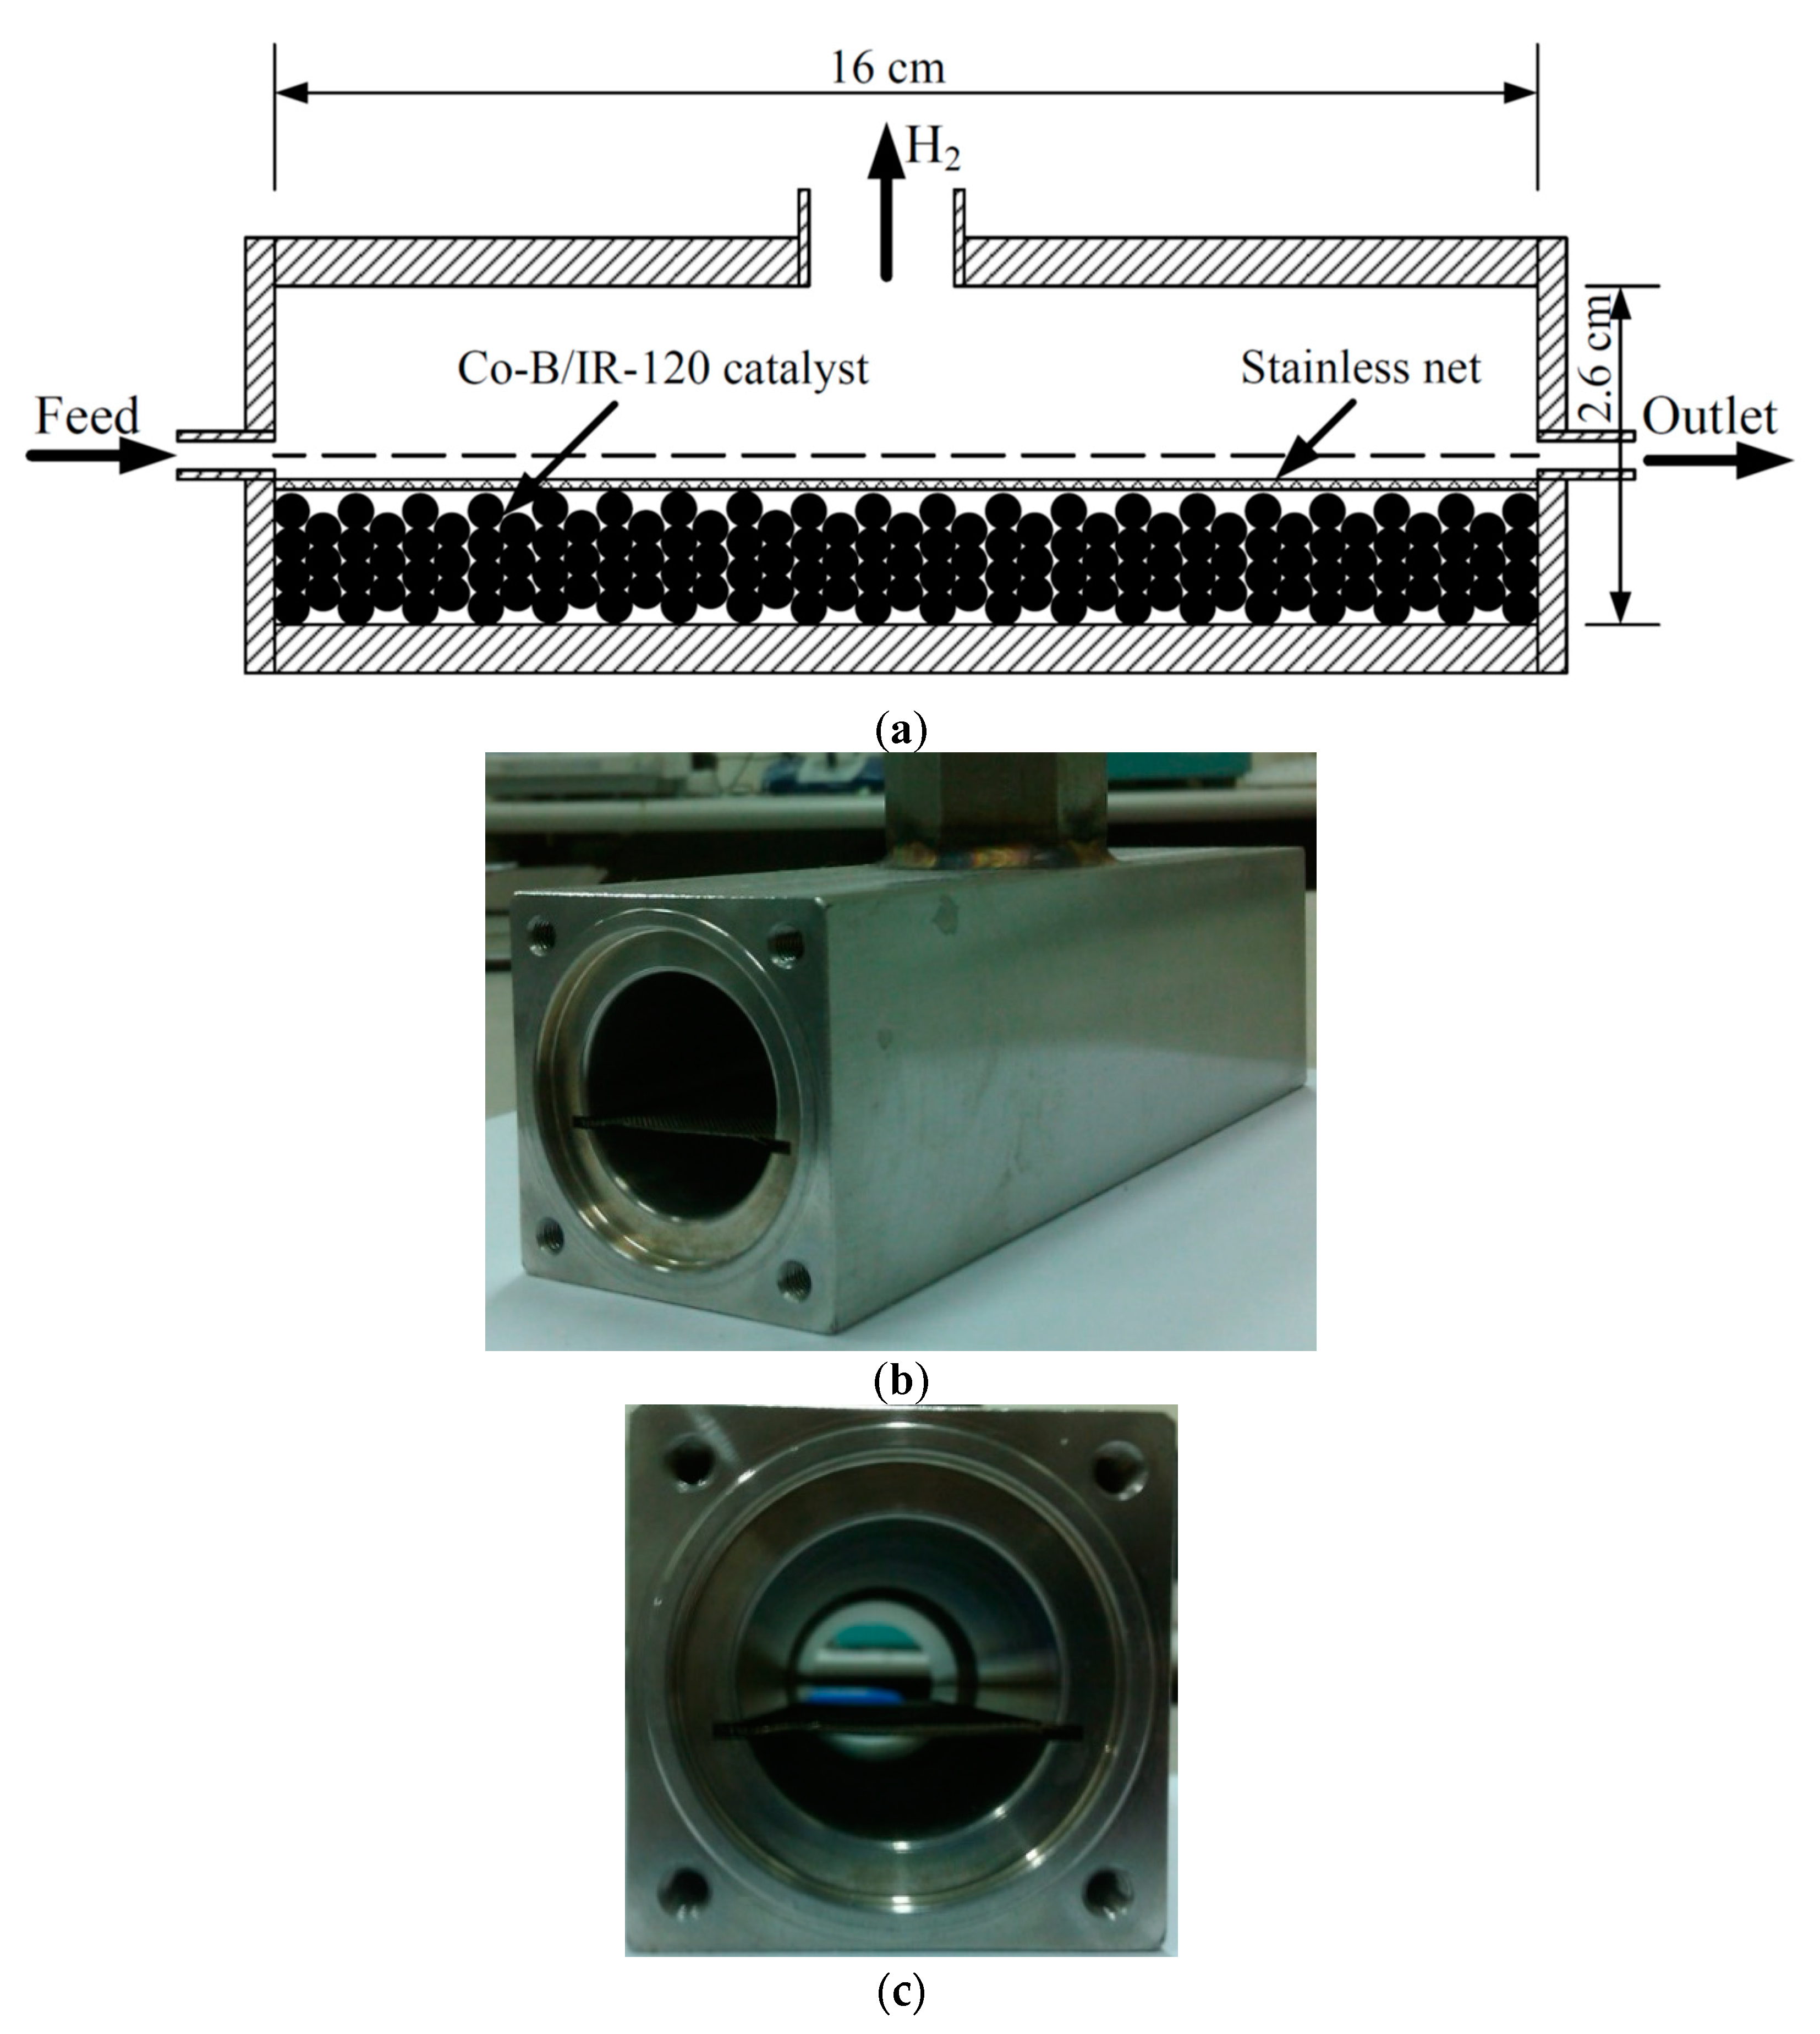
The sodium borohydride solution was stored in a glass tank. The hydrolysis reaction experiment was carried out by pumping 5 wt.% of sodium borohydride and 2 wt.% of NaOH solution into a stainless reactor (cylindrical in shape with a diameter of 0.026 m and a length of 0.16 m). In this reactor system, the reactor effluent stream exhibited a multiphase flow problem. This occurs when two phases exist in the reactor outlet stream: hydrogen, which is generated from NaBH
4 hydrolysis reaction, and NaBO
2 solution. As hydrogen volumetric flowrate is much larger than that of the liquid solution, hydrogen will force the unconverted NaBH
4(aq) solution out of PBR effluent tube. This reduces the NaBH
4 conversion. In order to overcome this problem, a ‘two exit channels’ reactor was designed. Hydrogen was generated in the PBR and exited from the top channel. NaBO
2(aq) solution flowed out from the side channel. The configuration of the reactor is shown in
Figure 2 and the PBR was placed in a horizontal manner. The sodium borohydride solution was fed into the reactor. Co-B/IR-120 catalyst particles were placed in the bottom of the reactor and fixed in place with a stainless grill. The PBR was immersed into a water bath in order to keep the reactor operating temperature at the desired level. Hydrolysis reaction took place and hydrogen was generated in the reactor. Outlet gases (hydrogen and steam) discharged from the top channel of the reactor and were measured by a mass flow meter (1179A, MKS, Andover, MA, USA). The data was transferred and recorded by a computer. Before entering the mass flow meter, the outlet gases were filtered by two water traps and then passed through a desiccator. In the hydrolysis reactor, a K-type thermocouple (GX-36, YOTEC Precision Instrument, Hsinchu, Taiwan) was connected to the reactor effluent stream to measure the reaction temperature and the data recorded on the computer.
2.4. Experiment Data Treatment
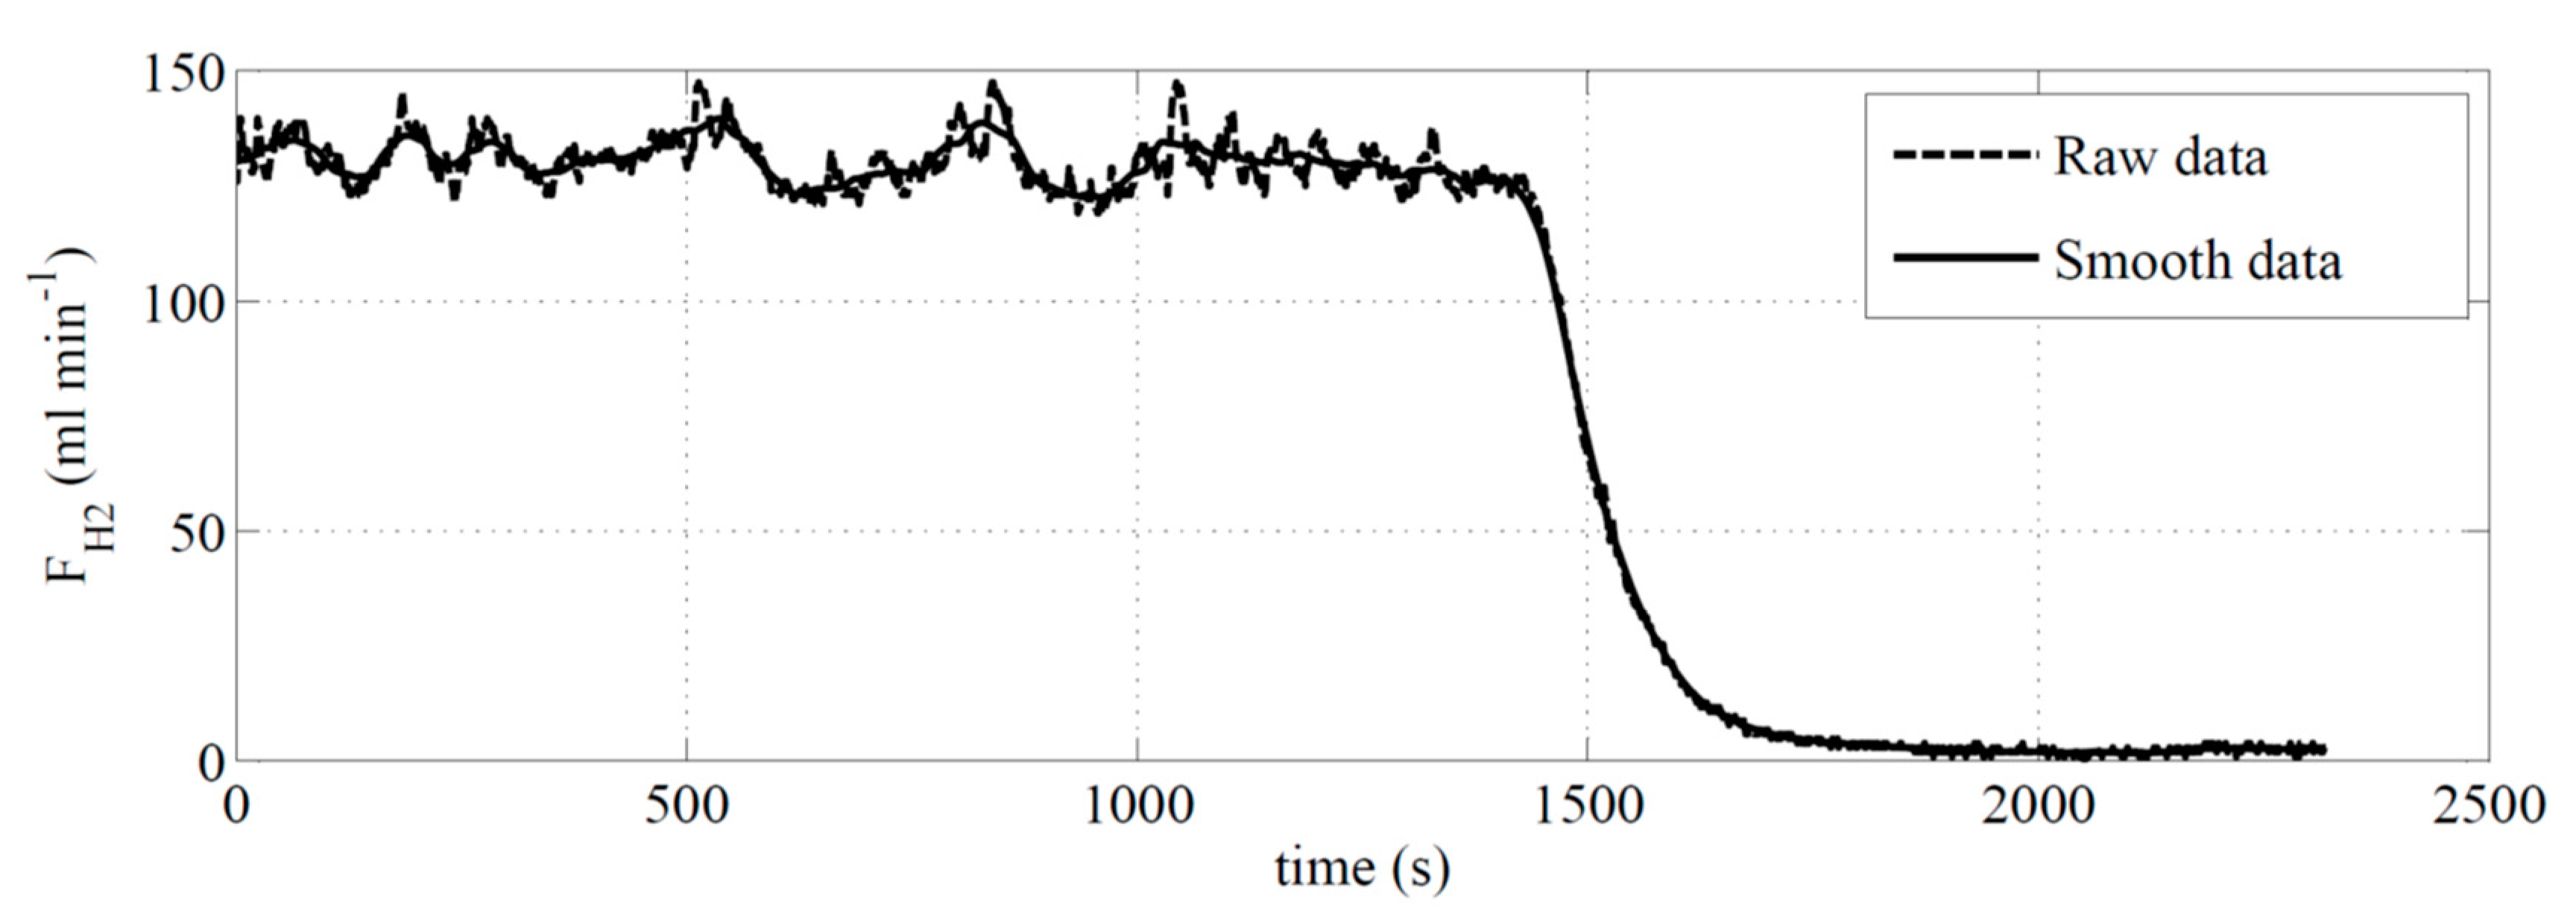
A typical rough data line of a hydrogen generation rate from NaBH
4 hydrolysis reaction with Co-B/IR-120 catalysts was plotted versus time and is shown in
Figure 3. The feed flowrate (which contained 5 wt.% of NaBH
4 and 2 wt.% of NaOH water solution) and the catalyst weight were 1.02 mL min
−1 and 0.0175 kg, respectively. The operating temperature of the reactor was kept at 70 °C using a thermostat. The average hydrogen generation rate was around 130.02 mL min
−1 (approximately 99.3% conversion of NaBH
4).
Figure 3 shows the fluctuating original hydrogen generation flowrate raw data with respect to time. In order to eliminate the measurement noise, moving average method which was coded by MATLAB program was used to smooth out the experiment data as also shown in
Figure 3 (solid line). The moving average line will be shown in future figures.
4. Dynamic Characteristic Analysis of the PBR
When the feed inlet flowrate is shut down from 1.02 to 0 mL min
−1, the dynamic response of the hydrogen generation rate of the sodium borohydride hydrolysis reactor is shown in
Figure 3. The settling time [
30], which is around 392 s. at 70 °C, is defined as “the time it takes the amplitudes of oscillations to decay to some fraction of the change in set-point”. The fraction of the change in set-point is ±2% in this study. In order to achieve the on-demand hydrogen generation rate, the dynamic response of hydrogen generation rate of the PBR should be increased (shortening the settling time). Thus, the key factors affecting the dynamic characteristic of the hydrogen generation rate will be identified in this section.
4.1. Dynamic Hydrogen Generation Data Fitting of the PBR
The dynamic response of the PBR reactor hydrogen generation rate can be solved by using Equations (2)–(7).
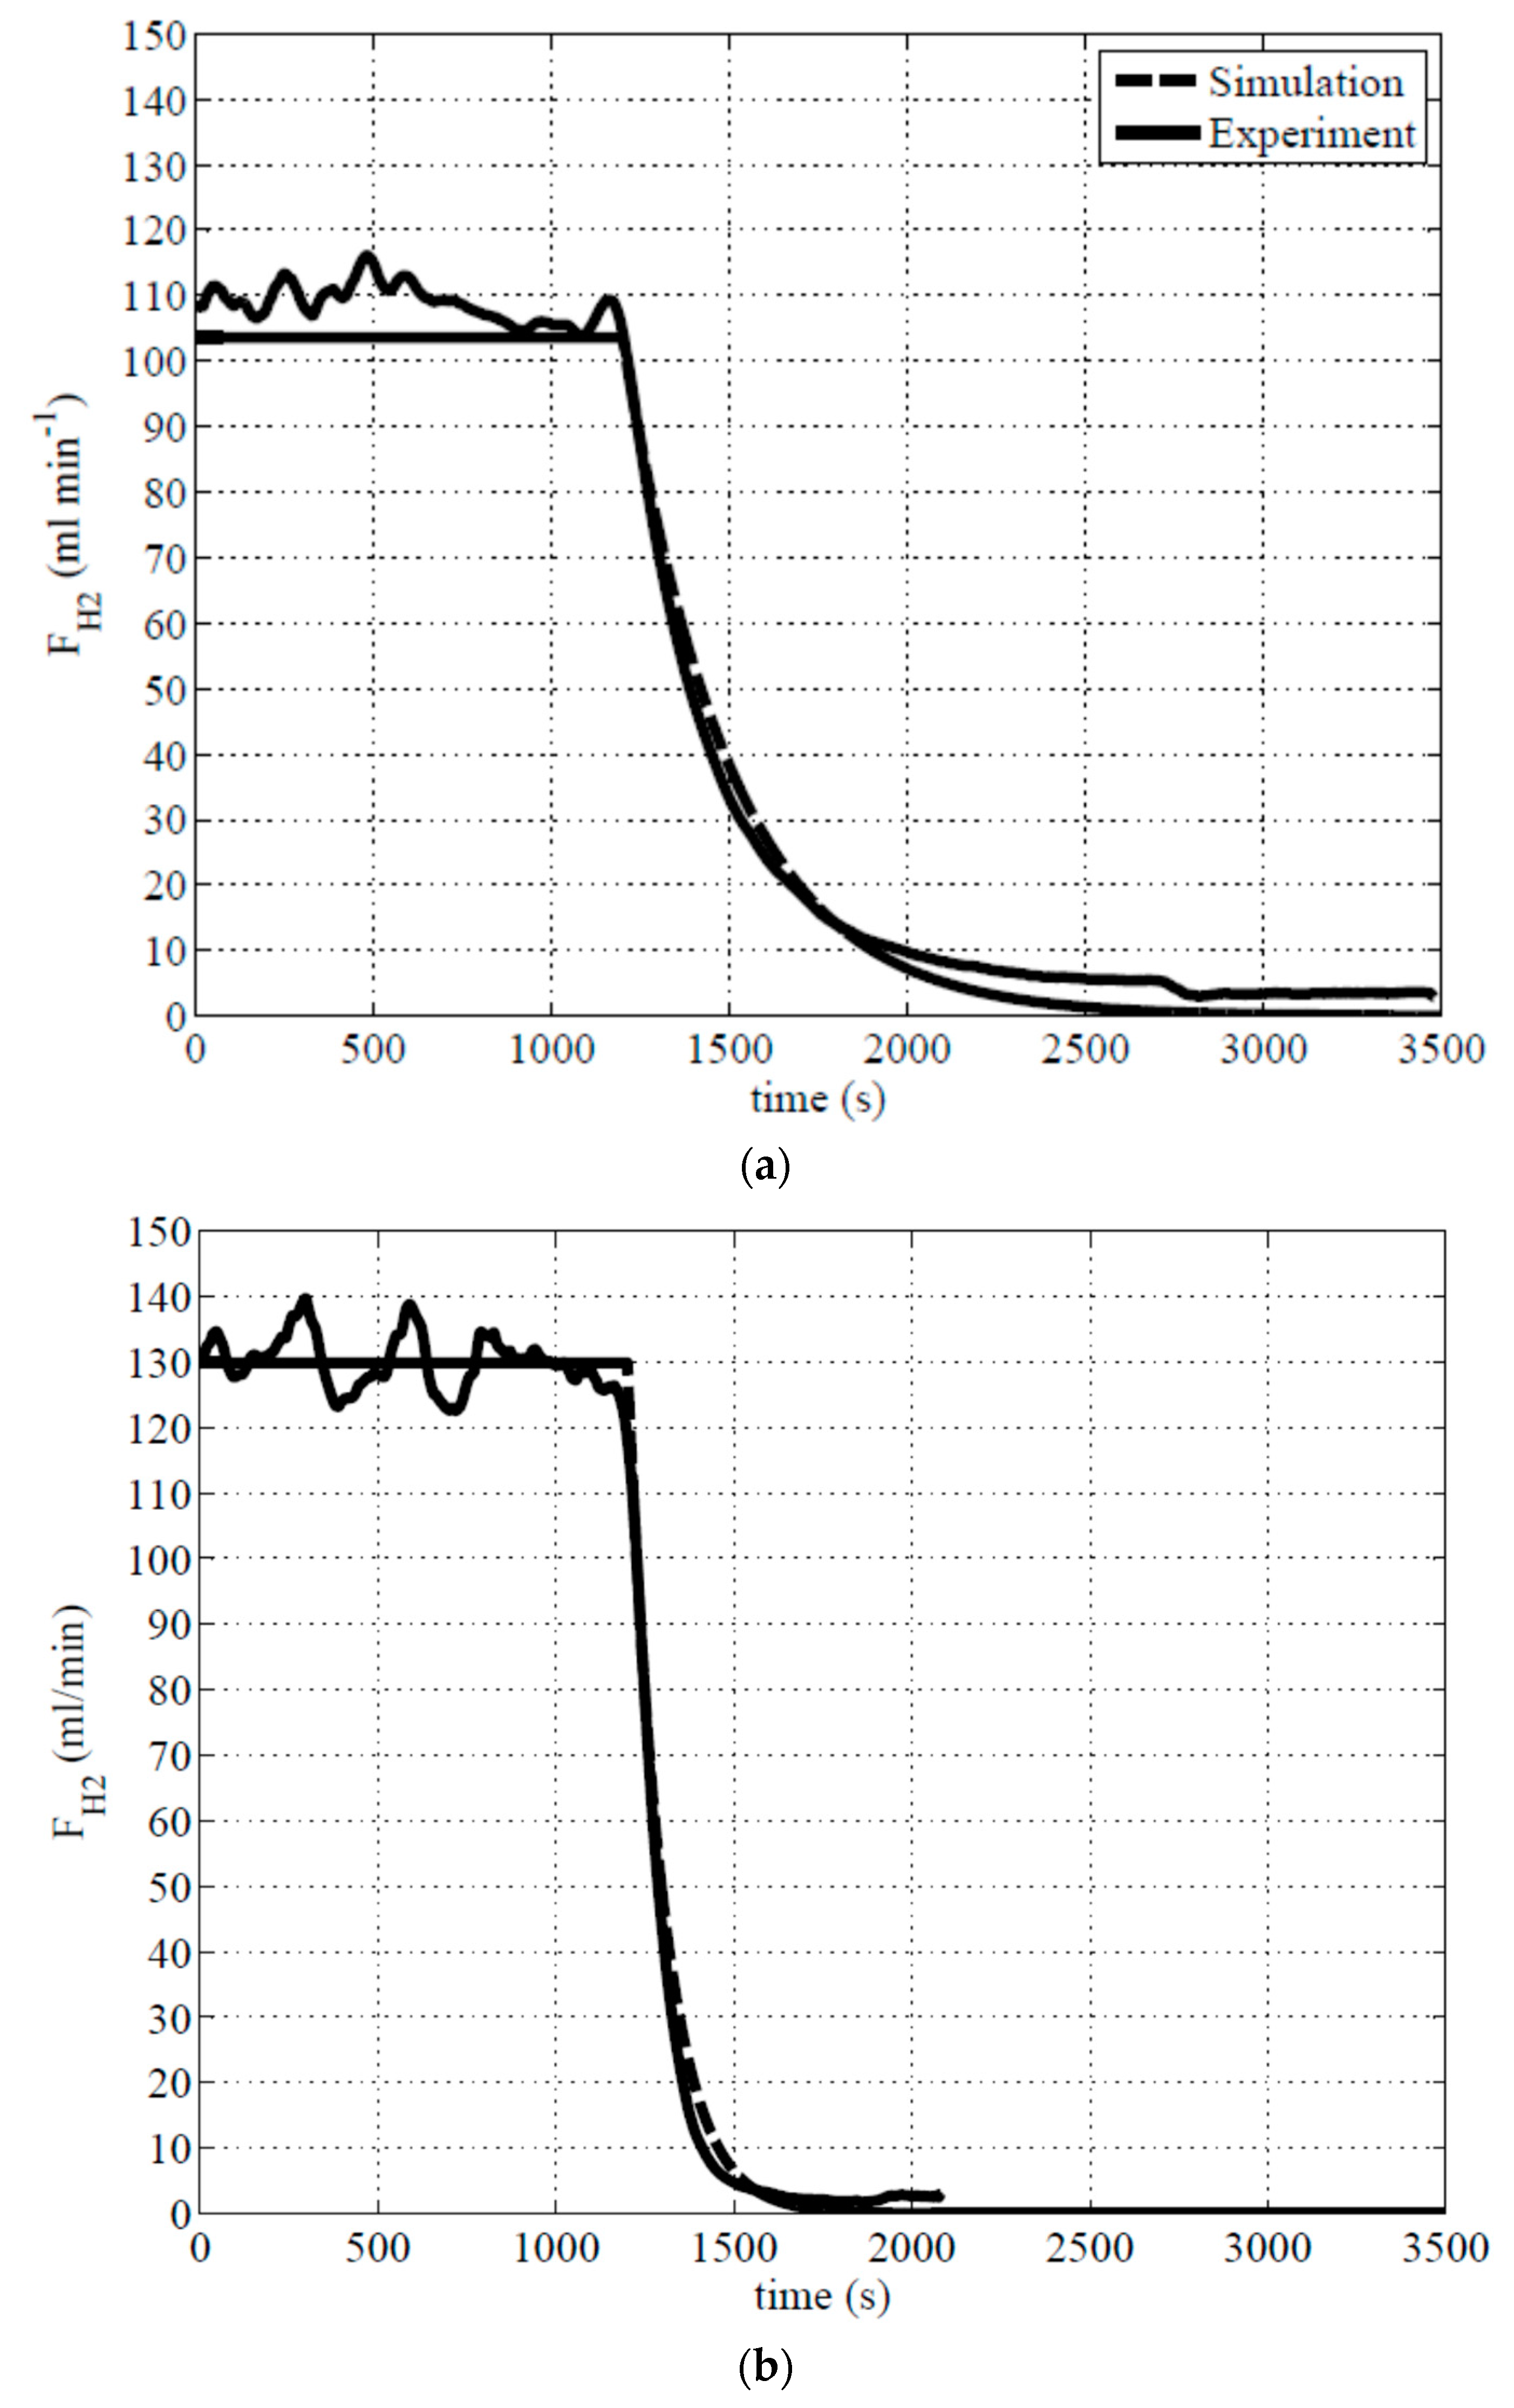
Figure 6 shows the dynamic response of the hydrogen generation rate with respect to time for our experiment data and simulation results with a step change of inlet flowrate. The feed condition was the same as in
Section 2.4. The PBR was placed in a heating vessel to keep the operating temperature at 40 °C or 70 °C. The liquid volume of the reactor (not including catalyst water content),
VL, was 8 × 10
−6 m
3. The hydrogen generation rate of the PBR reached steady-state conditions within 1200 s. At that stage the feed flowrates were shut down from 1.02 to 0 mL min
−1. The experiment results are shown in
Figure 6 (solid line) for different operating temperatures. The hydrogen generation rate at 40 °C was around 106.5 mL min
−1 and continued generating for around 1166 s and reduced to ±2% of the final value (shown in
Figure 6a). The hydrogen generation rate at 70 °C was around 130.02 mL min
−1 and continued generating for around 392 s. and reduced to ±2% of the final value (shown in
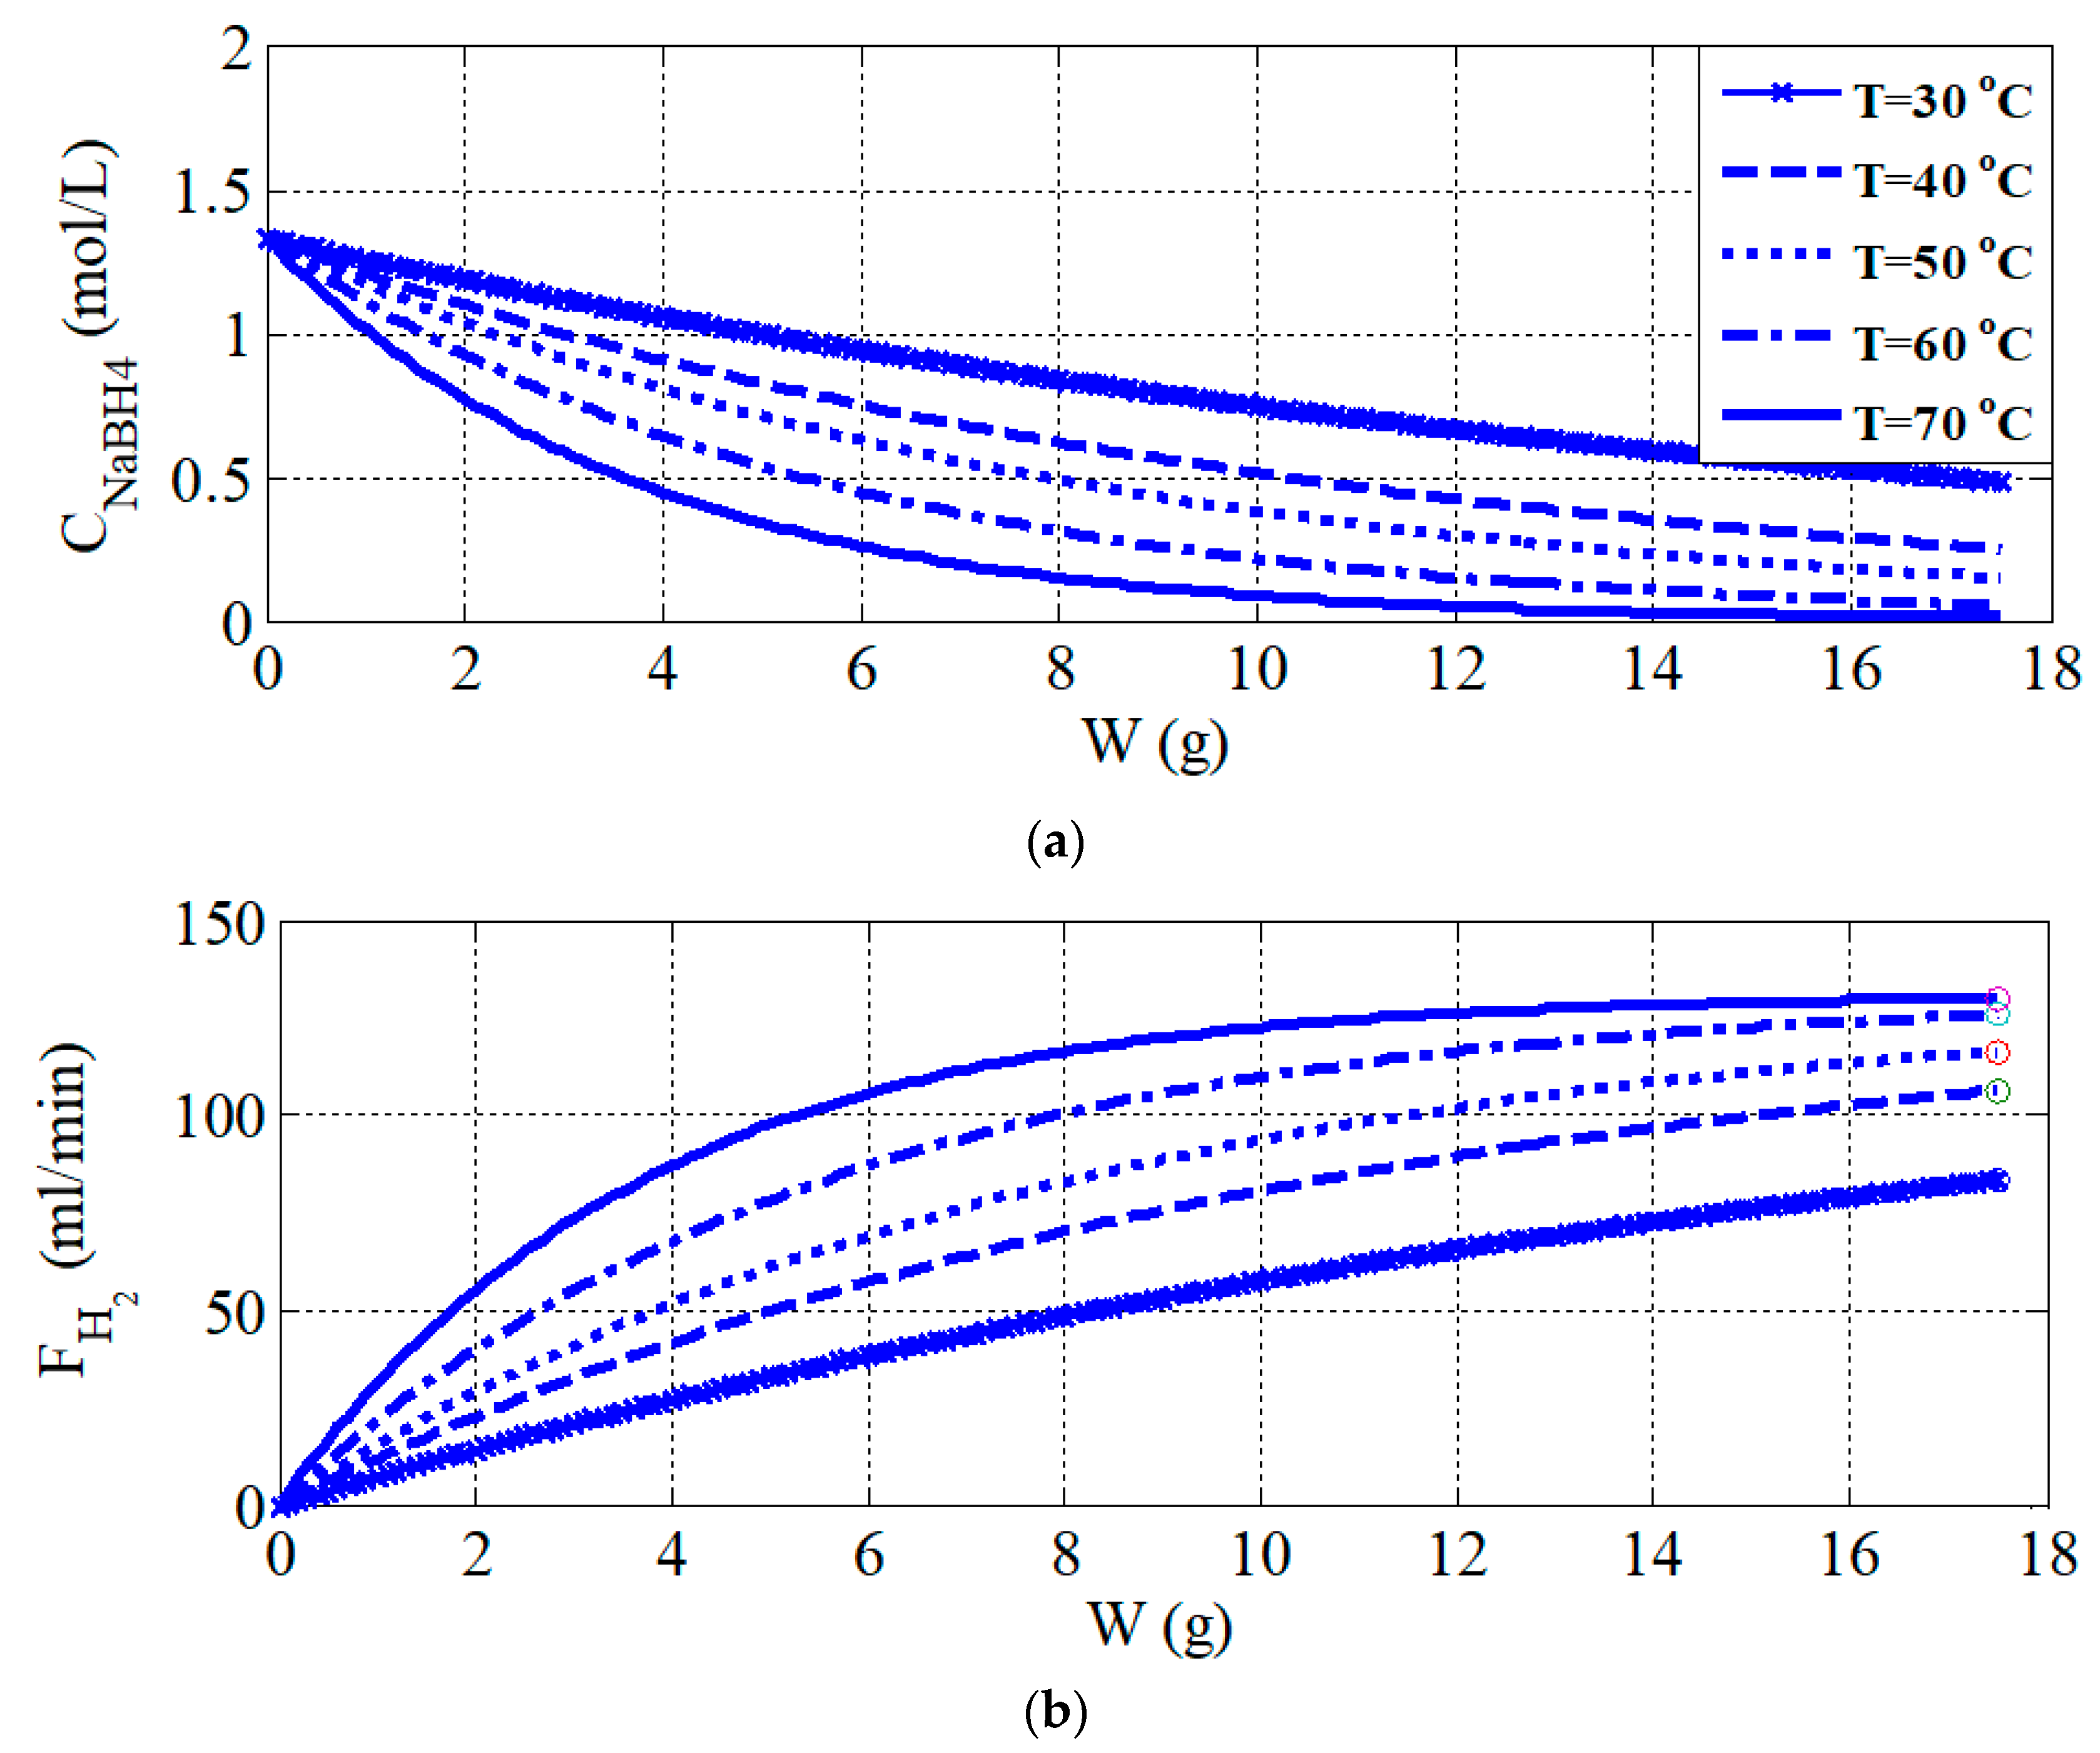
Figure 6b). The settling time of hydrogen generation rate at 40 °C is almost three times longer than at 70 °C. There are two reasons for this difference: The un-reacted NaBH
4 in the PBR at 70 °C is less than at 40 °C. This statement can be proven and results are shown in
Figure 4a. The second reason is the reaction rate at 70 °C is faster than at 40 °C. Using Euler’s method to solve the Equations (2)–(7), the dynamics simulation results are shown in
Figure 6 (dashed line) and fit with the experiment data very-well without changing any parameters.
4.2. Dynamic Characteristic of the Hydrogen Generation Rate in the PBR
The last section shows a step change in the reactor inlet flowrate generated a slow decrease in dynamic response of the reactor outlet hydrogen generation flowrate. In order to attain the instantaneous hydrogen generation profile, the relationship between dynamic response of the hydrogen generation flowrate and the feed NaBH4 flowrate needs to be derived and shown below.
Substituting Equation (6) into Equation (2), it gives:
Also, substituting Equation (6) into Equation (5), we obtain:
Rearranging Equation (13), the concentration of NaBH
4 can be obtained as:
Substituting
CNaBH4,i using Equation (14) into Equation (12) gives:
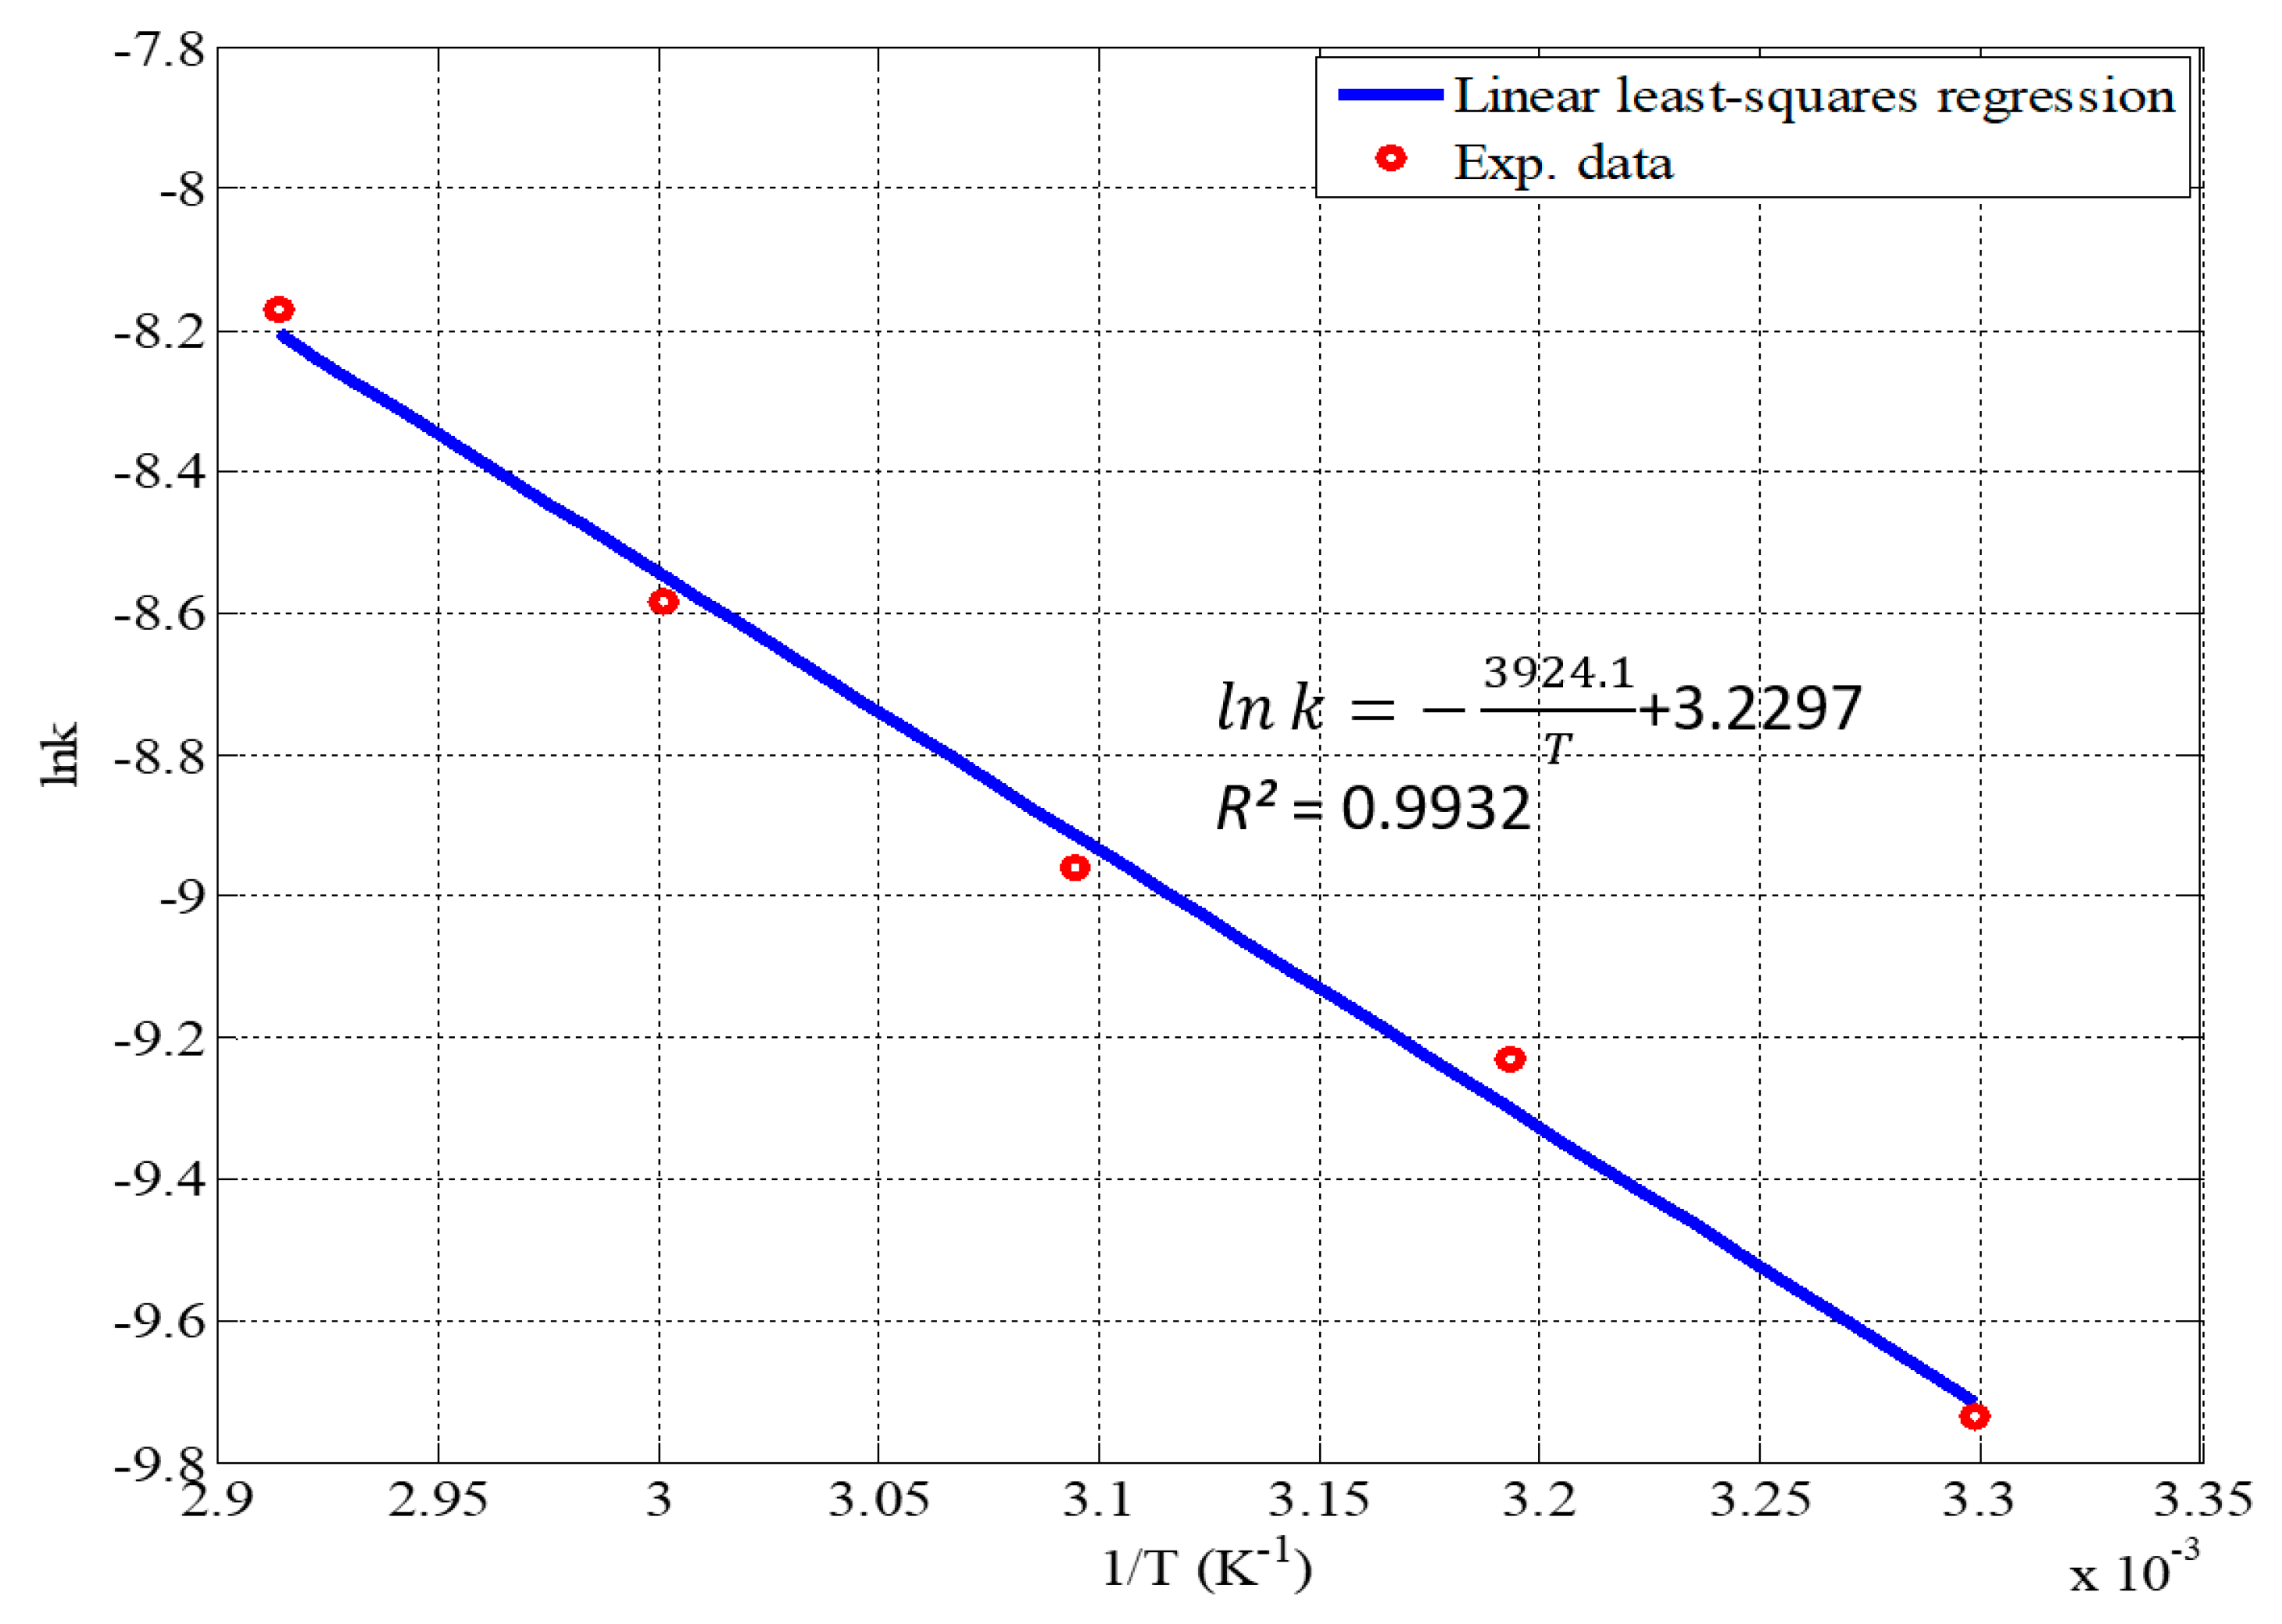
Because of the constant reaction temperature, the reaction rate constant (
k) was kept at the same value. And Equation (16) can be obtained as follows:
The PBR was modeled by lumping 175 CSTRs in series. Taking deviation variables and Laplace Transform of Equation (16), the transfer function between the input NaBH
4 molar flowrate (
FNaBH4,0) and the output hydrogen generation molar flowrate (
FH2) can be derived analytically (the derivation details from Equation (16) to Equation (17) are shown in the
Appendix A):
where
and
.
τ is the process time constant (min), which is the reciprocal of the product of the reaction rate constant and the catalyst weight into the liquid volume of the reactor.
K is the process gain, which follows the reaction stoichiometry of 4.0. The time constant (
τ) of Equation (17) can be calculated and the value is 1.67 min (=0.008/2.7310 × 10
−4/17.5) (or 100.4 s) at 70 °C. The simulation result of Equation (17) is shown in
Figure 7. When a step changes in
FNaBH4,0, the settling time of the open loop dynamic simulation of the hydrogen generation rate (
FH2) is around 392 s.
With a simple first-order transfer function available, the responses of the process to the step input of the sodium borohydride flow rate can be explored. The faster step response of the hydrogen generation rate can be obtained by operating at higher temperature or choosing high performance catalysts (higher value of rate constant (
k)) in order to attain instantaneous hydrogen generation rate. The results are shown in
Figure 6. However, it’s inefficient to achieve instantaneous hydrogen generation rate by adjusting operating temperature or high performance catalysts.
4.3. Feeding Method
To obtain an instantaneous hydrogen generation rate, the hydrogen generation rate can be expressed as a step function:
where Δ
FH2 is the derivation of the desired hydrogen generation rate.
Substituting Equation (18) into Equation (17), the NaBH
4 feed flowrate can be retrogressively calculated as follows:
The inverse Laplace Transform of Equation (19), the NaBH
4 feed flowrate can be derived analytically, which can be expressed as the combination of the impulse and step functions:
where
δ(
t) is the impulse function and
u(
t) is the unit step function.
To produce a 130.02 mL min
−1 of hydrogen flowrate, the process time constant (
τ) and process gain (
K) of Equation (17) are 1.67 min and 4 at 70 °C. A combination of the impulse and step functions of the feed flowrate (shown in
Figure 7) can achieve an instantaneous and constant hydrogen generation rate. The step response of hydrogen generation rates relates to a PBR design, and the impulse response of hydrogen generation rate relates to a batch reactor design where the initial volume of the NaBH
4 is 7.95 × 10
−8 m
3 (= 0.00538 × (1.67/4) = 0.00225 mol = 0.0795 mL of NaBH
4). It’s a concept of a design procedure suitable for hydrogen-on-demand systems.
4.4. Implementation
In
Figure 7, a given amount of 7.95 × 10
−8 m
3 of the NaBH
4 feed is initially placed in the reaction chamber (the area of the impulse function shown in
Figure 7). The reaction is started by adding the constant NaBH
4 feed flowrate (the area of the function shown in
Figure 7). An instantaneous hydrogen generation rate can then be obtained.
However, in real applications, it’s impossible to supply a 7.95 × 10
−8 m
3 amount of the NaBH
4 feed immediately (impulse function) when the sodium borohydride hydrolysis reactors are restarted. In order to solve this problem, for a subsequent start-up, the pulse function of NaBH
4 feed flowrate is used instead of the impulse function. The pulse function of input NaBH
4 feed flowrate can be expressed as:
where Δ
FNaBH4,0 is the magnitude of the pulse function and
tS is the start-up time.
Taking a Laplace Transform of Equation (21), and substituting the NaBH
4 feed flowrate into Equation (17). Then, taking inverse Laplace Transform, the hydrogen generation rate with respect to time is given as:
For the condition of
t =
tS, the hydrogen flowrate is equal to the desired hydrogen generation rate, which is
FH2(
t) = Δ
FH2. Therefore, the magnitude of the pulse function can be computed as:
The total additional amount of NaBH4 feed stream () is ΔFNaBH4,0 × ts.
Once the required start-up time is determined, the magnitude of the pulse function and the total additional amount of NaBH
4 feed stream can be calculated. To produce a 130.02 mL min
−1 hydrogen flowrate, the process time constant (
τ) and process gain (
K) of Equation (17) are 100.4 s and 4 at 70 °C. Pulse flowrate to normal NaBH
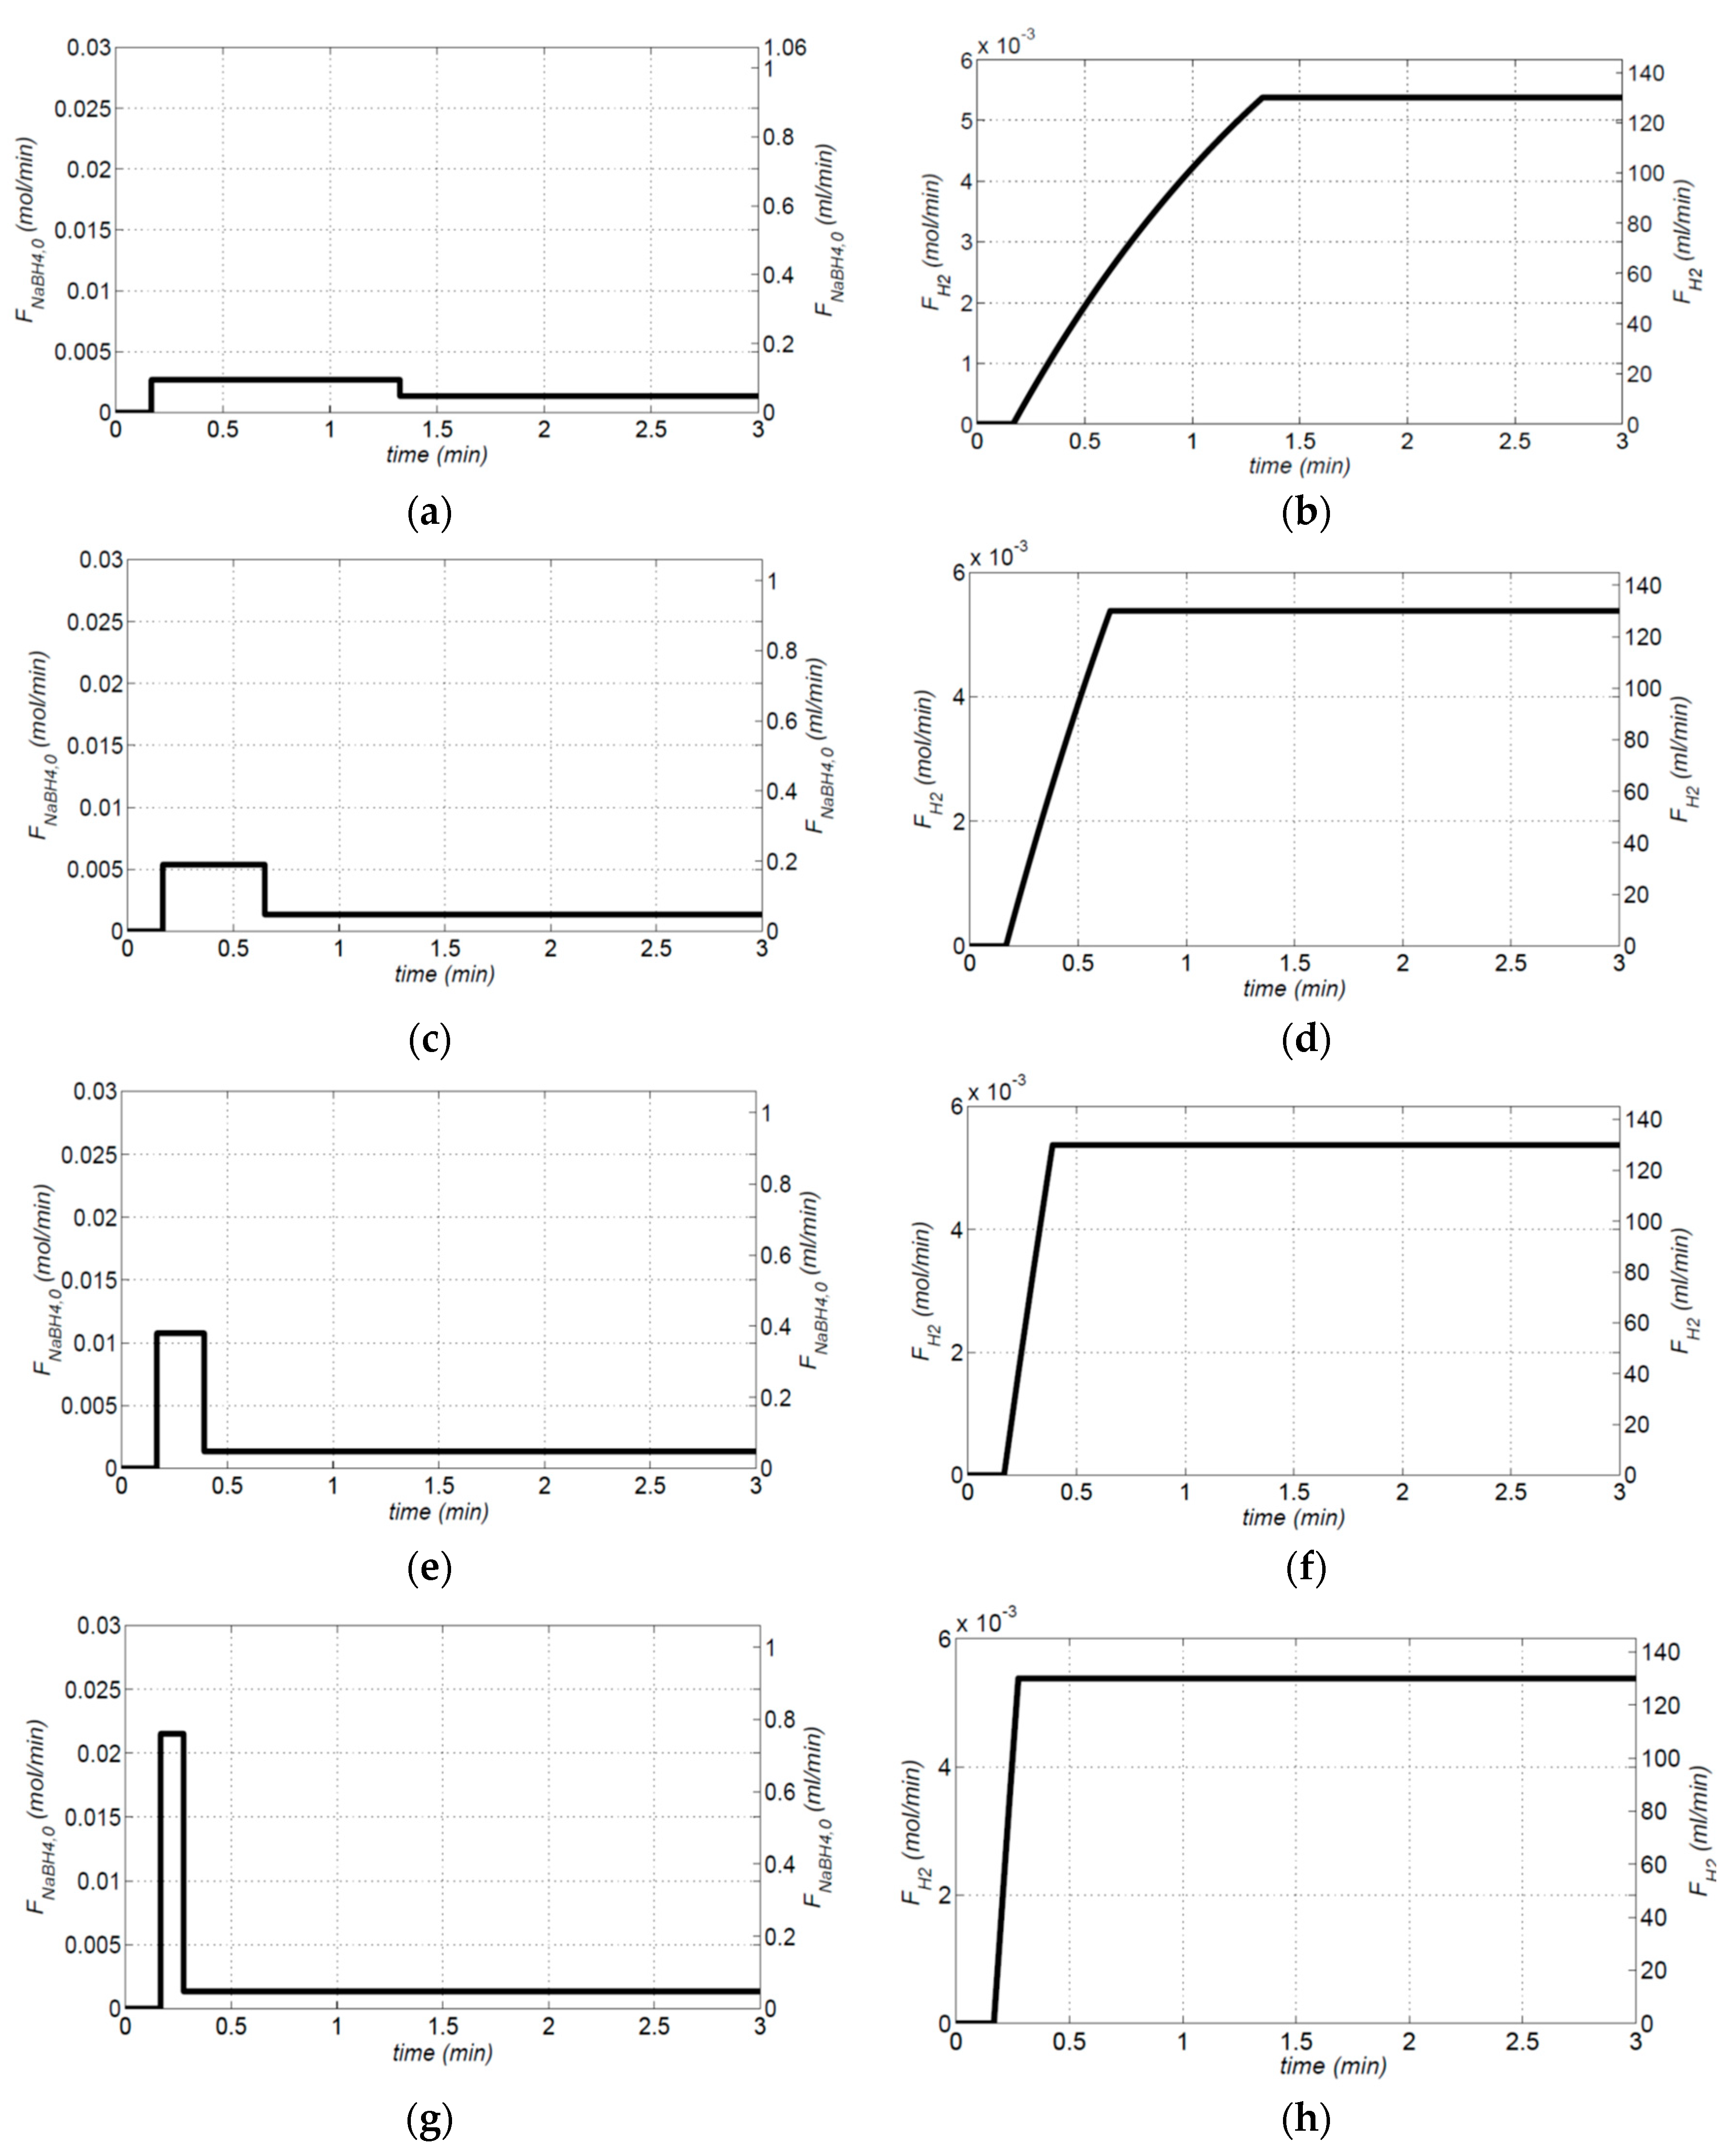
4 feed flowrate ratios are 2, 4, 8 and 16, and the start-up times can be calculated by Equation (25) and are 69.59, 28.88, 13.41 and 6.48 s, respectively.
Figure 8 shows the simulation results with different high points of the pulse function. The higher value of the pulse function; the shorter the start-up time of the hydrogen generation rate.
Based on previous results, the turn down ratio of feed pump can be calculated. The turndown ratio (TR) between the maximum NaBH
4 feed flowrate (Δ
FNaBH4,0) and the nominal NaBH
4 feed flowrate (
) can be defined as:
where
is the nominal NaBH
4 feed flowrate, which is the magnitude of the step function in Equation (17).
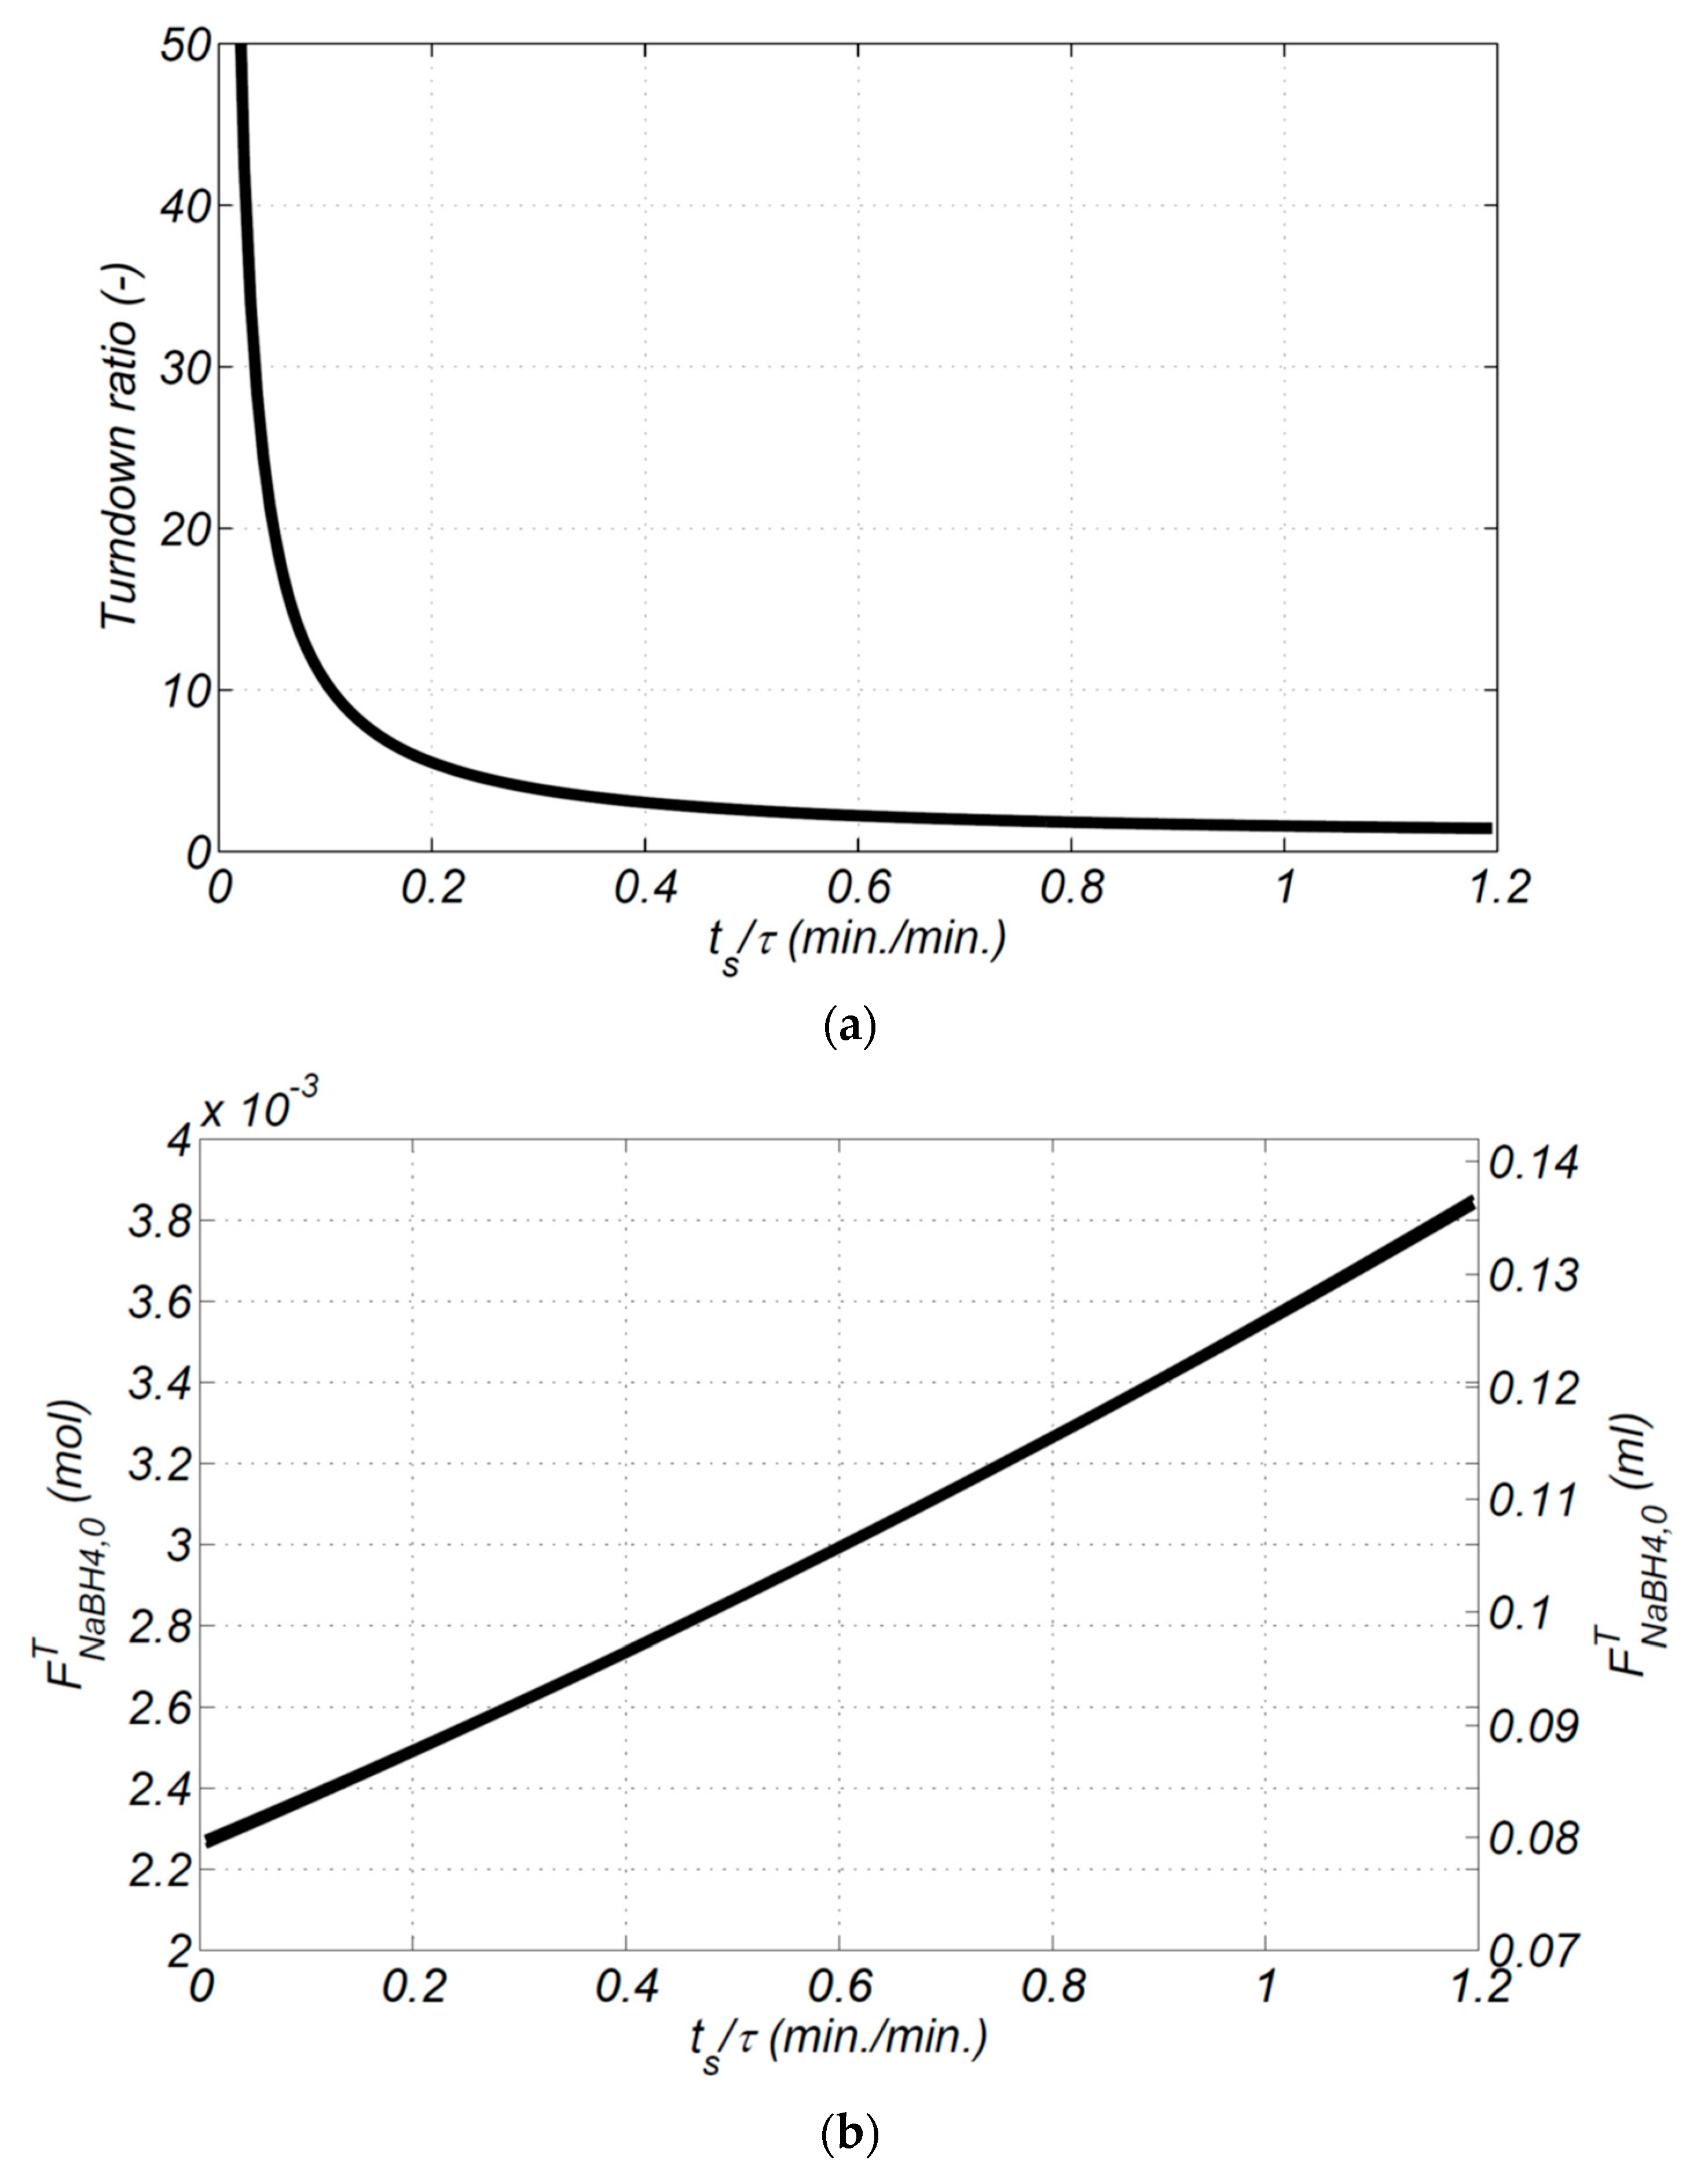
Figure 9a shows that an increase in the start-up time causes a decrease in the turndown ratio. When the start-up time (
tS) is determined in Equation (24), the value of TR can be calculated. To comply with a start-up time of 5 s (or 0.083 min) (set by US Department of Energy fuel cell start-up time of less than 5 s to produce hydrogen), the turndown ratio is at about 20 (at
tS/
τ = 0.083 min/1.67 min = 0.05).
Figure 9b shows that an increase in the start-up time causes an increase in total additional NaBH
4. These results show the start-up time of hydrogen generation using NaBH
4 hydrolysis reaction can be reduced by providing a combined higher pulse function/step function feed flowrate.
5. Experiment Validation
The experiments of the sodium borohydride hydrolysis reaction for hydrogen generation were set-up and performed at the Tamkang University/Process System Engineering Laboratories facility in Taipei, Taiwan.
Figure 1 shows the experimental setup of the sodium borohydride hydrolysis reaction for hydrogen generation. The 1.02 mL min
−1 feed flowrate which included 5 wt.% NaBH
4 solution and 2 wt.% NaOH solution as an alkaline stabilizer, was pumped into the reactor and came into contact with the 0.0175 kg Co-B/IR-120 catalyst. The hydrolysis reactor was placed in the water bath, and the temperature was set at 70 °C. The hydrogen was generated in the reactor and exited from the top channel via a tube, then removed the water vapor by a steam trap. The hydrogen generation rate was recorded by the mass flowmeter. When the hydrogen flowrate stabilized at 130.0 mL min
−1 at around 1200 s, the feed flowrate was shut-down which caused the hydrogen flowrate to decrease from 130.0 mL min
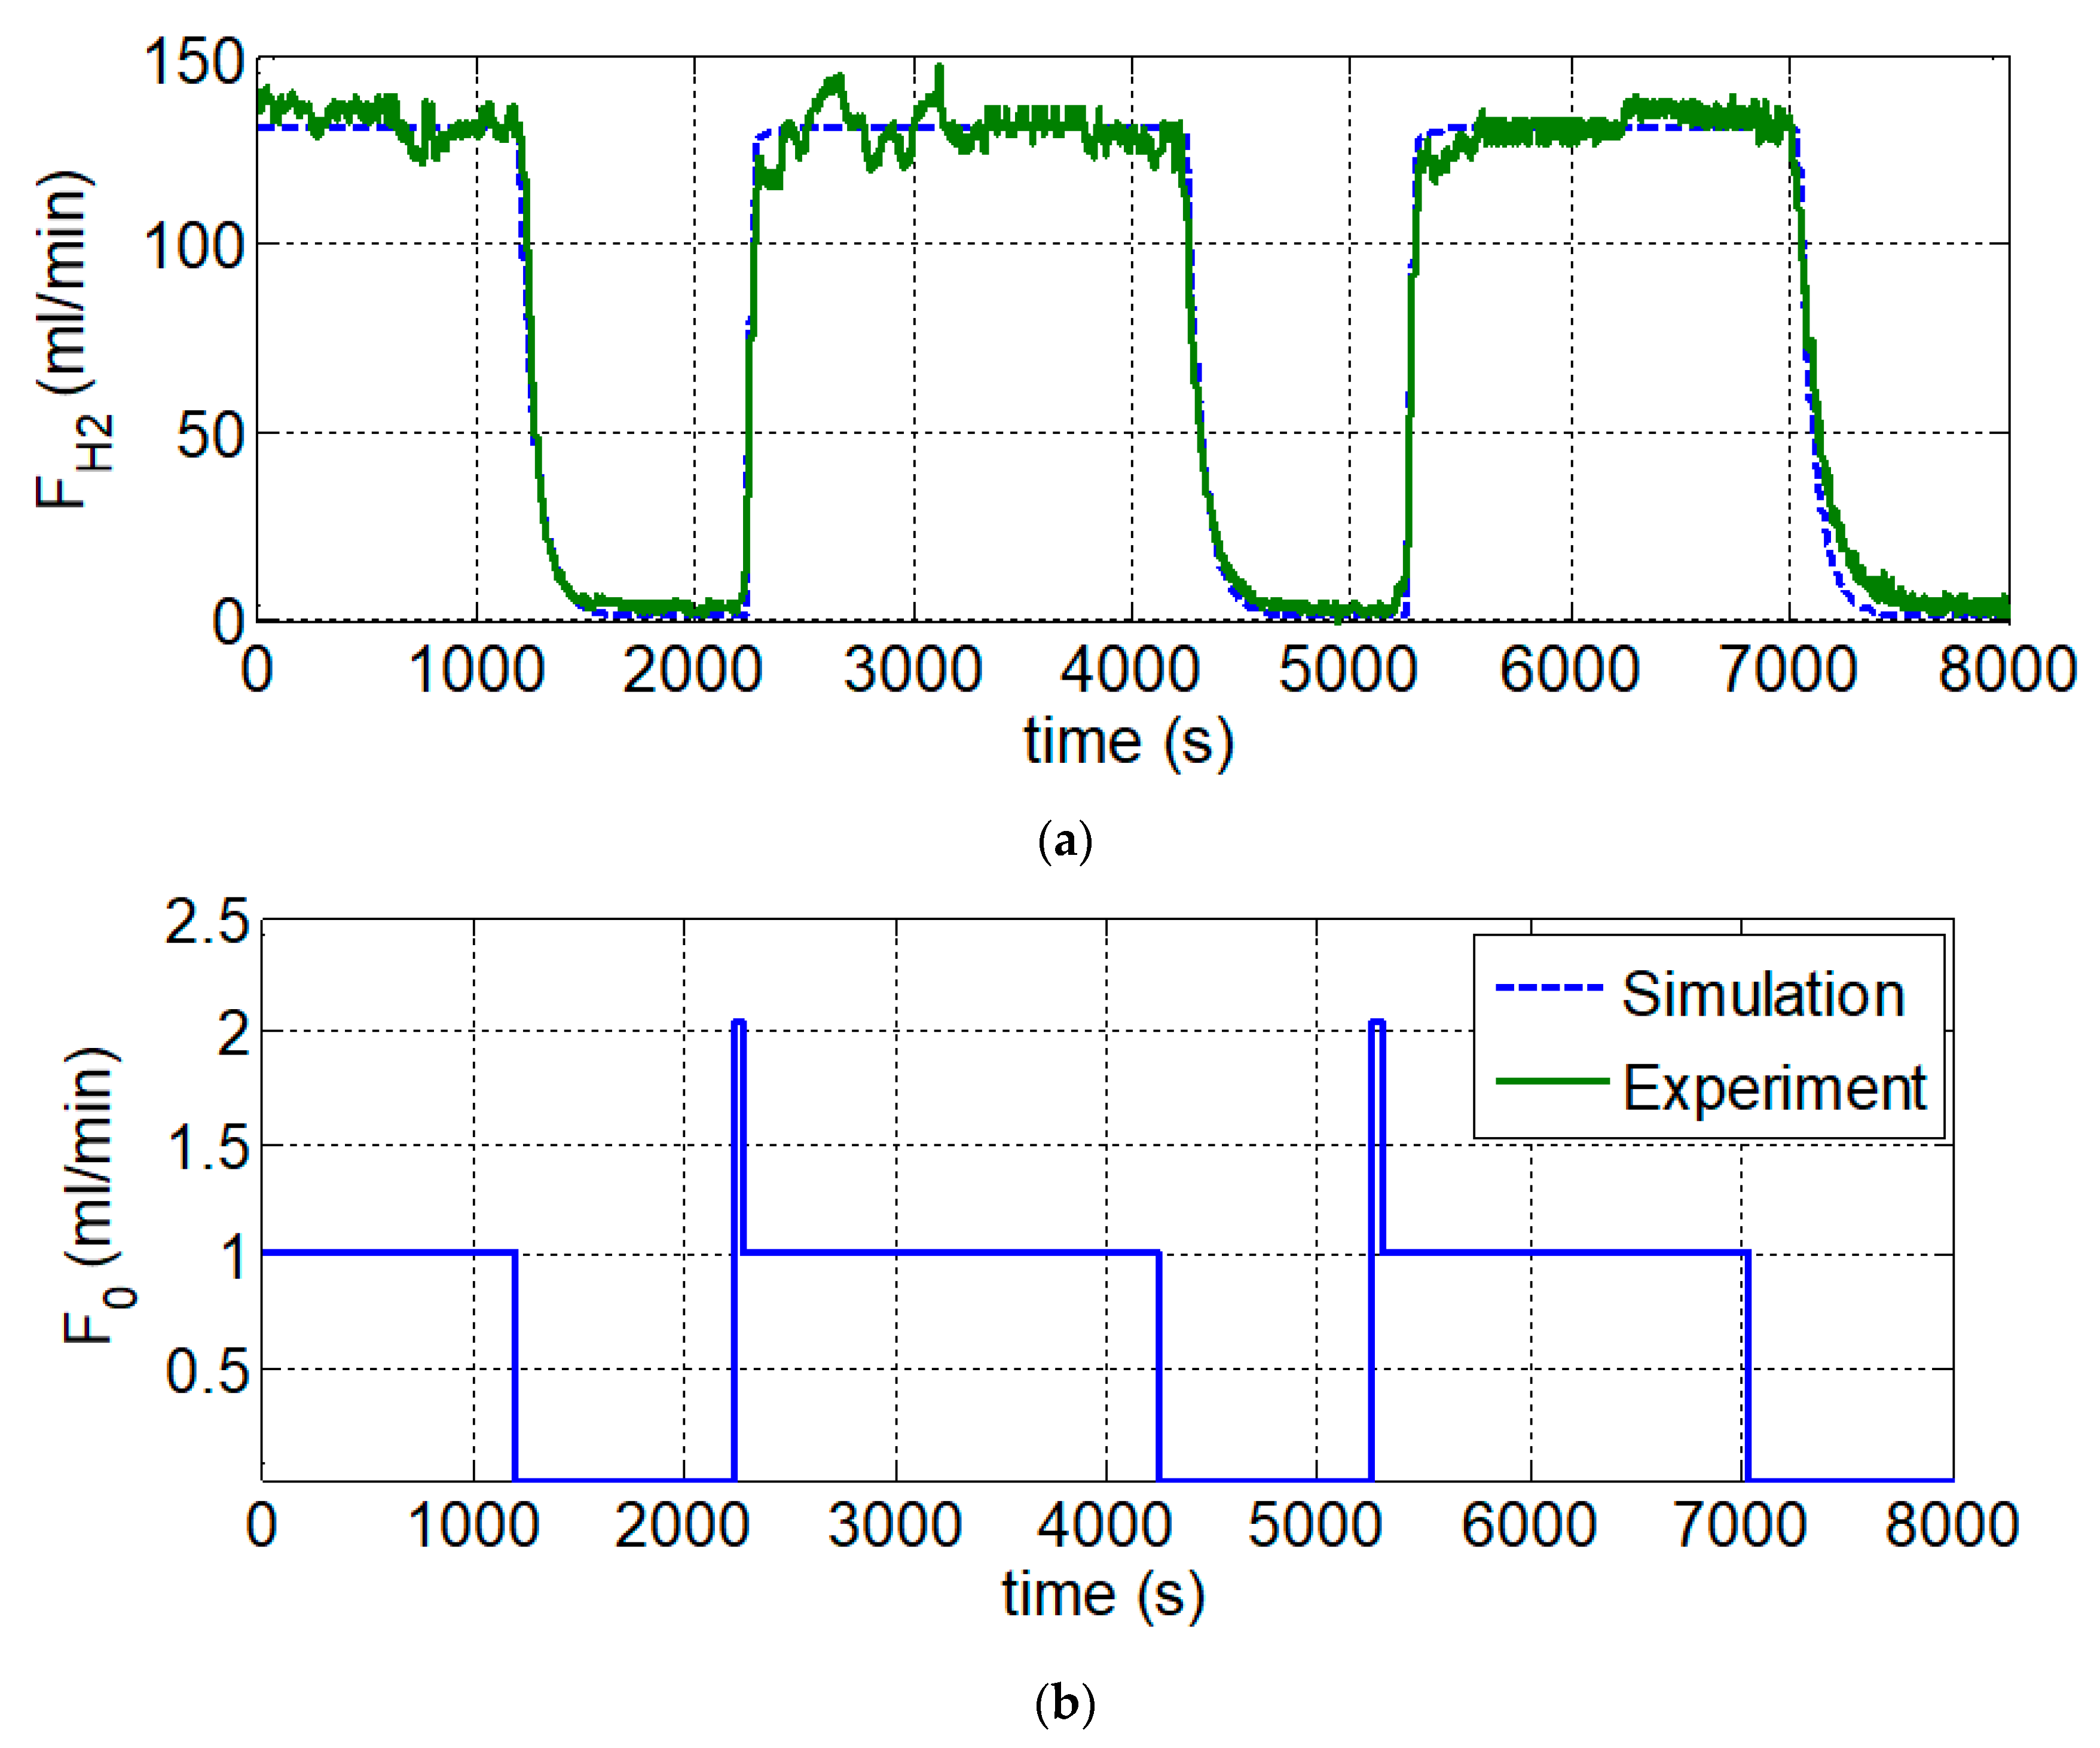
−1 to zero. In order to simulate the start-up and shut-down situations of a 3C device, the feed flowrate was adjusted to the normal flowrate and then to zero. Once the computer start-up process is completed, then a regular hydrogen flow rate can be obtained to maintain the in-use power level. When the computer is shut down and restarted, the pulse function of feed flowrate is used instead of the impulse function. Typical power requirements for different activities are shown in
Figure 10. Because of the limitation of the maximum flowrate (2.4 mL min
−1) of the rotary pump, the normal (Step) and maximum (Pulse) flowrates are set at 1.02 and 2.04 mL min
−1, respectively. The feed flowrate was restarted at 2250 s using a combined pulse/step function (The pulse height, period and step height are 2.04 mL min
−1, 70.0 s and 1.02 mL min
−1). This resulted in a start-up time reduction from 392 s. to 70 s. The feed flowrate was turned to zero at 4250 s. the shut-down time was around 392 s. The second start-up and shut-down cycle was tested and the same result was obtained. The simulation result fits with our experiment data very well.
6. Conclusions
In this work, the operational procedure for a hydrogen-on-demand system was proposed. A first-order transfer function between the input NaBH4 feed flowrate and the output hydrogen is analytically derived. The time constant of the transfer function is a function of the reciprocal of the product of the reaction rate constant and the catalyst weight into the liquid volume of the reactor. In the reactor design phase, increasing the catalyst performance and the operating temperature and decreasing the bulk density of the reactor (Wcat/VL) can shorten the dynamic response time of the hydrogen generation rate. However, there is an improved limitation of the dynamic response time of the hydrogen generation rate in the design phase. In the reactor operation phase, in order to achieve the on-demand hydrogen generation rate, the feed flowrate should be supplied using a combination of impulse function and step function of the NaBH4 feed flowrate. For different power requirements, the pulse/step function of the NaBH4 feed flowrate is used for a subsequent start-up. Hence, a systematic feeding procedure can then be constructed for shortening start-up times. In order to achieve the DOE’s fuel cell 5 s start-up time goal, the turn down ratio of the feed flowrate should be increased to 20 to satisfy the hydrogen generation rate requirement. Finally, the experiment was set-up to validate the theoretical derivation result.


