Abstract
This paper presents a complete study of a standalone photovoltaic (PV) system including a maximum power tracker (MPPT) driving a DC boost converter to feed a resistive load. Here, a new MPPT approach using a modification on the original perturb and observe (P&O) algorithm is proposed; the improved algorithm is founded on a variable step size (VSZ). This novel algorithm is realized and efficiently implemented in the PV system. The proposed VSZ algorithm is compared both in simulation and in real time to the P&O algorithm. The stability analysis for the VSZ algorithm is performed using Lyapunov’s stability theory. In this paper, a detailed study and explanation of the modified P&O MPPT controller is presented to ensure high PV system performance. The proposed algorithm is practically implemented using a DSP1104 for real-time testing. Significant results are achieved, proving the validity of the proposed PV system control scheme. The obtained results show that the proposed VSZ succeeds at harvesting the maximum power point (MPP), as the amount of harvested power using VSZ is three times greater than the power extracted without the tracking algorithm. The VSZ reveals improved performance compared to the conventional P&O algorithm in term of dynamic response, signal quality and stability.
1. Introduction
It is currently well known that power production technology from renewable energy sources is mature, available and reliable. Photovoltaic (PV) energy is considered to be the most promising future energy source as it is pollution-free—thus, it is known as “green energy”—and abundantly available anywhere in the world.
This work investigates the control of a stand-alone PV system. The success of the application of a photovoltaic system depends strongly on weather conditions. The maximization of the energy extraction from the photovoltaic generator (PVG) is necessary. Power electronic devices such as DC converters are needed in this application to allow the extraction of the highest power rate from the power supply (PVG). Maximum power tracker (MPPT) regulator accuracy has therefore become an important process for successful and effective PV applications [1].
The success of MPPT operation is challenging due to the varying sunshine conditions, which determine the amount of sun energy flux into the PV panel; this amount may change at any time. Therefore, a PV system (PVS) is considered to be a complex system, making the design of a suitable MPPT controller difficult [2].
In [3], the authors emphasized that that a high temperature reduces PV panel efficiency and that thermal and wind conditions have a significant influence on the PV panel operating temperature; therefore, the PV characteristics may be easily affected by a change of in weather conditions. In this work, we propose the use of an MPPT controller combining an MPPT algorithm and a DC converter. The MPPT controller can optimize the operation of the PV panel under any weather conditions; the design of the controller is very important because its performance reflects the amount of power that can harvested. A wide variety of algorithms have been employed to track PV panel MPP; for example, Inc Cond, hill climbing, perturb and observe (P&O) and the reference voltage [4,5,6,7].These algorithms are widely used because of the ease of their implementation; however, they have their own drawbacks, which include uncertainty due to sensitivity to abrupt variations in the weather conditions [8,9,10,11,12,13,14] and oscillations around the operating point [14,15]. These controllers provoke disturbances by acting on the DC converter command and then observing its impact on the PVG power feedback output. These may, however, miss the target because of an incorrect choice of step size value, which is usually chosen by the method of testing and trial [8].
In contrast, artificial intelligence methodology shows better performance; however, its structures are commonly more complicated, and its implementation requires a processor with a comparatively high performance. Essentially, these techniques usually suffer from an lack of adaptability when dealing with time-varying environments [8]; for example, in [16], the authors designed and implemented a reconfigurable MPPT fuzzy controller for photovoltaic systems. Fuzzy logic controllers are cheaper to develop, cover a wider range of operating conditions and are more readily customizable in natural language terms [17,18]; however, it is very complicated to design a fuzzy rules controller, as the rules are usually acquired from an expert knowledge base [18]. An artificial neuronal network can implicitly detect complex nonlinear relationships between independent and dependent variables. Neural network models have the ability to detect all possible interactions between predictor variables and can be developed using multiple different training algorithms; however, a neural network has many disadvantages as it is a “black box” and has a limited ability to explicitly identify possible causal relationships. In addition, the models may be more difficult to use in the field, and neural network modeling requires greater computational resources that are prone to overfitting [19]. The use of a neural network also necessitates an enormous database for the learning process [20,21]. In [22], the authors used sliding mode control as an MPPT controller; the sliding mode exhibits high robustness for control in relation to the parameter fluctuation of the process. On the other hand, the sliding mode has the disadvantage of disturbance chattering in the steady state, which causes a power loss [22].
Generally, the extraction of power can fail because of the very low efficiency of electronic components under low radiation states and under rapid changes in the weather condition [23,24]. In order to overcome the major drawbacks that can persist during power generation and which as a consequence could affect the PV system’s efficiency, a new algorithm is proposed in this paper. The new controller is based on the well-known P&O algorithm as it is cheap and easy to implement, but the proposed algorithm includes a definite adaptive step size that considers the system’s behavior. The novel method solves the problems of the traditional method. The proposed tracking approach uses a simple judgment norm and auto-adjusted step size to enable the PV system to achieve a fast dynamic response and a stable steady-state output power, even under abrupt weather changes. Figure 1 shows the stand-alone PV system topology used in this paper.
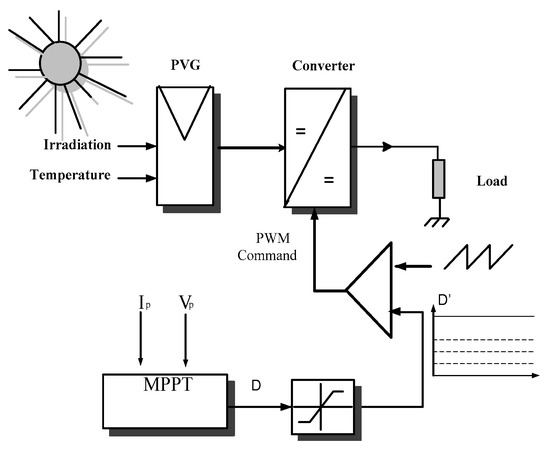
Figure 1.
The synoptic diagram of the photovoltaic (PV) system. PVG: photovoltaic generator; MPPT: maximum power tracker.
2. Methodology
2.1. Modeling of the Photovoltaic Panel
The PV cell can be substituted for an electric circuit, as shown in Figure 2a. The circuit mainly comprises the following:
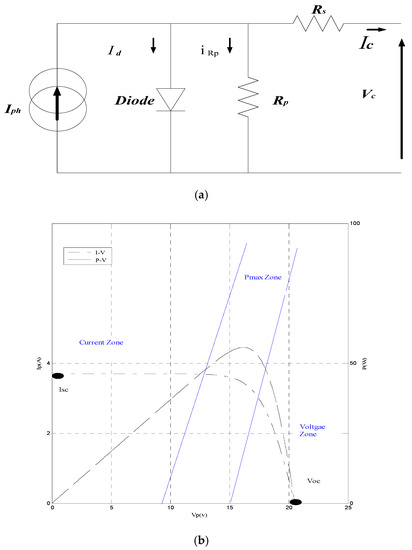
Figure 2.
PV cell-equivalent circuit and PV characteristics. (a) PV cell-equivalent circuit; (b) P-V and I-V characteristics, (1000 W/m2), (25 °C).
- -
- A current power supply (Iph) that depends of the absorbed irradiation;
- -
- A diode in which the (Id) current flows;
- -
- A load in which the (Ic) current flows. [25,26].
The cell current used for modeling is given by [8,9]
The PVG modeling depends on the parallel and series cell numbers of Np and Ns, respectively [8,9]:
The PV current is given by
Assuming that Rp>>Rs, a simplification can be made. Here, the model has values of Rs = 0 and Rp = ∞.
The PV module ATERSA A55 was considered for modeling; the module’s characteristics are shown in Figure 2b. The specifications of the PV panel are shown in Table 1 [1].

Table 1.
PV panel specifications (ATERSA under specific conditions).
The PVG P-V characteristics clearly present three specific operating points, as shown in Figure 2b.
- -
- The voltage region, where the VOC can be depicted;
- -
- The current region, where the ISC can be depicted;
- -
- The maximum power region, where the MPP can be depicted.
Operation in the third region (the Pmax region) is required to harvest the maximum power from the PV panel.
2.2. Boost Converter
A converter is an electronic device which is used when it is necessary to efficiently modify a DC input voltage level to another level at the output according to a duty cycle command D. Using this device, the voltage can be easily stepped up or down. In this work, the converter used to feed the load is controlled to harvest the maximum power of the PV. Thus, the efficiency of the proposed photovoltaic system is boosted [26,27,28].
In this work, a boost converter is chosen to step up the voltage; its circuit consists of only a switch (a transistor), an inductor, a diode and a tow capacitor, as shown in Figure 3a. The output voltage is controlled by varying the switching frequency of the duty cycle command (D). The boost converter specifications are listed in Table 2.
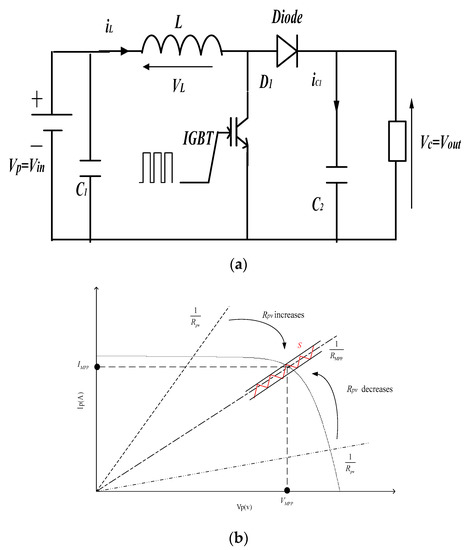
Figure 3.
Boost converter Circuit and I-V characteristics. (a) Boost converter circuit; (b) I-V characteristics.
Table 2.
Boost converter parameters.
The boost converter circuit dynamic model is as follows [1]:
Then,
where ;; .
In CCM (continuous conduction mode), the output voltage is related to the input voltage by the following [27]:
Based on
it is easy to deduce that
where Rpv is the PV panel load; this is also considered to be an input load (Rin) for the boost converter.
Pin = Pout,
Using Equation (9), based on the equation , it can be observed that if (D) decreases/increases, then Rpv increases/decreases; thus, based on the I-V characteristic shown in Figure 3b, the Ip will increase and Vp will increase/decrease.
Equivalently, in Equation (4), it can be also seen that when the voltage (Vp) decreases/increases, the current (Ip) will increase/decrease. Therefore, if the resistance fed by the PV panel increases, then (Vp) should increase and (Ip) should decrease.
This shows that the rate of change in the duty cycle is always opposite to the rate in the voltage. This can be expressed mathematically as
2.3. Modeling of the Photovoltaic Panel
The photovoltaic generator output power is given by P = Vp × Ip. The power optimization is carried out by pushing the system to work at a defined point, as shown in Figure 4a, and by solving the following Equation (11) [28].
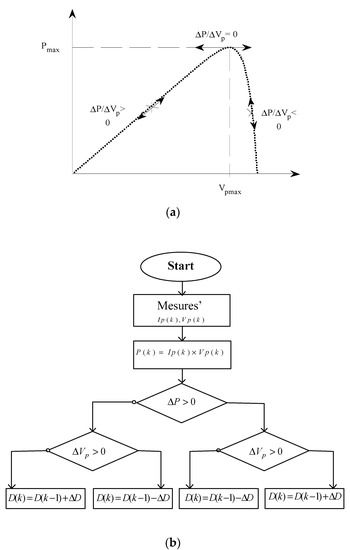
Figure 4.
Power-to-voltage ratio variations and the structure of the perturb and observe (P&O) algorithm. (a) Power-to-voltage ratio variations; (b) the structure of the P&O algorithm.
2.3.1. P&O Algorithm
The P&O algorithm is presented in Figure 4b; it is the most popular MPPT method due to its simplicity [11,15,29]. The main task of the P&O algorithm is to provoke disturbances by acting on the pulse width modulation (PWM) duty cycle command (decreasing or increasing) and observing its impact on the generated output PV power. If the actual power P(k) is greater than the previous computed power P(k-1), then the perturbation direction is maintained; otherwise, it is reversed [28,29,30]. The value of the step size (perturbation ∆D) is very important in this algorithm.
The step size ∆D is chosen by trial and testing in simulation. If the value ∆D is very small or very large, then it is possible to lose stability. Despite the simplicity of the implementation of the P&O algorithm, it suffers from the problems [20,28] that the operation of PV systems fails to track the MPP, and the PV systems operate in an oscillating mode.
The choice of a large perturbation step (∆D) will lead to a fast convergence to the MPP from one steady state to another. Nevertheless, the power loss caused by perturbation in the steady state will also increase.
On the other hand, a smaller (∆D) can improve the power loss but will slow down the tracking speed. Therefore, the choice of the ∆D is considered to be a critical issue [28].
To solve this dilemma, a variable-step size MPPT method is proposed in the next part of this work.
2.3.2. P&O Algorithm Using a Variable Step Size
To solve the drawbacks of the P&O algorithm, the adjustment of the step size (∆D) may present a solution. A large value may make the response dynamic faster; however, it boosts the amplitude of the oscillations around the MPP and then decreases its performance.
Many improvements have been proposed, such as controlling the (∆D) value by an artificial intelligence method such as swarm optimization (PSO); for example, in the work presented in [29], which required a learning step before using this method.
This paper presents a new technique to solve the drawbacks of the P&O algorithm by auto-tuning the step size in order to make the control algorithm adaptive and more robust and to ensure increased dynamic performance.
When the weather condition changes, the step size must be immediately auto-tuned pursuant to the new MPP operating point on the P-V characteristic. If the operating point is distinct from the MPP, the step size increase enables a fast-tracking ability.
The modified P&O algorithm is presented in Figure 5. Based on Figure 4a, if the operation point of the PVG is near to the maximum power point, the variable step size (ΔP/ΔV) will be small, and so the new duty cycle will increase or decrease in proportion to this variation; in this case, it will be a small variation, while in other cases it would be a large variation.
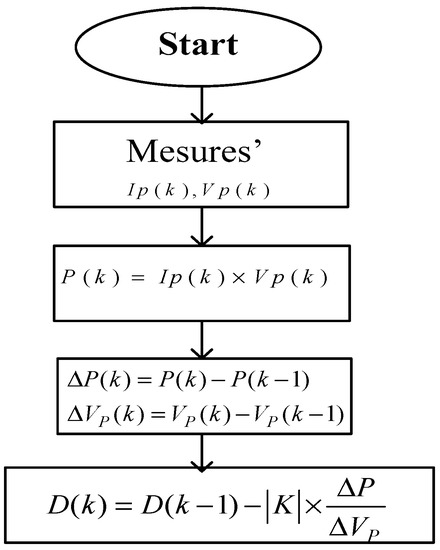
Figure 5.
Variable step size (VSZ) algorithm.
If the operation point of the PV system is in the MPP, then the (ΔP/ΔV) will obviously be null, as shown in Figure 4a; therefore, the new duty cycle will remain the same. Thus, we avoid the oscillation of the regular P&O algorithm.
With K is a positive scaling factor, while using a boost converter, the duty cycle must change its direction inversely to the sign of the ratio (∆P/∆V), so ∆D = −K*(∆P/∆V). Thus, if the ratio (∆P/∆V) is positive, then the system operates according to the left part of the characteristic curve (P-V), as shown in Figure 4a. In this case, the voltage must increase to reach Vpmax = VMMP; thus, based on the Equation (10) the duty cycle must decrease.
Stability Proof. The Lyapunov function is a positive scalar function for the state variables of the system.
Based on the Lyapunov function, the variable structure mode control requires that
Considering that
where ; when S = 0, the PV system reach the maximum power point. Therefore, the system dynamics can be divided into two states: S < 0 and S > 0.
When S < 0, based on the new algorithm, > 0, and by using Equation (10),
Deriving S using Equation (6) gives us
Thus,
Using Equation (16) in (20) results in > 0; thus, finally,
when S > 0, based on the new algorithm, < 0, and by using Equation (10), Vp increases:
Using Equation (22) in (20) results in < 0; thus,
Finally, the system may reach global stability, and if S = 0, the system will operate at MPP according to Equation (17).
3. Result
3.1. Simulation Result
To prove the increased performance of the proposed algorithm, a sudden and instantaneous external and internal deviation is applied to the system. Irradiation variation is considered to be an external disturbance, and load variation is considered to be an internal disturbance. Figure 6a,b shows the load curve, R, and the irradiation curve, G, respectively. When the time is equal to 2 s, the load is increased from 15 Ω to 30 Ω; when the time is equal to 4 s, the irradiation is increased from 500 W/m2 to 1000 W/m2.
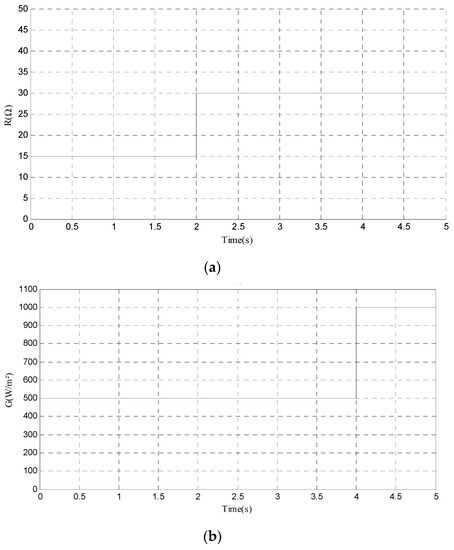
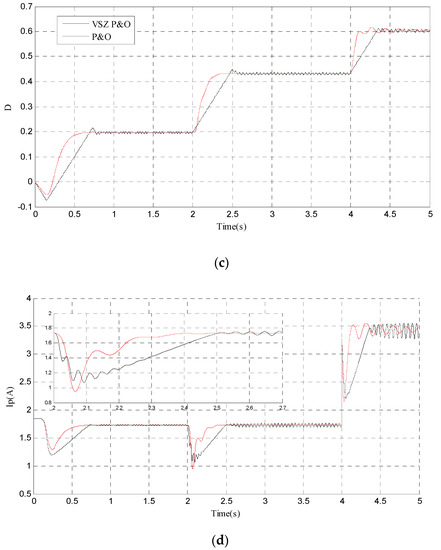
Figure 6.
Irradiation and load variation, the generated duty cycle and the PVG current. (a) Irradiation, (b) load variation irradiation, (c) duty cycle, (d) the PVG current.
Figure 6c shows the MPPT controller output (the duty cycle), while Figure 6d shows the dynamic evolution of the PV current. It is clearly shown that the duty cycle command detects all disturbances and acts accordingly to maintain maximum power tracking; therefore, the current and voltage values change.
Figure 7a,b shows the dynamic evolution of the PVG, voltage and power signals, respectively, for the same application of irradiation. From 0 to 4 s, the irradiation is constant; the measures mentioned above remain steady despite the load change to keep the system operating at the MPP. From 4 to 5 s, the irradiation increases, and according to the PV characteristics, the MPP is sensitive to the irradiation value. The behavior of the system proves the algorithm’s robustness. It can easily be observed that the PV using both algorithms meets the MPP. Figure 7c presents the load voltage. It should be noted that, with the increasing of the load value, the oscillation increases for the regular P&O algorithm.
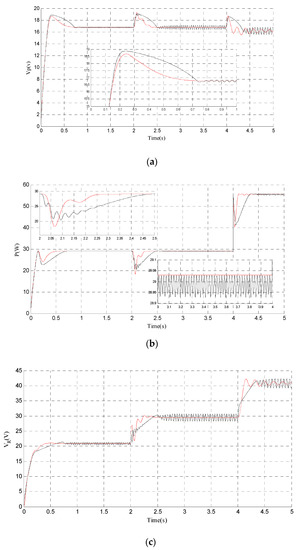
Figure 7.
PVG voltage and power, and the load voltage. (a) PVG voltage, (b) PVG power, (c) load voltage.
The given results show the performances of the proposed variable step size P&O algorithm along with the regular algorithm. Both algorithms achieved the target of tracking the MPP, but the proposed variable step size P&O algorithm does not present oscillation around the operating point. This fact minimizes losses and improves the tracking accuracy compared to the regular P&O algorithm.
It is thus clearly demonstrated that the modified controller is much more appropriate for a rapid and accurate dynamic signal response.
In the next section, the adaptive variable step size algorithm will be implemented in real time and compared to the regular algorithm.
3.2. Experimental Setup
In this section, extensive experimental work and selected results are presented. A comparison of the systems including the regular P&O algorithm and the proposed variable step size P&O controller is also presented. In this section, global PV system control is carried out as previously shown in Figure 1.
For the real-time experiment, a dSPACE controller board was chosen as the control platform. The output–input (O/I) interface of the dSPACE DS1104 help to enable the linkage between the MATLAB/SIMULINK and the real hardware system. [31,32,33]. The output–input (O/I) blocks are analog-to-digital converters (ADCs) and digital-to-analog converters (DACs). Using the MATLAB/SIMULINK real-time workshop (RTW) Toolbox, the SIMULINK model was converted to C-code; later, the codes were treated by a compiler and connected to the real-time dSPACE processor board. The PWM signal was 20 kHz, which was directly produced to control the switching MOSFET of the boost converter.
Using the dSPACE graphical user interface (GUI) software, the supervision of the PV panel performance and behavior in real time was carried out. The user is able to control, stop the system and record the signals in real time.
The implementation of the MPPT was carried out with a dSPACE DS1104 real-time control layout card. The sensors were mounted in the boost converter to help to acquire measurements. Figure 8a shows the diagram of the hardware setup, and Figure 8b shows the used hardware.
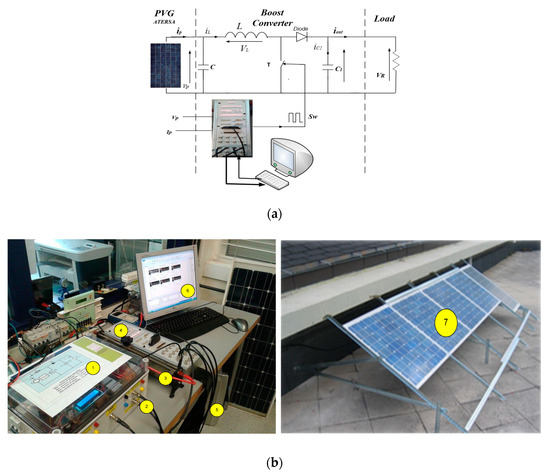
Figure 8.
The hardware setup, (a) diagram of the hardware setup, (b) the hardware setup of the system. 1: DC boost converter; 2: sensor; 3: load; 4: DSP cart; 5: calculator; 6: dSPACE graphical user interface software; 7: PV panels.
The experiment setup consisted of four ATERSA A55 modules linked in parallel, which were placed on the roof of the school; the control step was done in the lab. All the used components are shown in Figure 8b.
Figure 9 shows the maximum power point tracker control scheme, which was constructed in SIMULINK (MATLAB). All the signals that originated from the DSP analog/digital (A/D) converter needed to be be normalized. This normalization was done by multiplying the signal by a scaling gain; for the DSP, this gain was equal to 10.
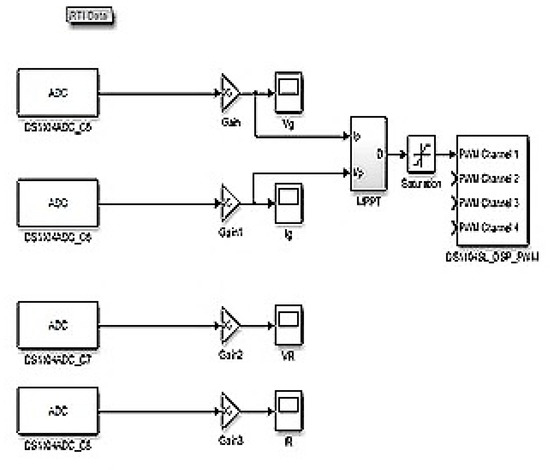
Figure 9.
SIMULINK model.
To prove the performance of the VSZ algorithm, the controllers were experimentally tested using the dSPACE data acquisition system.
To begin a new test, the block presented in Figure 9 needed to be run to create the C code. However, before beginning the MPP tracking operation, we wanted to find the operation point of the system without control. Therefore, a constant command equal to zero was sent to the DS1104SL DSP PWM, and the load value was changed from 0.1 Ω to 47.5 Ω to obtain the real I-V characteristic of the ATERSA.
The obtained ATERSA I-V and P-V characteristics are shown below in Figure 10a,b, respectively. Figure 10 shows the ATERSA I-V and P-V characteristics and the resistive load operating point with R ≈ 15.113 ohm. This load was coupled to the PV panel when the command (D) was equal to zero (null); i.e., without any controller. From the figures below, it can be clearly seen that the operating point of the load was far away from the MPP; this PV panel was characterized by an irradiation value of 370 W/m2 with a maximum power equal to 54 W, which was the MPP.
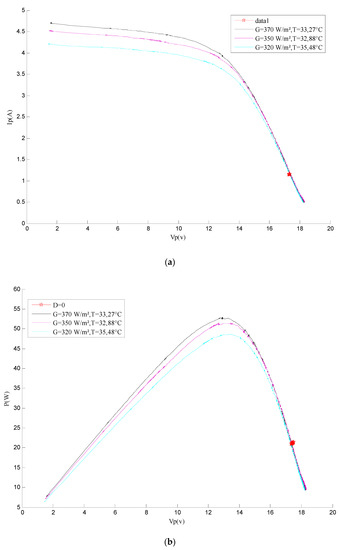
Figure 10.
ATERSA real characteristics: (a) I-V characteristic, (b) P-V characteristic.
In the next part, the acquisition of all data was done in September at 13 am in Vitoria-Gasteiz, Spain, resulting in an irradiation of around 380 W/m2 and temperature values equal to 33.2 °C. After obtaining the real characteristics, the P&O algorithm and variable step size VSZ were used to increase the system’s efficiency and ensure its good performance.
To start real-time tracking, the SIMULINK MPPT control block was downloaded again to generate the new C for the dSPACE board. It should be noted that this procedure requires some time; therefore, some differences between the obtained results could appear. In the next figures, the black curve shows the conventional P&O results, and the red curve shows the result obtained using the VSZ.
Figure 11 shows the irradiation change while recording the tracking operation for both the VSZ controller (in red) and regular P&O algorithm (in black); the figure also shows the power (P) and the duty cycle (D).
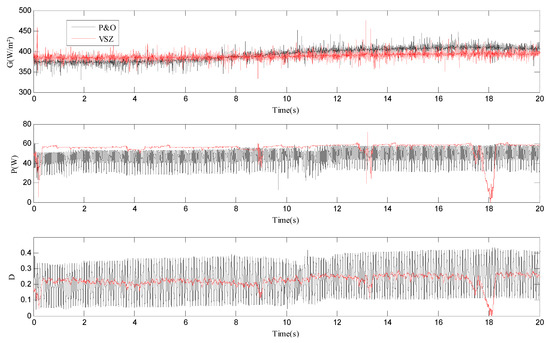
Figure 11.
Irradiation (G), PV power (P) and duty cycle (D).
Figure 12 shows the current and voltage for the PVG and for the load.
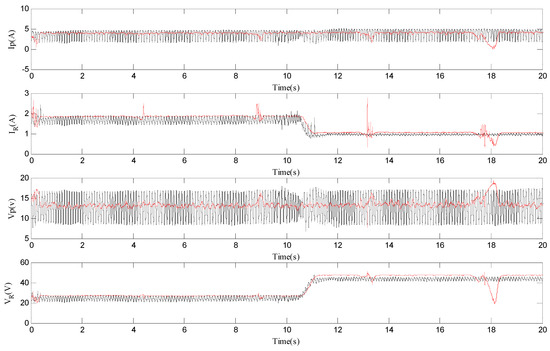
Figure 12.
PVG current (Ip) and voltage (Vp), and the load voltage (VR) and current (IR).
To prove the robustness of the VSZ controller and its ability to maintain the harvesting of the maximum of power, after 11 s, the resistive load value was manually changed. The approximate resistance values used in this experiment were 14.48 Ω and 47.5 Ω.
The voltage, current and power measurements remained constant in the face of the load variation. This disturbance was done in order to keep the system operating at the required point; i.e., the MPP. The performance proved the regulator’s robustness.
The acquired results proved that both systems using different controllers’ present robustness and good maximum power tracking; however, the VSZ controllers showed the best performance, with less oscillation and much more accurate tracking.
It should be noted that the proposed variable step size controller successfully tracked the maximum power, and this was accurate for the operating points shown by P-V and the I-V characteristics.
4. Conclusions
In this work, a full study of a photovoltaic system incorporating an MPPT controller was presented. The proposed PV system consisted of a PV generator, a DC–DC boost converter and a resistive load. In order to increase the system efficiency, a full design of a variable step size P&O controller was presented, along with the study of its stability. This method improves on the performance of the regular P&O, reducing the complexity and ensuring system efficiency. The proposed PV system was investigated and practically implemented using the control system card dSPACE 1104. This controller guarantees high dynamic system performance. Simulation and experimental results are presented to highlight the obtained performance.
The VSZ showed better results as it successfully and correctly tracked the MPP with significantly better performance than the P&O tracking controller. This novel algorithm can be easily used in industries; consequently, the economic profits gained by using the VSZ algorithm could be huge.
Om future work, this new proposed approach could be applied to the incremental conductance (INC) algorithm; moreover, the system’s robustness could also be tested in terms of other aspects that disturb the PV systems’ power generation efficiency, such as humidity, dust and fog.
Author Contributions
M.F. and O.B.; methodology, M.F. and O.B.; software, M.F.; validation, M.F. and O.B. and L.S.; formal analysis, M.F.; investigation, O.B.; resources, O.B; data curation, M.F.; writing—original draft preparation, O.B.; writing—review and editing, O.B.; visualization, O.B.; supervision, L.B; project administration, O.B.; funding acquisition, M.F. All authors have read and agreed to the published version of the manuscript.
Funding
This research received no external funding.
Acknowledgments
The authors wish to express their gratitude to the Basque Government through the project SMAR3NAK (ELKARTEK KK-2019/00051), to the Diputación Foral de Álava (DFA) through the project CONAVAUTIN 2 and to the UPV/EHU (PPGA20/06) for supporting this work.
Conflicts of Interest
The authors declare no conflict of interest.
Nomenclature
| G | Global irradiation (W/m2) | Gref | Reference irradiation (W/m2) |
| Ip | Cell current (A) | Vp | Cell voltage (v) |
| Rp | parallel resistance (Ω) | Rs | Series resistance (Ω) |
| n | Ideal factor | Eg | Band gap energy (ev) |
| Tc | Cell junction temperature (°C) | Tc_ref | Cell reference temperature (°C) |
| β | Boltzmann constant (1.38 × 10⁻²³) | D | Duty cycle |
| Ns | Number of series modules | Np | Number of parallel modules |
| ns | Number of series cells | KSCT | Short-circuit current temperature (A/°K) |
References
- Ramos, J.A.; Campayo, J.J.; Larranaga, J.; Zulueta, E.; Barambones, O.; Motrico, J.; Fernandez Gamiz, U.; Zamora, I. Two photovoltaic cell simulation models in matlab/Simulink. Int. J. Tech. Phys. Probl. Eng. 2012, 4, 45–51. [Google Scholar]
- Xu, T.; Venkatesh, B.; Opathella, C.; Singh, B.N. Artificial neural network model of photovoltaic generator for power flow analysis in PSS® SINCAL. IET Gener. Transm. Distrib. 2014, 8, 1346–1353. [Google Scholar] [CrossRef]
- Marinić-Kragić, I.; Nižetić, S.; Grubišić-Čabo, F.; Papadopoulos, A.M. Analysis of flow separation effect in the case of the free-standing photovoltaic panel exposed to various operating conditions. J. Clean. Prod. 2018, 174, 53–64. [Google Scholar] [CrossRef]
- Marcello, P. Induction machines sensors-less wind generator with integrated intelligent maximum power point tracking and electric losses minimization technique. IET Control Theory Appl. 2015, 9, 1831–1838. [Google Scholar]
- Zakzouk, N.E.; Abdelsalam, A.K.; Helal, A.A.; Williams, B.W. Modified variable-step incremental conductance maximum power point tracking technique for photovoltaic systems. In Proceedings of the IECON 2013—39th Annual Conference of the IEEE Industrial Electronics Society, Vienna, Austria, 10–13 November 2013; pp. 1741–1748. [Google Scholar]
- Dalala, Z.M.; Saadeh, O.; Bdour, M.; Zahid, Z.U. A New Maximum Power Point Tracking (MPPT) Algorithm for Thermoelectric Generators with Reduced Voltage Sensors Count Control. Energies 2018, 11, 1826. [Google Scholar] [CrossRef]
- Reisi, A.R.; Moradi, M.H.; Jamasb, S. Classification and comparison of maximum power point tracking techniques for photovoltaic system: A review. Renew. Sustain. Energy Rev. 2013, 19, 433–443. [Google Scholar] [CrossRef]
- Farhat, M.; Barambones, O.; Sbita, L. Efficiency optimization of a DSP-based standalone PV system using a stable single input fuzzy logic controller. Renew. Sustain. Energy Rev. 2015, 49, 907–920. [Google Scholar] [CrossRef]
- Jie, S.; Lee, W.J. Forecasting Power Output of Photovoltaic Systems Based on Weather Classification and Support Vector Machine. IEEE Trans. Ind. Appl. 2012, 48, 1064–1069. [Google Scholar]
- Takruri, M.; Farhat, M.; Sunil, S.; Ramos-Hernanz, J.A.; Barambones, O. Support Vector Machine for Photovoltaic System Efficiency Improvement. J. Sustain. Dev. Energy Water Environ. Syst. 2019, 8, 441–451. [Google Scholar] [CrossRef]
- Farhat, M.; Barambones, O.; Sbita, L. A new maximum power point method based on a sliding mode approach for solar energy harvesting. Appl. Energy 2017, 185, 1185–1198. [Google Scholar] [CrossRef]
- De Brito, M.A.G.; Galotto, L.; Sampaio, L.P.; Melo, G.D.A.E.; Canesin, C.A. Evaluation of the Main MT Techniques for Photovoltaic Applications. IEEE Trans. Ind. Electron. 2013, 60, 1156–1167. [Google Scholar] [CrossRef]
- Veerachary, M.; Senjyu, T.; Uezato, K. Neural-network-based maximum-power-point tracking of coupled-inductor interleaved-boost-converter-supplied pv system using fuzzy controller. IEEE Trans. Ind. Electron. 2003, 50, 749–758. [Google Scholar] [CrossRef]
- Sheik, S.; Devaraj, D.; Imthias, T. A novel hybrid Maximum Power Point Tracking Technique using Perturb & Observe algorithm and Learning Automata for solar PV system. Energy 2016, 112, 1096–1106. [Google Scholar]
- Piegari, L.; Rizzo, R.; Spina, I.; Tricoli, P. Optimized Adaptive Perturb and Observe Maximum Power Point Tracking Control for Photovoltaic Generation. Energies 2015, 8, 3418–3436. [Google Scholar] [CrossRef]
- Loukil, K.; Abbes, H.; Abid, H.; Abid, M.; Toumi, A. Design and implementation of reconfigurable MPPT fuzzy controller for photovoltaic systems. Ain Shams Eng. J. 2020, 11, 319–328. [Google Scholar] [CrossRef]
- Al-Odienat, A.I.; Al-Lawama, A.A. The Advantages of PID Fuzzy Controllers over The Conventional Types. Am. J. Appl. Sci. 2008, 5, 653–658. [Google Scholar] [CrossRef]
- Hao, L. Mode-dependent event-triggered control of networked switching Takagi–Sugeno fuzzy systems. IET Control Theory Appl. 2016, 10, 711–716. [Google Scholar]
- Tu, J.V. Advantages and Disadvantages of Using Artificial Neural Networks versus Logistic Regression for Predicting Medical Outcomes. J. Clin. Epidemiol. 1996, 49, 1225–1231. [Google Scholar] [CrossRef]
- Farhat, M.; Flah, A.; Sbita, L. Photovoltaic Maximum Power Point Tracking Based on ANN Control. Int. Rev. Model. Simul. 2014, 7, 474–480. [Google Scholar] [CrossRef]
- Mayssa, F.; Lassaad, S. ANFIS controlled solar pumping system. I-Manager’s J. Electron. Eng. 2011, 3, 1–9. [Google Scholar] [CrossRef]
- Afghoul, H.; Chikouche, D.; Krim, F.; Beddar, A. A novel implementation of MPPT sliding mode controller for PV generation systems. In Proceedings of the Eurocon 2013, Zagreb, Croatia, 1–4 July 2013. [Google Scholar]
- Fathabadi, H. Novel photovoltaic based battery charger including novel high efficiency step-up DC/DC converter and novel high accurate fast maximum power point tracking controller. Energy Convers. Manag. 2016, 110, 200–211. [Google Scholar] [CrossRef]
- Eydi, M.; Hosseini, S.H.; Ghazi, R. A New High Gain DC-DC Boost Converter with Continuous Input and Output Currents. In Proceedings of the 10th International Power Electronics, Drive Systems and Technologies Conference (PEDSTC), Shiraz, Iran, 12–14 February 2019. [Google Scholar]
- Mamur, H.; Ahiska, R. Application of a DC–DC boost converter with maximum power point tracking for low power thermoelectric generators. Energy Convers. Manag. 2015, 97, 265–272. [Google Scholar] [CrossRef]
- Padhee, S.; Pati, U.C.; Mahapatra, K. Overview of High-Step-Up DC–DC Converters for Renewable Energy Sources. J. IETE Tech. Rev. 2018, 35, 99–115. [Google Scholar] [CrossRef]
- Lin, R.; Chang, Y.; Lee, C. Optimal Design of LED Array for Single-Loop CCM Buck–Boost LED Driver. IEEE Trans. Ind. Appl. 2013, 49, 761–768. [Google Scholar] [CrossRef]
- Farhat, M.; Barambones, O.; Sbita, L. Variable Structure MPP controller for Photovoltaic Pumping System. Trans. Inst. Meas. Control 2016, 9, 1283–1292. [Google Scholar] [CrossRef]
- Lian, K.L.; Jhang, J.H.; Tian, I.S. A Maximum Power Point Tracking Method Based on Perturb-and-Observe Combined With Particle Swarm Optimization. IEEE J. Photovolt. 2014, 4, 626–633. [Google Scholar] [CrossRef]
- Femia, N.; Petrone, G.; Spagnuolo, G.; Vitelli, M. Optimization of perturb and observe maximum power point tracking method. IEEE Trans. Power Electron. 2005, 20, 963–973. [Google Scholar] [CrossRef]
- Mendez, A.; Belghith, A. A DSP for Sensing the Bladder Volume through Afferent Neural Pathways. IEEE Trans. Biomed. Circuits Syst. 2014, 8, 552–564. [Google Scholar] [CrossRef]
- Chierchie, F.; Paolini, E.E.; Stefanazzi, L.; Oliva, A.R. Simple Real-Time Digital PWM Implementation for Class-D Amplifiers with Distortion-Free Baseband. IEEE Trans. Ind. Electron. 2014, 61, 5472–5479. [Google Scholar] [CrossRef]
- Wing-Chau, N.G.; Nguyen, A.T.; Ayotte, S.; Chul Soo, P.; Rusch, L.A. Overcoming Phase Sensitivity in Real-Time Parallel DSP for Optical Coherent Communications: Optically Filtered Lasers. J. Lightwave Technol. 2014, 32, 411–420. [Google Scholar]


© 2020 by the authors. Licensee MDPI, Basel, Switzerland. This article is an open access article distributed under the terms and conditions of the Creative Commons Attribution (CC BY) license (http://creativecommons.org/licenses/by/4.0/).