Abstract
In rock mass disturbed by mining activity, distortions in the stress balance may lead to seismic energy being emitted in reactivated seismogenic structures. One way of increasing the imaging resolution of these seismically active structures is through relocation, which itself can be achieved using the cloud collapsing method. This method partially eliminates perturbations in the location of seismic energy sources concerning the actual positions of these sources. It enables events to be grouped into spatially ordered structures that may correspond to actual tectonic structures, such as fractures, fissures, or faults. We present the results of applying the collapsing method in mining seismology using a cloud of located events recorded during mining activity at one of the coalfaces in the Bobrek hard coal mine. The relocation procedure was applied to all the foci of events recorded during mining activity on face 3/503 between April 2009 and July 2010. In the relocated point cloud, two types of the linear structure responsible for generating events are automatically distinguished using the HDBSCAN algorithm: structures directly related to mining activity and structures associated with local tectonics. The location of the separated structures of the first type corresponds to the range of coalface 3/503 and the shafts delimiting earlier mined seams 507 and 509 located below. The isolated structures of the second type, with almost vertical orientation, are associated with existing zones of discontinuity that become seismically active as a result of mining activity. The identified structures lie near the biggest events recorded, which is evidence that these structures may correspond to real discontinuity zones.
1. Introduction
Underground mining of mineral resources (e.g., hard coal) or energy resources (e.g., crude oil, natural gas, or geothermal energy) leads to changes in stress distribution in mining areas. These changes can trigger dynamic phenomena in the form of seismic events of varying degrees of energy. In the case of underground hard coal mining, some surveys were conducted in many coal-mining areas and reported in the last several decades, e.g., [1,2,3,4,5,6]. The research on the registered seismic events was conducted mainly to increase the safety of underground work and minimize the adverse impact on the surface [7]. The registered events were analyzed in terms of the causes of its occurrence and its governing mechanisms. Various ways of categorization of the seismic phenomena accompanying exploitation have been proposed. Alber et al. [8] observed at least three different event types characterized by modes of failure, e.g., fault activation, remnant pillar punching, and beam failure. The other studies suggested the key importance of dynamic and static stresses on the character of induced events [9]. The more general classification is based on the observed bimodal distribution of seismic energy [10,11,12], which in general indicates two types of seismic phenomena associated with mining. The first type includes low and medium energy seismic events, which most often occur in the immediate vicinity of longwall faces or exploited chambers, usually as a result of mining activity. A characteristic feature of the mechanism behind these phenomena is the high share of non-shear components. The second type comprises medium and high energy phenomena associated with the renewal of old fractures and faults. The shear components dominate in this type of seismic phenomena. Their location is closely connected with the position of renewed seismogenic structures and may be located at a greater distance from coalfaces than the first type of phenomenon [13,14].
In many underground mines, including the Bobrek hard coal mine in southern Poland that is described in the article below, both categories of seismic events occur. Numerous seismic phenomena directly induced by the fracturing of the rock mass occur in areas of mining activity and in the case of this mine are concentrated above the mine coal seam or directly below it. The sources of the second group of phenomena recorded during the course of mining activity are located significantly (over 500 m) below the exploited coal seam. Due to the mechanism of their sources, these phenomena are mainly associated with a fault network whose existence is postulated based on tectonic and structural studies as well as on the genesis of individual geological structures. Their existence and location can only be inferred indirectly from seismic events.
For an effective study of the seismic events, the key factors are the precise location of event sources, identification of their source mechanisms, and separation of internal heterogeneities (clusters) inside the registered cloud of phenomena. The location of seismic sources using master event and double-difference relocation techniques and determination of their mechanism are currently standard techniques and are widely used in mining [15,16]. In turn, the separation of clusters in the cloud of located event sources is a difficult but necessary task to better understand the nature of dynamic phenomena. It enables the separation of spatial structures responsible for intensive seismic events and the location of zones particularly endangered by large seismic phenomena [17,18,19].
This article is a case study from the Bobrek mine, Poland. Its main goal is to determine the structures responsible for the generation of seismic events. For this purpose, it was necessary to increase the resolution of the cloud of localized seismic sources (so-called seismic cloud). The authors employed a well-known collapsing algorithm to increase the latter’s resolution to map the structures responsible for the generation of seismic phenomena [20]. The three-step processing procedure that we proposed involved collapsing a cloud of seismic sources in seam No. 503, evaluation of the time slices of this cloud, as well as automatically isolating active microtectonic structures (e.g., fissures and fractures) recognized in this cloud. As the research shows, this procedure allows phenomena to be grouped into more spatially ordered structures such as lines or planes. These may correspond to actual tectonic structures such as fractures, fissures, or faults.
First, we will discuss the geological structure in the Bytom Basin area in which the Bobrek Coal Mine is located, together with the structural and geomechanical factors that contribute to high seismic activity both in this and in neighboring areas. This part will be followed by a short description of the collapsing method applied to the seismic sources and hierarchical density-based spatial clustering of applications with noise algorithm (HDBSCAN). Due to the significant impact that seismic event location errors have on the collapsing procedure, we also addressed the problem of identifying errors in the location of events recorded during the advance of the coalface. In the next part of the article, the author presents data recorded during the mining of seam 503 as well as the results of their relocation following the application of the collapsing procedure. Based on the above, the next section identifies structures with a simple, linear geometry that are responsible for generating some of the events. These results were then set against the earlier results of seismicity studies in this area. In the discussion, we present the benefits of the analyzed method in studies of mining-induced seismicity, as well as their limitations.
2. Geological Structure and Seismicity in the Area Covered by the Study
The occurrence of mining tremors depends on many factors, including the geological and tectonic structure, the location of the coalface, and past exploitation. The interaction of these factors has a significant impact on the formation of tremors.
The Bytom Basin forms a wide trough along the W-E axis and constitutes part of the Paleozoic Variscan structure, which has been cut up by numerous faults. The Bytom Basin is an asymmetrical and relatively shallow trough with a complex structure. Its axis runs latitudinally from West to East near the north-eastern flank. As a consequence, the layers in this flank have quite steep angles of collapse, which range from 8 to 20 degrees, while in the southern flank they do not exceed 3 degrees. The complex structure of the basin is additionally disturbed by a network of faults, mainly running in NW-SE direction and perpendicular to them, the planes of which have different projections and angles of inclination. Large faults with throw values of between several meters and almost 300 m are accompanied by a network of smaller faults with throw values ranging in size from several dozen centimeters up to approximately 20 m.
The geological profile in the vicinity of the coal seam 503 is shown in Figure 1. Carboniferous formations in the studied area reach a thickness of up to 550 m and contain numerous coal seams of varying thickness, up to a maximum of 12 m. A characteristic feature of the carboniferous period is its cyclical structure expressed by the alternating occurrence of sandstone, silt, claystone, conglomerates, and coal. These rocks differ in terms of their elastic properties and compressive strength. For example, sandstone has higher strength parameters than claystone and coal. One additional factor that has a decisive impact on the geomechanical properties of rocks is tectonics in all its forms (faults, joints, cleavage, and other inhomogeneities), which significantly reduces the strength of the rock massif [21]. Geomechanical parameters: volume density, frictional angle, cohesion, Young’s modulus, Poissons’s ratio, splitting tensile strength, and tension of geological layers are presented in Table 1.
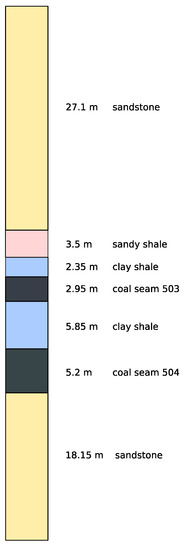
Figure 1.
Geological profile in the vicinity of the coal seam 503 (based on data from Bobrek Mine).

Table 1.
Geomechanical parameters of geological layers.
In the past, the Bytom Basin had been an area of very intensive hard coal mining. In the 1990s, production was scaled back significantly and exploitation of zinc-lead ore was brought to an end, as a result of which the rate of subsidence decreased together with the number of high-energy events. However, the Bytom Basin is still an area where mining activity continues to have a negative impact on the surface and continues to generate seismic events.
The propensity for rock bursts to occur in a rock mass depends on the geomechanical properties of the rock. It was found, for example, that an area was particularly susceptible to tremors when thick benches of strong rock, such as sandstone or mudstone, are located in the vicinity of a deposit [22]. Another influential factor is old tectonic stresses occurring in the rock, which have led to changes in geomechanical properties, increasing or decreasing their propensity for rock bursts.
In the Upper Silesian Coal Basin, events caused by coal mining activity are concentrated in several areas, one of which is the Bytom Basin. The susceptibility of a rock mass to rock bursts is explained in different ways.
Studies have revealed a close relationship between mining activity and low energy events, while more powerful events are associated with the tectonics of the Upper Silesian Coal Basin. The widespread occurrence of rock bursts in the Bytom Basin was initially explained as being the result of increased stresses in the syncline folds. However, it seems that the higher risk of rock bursts in these basins is due to the compaction of rocks, whereas in the past all three principal tectonic stresses were compressive in character [22].
Stec [12,23] proposed a general classification of the seismic events in this area, which involved dividing them into three groups. The first group consists of events with a slipping and shearing foci mechanism. Events of this type occur during progressive mining as a result of fractures in the seam of thick and compact rock complexes with high rigidity and strength parameters. The second group consists of events characterized by foci with a non-shearing mechanism. Such events are located directly in the coal seam and in the vicinity of active coalfaces. The third group comprises "regional" events, characterized by the highest energy, which usually occur far from areas of active mining activity. Their foci have a slip mechanism that is normal or reversible in character. The most common cause of these events is the interaction of tectonic and residual stresses existing in the analyzed area with mining-induced stresses.
The exploitation area of the Bobrek mine encompasses the region of the Bytom Basin (Figure 2), one of the three areas where the majority of mining events were recorded, including high energy events with local magnitudes of up to 4.0. During the mining of face 3 in seam No. 503 (3/503), the first events were observed in April 2009. The area remained seismically active until 8 July 2010. Most of the recorded events were low energy tremors. However, four higher local magnitude events were also registered: 2.9 (20 May 2009), 3.7 (16 December 2009), 3.0 (5 February 2010), and 2.8 (11 March 2010).
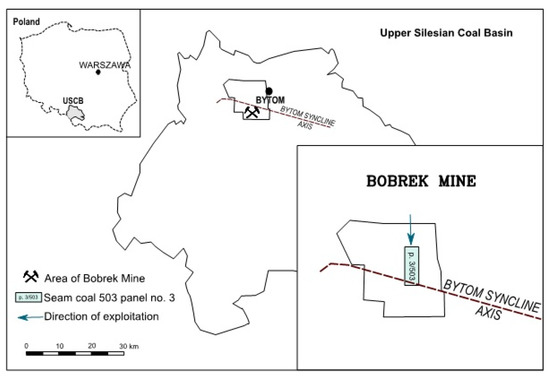
Figure 2.
Location of the Bobrek mine area against the background of the Upper Silesian Coal Basin.
Marcak and Mutke [24] analyzed events recorded by mining seismological stations during mining of coalface 3/503. These authors concluded that tectonic stresses were of key importance in the distribution of seismic events. It was also observed that higher energy events began to occur as the coalface reached the axis of the Bytom Basin. The hypocentres of high energy events were located at a depth of 300 m to 800 m below the mined seam. At the same time, it was noted that once they had passed through the Bytom Basin, the energy produced by these events weakened and the depth of their hypocentres also decreased. The latter still occurred below the mined seam, but at a depth of less than 200 m. Furthermore, the authors showed that high-energy events occurring in the vicinity of the Bytom Basin had a different character to the phenomena typical of the Upper Silesian Coal Basin. The mechanism of these phenomena is associated with slipping in reverse faults, and the nature of the phenomena indicates a relationship between them and tectonics. These results were partially confirmed in the work of Kozłowska et al. [25]. In this article, the authors analyzed a 3.7 local magnitude event that occurred on 16 December 2009, during the course of mining coalface 3/503. The event mechanism indicates a reverse fault with an almost vertical plane. Numerical models that took into account current and past mining activity indicate that the phenomenon is associated with tectonics. However, mining activity affected a change in the stresses present in the local tectonics, which in turn triggered a fault process or the formation of a new fault on the weakening plane.
3. The Processing Method
To precociously identify seismically active microtectonic structures, the authors proposed applying the collapsing method [20,26,27] followed by automatic detection of clusters in the cloud of collapsed sources using the HDBSCAN method [28]. This two-step procedure is used to help identify the microtectonic structures responsible for the emission of some of the tremors accompanying the stimulation and exploitation of hydrothermal reservoirs and hydrocarbon deposits. The flowchart describing the processing steps is presented in Figure 3.
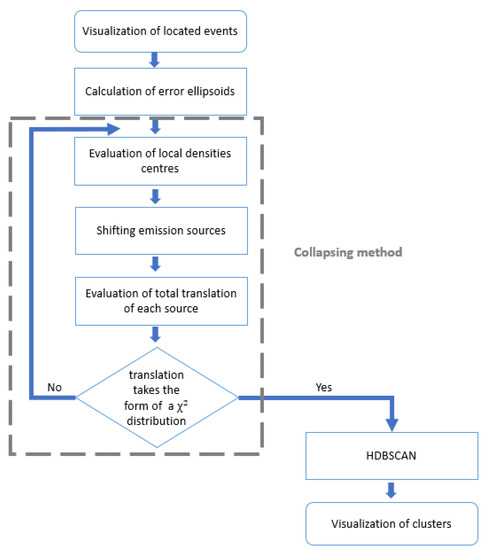
Figure 3.
The flowchart of the processing steps. Details of each step are described in the text.
The location of emission sources involves some level of error, mainly due to the simplified velocity structure of the propagation medium and seismic event picking errors. This causes perturbation of localized sources in relation to the actual positions of these sources and blurs the undisturbed image of the seismic cloud. The purpose of collapsing is to limit at least partially such blurring and reduce perturbation. So, the collapsing is not used for the location of the events’ sources. It is recommended as a step implemented after the source location step regardless of the method (single event location, JHD, double difference, and others [29]). It is not used to locate events but to decrease the seismic cloud dispersion and recognize its internal structures [30].
The key to implementing the collapsing procedure is determining the ellipsoid error for seismic events according to the used location method. Assuming that the errors are random with normal distribution and that the measurement is not burdened with a permanent error caused by, for example, defective measuring equipment or significant differences in conditions around the ellipsoid sensors, one can find the error ellipsoids of the located source for a particular significance level , e.g., 99.5%.
The collapsing procedure gradually shifts events towards local sources’ densities. What is important to note is that the relocation of each event takes place within its error ellipsoid, in relation to which the source’s location was established. Shifted hypocentres create a new set of locations. The entire relocation procedure is repeated in the same way for each subsequent iterative step until the translation population assumes the form of a chi-square distribution with three degrees of freedom [20]. The relocation of sources takes place within the boundaries of the error ellipsoid, and thus the new distribution of the sources (following the collapsing process) may reflect the actual spatial distribution of the foci of events undisturbed by the location error. This distribution is usually characterized by greater regularity and less spatial dispersion [20]. There are several variations of the original collapsing method. Asanuma et al. proposed a modification of the first version of the collapsing method, where the structure of the cloud depends on the distribution of locations within confidence ellipsoid [31]. Additionally, in the modified collapsing procedure, location movements depend on the dimensionality on the estimated original structures. In other publications, Asanuma et al. presented [30,32] another modification of the collapsing method that uses mutual coherency of waveforms and establishes the similarity of events. Here in the paper, we use the original collapsing method.
The HDBSCAN algorithm that is used in the next turn recognizes the clusters, i.e., parts of the seismic cloud with abnormally high densities of the collapsed sources. This algorithm identifies the so-called cluster cores as those seismic sources in the vicinity of which (i.e., closer than the pre-set limit value ε—radius of the neighbourhood) a sufficient (greater than or equal to the pre-set limit value) number of adjacent sources are located. To the cluster cores defined in this way are attached new sources that are closer than the pre-set value from any of the core sources. Sources not qualified for any cluster are referred to as noise.
The method of source clustering described in this way fails when naturally visible clusters have different densities because grouping is performed using the defined limit radius value ε. To avoid this, a number of radius values ε are used in the HDBSCAN algorithm, and the clusters identified by this method are looked at among stable clusters. An additional parameter used in the HDBSCAN algorithm allows to identify as relevant only clusters containing the number of points greater than the set parameter value. This allows to reject unimportant clusters with small numbers. In the last step of the procedure, from among the clusters separated in this way we choose only those characterized by linear geometry. They will depict active, linear tectonic structures, usually of natural origin. Other clusters with a more complex geometry will correspond to source clusters in zones with complex tectonics disturbed by mining activities.
4. Data
Data on the location of events and the progress of mining work in the Bobrek mine used in the article were published on the IS-EPOS platform [33]. A total of 2995 events were recorded and located in the period between April 2009 and July 2010. They were registered as a result of the exploitation of coalface 3/503. The hypocenters of these events occurred at various depths, ranging from 300 m below ground level to more than 2300 m below ground level. The local magnitude of these events ranged between 0 and 3.7. The most powerful event had a local magnitude = 3.7 that occurred on 16 December 2009. This mining-induced tectonic event was associated with the local tectonic structure of the Bytom Syncline [25].
The Bobrek mine seismic network consists of 27 geophones with a recording band above 1 Hz. It is composed of 21 uniaxial and 6 triaxial geophones, all with a sampling frequency of 500 Hz. Most are located at the level of the exploited seam (approximately 750 m below the surface), two at sea level, and one at surface level. During the analyzed period, individual geophones were serviced and repaired. As a consequence, only those geophones that were operational on the day a particular event occurred were included in the location.
The locations were determined using the classical method for locating event sources based on uniaxial (vertical) sensors and triaxial sensors according to the registration times of the first seismic signal. An approximate model of medium velocity in the area of seam 503 was adopted, for which the velocity of longitudinal wave propagation (used for localization) was 3850 m/s. The location of geophones, along with the location of the sources of all registered seismic events, is presented in Figure 4. Coordinates in this figure and the following figures are in the local coordinate system “Sucha Gora” used in the Polish Coal Mines.
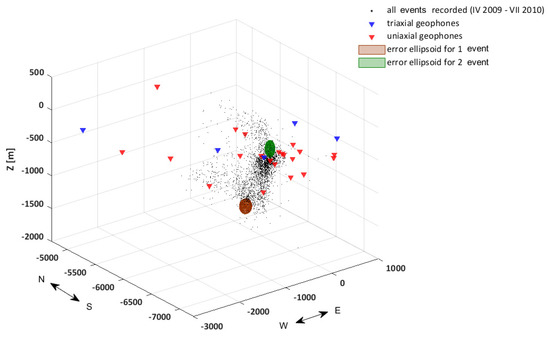
Figure 4.
The seismic network of the Bobrek mine with events registered between April 2009 and July 2010. Uniaxial geophones are marked with red triangles and triaxial geophones with blue triangles.
Figure 5 features a histogram showing the seismic activity for each month. This histogram indicates that seismic activity changed during the period in which the mine was in operation. From December 2009 to May 2010, the number of events increased significantly, especially when compared to the months preceding this increase. This coincided with the moment when the active coalface crossed the Bytom basin axis. Additionally, the number of seismic events whose sources were located below and above seam No. 503 were indicated. Face 3 of this seam lies at a depth of approximately 700 m below the surface and, as such, the majority of the events were generated below this depth and only a small (roughly 10%) number occurred above. The number of events below the seam was calculated by taking into account the depth of the coalface at the end of each period. Most of the events occurred below seam 503. During this period, a small number of events were also recorded in the seam roof.
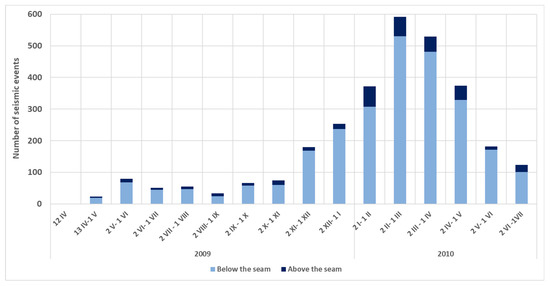
Figure 5.
The number of events for each month between April 2009 and July 2010.
As has already been noted [24], the highest energy events took place 300–800 m below the mining level and were located at a short distance from the axis of the Bytom Basin.
The distribution of the event cloud is shown in monthly time intervals together with the current position of the active coalface in Figure 6A–O. The coalface progressed at an average rate of 50 m from month to month. In each sketch, the blue line indicates the position of the coalface at the beginning of the selected time interval, and the red line the position at the end. Additionally, in Figure 6A,O, the green rectangle shows the whole area of mining work. The mining works proceeded from north to south perpendicular to the axis of the Bytom basin. The axis of the Bytom basin was crossed in April 2010, 2 months before mining of the seam came to an end.
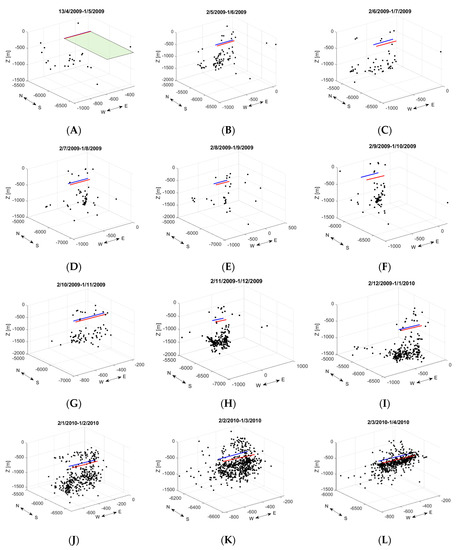
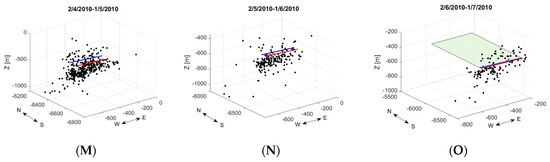
Figure 6.
(A–O) Location of the point cloud in monthly intervals along with the current position of the coalface at the beginning and end of the interval. The green rectangle shows the whole area of mining work.
It can easily be seen that in the early months of mining activity, seismic events were relatively low and occurred mainly between 500 and 1000 m below the seam. In the next 6 months of mining at the seam, the events were similar to one another in terms of both intensity and the average depth of the source location. Starting from September 2009, there was a significant increase in event intensity as well as a gradual decrease in the location depth of the sources. In the last 2 months of mining activity (Figure 6N,O), events occurred relatively close to the seam, where coal was being mined.
5. Results
After visualization, the second step of the processing procedure was an evaluation of the error ellipsoids for localized sources [34]. The orientation of the error ellipsoid is determined by the spatial configuration of the sensors in relation to the source location. The size of the ellipsoid is established by the partial errors in the measured parameters. To determine the error ellipsoid, it was assumed that the error in the time of the P wave was, depending on the signal quality, 4 ms. However, greater accuracy was achieved with good quality signals, dropping to as low as 2 ms. The sensor location error parameter was estimated at 0.1 m. In addition to the two types of error mentioned above, the magnitude of the location error is also affected by the simplified velocity model for the center of seismic wave propagation, both in terms of the inaccuracy of the geometric structure and the variable speed values. Sample error ellipsoids for the location of the foci of two events occurring at different depths at the adopted significance level are shown in Figure 4.
All the foci of seismic events recorded during the analyzed period underwent relocation procedure to decrease the dispersion of the cloud.
First, the location of the events after the final fourth iteration is shown in Figure 7. The compatibility of the theoretical and empirical distributions was checked in each iteration using the Kolmogorov–Smirnov test. In the final 4th iteration, the difference between distributions was so small, that the result of the compliance of the empirical distribution with the theoretical distribution test was positive.
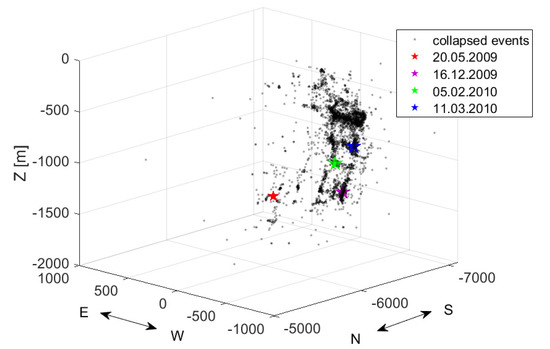
Figure 7.
Seismic cloud after collapsing procedure. The figure shows also the location of the foci of the four largest events recorded during mining of the seam.
The event cloud following relocation set against the background of both seam 503 and two deeper, previously mined seams 507 and 509 are shown in Figure 8. Following the collapse of the sources, most phenomena were concentrated below the seam where mining activity was taking place (blue line) in the vicinity of the previously mined seams (lines green and orange). A specific image is likewise formed by the foci of numerous events grouped in narrow zones with a vertical or almost vertical course. They occur near the axis of the Bytom basin, the course of which is marked with red arrows. A relatively small number of events occurred above seam 503. One important trend to note is the sharp drop in the number of events that occurred once the basin axis was crossed, first above the seam, and then below it.
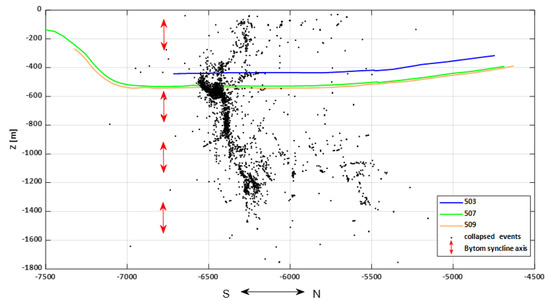
Figure 8.
Vertical cross-section of seam 503 and previously mined seams 507 and 509 located below along with the location of event sources after relocation as well as the axis of the Bytom basin.
Generally speaking, following relocation, the cloud representing the foci of events is more heterogeneous, as is manifested in the occurrence of local densities of various shapes. Most often they assume a shape similar to straight lines and planes with different orientations.
Based on the results presented above, an attempt was made to identify clusters using a cloud of seismic events displaced by means of the collapsing method in the data set taken from the entire period of mining activity (Figure 9A,B). The clusters were identified automatically using the HDBSCAN algorithm. In Figure 9A, a light blue color indicates events that were considered as noise— they were not classified in any of the clusters. The other colors represent separate clusters. The goal was to identify distinct groups arranged along straight lines or on planes.
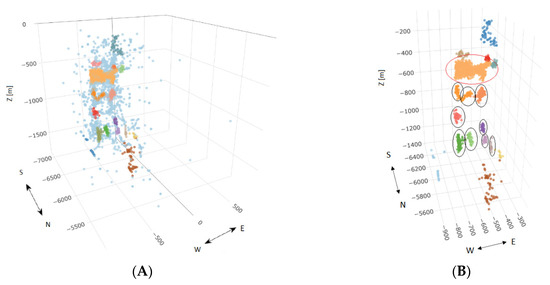
Figure 9.
(A) Automatic cluster detection using HDBSCAN; (B) Clusters that may correspond to tectonic structures (marked with a black ellipse) and directly related to mining activity (marked with a red ellipse).
6. Interpretation
The clusters identified in the seismic cloud by the HDBSCAN method allow the easier interpretation of the possible structures emerged in the mining area. Based on the identified clusters, the linear and planar structures were chosen (Figure 9B). The separated structures are associated with areas characterized by a rectilinear course with an above-average density of events. They are associated with real places of intensive seismic event that run along fracture zones with weakened rock mass. In Figure 9B, clusters marked with a black ellipse with an almost vertical course can be interpreted as local tectonic discontinuities that have been activated as a result of mining activity. Their occurrence was previously postulated by Marcak and Mutke [24] and was associated with the occurrence of flexures (monoclinal fold) in the Bytom basin. In basins of this type, we can expect the occurrence of fracture systems of varying scale with an almost vertical course and thus perpendicular to the axis of the basin and the selected seam [35]. The structures shown in Figure 9 are characterized by a depth of occurrence of between 500 m and 1400 m ppm, i.e., they are located below the two exhausted seams. The results in Figure 9 for the first time allow to directly identify and locate the position of main tectonic structures responsible for an intensive seismic event. It makes the presented findings significant and new. The previously published results only postulated the existence of such structures but because of the significant dispersion of seismic cloud (irrespectively of the method used for source location), it was difficult to identify them.
The cluster marked with a red ellipse with a more or less horizontal direction runs parallel to the active coalface and progress in tandem with its progress. Significantly, they occur deeper than exploited seam 503, namely in the immediate vicinity of exhausted seams 507 and 509. Figure 10 presents, against the backdrop of seams 503, 507, and 509, the location of the collapsed cloud and the range of exploited face 3/503 as well as the location of the shafts delimiting the exploited faces of seams 507 and 509.
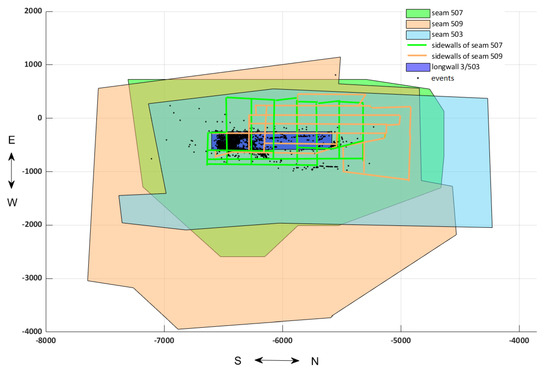
Figure 10.
Flat projection of the boundaries of seams 503, 507, and 509; the range of exploited face 3/503; and the location of the shafts delimiting the exploited faces in seams 507 and 509. The black points show the location of the cloud of phenomena following the collapse.
The criterion for selecting these clusters from among the automatic detection clusters was the number of points in the cluster and if they are arranged along straight lines or on planes.
The shafts of exploited seams (lines marked in green and orange) roughly demarcate the zones located below exploited seam 3/503, where the continuity of the rock mass was disturbed as a result of mining activity prior to the exploitation of seam 503. These disturbed zones were the site of an intensive seismic event faithfully depicted by the spatial distribution of seismic event sources (Figure 10). The horizontal structure marked with a red ellipse in the cloud of phenomena in Figure 8 has similar positions and spatial orientations to the shafts of earlier exploited seams 507 and 509. Such compliance is very good for structures closer to seam 509. The reduction of cloud dispersion allowed in this case to directly link the linear seismogenic structures with the mining shafts of old, deeper coal exploitation.
As has already been noted in the case of mining-induced events, two types of seismic events are generally distinguished—mining-induced events and events of mining-tectonic origin [12]. Mining and tectonic seismicity are caused by the interaction between, on the one hand, mining activity, both current and in the past, and, on the other, locally existing seismogenic zones such as faults as well as areas affected by mining activity. Mining seismicity is associated with events located near active mining excavations. The vertical structures isolated from the event cloud were linked above with relatively large fracture zones, which in turn are connected with the flexure of the Bytom basin. These structures include three of the four events with energy greater than 107 J registered during mining of face 3/503 (Figure 7).
These events are located at relatively great depths, which indicates that they are of mining-tectonic origin rather than being induced by mining activity alone. They form part of the linear structures in the event cloud isolated in Figure 9, which are located below the shafts surrounding the faces of seams that have been mined. In this, one can directly map the tectonic structure responsible for the generation of the strong events as well as lower energy events generated by such structure.
The above observations suggest that vertical or nearly vertical linear structures identified after collapsing the cloud of phenomena correspond to actual zones of rock mass discontinuity activated during mining. The event recorded during the mining of face 3/503 activated these faults, leading to a series of numerous events with energy emitted over a wide range. In turn, horizontal linear structures located near the exploited seams correspond to the rock mass zones directly affected by the mining of hard coal deposits in the region of the Bytom basin axis. Deeper horizontal structures, which have also been activated by mining and, like vertical structures, occur near the basin axis, may be associated with discontinuities and stress distribution in the synclinal region, as is mentioned by Marcak and Mutke [24].
7. Conclusions
The presented case study from a deep coal mine shows that the applied collapsing method allows to increase the precision of identification of the structures associated with seismic zones in the cloud of seismic event sources. According to the authors of this method, the source cloud after relocation corresponds, in statistical terms, to the original cloud before relocation, in the sense that it provides a picture of the spatial distribution of sources acceptable within the framework of location error. Both distributions clearly differ in their degree of heterogeneity. After the collapse, this heterogeneity increases significantly and, as a rule, there is a clear tendency towards a concentration within the cloud. These clusters are identified with seismically active zones such as systems of fractures and fissures, faults, and areas affected, e.g., by mining activity. Because seismogenic zones are often associated with areas of high-stress concentration, collapsing makes it possible to verify certain hypotheses regarding the distribution of tectonic stress in a deformed rock mass.
Precise imaging of structures in a blurred seismic cloud is difficult and subjective. The collapsing operation makes it possible to reduce the degree of subjectivity when identifying structures and as a consequence increase the reliability of the method itself. The presented example from the Bobrek coal mine fully acknowledges the existence and location of such structures.
The more numerous the set of registered phenomena and the greater the seismic activity, the more effective the collapsing method is. In the case of seismic events registered in underground mines, the main triggering factor is the mining of the deposits. The site where these deposits are mined gradually moves in accordance with the established mining plan. The method used in this article makes a positive result possible if the zones of each seismogenic zone are imaged via at least several dozen phenomena.
The results presented in this article helps to understand why it is necessary to increase the precision when mapping seismogenic zones in a rock mass. On the collapsed cloud, clusters were automatically detected using the HDBSCAN algorithm. As the example presented in this article shows, these mapped zones can be connected with stress concentration sites as well as discontinuities and damaged zones. Compared with other geophysical methods for mapping discontinuities and monitoring dynamic changes in underground mines, seismology supported by appropriately selected processing methods (as shown above) ensures the widest range and increased resolution.
The results presented here will be of great interest to all involved in mining. Understanding the tectonic structures responsible for generating seismic shocks in mines should be crucial because it can help predict future events induced by mining activity and tectonics. They obstruct the coal exploitation process and influence the price of the excavated coal and finally the cost of the produced energy. The presented findings are significant for the safe and efficient extraction of coal in underground mines.
Author Contributions
Conceptualization, A.L. and E.Ś.; Methodology, A.L.; Software, A.L. and E.Ś.; Validation, A.L., E.Ś. and K.M.; Formal Analysis, A.L. and E.Ś.; Investigation, A.L. and E.Ś.; Resources, K.M.; Data Curation, E.Ś.; Writing—Original Draft Preparation, A.L., E.Ś. and K.M.; Writing—Review & Editing, A.L. and E.Ś.; Visualization, A.L. and E.Ś.; Supervision, A.L.; Project Administration, E.Ś.; Funding Acquisition, A.L. All authors have read and agreed to the published version of the manuscript.
Funding
This research received no external funding.
Acknowledgments
Authors thanks to authorities and geology service of Bobrek-Centrum coal mine for the geological and mining data as well as for help during the preparation of the presented article.
Conflicts of Interest
The authors declare no conflict of interest.
References
- Kusznir, N.J.; Ashwin, D.P.; Bradley, A.G. Mining induced seismicity in the North Staffordshire coalfield, England. Int. J. Rock Mech. Min. Sci. Geomech. Abstr. 1980, 17, 45–55. [Google Scholar] [CrossRef]
- Chouhan, R.K.S. Induced seismicity of Indian coal mines. Phys. Earth Planet. Int. 1986, 44, 82–86. [Google Scholar] [CrossRef]
- Bischoff, M.; Cete, A.; Fritschen, R.; Meier, T. Coal Mining Induced Seismicity in the Ruhr Area, Germany. Pure Appl. Geophys. 2010, 167, 63–75. [Google Scholar] [CrossRef]
- Li, T.; Cai, M.F.; Cai, M. A review of mining-induced seismicity in China. Int. J. Rock Mech. Min. Sci. 2007, 44, 1149–1171. [Google Scholar] [CrossRef]
- Lasocki, S.; Idziak, A. Dominant Directions of Epicenter Distribution of Regional Mining-induced Seismicity Series in Upper Silesian Coal Basin in Poland. In Seismicity Caused by Mines, Fluid Injections, Reservoirs, and Oil Extraction. Pageoph Topical Volumes; Talebi, S., Ed.; Birkhäuser: Basel, Switzerland, 1999. [Google Scholar] [CrossRef]
- Holub, K. A study of mining-induced seismicity in Czech mines with longwall coal exploitation. J. Min. Sci. 2007, 43, 32–39. [Google Scholar] [CrossRef]
- Abdul-Wahed, M.K.; AlHeib, M.; Senfaute, G. Mining-induced seismicity: Seismic measurement using multiplet approach and numerical modeling. Int. J. Coal Geol. 2006, 66, 137–146. [Google Scholar] [CrossRef]
- Alber, M.; Fritschen, R.; Bischoff, M.; Meier, T. Rock mechanical investigations of seismic events in a deep longwall coal mine. Int. J. Rock Mech. Min. Sci. 2009, 46, 408–420. [Google Scholar] [CrossRef]
- Dou, L.; Mu, Z.; Li, Z.; Cao, A.; Gong, S. Research progress of monitoring, forecasting, and prevention of rockburst in underground coal mining in China. Int. J. Coal Sci. 2014, 1, 278–288. [Google Scholar] [CrossRef]
- Gibowicz, J.S.; Kijko, A. An Introduction to Mining Seismology; Academic Press: San Diego, CA, USA, 1994. [Google Scholar]
- McGarr, A. Energy budgets of mining-induced earthquakes and their interactions with nearby stopes. Int. J. Rock Mech. Min. 2000, 37, 437–443. [Google Scholar] [CrossRef]
- Stec, K. Characteristics of seismic activity of the Upper Silesian Coal Basin in Poland. Geophys. J. Int. 2007, 168, 757–768. [Google Scholar] [CrossRef]
- Kijko, A.; Drzęźla, B.; Stankiewicz, T. Bimodal character of the distribution of extreme seismic events in Polish mines. Acta Geophys. Pol. 1987, 35, 157–166. [Google Scholar]
- Mendecki, A.J.; Lynch, R.A.; Malovichko, D.A. Routine Micro-Seismic Monitoring in Mines. In Proceedings of the Australian Earthquake Engineering Society 2010 Conference, Perth, Australia, 26–28 November 2010. [Google Scholar]
- Schulte-Theis, H.; Joswig, M. Clustering and location of mining induced seismicity in the Ruhr Basin by automated master event comparison based on Dynamic Waveform Matching (DWM). Comput. Geosci. 1993, 19, 233–241. [Google Scholar] [CrossRef]
- Boltz, M.S.; Pankow, K.L.; McCarter, M.K. Fine Details of Mining-Induced Seismicity at the Trail Mountain Coal Mine Using Modified Hypocentral Relocation Techniques. Seismol. Soc. 2014, 104, 193–203. [Google Scholar] [CrossRef]
- Kijko, A.; Funk, C.W. Space-time interaction amongst clusters of mining induced seismicity. Pure Appl. Geophys. 1996, 147, 277–288. [Google Scholar] [CrossRef]
- Leśniak, A.; Isakow, Z. Space–time clustering of seismic events and hazard assessment in the Zabrze-Bielszowice coal mine, Poland. Int. J. Rock Mech. Min. Sci. 2009, 46, 918–928. [Google Scholar] [CrossRef]
- Estay, R.A.; Vallejos, J.A. Space or space—Time clustering? A selection criterion methodology using mining induced seismicity data. In Proceedings of the 9th International Symposium on Rockburts and Seismicity in Mines, Santiago, Chile, 15–17 November 2017. [Google Scholar]
- Jones, R.H.; Stewart, R.C. A method for determining significant structures in a cloud of earthquakes. J. Geophys. Res. Solid Earth 1997, 102, 8245–8254. [Google Scholar] [CrossRef]
- Bukowska, M. Laboratory studies of the mechanical properties of coal seam 503 and surrounding rocks in the “Bobrek-Center” mine. In Characteristics of Stress-Deformation State in Seismic Hazard Based on the Parameters of Seismic Events; Stec, K., Ed.; Central Mining Institute: Katowice, Poland, 2013; pp. 19–37. (In Polish) [Google Scholar]
- Goszcz, A. Elementy Mechaniki Skał oraz Tąpania w Polskich Kopalniach Węgla i Miedzi; Wydawnictwo Instytutu Gospodarki Surowcami Mineralnymi i Energią PAN: Kraków, Poland, 1999. [Google Scholar]
- Stec, K. Characteristics of the processes taking place at the sources of high energy events occurring in the Upper Silesian Coal Basin in Poland—Regional character. In Proceedings of the 7th International Symposium on Rockbursts and Seismcity in Mines, Dalian, China, 21–23 August 2009; Tang, C., Ed.; Rinton Press: New York, NY, USA; New Jersey, NJ, USA, 2009; pp. 415–426. [Google Scholar]
- Marcak, H.; Mutke, G. Seismic activation of tectonic stresses by mining. J. Seismol. 2013, 17, 1139–1148. [Google Scholar] [CrossRef]
- Kozłowska, M.; Orlecka-Sikora, B.; Rudziński, Ł.; Cielesta, S.; Mutke, G. Atypical evolution of seismicity patterns resulting from the coupled natural, human-induced and coseismic stresses in a longwall coal mining environment. Int. J. Rock Mech. Min. 2016, 86, 5–15. [Google Scholar] [CrossRef]
- Fehler, M.; House, L.; Scott Phillips, W. Identifying Structures in Clouds of Induced Microseismic Events. In SEG Technical Program Expanded Abstracts 1997; Society of Exploration Geophysicists: Dallas, TX, USA, 1997. [Google Scholar] [CrossRef]
- Phillips, W.S.; House, L.S.; Fehler, M.C. Detailed joint structure in a geothermal reservoir from studies of induced microearthquake clusters. J. Geophys. Res. Solid Earth 1997, 102, 11745–11763. [Google Scholar] [CrossRef]
- Campello, R.J.G.B.; Moulavi, D.; Sander, J. Density-Based Clustering Based on Hierarchical Density Estimates. In Advances in Knowledge Discovery and Data Mining. PAKDD 2013; Pei, J., Tseng, V.S., Cao, L., Motoda, H., Xu, G., Eds.; Lecture Notes in Computer, Science; Springer: Berlin/Heidelberg, Germany, 2013; Volume 7819. [Google Scholar]
- Rudziński, L.; Dȩbski, W. Extending the double difference location technique-improving hypocenter depth determination. J. Seismol. 2013, 17, 83–94. [Google Scholar] [CrossRef]
- Asanuma, H.; Kumano, Y.; Izumi, T.; Soma, N.; Niitsuma, H.; Baria, R. Monitoring of Reservoir Behavior at Soultz HDR Field by Super-Resolution Microseismic Mapping. In Proceedings of the World Geothermal Congress 2005, Antalya, Turkey, 24–29 April 2005. [Google Scholar]
- Asanuma, H.; Ishimoto, M.; Jones, R.H.; Phillips, W.S.; Niitsuma, H. A Variation of the Collapsing Method to Delineate Structures Inside a Microseismic Cloud. Seismol. Soc. Am. Bull. 2001, 91, 154–160. [Google Scholar] [CrossRef]
- Asanuma, H.; Kumano, Y.; Niitsuma, H.; Wyborn, D.; Schanz, U.; Haring, M. Current Status of Microseismic Monitoring Techniques for the Stimulation of HDR/HFR Reservoirs. In Proceedings of the 2008 Australian Geothermal Energy Conference, Melbourne, Australia, 19–22 August 2008; pp. 29–36. [Google Scholar]
- IS EPOS. Episode: BOBREK. 2017. Available online: https://tcs.ah-epos.eu/#episode:BOBREK (accessed on 10 January 2020). [CrossRef]
- Havskov, J.; Ottemoller, L. Routine Data Processing in Earthquake Seismology: With Sample Data, Exercises and Software; Springer: Dordrecht, The Netherlands; Heidelberg, Germany; London, UK; New York, NY, USA, 2010. [Google Scholar]
- Li, Y.; Hou, G.; Hari, K.R.; Neng, Y.; Lei, G.; Tang, Y.; Zhou, L.; Sun, S.; Zheng, C. The model of fracture development in the faulted folds: The role of folding and faulting. Mar. Petrol. Geol. 2018, 89, 243–251. [Google Scholar] [CrossRef]


© 2020 by the authors. Licensee MDPI, Basel, Switzerland. This article is an open access article distributed under the terms and conditions of the Creative Commons Attribution (CC BY) license (http://creativecommons.org/licenses/by/4.0/).