Abstract
A Kalina cycle-based integration concept of municipal air-conditioning, electricity and gas is investigated thermodynamically, economically, and environmentally to reduce the carbon intensity of these supplies, with attention to hot climatic conditions. The proposed poly-generation system is driven by low-grade renewable or surplus heat, and utilizes waste exergy from liquefied natural gas vaporization for refrigeration and power augmentation. At nominal conditions (130 °C driving heat), approximately 561 and 151 kJ of refrigeration and useful power per kg of liquefied natural gas regasified are generated by the proposed system, respectively, at effective first-law and exergetic efficiencies of 33% and 35%, respectively. The Kalina sub-system condenser cryogenic heat rejection condition is found to triple the system useful electrical output compared with high ambient temperature condenser heat sinking conditions. Per million ton per annum of liquefied natural gas vaporization capacity, yearly net power savings of approximately 74 GWhe could be achieved compared to standard air-conditioning, electricity, and gas supply systems, resulting in 11.1 kton of natural gas saved and 30.4 kton of carbon dioxide-equivalent emissions avoided annually. The yearly net monetary savings would range from 0.9 to 4.7 million USD per million ton per annum of liquefied natural gas regasified at local subsidized and international electricity market prices, respectively, with corresponding payback periods of 1.7 and 2.5 years, respectively.
1. Introduction
The growth in energy demand driven by developing economies, combined with energy security concerns and climate change, have prompted the exploitation of more sustainable energy resources, particularly renewable and excess resources. Buildings are currently responsible for over a third of final global energy use and 20% of energy-related greenhouse gas (GHG) emissions [1]. Buildings’ share of global energy use will increase by mid-century, and the demand for cooling in buildings has been predicted to overtake that for heating by the end of the century [2]. The deployment of district cooling (DC) systems in high-cooling density urban areas, and use of waste heat/cold and halocarbon-free refrigerants are among the key recommended mitigation approaches to reduce the environmental impact of building air-conditioning [1,3]. In hot and densely populated regions, DC systems can offer significant advantages over individual cooling systems, including higher efficiency, flexible capacity, lower energy-, maintenance- and construction costs, higher reliability, and space savings at the end-user site [4]. Although the sustainability enhancement of DC systems relies in large part on the use of low-carbon energy sources [5], renewable heat is still marginally exploited in such systems globally [6]. Furthermore, natural cold (e.g., deep water), used in certain DC systems [7], is not available in hot climate regions.
The thermodynamic performance and economic viability of low-grade heat-driven systems is generally constrained by the limited temperature difference between the heat source and environmental sink, particularly in hot climate regions. To address the lack of natural cold sources/sinks in such regions, the exploitation of artificial cold, such as cryogenic waste exergy released during the regasification of liquefied natural gas (LNG), is a potential option for DC [5]. LNG waste cold utilization has been extensively investigated to enhance the efficiency of thermal power cycles, mainly consisting of organic Rankine and Brayton cycles driven by low and medium-grade heat, respectively [8,9,10]. Substantially less efforts have been invested in LNG cold exergy utilization for cooling provision in municipal air-conditioning and refrigeration systems, or for the enhancement of Kalina cycle (KC)-based energy conversion systems. Such systems can offer improved thermal matching with sensible heat sources and sinks (such as vaporized LNG) and operational flexibility, compared with cycles using pure working fluids, and consequently lower irreversibilities, and avoid the use of ozone-depleting or global warming working fluids [11]. KC configurations particularly adapted to low-grade heat utilization include Kalina cycle system (KCS) 34 for combined power and municipal heat applications [12] and other KC variants [13]. Low-grade heat driven KC-based combined absorption power-cooling (APC) cycles, without integration with LNG regasification, have also been proposed [14].
With regard to LNG cold utilization for municipal cooling, the extraction of excess cold from LNG receiving terminals was proposed in [15] to reduce the primary energy consumption of future Singapore-based DC networks, with significant socio-economic benefits predicted. Mugnini et al. [16] investigated the recovery of waste cold from the regasification of liquefied compressed natural gas (L-CNG) at mobility refueling stations for direct cooling in an Italian DC network. Cooling electricity consumption was estimated to reduce by 50–60% compared with standard individual cooling. In study [17], a multi-stage Rankine cycle-based LNG cold utilization scheme was designed for district electricity and cooling supply at several temperature levels in a Spanish DC network. Up to 125 kWh of equivalent electric energy could be extracted per kg of LNG [18]; however, economic feasibility and carbon abatement were not analyzed. Ayou and Eveloy [19,20] proposed LNG-assisted organic Rankine, Brayton, and ammonia-water (NH3-H2O) combined APC cycle concepts driven by ultra-low to medium-grade heat (i.e., 70–370 °C). Depending on configuration, these systems could yield a range of cooling-to-power ratios (2.3‒7.3) at effective first-law and exergy efficiencies of 24‒39% and 36‒45%, respectively. The highest cooling-to-power ratios (i.e., ≥7) and best low-temperature heat (i.e., 25‒100 °C) utilization capabilities were obtained with the organic Rankine cycle (ORC) [19] and APC-based configurations [20]. The Brayton-based configuration led to the highest specific energy savings per ton of regasified LNG and effective thermodynamic efficiency (i.e., 135 kWh/tonLNG and 45.5%, respectively), while the ORC-based configuration was the most attractive in terms of lower initial investment and payback time at low-bound utility tariffs [19].
In this study, a compromise in driving heat temperature, specific equivalent power extraction from cryogenic cold and cooling-to-power ratio, is sought using an LNG-assisted KC-based poly-generation concept. The scheme is designed to supply air-conditioning, electricity, and fuel to municipal energy systems in the proximity of LNG vaporization terminals, with a focus on high ambient temperature conditions, in which natural thermal sinks are lacking.
Previous studies related to KC-type LNG exergy recovery systems include [21,22,23,24,25,26,27], none of which investigated the potential adaption and/or application of these concepts to municipal (district) cooling. The LNG-assisted KC-based systems in Refs. [24,25,26,27] incorporated cooling production, which is the focus of the present work.
Ghaebi et al. [24] proposed a single-stage ammonia-water APC system derived from a KC and activated by hot water at 170 °C. Chilled water at 5 °C was produced by extracting heat from the strong solution, which was pre-cooled by the LNG stream. LNG was neither employed for cycle condenser heat sinking, nor direct chilling of an external fluid. A cooling-to-power ratio of 1.3 was achieved, with first- and second-law efficiencies of 43.2% and 22.5%, respectively. The results indicated a pronounced efficiency degradation at increasing condenser temperature (27–33 °C).
Zhang et al. [25] investigated a tri-generation system incorporating an ammonia-water KC activated by waste heat at 260 °C, and a R134a vapor compression cycle (VCC) for air refrigeration at 8 °C. LNG absorbed heat serially from the KC and VCC condensers, and generated power via direct expansion. At base-case conditions, a cooling-to-power ratio of 0.9 was obtained, with a tri-generation exergy efficiency of approximately 60%. The KC power output, overall power generation thermal efficiency, and waste heat/cold recovery efficiencies were found to increase with ammonia turbine inlet temperature, whereas cooling production and exergy efficiency reduced.
Emadi et al. [26] analyzed a geothermal energy-driven (120 °C heat source) poly-generation system producing power using a KC and Stirling cycle, residential cooling, hydrogen, and oxygen. LNG absorbed heat from the Stirling cycle condenser, provided electricity via direct expansion and direct cooling to domestic users at 5 °C, with no direct LNG interaction with the KC. The cycle favored power production (i.e., cooling-to-power ratio <0.6), with 43.5% exergy efficiency obtained.
Abbasi et al. [27] analyzed a multi-generation system for power, cooling and desalted water production, including a KC and reverse osmosis desalination plant. The KC was driven by turbine exhaust gases from a concentrated solar power plant (>200 °C heat source). LNG extracted heat from the KC condenser, provided direct expansion power, and direct cooling for domestic uses. Overall energy and exergy efficiencies of 41 and 21.2% were achieved, but the cooling output was limited (i.e., cooling-to-power ratio of ~0.1).
In summary, the investigation of LNG cryogenic exergy to enhance KC-based multi-generation systems with cooling production has been limited to date, with the following research gaps:
- Limited cooling-to-power ratios were achieved (i.e., <1.3), with LNG considered as a direct coolant in only few instances.
- Heat source temperatures generally above 150 °C were required for the systems to operate, which would not permit to utilize abundantly available lower grade heat, such as from non-concentrated solar, geothermal, power, or industrial systems.
- The potential adaption and/or application of these concepts to municipal (district) cooling was not considered.
- The proposed cycle architectures were complex, which is not considered desirable for deployment in LNG receiving/distribution facilities.
- The focus has generally been on thermodynamic performance characterization, rather than economic feasibility and carbon abatement potential.
Considering that dual electricity and elevated air-conditioning demands are characteristic of municipalities in hot climates, the above research gaps are addressed as follows in the present study:
- An LNG-assisted KC-based poly-generation concept is investigated to supply air-conditioning, electricity, and regasified LNG to municipalities in the proximity of LNG vaporization terminals, in a more sustainable way than with conventionally fueled supply systems.
- The proposed system provides both direct LNG refrigeration and indirect vapor compression refrigeration at a mid to high cooling-to-power ratio, thereby responding to building energy demands in hot climates.
- The cycle concept is thermally activated by low-grade heat at a nominal 130 °C condition, representative of solar collector or geothermal fluids, or low-temperature power/industrial waste heat.
- A complex system architecture is avoided in terms of the number of components and working fluid loops, both for deployment and economic considerations.
- The system is evaluated from thermodynamic, economic, and environmental perspectives.
The integration concept of municipal cooling, power and fuel supplies is described in Section 2, and its mathematical modeling in Section 3. The system thermodynamic modeling results are presented and discussed in Section 4, and its carbon abatement potential and economic profitability are analyzed in Section 5. Finally, the main conclusions of this study are presented in Section 6.
2. Liquefied Natural Gas-Assisted Kalina Cycle-Based Poly-Generation System
The proposed poly-generation system for municipal cooling, electricity, and revaporization of LNG is depicted in Figure 1. The system is driven by low-grade heat (nominally at 130 °C, with an operable range of 90–170 °C), representative of evacuated tube or compound parabolic solar collectors, or low-temperature power/industrial waste heat [28]. Such low-temperature heat sources have received increasing attention for power or cooling production, owing to their abundance [29,30]. The system of Figure 1 includes a KC power sub-system producing electricity (streams 19), an LNG cold extraction and vaporization sub-system (streams 15) which acts as a heat sink to the KC condenser and produces supplemental power via direct NG expansion, and a DC chiller plant sub-system comprised of an electricity-driven VCC and direct refrigeration heat exchanger (RHX).

Figure 1.
Schematic representation of liquefied natural gas (LNG)-assisted, Kalina cycle (KC)-based poly-generation system for municipal air-conditioning, electricity generation, and LNG vaporization. Chiller = electricity-driven vapor compression chiller; EVA = evaporator; EVA-CON = evaporator-condenser; EXP = LNG expander; GEN = electric generator; HTREC = high-temperature recuperator; LTREC = low-temperature recuperator; MIX = mixer; PUMP = LNG pump; RHX = refrigeration heat exchanger; SEP = vapor-liquid separator; SEV = solution expansion valve; SP = solution pump; TUR = KC turbine.
The topping sub-system is based on a KCS 34 configuration, which is designed for the conversion of low-grade heat (i.e., typically ≤120 °C), mainly in combined power and district heating applications, and is one of the most widely-adopted KC designs [11,12]. In this KC configuration, the separator (SEP) can overcome incomplete vaporization of the working fluid for low-enthalpy heat sources, ensuring that only vapor is fed to the turbine. The low- and high-temperature internal heat recuperators (LTREC, HTREC) recover heat from the turbine outlet and weak solution, respectively, to pre-heat the basic solution fed to the evaporator.
In the KC sub-system, the basic ammonia-water solution from the evaporator-condenser (EVA-CON) heat exchanger (stream 6) is pumped to a high pressure (stream 7) by the solution pump (SP). The basic solution is then pre-heated in the low- and high-temperature recuperators (LTREC and HTREC, respectively) before entering the evaporator (EVA). In the evaporator, the basic solution (stream 9) is partially boiled using the external low-temperature heat source (e.g., solar or geothermal heat, or industrial or power plant waste heat). The vapor-liquid ammonia-water mixture leaving the evaporator (stream 10) is separated into vapor (steam 11) and liquid (stream 13) streams using the vapor-liquid separator (SEP). The ammonia-rich vapor (stream 11) expands in the turbine (TUR, stream 1112), with electrical power generated using the coupled electric generator (GEN 2). A fraction of the mechanical power developed by the turbine is supplied to the solution pump. Since the molecular weights of ammonia and water (17 and 18 kg/kmol, respectively) are similar, normal back-pressure turbines [31] are recommended. Furthermore, no special turbine materials are required using an ammonia-water mixture [31]. The weak, in ammonia, liquid (stream 13) rejects heat in the HTREC (stream 1314) to pre-heat the basic solution (stream 89). After throttling to the turbine exhaust pressure in the solution expansion valve (SEV, stream 1415), the weak solution (stream 15) from the high-temperature recuperator is mixed adiabatically with the turbine exhaust (stream 12) in the mixer (MIX). The mixed stream (stream 16) enters the evaporator-condenser heat exchanger (stream 17) after pre-heating the basic solution (stream 78) in the LTREC (stream 1617).
In the LNG sub-system, LNG is vaporized in the evaporator-condenser using the heat of condensation rejected by the working fluid of the topping Kalina power cycle. The regasified LNG is expanded in the LNG expander (EXP), generating electricity in the coupled electric generator (GEN 1). The waste cold energy and electricity inputs required to produce chilled water via direct and indirect cooling, and to distribute cold to DC end-users, are supplied by the LNG sub-system.
In subsequent sections of this article, the useful electricity and refrigeration products, thermodynamic efficiency, economic saving and GHG emission avoidance potential of the poly-generation system relative to conventional supply systems are analyzed per unit feed rate of vaporized LNG (i.e., 1 kg/s), which is a common approach for LNG exergy recovery systems and facilitates performance comparison with other systems [32]. The system characteristics at municipal energy system level are then analyzed for a modular million ton per annum (MTPA) LNG vaporization capacity, representative of a small-size floating storage and regasification unit (FSRU) [33]. Such a capacity could either fulfill the refrigeration and electrical loads of a small-size municipal energy system, or serve for either partial retrofitting or expansion of a larger-scale district energy system.
3. Mathematical Model
The thermodynamic model of the poly-generation system is developed based on energy and mass conservations, exergy balances, working fluid thermodynamic property relations, and heat transfer relations, implemented in Engineering Equation Solver (EES). The following typical assumptions are applied:
- Steady-state steady-flow processes [22]
- Negligible potential and kinetic energy effects [22]
- Negligible heat losses/gains between the components and connecting pipes, and the environment [22]
- The vapor-liquid mixture leaving the KC evaporator (stream 10) is at the evaporator temperature and pressure [31]
- The vapor and liquid streams leaving the KC separator are at equilibrium (i.e., and ) [31] and saturated [21]
- Isenthalpic expansion in the KC solution valve [34]
- Saturated liquid solution at the KC condenser outlet (stream 6), at the condenser pressure and temperature [25]
- The vapors at the KC turbine and LNG expander outlets have a quality of at least 88% to avoid potential moisture erosion of these equipment induced by wet working fluids [20]
- Constant isentropic efficiencies for the KC turbine and solution pump, and LNG expander and LNG pump [23]
- Pressure drops of 5% in heat exchangers [35]; negligible pressure drop and thermal loss in pipelines [22]
- LNG is taken as pure methane with real fluid properties [21].
Based on the above assumptions, the generic modeling equations based on mass and energy conservation laws, and exergy balances for each system unit (u) are expressed as follows.
Overall mass balance:
Species (i.e., ammonia in ammonia-water mixture) mass balance:
Energy balance, with heat flow into a unit and work developed by a unit taken as positive:
Exergy balance:
The specific exergy of a stream is obtained by summing its specific physical exergy and specific chemical exergy:
Given that no chemical reaction or combustion are involved in the proposed system, the chemical exergy of each stream is assigned zero value, except in the topping KC, where species concentration differs between streams, hence chemical exergy and total exergy. Stream physical and chemical exergies are calculated using Equations (6) and (7), respectively [36]:
In Equation (7), and , which represent the standard molar specific chemical exergies of ammonia and water, respectively, are obtained from Szargut [37]. No mixing effect (i.e., RT0) is included in Equation (7), given its small importance relative to the other terms [36]. The total exergy flow rate of a stream is expressed as:
The exergy destruction rate for unit u, , may be obtained from the exergy balance in Equation (4) or the Gouy-Stodola theorem [38]:
where the entropy production rate, , is given by:
The exergy destruction ratio of each unit, , is expressed as the ratio of the exergy destruction in the unit considered () to the total exergy destruction of the system () [38]:
When a fuel and product can be meaningfully defined for a unit, the exergy efficiency of the unit, , can be evaluated as the ratio of the exergy rates of the product generated by the unit, , and fuel supplied to the unit, [38]:
The exergy destruction rate of the unit may also be related to the exergy rates of its fuel and product, and exergy loss, [38]:
Mass and energy relations, and exergy relations for the poly-generation system units are given in Table A1 and Table A2, respectively.
Typical design and operating parameter values for base-case thermodynamic, economic and environmental assessment of the poly-generation system are listed in Table 1. The system is thermally activated by hot water at 130 °C and the corresponding saturation pressure (i.e., 2.7 bar). To operate the system, the basic ammonia-water solution needs to partially vaporize in the evaporator at its operating conditions (30 bar, 0.82 kg/kg of ammonia mass fraction) using the heat source heat input. The ammonia mass fraction of the basic ammonia-water solution entering the EVA is set based on an existing Kalina power plant in Husavik, Iceland, which uses 82% ammonia by weight [31]. Accordingly, the minimum and maximum heat source temperatures ( and that correspond to the bubble (i.e., saturated liquid) and dew (i.e., saturated vapor) temperatures of the ammonia-water mixture at the evaporator exit (stream 10, Figure 1) are determined to be 86 °C and 171 °C, respectively, at nominal conditions ( = 30 bar, and = 5 °C). The heat source mass flow rate () is calculated by minimizing the thermal capacitance rates mismatch between the heat source (i.e., water) and ammonia-water in the evaporator. This is achieved by adjusting the heat source temperature () at the evaporator outlet to reach a similar temperature difference at the hot and cold ends of the evaporator [39].

Table 1.
Input modeling parameters for the KC-based poly-generation system at nominal conditions.
3.1. System Performance Indices
The thermodynamic performance of the poly-generation system is assessed based on its net power and cooling rates, cooling-to-power and direct-to-indirect cooling ratios, component- and system-level exergy destruction rates, as well as system energetic and exergetic efficiencies that account for the thermodynamic qualities of the system power and cooling outputs. The net electrical power output generated by the KC sub-system is evaluated as:
where and are the electric generator efficiency and mechanical coupling efficiency, respectively. In Equation (14), the work developed by the KC sub-system ammonia turbine (TUR) and consumed by the solution pump (SP) are given by Equations (15) and (16), respectively:
The net electrical power generated by the LNG sub-system, which is used to drive a vapor compression chiller plant for indirect cooling production, is given by:
The LNG sub-system direct and indirect cooling outputs are given by Equations (18) and (19), respectively:
where the chilled water return and supply streams enthalpies ( and , respectively) are calculated at typical chilled water temperatures and pressures for a central DC chiller plant.
The total cooling output (), direct-to-indirect cooling ratio () and cooling-to-power ratio (R) are defined in Equations (20) to (22):
Effective first-law efficiency and effective exergy efficiencies [48] are used as thermodynamically consistent and realistic system performance indicators. The use of an effective first-law efficiency avoids potential overestimation of system thermodynamic performance using a first-law efficiency (Equation (23)), which in some instances can approach or exceed its thermodynamic limit [48]:
Unlike the first-law efficiency (Equation (23)), the effective first-law efficiency in Equation (24) accounts for the thermodynamic quality of the cooling output by weighting it with a practically realizable refrigerator COP, or equivalently, by dividing the exergy rate of the cooling produced by a reasonable refrigerator second-law efficiency [48]:
Thus, the effective first-law efficiency in Equation (24) is defined from the viewpoint of converting heat into power, whereby the system total net equivalent power generated (i.e., numerator of Equation (24)) is the sum of the net power generated by the system, and actual power consumed to produce the cooling output. In Equation (24), the second-law efficiency of the refrigeration system, , is the ratio of its actual COP () to its ideal COP (), and is taken as 30% [46,49]. The exergy rate of the cooling product () in Equation (24) is calculated as:
where is the total (i.e., direct and indirect) chilled water mass flow rate, which is the sum of and . The utilitarian exergy efficiency is commonly defined as [50]:
Based on similar considerations as for the effective first-law exergy efficiency, the system effective exergy efficiency () [48] in Equation (27) is intended to realistically incorporate the equivalent power associated with the cooling output, which is considered the primary useful output in the present study:
In Equations (23) and (25), and are the net exergy inputs to the system from the heat source (stream 1819) and the LNG stream (stream 15), respectively, and are obtained using Equations (28) and (29), respectively:
3.2. Model Validation
The simulation outputs obtained for the KC and LNG sub-systems are compared in Table 2 with corresponding reference data from Ogriseck [31] for a KC having a configuration similar to that of the present topping cycle, and from Shi and Che [35] for a similar LNG component arrangement (i.e., LNG pump, EXP and RHX), respectively. The results obtained in Table 2 are in good agreement with the reference data. For the KC sub-system, predicted stream temperatures, pressures, ammonia concentrations and mass flows are within a worst-case 1% of reference data, with the exceptions of t7 (i.e., ±0.5 °C (6%) deviation) and p6 (i.e., ±0.08 kPa (1.7%) deviation), which should be considered in the context of their small steam temperature (i.e., t6 = 8 °C) and pressure (i.e., p6 = 4.6 kPa) values, and small deviations (i.e., ±0.5 °C for t7, ±0.08 kPa for p6) for these streams. In addition, energy quantities for the KC and LNG sub-systems are within 0.5% and 0.2% of reference data, respectively.
Table 2.
Comparison of model outputs for the KC sub-system and LNG sub-system; (a) present study, (b) Ogriseck [31] and (c) Shi and Che [35].
4. Thermodynamic Modeling Results and Discussion
The system thermodynamic performance is analyzed in Section 4.1 at the nominal operating conditions detailed in Table 1. The sensitivity of system performance to key input modeling parameters is then parametrically evaluated in Section 4.2.
4.1. Nominal Conditions
The specific refrigeration and net power outputs, and performance characteristics of the poly-generation system under the typical design and operating conditions in Table 1, are reported in Table 3. The corresponding stream properties are listed in Table 4, and the T-s diagram of the thermodynamic processes is shown in Figure 2. In the cryogenic sub-system, LNG state changes from a saturated liquid (stream 1) to a superheated vapor (stream 5) above the saturation dome of methane (Figure 2).
Table 3.
LNG-assisted KC-based poly-generation system overall energy- and exergy-based performance characteristics at nominal conditions listed in Table 1.
Table 4.
Stream thermodynamic properties for the poly-generation system (Figure 1) at nominal conditions.

Figure 2.
T-s diagram of the poly-generation system processes at nominal conditions.
The system produces approximately 150.6 kJ/kgLNG of net electrical power and 561.5 kJ/kgLNG of refrigeration at cooling-to-power and direct-to-indirect cooling ratios of 3.7 and 0.98, respectively. The use of the cryogenic sink for the KC sub-system condenser is found to almost triple the net electrical power production of the topping KC (i.e., from 51.6 kJ/kgLNG to 150.6 kJ/kgLNG) compared with ambient condenser heat sinking (i.e., 35 °C/40 °C inlet/outlet cooling water temperatures, representative of hot climatic conditions in e.g., the Middle East basin). These net power productions were estimated for the same amount of condenser heat rejection (i.e., 625.9 kW), in either ambient water-cooled or LNG-cooled condenser conditions. The power augmentation contributed by the cryogenic sink is associated with a reduction in the KC sub-system turbine (TUR) outlet pressure relative to an ambient sink (i.e., from 14 to 2 bar, equivalent to an increase in pressure ratio from 2.1 to 15).
The present system operates at effective first-law efficiency and effective exergy efficiency values of 32.7% and 35.4%, respectively. Without considering the thermodynamic quality of the cooling output (i.e., without weighting the cooling output by a practically realizable refrigerator COP), the system first-law and exergy efficiencies would be evaluated at 90.6%, which is considerably higher than its effective first-law efficiency, and 25.2%, respectively, which is less than the effective exergy efficiency. The corresponding net specific equivalent power production (i.e., SEP, which is the sum of the actual net electrical power, and equivalent power consumed to produce the cooling output) is of 71.7 kWh/tonLNG. When also considering the electrical power avoided for seawater pumping in open-rack vaporizers in conventional terminals (i.e., 8 kWh/tonLNG [45]), the system could save 79.7 kWh/tonLNG of electricity through the use of low-temperature renewable/excess heat and cryogenic cold, as substitutes for conventional driving energy sources.
The system performance, in terms of SEP, efficiency, and cooling-to-power ratio (Rc) (when applicable), is compared with corresponding figures previously reported for LNG-assisted KC-based power cycles [22,23]) and dual power/cooling cycles [24] in Table 5. These cycles [22,23,24] had more complex architectures than in this study and were activated using higher heat source temperatures. Despite the lower enthalpy heat source in this study, the present system effective efficiencies and cooling-to-power ratio exceed those of Ghaebi et al.’s dual power/cooling cycle [24]. In addition, the cooling-to-power ratio achieved with the present system (i.e., 3.7) is also well above those encountered for other previously reported LNG-assisted KC-based multi-generation systems (i.e., 0.9 [25], <0.6 [26], ~0.1 [27]). The present cooling-to-power ratio is achieved through the use of LNG as a direct coolant, unlike in for example Ref. [24], where refrigeration is provided to chilled water by extracting heat from the strong KC solution, which is pre-cooled by LNG. Finally, in this study the NG utilization (supply) pressure is higher than in Refs. [22,23,24] and suitable for municipal distribution.
Table 5.
Comparison of present poly-generation system performance characteristics with those of previously reported LNG-assisted KC-based power and dual power/cooling generation systems.
When comparing the present system with the LNG-assisted ORC, Brayton, and APC cycle concepts previously investigated in [19,20], the ORC [19] and APC-based [20] configurations offer the lowest temperature (i.e., 25‒100 °C) heat utilization capabilities, and the APC the highest cooling-to-power ratio (i.e., Rc ≥ 7). However, this is at the expense of limited specific equivalent power (i.e., SEP ≈ 41–51 kWh/tonLNG) for these systems. The Brayton-based system [19] is preferable from SEP (i.e., 135 kWh/tonLNG) and effective efficiency (i.e., 45%) perspectives, but requires at least 300 °C heat source temperature to operate (and 370 °C at base-case conditions), with limited cooling output (Rc ≈ 2.3). The present system therefore represents a compromise in driving heat temperature, cooling-to-power ratio, specific equivalent power extraction from cryogenic cold, and effective efficiency (, ) compared with the LNG-assisted concepts previously investigated in [19,20].
Assuming a terminal with 1 MTPALNG nameplate vaporization capacity and yearly availability of 8000 h, the system could supply approximately 16.26 MW of space cooling, 4.36 MW of net electrical power, and 0.91 Mton of natural gas to the district. The corresponding primary energy consumption reduction, carbon abatement and economic benefits are analyzed in Section 5.
The exergy rates of the fuel, product, destruction, and loss for the system units, and their exergy efficiencies, are given in Table 6. The total exergy destruction rate is approximately 524 kJ/kgLNG. The EVA-CON and RHX are the highest contributors to total exergy destruction, with limited exergy efficiencies. These units would be the key components for further improvement of system performance. Their exergy destruction rates are mainly attributed to the thermal capacitance mismatch between the hot and cold streams (i.e., basic NH3/H2O solution and LNG in the case of EVA-CON, and chilled water and regasified LNG for the case of RHX). The thermal capacitance match between EVA-CON hot (state 6→7) and cold (state 2→3) streams could be reduced using cascaded heat-driven power/refrigeration cycles (e.g., cycles at different heat sink temperature levels), but this would significantly increase system complexity, which is avoided in deployed LNG cold exergy recovery systems. Although there is a significant amount of heat transfer with finite temperature difference in the EVA, this unit only contributes 6% to total exergy destruction. This is due to the assumed perfect thermal capacitance match between the hot water heat source and basic NH3/H2O solution boiling in the EVA. Exergy destruction in the HTREC and LTREC are also associated with the thermal capacitance mismatch between their respective hot and cold streams, but their destruction rates are not significant. This is attributable to the relative small rates of exergy these components process. Thus, LTREC has limited exergy efficiency, but its fuel exergy rate is of small magnitude. By contrast, TUR, LNG EXP, and LNG PUMP process significant rates of fuel exergy, but their exergy destruction rates do not exceed a few percent of total system destruction. There is limited room for reducing TUR and LNG EXP destructions rates, considering their relatively high exergy efficiencies, but a higher efficiency component could be considered for the LNG PUMP. The SEP was assumed to be an ideal component (i.e., ideal equilibrium temperature and pressure conditions at inlet/outlets), resulting in negligible destruction. Minor exergy destructions are also observed in the MIX, SEV, and SP. Although a more efficient SP could be considered, this component processes a small rate of fuel exergy and is not considered critical. By contrast, the MIX and SEV process significant fuel exergy rates, but have high efficiencies. The exergy efficiency of the vapor compression chiller is limited, but this component does not contribute significantly to the system’s total destroyed exergy.
Table 6.
Exergy rates of the fuel, product, destroyed exergy, exergy loss, and exergy efficiency for the poly-generation units at nominal conditions.
4.2. Off-Design Conditions
The influence of the following key parameters on the thermodynamic performance of the poly-generation system is investigated: heat source inlet temperature (), KC basic solution ammonia concentration (), KC turbine (TUR) inlet pressure () and isentropic efficiency (), and LNG expander (EXP) pressure ratio () and isentropic efficiency ().
The influence of heat source temperature, , on the system electrical and cooling energy production, and effective efficiencies, is illustrated in Figure 3. The heat source temperature is varied between 90 °C and 170 °C, which is within its operable range (i.e., 86–171 °C at the nominal EVA pressure and basic solution ammonia mass fraction). This heat source temperature range corresponds to the bubble and dew points of the ammonia-water mixture at these nominal pressure and concentration conditions, plus the EVA minimum temperature difference. When the heat source inlet temperature increases from 90 °C to 170 °C, the mechanical power developed by the LNG EXP rises from 86.8 to 143.6 kJ/kgLNG, leading to a rise in indirect cooling output by the VCC (Figure 3a). However, since the specific enthalpy at the outlet of the LNG EXP (stream 4) increases when increases, the RHX direct cooling output of the system decreases. The net electrical power output of the KC increases when increases, as more vapor is generated (i.e., rising from 0.44 to 0.6 kg/kgLNG) in the EVA (at constant EVA pressure), and as the specific enthalpy drop across the TUR () increases from 271.6 to 371.8 kJ/kgLNG. In addition, the SP power consumption decreases from 9.4 to 3.4 kJ/kgLNG, since the basic solution mass flow rate () decreases from 1.66 to 0.601 kg/kgLNG. The effective first-law and effective exergy efficiencies increase with increasing heat source inlet temperature (Figure 3b) due to the following collective effects. As noted above, the net electrical power output of the KC increases. In addition, the actual work contribution of the total cooling output in the effective first-law and effective exergy efficiency definitions (i.e., in Equations (19) and (21), respectively) also increases from 97.4 to 122.8 kJ/kgLNG when increases. The above rise in the system effective outputs offsets the increase in the driving heat input (i.e., EVA heat duty, ) and in the driving exergy input from the heat source () both (i.e., from 665.1 to 965.4 kJ/kgLNG and from 110.2 to 237.7 kJ/kgLNG, respectively).

Figure 3.
Effect of heat source inlet temperature on poly-generation system performance: (a) Useful cooling and electrical power outputs; (b) Overall efficiencies.
Figure 4 shows the effect of the KC basic solution ammonia concentration () on the system performance at different heat source inlet temperatures, (i.e., 110 °C, 130 °C, 150 °C). This figure also illustrates the existence of a minimum inlet heat source temperature to drive the system (i.e.,), the value of which increases when reduces at a given EVA pressure. Accordingly, for any assumed heat source temperature and EVA operating pressure, a minimum is required for the system to function (e.g., ≥ 0.65 at = 110 °C), beneath which no net output is produced. With regard to the useful power output, an increase in results in a decrease in the basic solution mass flow rate, and consequently of the SP power consumption. The gross power output of the TUR increases up to approximately = 0.85 kg/kg, and then slightly decreases at higher values. Combining these effects, the KC net electrical power output gradually increases (Figure 4a). With regard to the cooling output, as increases from 0.5 to 0.9, the direct cooling output increases, while the indirect cooling output decreases, leading to a reduction in total cooling output (Figure 4a).

Figure 4.
Effect of the KC sub-system basic solution ammonia concentration on poly-generation system performance at different heat source inlet temperatures ( = 110 °C, 130 °C, and 150 °C): (a) Useful cooling and electrical power outputs; (b) Overall efficiencies.
The effective first-law and effective exergy efficiencies both increase with increasing range, with the effective exergy efficiency reaching optimum values at 0.85 kg/kg (i.e., 33% at 110 °C, 35.5% at 130 °C, and 38.3% at 150 °C).
The influence of the KC turbine (TUR) inlet pressure, , on the system useful outputs and effective efficiencies, is illustrated in Figure 5 at several inlet heat source temperatures, (i.e., 110 °C, 130 °C, and 150 °C). There are minimum and maximum pressure levels (that correspond to the dew and bubble points of the working fluid) in order for the system to operate at a given heat source temperature. For a given heat source inlet temperature, as increases within these minimum and maximum pressure levels, the amount of vapor generated in the EVA decreases, resulting in less vapor flowing through the TUR (i.e., ). The power generated by the KC attains an optimum value for each heat source temperature (Figure 5a). This is mainly due to the trade-off between the amount of vapor flowing through the TUR (i.e., ), and the enthalpy drop across the turbine (Δ). The power consumption of the SP increases as the EVA pressure, hence increases, but is small relative to the TUR gross power output (i.e., <6%) over the range of considered.
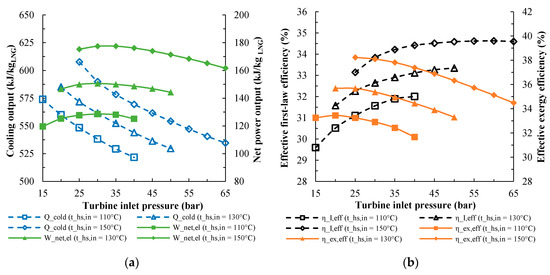
Figure 5.
Effect of the KC sub-system turbine inlet pressure on poly-generation system performance at different heat source temperatures ( = 110 °C, 130 °C, and 150 °C): (a) Useful cooling and electrical power outputs; (b) Overall efficiencies.
The direct cooling output of the system augments as increases, whereas the indirect cooling output decreases (leading to an increase of the direct-to-indirect cooling ratio from 0.86 to 1.59, 0.77 to 1.42, and 0.63 to 1.33 at of 110 °C, 130 °C, and 150 °C, respectively). This results in a reduction of the total cooling output at a given heat source inlet temperature, when increases (Figure 5a). The effective first-law efficiency of the system gradually increases as increases between the minimum and maximum pressure limits, while the effective exergy efficiency decreases (Figure 5b). This is contributed by the reduction in the (weighted) exergy of the total cooling output, and a rise in the exergy input of the heat source as increases.
The effect of LNG expander pressure ratio, , on the poly-generation system performance is investigated in Figure 6 at different heat source temperatures, (i.e., 110 °C, 130 °C, and 150 °C). As LNG expander pressure ratio increases, the operating pressure of the LNG vaporizer (i.e., EVA side of the EVA-CON heat exchanger) also increases. As a result, the heat input required in the LNG vaporizer is reduced by 33.5%, 31.6% and 29.4% at of 110 °C, 130 °C, and 150 °C, respectively, when is increased from 2 to 9. Hence, less heat has to be rejected by the KC to vaporize the LNG. This implies that less ammonia-water solution is needed to circulate in the KC as increases, and the mass flow rate of the basic solution decreases. Consequently, the strong solution and ammonia-rich vapor mass flow rates ( and , respectively) also decrease. Accordingly, the amount of mechanical power generated by the KC TUR decreases (i.e., from 175.2 to 116.6 kJ/kgLNG at 110 °C; from 198.9 to 136.1 kJ/kgLNG at 130 °C; and from 227.9 to 161.0 kJ/kgLNG at 150 °C). The mechanical power consumed by the SP also decreases. As a result, the net electrical power output of the system decreases (Figure 6a).

Figure 6.
Effect of LNG expander pressure ratio on poly-generation system performance at different heat source temperatures ( = 110 °C, 130 °C, and 150 °C): (a) Useful cooling and electrical power outputs; (b) Overall efficiencies.
Both the LNG expander (EXP) power output and power consumption of the LNG pump increase when increases, and increase at different rates. Consequently, the net electrical power output of the LNG sub-system (which is utilized by the VCC plant for indirect cooling production), hence indirect cooling output, reaches an optimum value. On the other hand, the direct cooling output of the system increases (i.e., from 153.1 to 385.8 kJ/kgLNG at 110 °C; from 132.8 to 364.36 kJ/kgLNG at 130 °C; and from 108.5 to 339.4 kJ/kgLNG at 150 °C) as the increases from 2 to 9. Combining these effects, the total cooling output exhibits a maximum at a between 5 and 6 (Figure 6a).
The variations of the effective first-law and effective exergy efficiencies with respect to are shown in Figure 6b. Both the net exergy input (i.e., sum of and , equal to 566.1 kJ/kgLNG) and heat supplied to the system decrease (i.e., by 33.5%, 31.6%, and 29.4% at of 110 °C, 130 °C, and 150 °C, respectively) when increases from 2 to 9. The effective first-law efficiency also increases over the range of pressure ratios in Figure 6b, but the effective exergy efficiency attains an optimum value (i.e., 33.4%, 35.8%, and 38.3% for of 110 °C, 130 °C, and 150 °C, respectively), at a between 3 and 4.
Figure 7 and Figure 8 show the influence of the KC TUR and LNG EXP isentropic efficiencies, and , respectively, when varied from 50% to 100%, on the system useful outputs and efficiencies. The mechanical power generated by the KC TUR increases from 78.3 to 171.2 kJ/kgLNG, from 93.1 to 196.8 kJ/kgLNG and from 109.8 to 229.4 kJ/kgLNG at of 110 °C, 130 °C, and 150 °C, respectively, when increases from 50% to 100%. However, in the same range, the power consumption of the SP remains almost constant at approximately 4.3–4.7 kJ/kgLNG, 3.8–4.0 kJ/kgLNG, and 3.6–3.7 kJ/kgLNG at of 110 °C, 130 °C, and 150 °C respectively. Consequently, when the increases from 50% to 100%, the net electrical power output of the system increases by approximately 125.1%, 116%, and 112.5% at of 110 °C, 130 °C, and 150 °C, respectively.

Figure 7.
Effect of KC sub-system turbine isentropic efficiency on poly-generation system performance at different heat source temperatures ( = 110 °C, 130 °C and 150 °C): (a) Useful cooling and electrical power outputs; (b) Overall efficiencies.

Figure 8.
Effect of LNG expander isentropic efficiency on poly-generation system performance at different heat source temperatures ( = 110 °C, 130 °C, and 150 °C): (a) Useful cooling and electrical power outputs; (b) Overall efficiencies.
When the KC TUR isentropic efficiency, , is increased, the LNG EXP inlet temperature, , decreases, and consequently the enthalpy at the LNG EXP inlet and outlet (i.e., and , respectively) decreases. This leads to a reduction in the mechanical power generated by the LNG EXP, while the enthalpy change across the RHX () increases. In parallel, the power consumption of the LNG pump remains constant at 45.8 kJ/kgLNG. Since the net electrical power generated by the LNG sub-system decreases, the indirect cooling output produced by the VCC also decreases. However, the direct cooling output increases. Combining these effects, the total cooling output decreases (Figure 7a).
In parallel, as the KC TUR isentropic efficiency, , increases, the heat required in the EVA and the net exergy input of the system increase approximately by 10.4–11.4% and 8.2–10.9%, respectively. The simultaneous effects of increased TUR net electrical power output, reduction in total cooling and increased heat/exergy inputs lead to an increase in both the effective first-law and effective exergy efficiencies when increases (Figure 7b). This is mainly the result of the significant increase in TUR power output due to its increased efficiency.
The isentropic efficiency of the LNG EXP, , has no influence on the KC net electrical power output of the system; however, it has a strong effect on both the direct and indirect cooling outputs (Figure 8a). When increases from 50% to 100%, the mechanical power generated by the LNG EXP increases from 54 to 107.9 kJ/kgLNG, 59.5 to 119.0 kJ/kgLNG and 66.1 to 132.1 kJ/kgLNG at heat source inlet temperatures, , of 110 °C, 130 °C, and 150 °C, respectively. It is obvious, however, that the power consumption of the LNG pump is insensitive to . Consequently, the VCC indirect cooling output increases significantly. Furthermore, the RHX direct cooling also increases, as the enthalpy at the LNG EXP outlet decreases, and therefore the total cooling output increases.
When the LNG expander isentropic efficiency is increased, the heat input and total exergy input (i.e., sum of and ) to the system remain constant at 729.2 and 699.6 kJ/kgLNG, 786.1 and 725.3 kJ/kgLNG, and 853.5 and 758.1 kJ/kgLNG at heat source inlet temperatures, , of 110 °C, 130 °C, and 150 °C, respectively. Consequently, because the total cooling output increases (Figure 8a), the effective first-law and effective exergy efficiencies of the system also rise (Figure 8b).
5. Economic Feasibility and Carbon Abatement
The benefits of the proposed multi-generation system are evaluated at nominal conditions (Table 1) in terms of its contributed net yearly economic savings, net present value (NPV), discounted payback period (DPBP), internal rate of return (IRR), and GHG emissions reduction. For this analysis, the poly-generation system driving heat input is assumed to be surplus/waste heat with negligible or no processing/pre-treatment cost [38,51]. The yearly gross economic savings are estimated by comparison with a standard system of reference, producing electricity using a natural gas fueled-combined cycle (NGCC), space cooling using a grid electricity-driven vapor compression chiller (without waste cold utilization), and vaporized LNG using grid electricity-driven seawater pumps. The yearly gross economic savings obtained with the proposed poly-generation system are associated with (i) the electricity generated by the KC sub-system using excess heat, (ii) the electricity saved for both cooling production using waste cold exergy-driven vapor compression cooling and direct LNG cooling, and by avoiding the use of seawater circulation pumps in open-rack LNG vaporizers, and (iii) the avoided cost of carbon emissions for electric power generation. The avoided carbon emissions are the product of the grid electricity consumption avoided for power and cooling generation, and LNG vaporization, by the local grid specific emission factor (EF). The yearly emissions cost is the product of the yearly emissions and specific emission cost (EC). This analysis is undertaken per kg/s of LNG vaporized, and translated to 1 MTPALNG vaporization capacity. The NPV of the poly-generation system is defined as:
where i denotes the yearly discount rate (DR), t the time period (i.e., year) of analysis, n the number of periods (i.e., system operating life (OL)), and Rt the net cash income in period t. The yearly net cash income is the sum of the poly-generation system yearly gross monetary benefits, and avoided annual O/M costs of the standard compression chiller and LNG vaporization facility, reduced by the annual O/M cost of the poly-generation system and its annual overhead (OH), insurance/taxes (I/T), and depreciation costs.
The fixed capital (FC) costs of the main poly-generation system units are estimated using the cost functions in Table 7. These functions are based on the value of USD at the time when the cost functions were first published. To account for the effect of inflation, the units’ fixed capital costs are brought to a reference year for the present study (i.e., 2016) using the Chemical Engineering Plant Cost Index (CEPCI) [52]:
where is the 2016 cost, is the cost estimated using the cost function at year y, and and are the cost indices, respectively, for reference year 2016 and for the year in which the cost function was first published (y). The annual average composite CEPCI values for years 1986, 1994, 1998, 2005 and 2016 are 318.4, 368.1, 389.5, 468.2, and 541.7, respectively [53,54]. The capital cost of the mixer (MIX) is neglected due to its small magnitude relative to other units [36]. The total capital investment of the multi-generation system is obtained as the sum of the FC investment and working capital (WC) [38]. The capital annuity factor (CAF) is evaluated as:
Table 7.
Capital cost functions for poly-generation system components.
The system heat exchangers are assumed to be shell-and-tube [36,55] made of carbon steel [11,34], with the heat transfer area for exchanger u estimated according to:
where is the rate of heat exchanged, the overall heat transfer coefficient (Table 1), the logarithmic mean temperature difference, and the correction factor.
The economic and environmental input modeling data are provided in Table 8. The effect of the electricity market price (MP) on the system profitability is considered based on an international [56] and a local subsidized MP [57]. The system components are assumed to depreciate linearly at a fixed annualized rate during the system operating life, with no salvage value at the end of operating life [58].
Table 8.
Monetary and environmental input modeling data for the poly-generation system.
The total FC investment of the multi-generation system is estimated at 0.58 million USD/kgLNG, and its distribution is shown in Figure 9. The KC TUR and generators (GEN1, GEN2) are the main investments at approximately 31% and 27% of the total FC, respectively. The total capital (fixed and working) is estimated at approximately 0.67 MUSD. The poly-generation system economic feasibility and GHG assessment results are summarized in Table 9 per kg/sLNG vaporized. The yearly net economic benefits range from 16 kUSD/kg/sLNG to 138 kUSD/kg/sLNG at local subsidized and international electricity market prices, respectively. The NPV, DPBP, and IIR are found to be 3.66 million USD/kg/sLNG, 1.74 years, and 63.7% at the international electricity price, and 2.42 million USD/kg/sLNG, 2.5 years, and 45.4% at the local subsidized electricity price, respectively. The poly-generation system would enable yearly primary energy consumption to be reduced by 352 tNG/kg/sLNG, and yearly carbon emissions by 960 tCO2-eq/kg/sLNG. At municipality level, per MTPALNG vaporization capacity, total yearly electricity savings of 73.9 GWh could be realized, equivalent to 11.1 kton of natural gas and yearly GHG emissions of 30.4 kton of CO2-equivalent emissions.

Figure 9.
Percentage distribution of fixed capital investment for the poly-generation system units. Chiller = electricity-driven vapor compression cycle (VCC); EVA = evaporator; EVA-CON = evaporator-condenser; EXP = LNG expander; GEN = electric generator; HTREC = high temperature recuperator; LTREC = low-temperature recuperator; PUMP = LNG pump; RHX = refrigeration heat exchanger; SEP = vapor-liquid separator; SEV = solution expansion valve; SP = solution pump; TUR = KC turbine. Values are percentage of total fixed capital investment for each unit.
Table 9.
Monetary and environmental analysis results for the poly-generation system per kg/sLNG.
The impact of uncertainties in input economic parameters on the DPBP is illustrated in Figure 10 by varying each parameter by ±50% relative to its nominal value in Table 8 for the local electricity market price, for which larger DPBPs are observed. The variation applied to the local electricity price in Figure 10 corresponds to the difference between the local and international rates, and is close to +50%. The −50% reduction applied to the reference chiller (i.e., VCC) COP is representative of measured performance data for the least-efficient type of air-conditioners (i.e., split units) in the Middle East Basin [70]. Based on the results in Figure 10, the DPBP is mainly sensitive to the fixed capital investment and electricity price. The DPBP would exceed 5 years for a 50% rise in fixed capital investment alone, and reach 10.8 years for the least favorable combination of ±50% deviations from the nominal parameter values in Table 8. For the international electricity price, the longest DPBP for the least favorable combination of parameter values would be 4.8 years.

Figure 10.
Sensitivity of the discounted payback period (DPBP) to ±50% variation in monetary parameters relative to their nominal values in Table 8 for the local electricity market price.
6. Conclusions
A Kalina cycle system 34-based poly-generation concept that integrates heat (cold), power, and gas supplies, was proposed and evaluated from thermodynamic, economic, and carbon abatement perspectives, to supply municipal (district) air-conditioning, electrical power, and vaporized liquefied natural gas at reduced cost and greenhouse gas impact in comparison with existing supply systems. The poly-generation system can be activated by low-grade renewable or surplus heat (90–170 °C). Air-conditioning is produced using vapor compression powered by an LNG open Rankine cycle, as well as using liquefied natural gas as a direct coolant.
At nominal conditions, approximately 49.5% of the cooling is produced directly using the cryogenic cold source (i.e., liquefied natural gas). The integration of the cryogenic sink (i.e., liquefied natural gas) with the Kalina sub-system condenser is found to approximately triple the system useful electrical output compared with standard condenser heat sinking in high ambient temperature conditions. Although approximately 74.5% of the system exergy destruction occurs in the cryogenic heat exchangers (i.e., evaporator-condenser and direct refrigeration exchanger), this should be balanced with the controlled integration complexity of the cooling, power and gas supplies, which would be beneficial for deployment.
At nominal conditions, per million ton per annum of liquefied natural gas vaporization capacity, approximately 16.3 MWth and 4.4 MWe of space cooling and net electrical power could be generated, respectively, at effective 32.7% and 35.4% first-law and exergy efficiencies, respectively. Compared with reference (standard) supply technologies, the corresponding yearly electricity savings would amount 74 GWhe per million ton per annum of liquefied natural gas regasified, which is equivalent to primary energy savings of 11.1 kton of natural gas and a carbon abatement of 30.4 kton of carbon dioxide-equivalent. The yearly net economic benefits range from 0.9 to 4.7 MUSD per million ton per annum of liquefied natural gas regasified at local subsidized and international electricity market prices, respectively, with corresponding payback periods of 1.7 and 2.5 years, respectively.
The following conclusions were drawn regarding the sensitivity of the system useful outputs and effective efficiencies to design/operating parameters:
- The total cooling output can be augmented mainly by increasing the heat source temperature, setting the natural gas expander pressure ratio with an optimum range, and using an efficient natural gas expander.
- The useful power output can be augmented mainly by increasing the heat source temperature, reducing the natural gas expander pressure ratio, and using an efficient Kalina sub-system turbine.
- The effective first-law and exergy efficiencies can be improved mainly by increasing the heat source temperature, and using an efficient Kalina sub-system turbine and natural gas expander. In addition, increasing the natural gas expander pressure ratio improves effective first-law efficiency, whereas an optimum range of pressure ratios is required for optimal effective exergy efficiency.
Based on the analysis presented, the proposed poly-generation concept could contribute to effective and economically viable utilization of low-temperature heat and excess cryogenic cold, towards less carbon-intensive municipal air-conditioning, electricity, and fuel supplies in high ambient temperature regions.
Author Contributions
D.S.A.: Conceptualization, Data curation, Formal analysis, Investigation, Methodology, Software, Validation, Visualization, Writing—original draft. V.E.: Conceptualization, Data curation, Formal analysis, Investigation, Visualization, Funding acquisition, Methodology, Project administration, Resources, Supervision, Visualization, Writing—review & editing. All authors have read and agreed to the published version of the manuscript.
Funding
This research was funded by Khalifa University, with a legacy grant from The Petroleum Institute, grant number LTR 14502, and the APC was funded by the second author.
Conflicts of Interest
The authors declare no conflict of interest.
Nomenclature
Abbreviations
| ABS-EVA | absorber-evaporator |
| APC | absorption power-cooling |
| DC | district cooling |
| EVA | evaporator |
| EVA-CON | evaporator-condenser |
| EXP | LNG expander |
| FSRU | floating storage and regasification unit |
| GEN | electric generator |
| GHG | greenhouse gas |
| HTREC | high-temperature recuperator |
| HS | heat source |
| KC | Kalina cycle |
| LNG | liquefied natural gas |
| LTREC | low-temperature recuperator |
| MIX | mass flow stream mixer |
| MTPA | million ton per annum |
| NG | natural gas |
| ORC | organic Rankine cycle |
| PUMP | LNG pump |
| RHX | refrigeration heat exchanger |
| SEP | vapor-liquid separator |
| SEV | solution expansion valve |
| SP | solution pump |
| TUR | ammonia turbine |
| VCC | vapor compression chiller |
Main Notations
| A | surface area (m2) |
| CAF | capital annuity factor (-) |
| COP | coefficient of performance (-) |
| DPBP | discounted payback period (year) |
| DR | yearly discount rate (%) |
| EC | specific emissions cost (USD/kgCO2) |
| EF | specific emission factor (kgCO2-eq/kWh) |
| ex | specific exergy (kJ/kg) |
| exergy flow rate (kW) | |
| F | correction factor (-) |
| FC | fixed capital investment (USD) |
| h | specific enthalpy (kJ/kg) |
| i | yearly discount rate (-) |
| IRR | internal rate of return (%) |
| I/T | insurance and taxes (USD) |
| LMTD | log mean temperature difference (K) |
| M | molar mass (kg/kmol) |
| MP | electricity market price (USD/kWh) |
| mass flow rate (kg/s) | |
| n | number of time periods (year) |
| NPV | net present value (USD) |
| OH | overhead cost (USD) |
| OL | operating life (years) |
| O/M | operating and maintenance cost (USD) |
| OT | yearly operating time (hours) |
| p | pressure (kPa or bar) |
| pr | pressure ratio (-) |
| heat transfer rate (kW) | |
| q | vapor quality (-) |
| R | cooling-to-power ratio (-) or net cash inflow (USD) |
| direct-to-indirect cooling ratio (-) | |
| s | specific entropy (kJ/kg·K) |
| SEP | net specific equivalent power (kWh/tonLNG) |
| entropy rate (kW) | |
| t | temperature (°C or K) or time period index (-) |
| entropic average temperature (K) | |
| U | overall heat transfer coefficient (kW/m2·K) |
| electrical or mechanical power (kW) | |
| WC | working capital (USD) |
| y | non-dimensional exergy destruction (-) |
| z | ammonia mass fraction (-) |
Subscripts
| abs-eva | absorber-evaporator |
| cf | chilled fluid |
| ch | chemical |
| chiller | vapor compression chiller |
| cw | cooling water |
| D | destruction or destroyed |
| eff | effective |
| el | electrical |
| eva | evaporator |
| eva-con | evaporator-condenser |
| ex | exergy |
| exp | LNG expander |
| F | fuel |
| gen | electric generator or generation |
| hs | heat source |
| i | component (i.e., species) index |
| IN | inlet |
| L | loss |
| lmtd | log mean temperature difference |
| mech | mechanical |
| net | net |
| OUT | outlet |
| P | product |
| ph | physical |
| pump | LNG pump |
| ref | refrigeration |
| rev | reversible |
| rhx | refrigeration heat exchanger |
| sp | solution pump |
| sys | system |
| tur | turbine |
| u | unit |
| 0 | reference state |
| I | first |
| II | second |
Greek Symbols
| Δ | difference |
| εu | unit efficiency (-) |
| η | system efficiency (-) |
| ∑ | summation |
Appendix A
Mass and energy relations, and exergy relations for the poly-generation system units are given in Table A1 and Table A2, respectively. The definitions of the fuel and products for EVA-CON, LTREC, and RHX in Table A2 consider that heat transfer in these refrigeration heat exchangers occurs below the temperature of the environment, T0. These heat exchangers cool their hot stream by their cold stream, and exergy is transferred from the cold to the hot stream. Consequently, the fuel and product for these units are considered to be the exergy change of the cold and hot streams through the unit, respectively [38]. In HTREC, heat transfer occurs across the environmental temperature, T0, and consequently an exergy efficiency for this unit may not be meaningfully defined [38].
Table A1.
Mass and energy relations for the poly-generation system components [38].
Table A1.
Mass and energy relations for the poly-generation system components [38].
| Component | Energy Relation | Mass Relation |
|---|---|---|
| EVA-CON | ||
| KC EVA | ||
| KC HTREC | ||
| KC LTREC | ||
| KC MIX | ||
| KC SEP | ||
| KC SEV | ||
| KC SP | ||
| KC TUR | ||
| GEN1 | N/A | |
| GEN2 | N/A | |
| LNG EXP | ||
| LNG PUMP | ||
| RHX | ||
| Chiller (VCC) |
Table A2.
Exergy relations for the poly-generation system components.
Table A2.
Exergy relations for the poly-generation system components.
| Component | ||||
|---|---|---|---|---|
| EVA-CON a [38,71] | --- | |||
| KC EVA [36,38] | --- | |||
| KC HTREC b [36,38] | --- | --- | --- | |
| KC LTREC a [38] | --- | |||
| KC MIX [24] | --- | |||
| KC SEP [36] | --- | |||
| KC SEV [22] | --- | |||
| KC SP [36,38] | --- | |||
| KC TUR [36,38] | --- | |||
| GEN1 [38] | --- | |||
| GEN2 [38] | --- | |||
| LNG EXP [38] | --- | |||
| LNG PUMP [38] | --- | |||
| RHX a [38] | --- | |||
| Chiller (VCC) [38] | + |
Note: Heat transfer occurring a below and b across the temperature of the environment, T0.
References
- Intergovernmental Panel on Climate Change (IPCC). Climate Change 2014: Mitigation of Climate Change; Edenhofer, O.R., Pichs-Madruga, Y., Sokona, E., Farahani, S., Kadner, K., Seyboth, A., Adler, I., Baum, S., Brunner, P., Eickemeier, B., et al., Eds.; Contribution of Working Group III to the Fifth Assessment Report of the Intergovernmental Panel on Climate Change; Cambridge University Press: Cambridge, UK; New York, NY, USA, 2014. [Google Scholar]
- Isaac, M.; Van Vuuren, D.P. Modeling global residential sector energy demand for heating and air conditioning in the context of climate change. Energy Policy 2009, 37, 507–521. [Google Scholar] [CrossRef]
- European Commission. An EU Strategy on Heating and Cooling, COM (2016) 51 Final, Brussels, 16.2.2016. Available online: http://ec.europa.eu/energy/sites/ener/files/documents/1_EN_ACT_part1_v14.pdf (accessed on 20 July 2020).
- Dinçer, I.; Zamfirescu, C. Sustainable Energy Systems and Applications; Springer: New York, NY, USA, 2011; ISBN 9780387958606. [Google Scholar]
- Eveloy, V.; Ayou, D.S. Sustainable district cooling systems: Status, challenges, and future opportunities, with emphasis on cooling-dominated regions. Energies 2019, 12, 235. [Google Scholar] [CrossRef] [Green Version]
- Fujii, S.; Furubayashi, T.; Nakata, T. Design and Analysis of District Heating Systems Utilizing Excess Heat in Japan. Energies 2019, 12, 1202. [Google Scholar] [CrossRef] [Green Version]
- Werner, S. International review of district heating and cooling. Energy 2017, 137, 617–631. [Google Scholar] [CrossRef]
- Gomez, M.R.; Garcia, R.F.; Gomez, J.R.; Carril, J.C. Review of thermal cycles exploiting the exergy of liquefied natural gas in the regasification process. Renew. Sustain. Energy Rev. 2014, 38, 781–795. [Google Scholar] [CrossRef]
- Invernizzi, C.M.; Iora, P. The exploitation of the physical exergy of liquid natural gas by closed power thermodynamic cycles: An overview. Energy 2016, 105, 2–15. [Google Scholar] [CrossRef]
- Mehrpooya, M.; Sharifzadeh, M.M.M.; Katooli, M.H. Thermodynamic analysis of integrated LNG regasification process configurations. Prog. Energy Combust. Sci. 2018, 69, 1–27. [Google Scholar] [CrossRef]
- Zhang, X.; He, M.; Zhang, Y. A review of research on the Kalina cycle. Renew. Sustain. Energy Rev. 2012, 16, 5309–5318. [Google Scholar] [CrossRef]
- Ma, Z.; Bao, H.; Roskilly, A.P. Principle investigation on advanced absorption power generation cycles. Energy Convers. Manag. 2017, 150, 800–813. [Google Scholar] [CrossRef]
- Kim, K.H. Thermodynamic analysis of kalina based power and cooling cogeneration cycle employed once through configuration. Energies 2019, 12, 1536. [Google Scholar] [CrossRef] [Green Version]
- Kim, K.H.; Han, C.H.; Ko, H.J. Comparative thermodynamic analysis of kalina and kalina flash cycles for utilizing low-grade heat sources. Energies 2018, 11, 3311. [Google Scholar] [CrossRef] [Green Version]
- Dominković, D.F.; Rashid, K.A.; Romagnoli, A.; Pedersen, A.S.; Leong, K.C.; Kraja, G.; Duic, N. Potential of district cooling in hot and humid climates. Appl. Energy 2017, 208, 49–61. [Google Scholar] [CrossRef] [Green Version]
- Mugnini, A.; Coccia, G.; Polonara, F.; Arteconi, A. Potential of District Cooling Systems: A Case Study on Recovering Cold Energy from Liquefied Natural Gas Vaporization. Energies 2019, 12, 3027. [Google Scholar] [CrossRef] [Green Version]
- Atienza-Márquez, A.; Bruno, J.C.; Coronas, A. Cold recovery from LNG-regasification for polygeneration applications. Appl. Therm. Eng. 2018, 132, 463–478. [Google Scholar] [CrossRef]
- Atienza-Márquez, A.; Bruno, J.C.; Akisawa, A.; Nakayama, M.; Coronas, A. Fluids selection and performance analysis of a polygeneration plant with exergy recovery from LNG-regasification. Energy 2019, 176, 1020–1036. [Google Scholar] [CrossRef]
- Ayou, D.S.; Eveloy, V. Sustainable multi-generation of district cooling, electricity, and regasified LNG for cooling-dominated regions. Sustain. Cities Soc. 2020, 60, 102219. [Google Scholar] [CrossRef]
- Ayou, D.S.; Eveloy, V. Energy, exergy and exergoeconomic analysis of an ultra low-grade heat-driven ammonia-water combined absorption power-cooling cycle for district space cooling, sub-zero refrigeration, power and LNG regasification. Energy Convers. Manag. 2020, 213, 112790. [Google Scholar] [CrossRef]
- Pan, Z.; Zhang, L.; Zhang, Z.; Shang, L.; Chen, S. Thermodynamic analysis of KCS/ORC integrated power generation system with LNG cold energy exploitation and CO2 capture. J. Nat. Gas Sci. Eng. 2017, 46, 188–198. [Google Scholar] [CrossRef]
- Ghaebi, H.; Namin, A.S.; Rostamzadeh, H. Exergoeconomic optimization of a novel cascade Kalina/Kalina cycle using geothermal heat source and LNG cold energy recovery. J. Clean. Prod. 2018, 189, 279–296. [Google Scholar] [CrossRef]
- Sadaghiani, M.S.; Ahmadi, M.H.; Mehrpooya, M.; Pourfayaz, F.; Feidt, M. Process development and thermodynamic analysis of a novel power generation plant driven by geothermal energy with liquefied natural gas as its heat sink. Appl. Therm. Eng. 2018, 133, 645–658. [Google Scholar] [CrossRef]
- Ghaebi, H.; Parikhani, T.; Rostamzadeh, H. Energy, exergy and thermoeconomic analysis of a novel combined cooling and power system using low-temperature heat source and LNG cold energy recovery. Energy Convers. Manag. 2017, 150, 678–692. [Google Scholar] [CrossRef]
- Zhang, L.; Pan, Z.; Zhang, Z.; Shang, L.; Wen, J.; Chen, S. Thermodynamic and Economic Analysis between Organic Rankine Cycle and Kalina Cycle for Waste Heat Recovery from Steam-Assisted Gravity Drainage Process in Oilfield. J. Energy Resour. Technol. 2018, 140, 122005. [Google Scholar] [CrossRef]
- Emadi, M.A.; Pourrahmani, H.; Moghimi, M. Performance evaluation of an integrated hydrogen production system with LNG cold energy utilization. Int. J. Hydrogen Energy 2018, 43, 22075–22087. [Google Scholar] [CrossRef]
- Abbasi, H.R.; Pourrahmani, H.; Yavarinasab, A.; Emadi, M.A.; Hoorfar, M. Exergoeconomic optimization of a solar driven system with reverse osmosis desalination unit and phase change material thermal energy storages. Energy Convers. Manag. 2019, 199, 112042. [Google Scholar] [CrossRef]
- Kumar, L.; Hasanuzzamana, M.; Rahim, N.A. Global advancement of solar thermal energy technologies for industrial process heat and its future prospects: A review. Energy Convers. Manag. 2019, 195, 885–908. [Google Scholar] [CrossRef]
- Chan, C.W.; Ling-Chin, J.; Roskilly, A.P. A review of chemical heat pumps, thermodynamic cycles and thermal energy storage technologies for low grade heat utilisation. Appl. Therm. Eng. 2013, 50, 1257–1273. [Google Scholar] [CrossRef]
- Varma, G.V.P.; Srinivas, T. Power generation from low temperature heat recovery. Renew. Sustain. Energy Rev. 2017, 75, 402–414. [Google Scholar] [CrossRef]
- Ogriseck, S. Integration of Kalina cycle in a combined heat and power plant, a case study. Appl. Therm. Eng. 2009, 29, 2843–2848. [Google Scholar] [CrossRef] [Green Version]
- García, R.F.; Carril, J.C.; Gomez, J.R.; Gomez, M.R. Combined cascaded Rankine and direct expander based power units using LNG (liquefied natural gas) cold as heat sink in LNG regasification. Energy 2016, 105, 16–24. [Google Scholar] [CrossRef]
- International Gas Union (IGU). 2019 IGU World LNG Report. 2019. Available online: https://www.igu.org/sites/default/files/node-news_item-field_file/IGU%20Annual%20Report%202019_23%20loresfinal.pdf (accessed on 20 July 2020).
- Herold, K.E.; Radermacher, R.; Klein, S.A. Absorption Chillers and Heat Pumps, 2nd ed.; CRC Press Inc.: Boca Raton, FL, USA, 2016. [Google Scholar]
- Shi, X.; Che, D. A combined power cycle utilizing low-temperature waste heat and LNG cold energy. Energy Convers. Manag. 2009, 50, 567–575. [Google Scholar] [CrossRef]
- Zare, V.; Mahmoudi, S.M.; Yari, M. On the exergoeconomic assessment of employing Kalina cycle for GT-MHR waste heat utilization. Energy Convers. Manag. 2015, 90, 364–374. [Google Scholar] [CrossRef]
- Szargut, J. Exergy Method: Technical and Ecological Applications; WIT Press: Southampton, UK, 2005. [Google Scholar]
- Bejan, A.; Tsatsaronis, G.; Moran, M.J. Thermal Design and Optimization; John Wiley & Sons, Inc.: New York, NY, USA, 1996. [Google Scholar]
- Kotas, T.J. The Exergy Method of Thermal Plant Analysis; Krieger Publishing: Malabar, FL, USA, 1995. [Google Scholar]
- Zare, V.; Mahmoudi, S.M.S.; Yari, M. Ammonia-water cogeneration cycle for utilizing waste heat from the GT-MHR plant. Appl. Therm. Eng. 2012, 48, 176–185. [Google Scholar] [CrossRef]
- Gebreslassie, B.H.; Gonzalo, G.G.; Laureano, J.; Dieter, B. Design of environmentally conscious absorption cooling systems via multi-objective optimization and life cycle assessment. Appl. Energy 2009, 86, 1712–1722. [Google Scholar] [CrossRef]
- Gebreslassie, B.H.; Medrano, M.; Mendes, F.; Boer, D. Optimum heat exchanger area estimation using coefficients of structural bonds: Application to an absorption chiller. Int. J. Refrig. 2010, 33, 529–537. [Google Scholar] [CrossRef]
- Mosaffa, A.H.; Mokarram, N.H.; Farshi, L.G. Thermo-economic analysis of combined different ORCs geothermal power plants and LNG cold energy. Geothermics 2017, 65, 113–125. [Google Scholar] [CrossRef]
- Mosaffa, A.H.; Hasani Mokarram, N.; Garousi Farshi, L. Thermoeconomic analysis of a new combination of ammonia/water power generation cycle with GT-MHR cycle and LNG cryogenic exergy. Appl. Therm. Eng. 2017, 124, 1343–1353. [Google Scholar] [CrossRef]
- Ersoy, H.K.; Demirpolat, S.O. Using liquefied natural gas cold energy for power generation: Case study for Marmara Ereglisi receiving terminal. J. Energy Inst. 2009, 82, 11–19. [Google Scholar] [CrossRef]
- Demirkaya, G.; Vasquez Padilla, R.; Yogi Goswami, D.; Stefanakos, E.; Rahman, M.M. Analysis of a combined power and cooling cycle for low-grade heat sources. Int. J. Energy Res. 2011, 35, 1145–1157. [Google Scholar] [CrossRef]
- American Society of Heating, Refrigerating and Air-Conditioning Engineers (ASHRAE). ASHRAE District Cooling Guide; ASHRAE: Atlanta, GA, USA, 2013; ISBN 9781936504428. [Google Scholar]
- Vijayaraghavan, S.; Goswami, D.Y. On Evaluating Efficiency of a Combined Power and Cooling Cycle. J. Energy Resour. Technol. 2003, 125, 221–227. [Google Scholar] [CrossRef]
- Vasquez Padilla, R.; Ramos Archibold, A.; Demirkaya, G.; Besarati, S.; Yogi Goswami, D.; Rahman, M.M.; Stefanakos, E.L. Performance Analysis of a Rankine Cycle Integrated with the Goswami Combined Power and Cooling Cycle. J. Energy Resour. Technol. 2012, 134. [Google Scholar] [CrossRef]
- Lior, N.; Zhang, N. Energy, exergy, and Second Law performance criteria. Energy 2007, 32, 281–296. [Google Scholar] [CrossRef]
- Jensen, J.K.; Markussen, W.B.; Reinholdt, L.; Elmegaard, B. Exergoeconomic optimization of an ammonia-water hybrid absorption-compression heat pump for heat supply in a spray-drying facility. Int. J. Energy Environ. Eng. 2015, 6, 195–211. [Google Scholar] [CrossRef] [Green Version]
- Peters, M.S.; Timmerhaus, K.D.; West, R.E. Plant Design and Economics for Chemical Engineers, 5th ed.; McGraw-Hill: New York, NY, USA, 2003. [Google Scholar]
- Vatavuk, W.M. Updating the CE Plant Cost Index. Chem. Eng. 2002, 109, 62–70. Available online: https://chemeng.queensu.ca/courses/CHEE332/files/UpdatingtheCEPlantCostIndex.pdf (accessed on 20 July 2020).
- Chemical Engineering. Access Intelligence. Available online: www.chemengonline.com/pci-home (accessed on 20 July 2020).
- Modi, A.; Haglind, F.; Clausen, L.R.; Wieland, C. Numerical Evaluation of the Kalina Cycle for Concentrating Solar Power Plants. Ph.D. Thesis, Technical University of Denmark, Kongens Lyngby, Denmark, 2015. [Google Scholar]
- U.S. Energy Information Administration. Electric Power Monthly. Available online: https://www.eia.gov/electricity/monthly/epm_table_grapher.php?t=epmt_5_03 (accessed on 20 July 2020).
- Abu Dhabi Distribution Company (ADDC). Water & Electricity Tariffs. 2020. Available online: https://www.addc.ae/en-US/business/Pages/RatesAndTariffs2018.aspx (accessed on 20 July 2020).
- Sy, C.L.; Aviso, K.B.; Ubando, A.T.; Tan, R.R. Target-oriented robust optimization of polygeneration systems under uncertainty. Energy 2016, 116, 1334–1347. [Google Scholar] [CrossRef]
- Dorj, P. Thermoeconomic Analysis of a New Geothermal Utilization CHP Plant. Master’s Thesis, University of Iceland, Reykjavik, Iceland, 2005. [Google Scholar]
- Mosaffa, A.H.; Garousi Farsi, L.; Infante Ferreira, C.A.; Rosen, M.A. Exergoeconomic and environmental analyses of CO2/NH3 cascade refrigeration systems equipped with different types of flash tank intercoolers. Energy Convers. Manag. 2016, 117, 442–453. [Google Scholar] [CrossRef] [Green Version]
- Guo-Yan, Z.; En, W.; Shan-Tung, T. Techno-economic study on compact heat exchangers Zhou. Int. J. Energy Res. 2008, 32, 1119–1127. [Google Scholar] [CrossRef]
- Querol, E.; Gonzalez-Regueral, B.; García-Torrent, J.; Ramos, A. Available power generation cycles to be coupled with the liquid natural gas (LNG) vaporization process in a Spanish LNG terminal. Appl. Energy 2011, 88, 2382–2390. [Google Scholar] [CrossRef]
- Jana, K.; De, S. Sustainable polygeneration design and assessment through combined thermodynamic, economic and environmental analysis. Energy 2015, 91, 540–555. [Google Scholar] [CrossRef]
- Mondol, J.D.; Carr, C. Techno-economic assessments of advanced Combined Cycle Gas Turbine (CCGT) technology for the new electricity market in the United Arab Emirates. Sustain. Energy Technol. Assess. 2017, 19, 160–172. [Google Scholar] [CrossRef]
- Treyer, K.; Bauer, C. The environmental footprint of UAE’s electricity sector: Combining life cycle assessment and scenario modeling. Renew. Sustain. Energy Rev. 2016, 55, 1234–1247. [Google Scholar] [CrossRef]
- Eveloy, V.; Rodgers, P.; Popli, S. Trigeneration scheme for a natural gas liquids extraction plant in the Middle East. Energy Convers. Manag. 2014, 78, 204–218. [Google Scholar] [CrossRef]
- Luckow, P.; Stanton, E.A.; Fields, S.; Biewald, B.; Jackson, S.; Fischer, J.; Wilson, R. 2015 Carbon Dioxide Price Forecast; Synapse Energy Economics: Cambridge, MA, USA, 2015; Available online: http://www.synapse-energy.com/sites/default/files/2015%20Carbon%20Dioxide%20Price%20Report.pdf (accessed on 20 July 2020).
- NERA Economic Consulting. Macroeconomic Impacts of LNG Exports from the United States; NERA Economic Consulting: Washington, DC, USA, 2012. Available online: https://energy.gov/sites/prod/files/2013/04/f0/nera_lng_report.pdf (accessed on 20 July 2020).
- Morosuk, T.; Tsatsaronis, G. LNG—Based Cogeneration Systems: Evaluation Using Exergy-Based Analyses. In Natural Gas Extraction to End Use; Gupta, S., Ed.; Intech Open: London, UK, 2012; Chapter 11; pp. 235–266. ISBN 978-953-51-0820-7. [Google Scholar] [CrossRef] [Green Version]
- International Renewable Energy Agency (IRENA). Renewable Energy Markey Analysis: GCC (2019). Available online: https://www.irena.org/-/media/Files/IRENA/Agency/Publication/2019/Jan/IRENA_Market_Analysis_GCC_2019.pdf (accessed on 20 July 2020).
- Kordlar, M.A.; Mahmoudi, S.M.S. Exergoeconomic analysis and optimization of a novel cogeneration system producing power and refrigeration. Energy Convers. Manag. 2017, 134, 208–220. [Google Scholar] [CrossRef]
© 2020 by the authors. Licensee MDPI, Basel, Switzerland. This article is an open access article distributed under the terms and conditions of the Creative Commons Attribution (CC BY) license (http://creativecommons.org/licenses/by/4.0/).