Article

The Effect of SMiShing Attack on Security of Demand Response Programs

by
Elif Ustundag Soykan
1,* and
Mustafa Bagriyanik
2
1
Ericsson Research, Istanbul 34467, Turkey
2
Department of Electrical Engineering, Istanbul Technical University, Istanbul 34467, Turkey
*
Author to whom correspondence should be addressed.
Energies 2020, 13(17), 4542; https://doi.org/10.3390/en13174542
Submission received: 22 June 2020 / Revised: 5 August 2020 / Accepted: 25 August 2020 / Published: 2 September 2020
(This article belongs to the Special Issue Cybersecurity in Smartgrids)

Abstract

:
Demand response (DR) is a vital element for a reliable and sustainable power grid. Consumer behavior is a key factor in the success of DR programs. In this study, we focus on how consumer reaction to Short Messaging Service (SMS) messages can disturb the demand response. We present a new type of threat to DR programs using SMS phishing attacks. We follow a holistic approach starting from a risk assessment focusing on DR programs’ notification message security following the Smart Grid Information Security (SGIS) risk methodology. We identify threats, conduct impact analysis, and estimate the likelihood of the attacks for various attacker types and motivations. We implemented deterministic and randomized attack scenarios to demonstrate the success of the attack using a state-of-the-art simulator on the IEEE European Low Voltage Feeder Test System. Simulations show that the attack results in local outages, which may lead to large-scale blackouts with the cascading effect on the power system. We conclude that this is a new type of threat that has been overlooked, and it deserves more attention as mobile devices will continually be part of our lives.

1. Introduction

Demand Response (DR) is a way to manage consumer demand that allows balance to persist on the grid. DR programs enable DR for the timely adjustment of the demand by encouraging consumers. They comprise the planned and implemented methodologies to balance demand with the supply by guiding consumers to alter their consumption with price-based or incentive-based programs. Price-based methods [1] aim to balance the consumption of the peak periods by adopting hourly-basis prices to reflect the real-time cost to the consumers while incentive-based programs guide consumers to reduce their consumption by offering special rewards to manage excessive demand.
DR can be carried out automatically or manually. In automated DR, utility communicates with the consumer over energy management signals when the DR event happens. Consumers do not need to take any action. In manual DR, consumers are informed via utility using some notification methods, e.g., SMS. The decision to react to the DR event is up to the consumer. In our study, we focused on manual DR. DR can also be used to preserve the operational balance of the power grid. For example, when a contingency occurs, an emergency event-driven-based DR scheme [2] or comfort-constrained DR scheme [3] can take place to keep the balance.
While DR programs are very effective to save the peak demand (up to 20% according to “US Federal Energy Regulatory Commission’s report” [4]), consumer involvement is key to the success of any DR program as well as the other planning and execution parameters. According to a survey conducted by Smart Electric Power Alliance (SEPA) together with 155 utilities, consumers desire more control over their consumption and information about DR events via mobile access [5]. One way to increase the consumer interest to the DR programs via incentives is by using notification messages via some end-point interaction methods. There are different types of DR notification messages. Some of them aim just to give information about their power consumption via commercial products like Energy Detective while some messages aim to direct users to change their usage for energy saving by giving them monetary incentives which can be SMS-based [6] notifications or tablet-based wall displays that are installed residents’ houses.
SMS-based messages are the most effective notifications for DR programs according to studies conducted in [7,8]. Some of the reasons are: reaching the customer about events is fast as everyone carries mobile phones, event participation is high, and it requires no additional cost for customers. Additionally, from the grid operator point of view, SMS can be integrated into any kind deployment, either legacy or smart grid. DR programs play a very important role in the stability of the smart grid via balancing the phase loads, individual or group of customer’s loads. Therefore, any type of malfunctioning on the DR affects the health of the power grid. Cyber-physical attacks are one of those several reasons that might affect the functionality of DR programs. Disclosure, spoofing, tampering, and malware injection attacks are known and studied attacks that may target the DR network [9]. On the other hand, social engineering attacks [10] with the objective of exploiting the customer have not been considered in the literature to the best of our knowledge. Therefore, we focus on analyzing the effects of phishing attacks that rely on SMS architecture. Taking on the holistic approach, a risk assessment for the DR use case to understand the severeness of the attack is performed. We adopted and enhanced the SGIS approach [11] which addresses the domain-specific risk assessment methodology for the smart grid.
Social engineering attacks against an organization or a critical system aim to exploit people’s natural tendency to trust others. SMiShing (short for SMS Phishing) [10] is a type of social engineering attack that encourages users to take an action depending on the target, e.g., click on a link or behave accordingly. SMiShing attacks make use of peoples’ confidence in their phones as they are authentic-looking. Generally, a threat coming through an SMS message is not expected by users which makes SMiShing attacks easy to exploit. There are technical and habitual obstacles that make SMiShing attacks viable and more dangerous than their web-based relatives: Links included in the SMS messages cannot be verified like in the e-mail phishing cases by the user since hovering on URL is not possible. Shortened and aliased URL usage (e.g., tiny URL, bitly) is very common for SMS messages. Thus, users mostly satisfy their curiosity by just clicking the link. Users easily comply with requests given by the parties with more authority than they have. Once they commit to DR participation, they are more willing to comply with consistent requests when they receive SMS messages from the utility-looking sender. In addition, prevention methods provided for web-based phishing attempts like spam filters are not applicable for SMiShing attacks and current proposals are not practical.
In this study, we aim to show how the grid could be affected by the outsider attacks which do not stem from the well-known sources. We introduce a new type of attack surface using SMS phishing messages that were not receiving attention beforehand and name them Disturbing DR via SMiShing (DDRS) attacks.
The main contributions of the study are as follows,
  • We determined that SMiShing attacks can damage the power grid through customer behavior by victimizing customers even if the attacker has no access to the power grid communication domain. We show the effects of DDRS attacks on the LV grid which is the first evaluation of this kind.
  • We performed the risk assessment and enhanced the methodology as it is needed: The SGIS risk assessment methodology does not provide any likelihood analysis method; rather, it refers to the HM/IS1 standard’s [12] method. It gives suggestions on the threat factors in [9] without considering vulnerability. To improve this deficiency, both the SGIS methodology and OWASP (Open Web Application Security Project) [13] methodology are combined and adopted into a five-scale approach that considers the likelihood analysis in a broader sense.
  • Risk assessment of the DR use case for the SMiShing attack is performed: In order to understand how a SMiShing attack would affect the grid asset, what the probability of a specific threat scenario to happen is, and how to react if that attack occurs, we carried out a risk assessment on the DR use case for SMiShing attacks, shown in the background section.
  • SMiShing attacks for SMS notification-based DR programs are modeled: We reveal that DDRS attacks are geared toward outages on the power grid. Attacks are simulated on a test system to analyze the reaction of the system under attack. The European Low Voltage Feeder Test System provided by IEEE [14] is utilized for deterministic and randomized attack models.
  • We provide possible countermeasures for the identified risk, for both the utility and customer perspective: we provide some solutions on how the utilities should handle the attack, how they should interact with the customer to prevent DDRS attacks, what kind of preventive actions they can take on the power grid to mitigate the DDRS attacks, and what the customer should do to protect themselves from SMiShing attacks.
The most important feature of our attack is that the attacker does not need to reach any smart grid device physically or remotely, nor compromise connected devices [15], nor gather an IoT botnet [16]; rather, he just needs a way to send SMS messages to customers. Knowing how widely used mobile phones are and the increase of phishing attacks, this type of attack is viable and may become reality.
The paper continues with the related works undertaken in the field shown in Section 2. Section 3 provides background on DR use case and SMiShing attacks. In Section 4, the risk assessment of the DDRS attacks is presented. Section 5 presents the simulation and the impact of the attack on the power grid using an open-source power flow solver. Section 6 discusses the mitigations, and we conclude the study in Section 7.

2. Related Work

Related works are discussed in three categories; load altering attacks, false injection attacks, and IoT-based attacks, all aiming to create an imbalance on the grid. There are also several works focusing on cyber-security aspects [17,18] proposing the use of blockchain technologies or efficient authentication schemes on the grid; readers are referred to related studies.
In [19], Mohsenian-Rad et al. studied different internet-based attack surfaces that lead to load-altering attacks (LAA), which damage the grid via circuit overflow or creating an imbalance between demand and supply. They identified different threat sources, e.g., data centers can be an attack target since their power consumption is high. Another threat may stem from direct and indirect load control functionalities of the grid when load control command control by the attacker. They propose an optimization framework for cost-efficient load protection. Mainly, they aimed to identify the significant loads that can cause major harm to the grid with a given topology. In [20], Sajjad et al. enhanced the static attacks given in [19] by addressing dynamic changes and trajectory over time on the loads. They tested their Dynamic LAA proposal on six bus cases and presented the impact. Later, in [21], they investigated the protection schemes for the attack.
In [22], Liu et al. presented a new type of attack which they refer to as false data injection attacks, which target the state estimation in the power system. The attacker can inject malevolent values, namely the phasor measurement unit (PMU) readings, that could misguide the state estimation process so that misbehavior cannot be detected. The attacker must know the power system configuration to issue an attack. They simulated their findings on the DC system with a power flow solver, using random and targeted injections. This work was later improved by [23] Rahman et al. for nonlinear state estimations, on the AC system, but the idea remains the same. Reference [24] extends the work done in [25], adding security indices to quantify the difficulty of an attack against measurements.
In [26], Dvorkin et al. studied the effect of cyber-attacks via compromised IoT-controlled loads, more specifically modifying their consumption to yield failures, in the worst-case triggering a cascading effect. They modeled the attacker to maximize the effect of the attack both taking the transmission and distribution grid into account by varying the level of adversary impacts between the transmission and distribution grids. To simulate the effects, they described an optimization model that outputs the attacker’s modification of the net active/reactive power injection of IoT-controlled loads.
In [16], Soltan et al. presented a new type of attack based on compromising high wattage IoT devices and using them to manipulate demand, leading to disruptions on the transmission grid. They remotely turn on/off devices to launch their attack. In [26], the same authors proposed two optimization algorithms, Safe and Immune, to find optimum operating points for generators for the same type of attacks as a protection mechanism. They performed power flow simulations on the DC grid.
In [15], they presented how IoT devices, computers, and even display screens can be used to build a connected zombie network targeting to push the grid an unstable state mainly by modifying their power consumption remotely. They showed the frequency effects of the attack on the EU synchronous grid. Like in [16,26], the adversary does not need any relation between the zombie network and the power grid.
The distinctive character of our work is that it is neither needed to build an IoT botnet nor a zombie device network. We exploit the SMS functionality that is provided to every mobile phone and the interdependency between the SMS network and the power grid which are two separate networks by means of connectivity. Moreover, the impact is evaluated both using risk assessment methodology and power flow analysis. To the best of our knowledge, the work presented in our study will be the first to examine SMS-based phishing attacks and the human effect on the distribution grid.

3. Background

3.1. SMS Usage for DR

Balancing power generation and consumption to provide high availability in power service is a challenging task, where DR comes into play. DR models elaborate on the mechanisms to manage the demand from consumers in response to directions or incentives.
DR models have two categories, namely, price and incentive-based models. Price-based methods comprise real-time pricing, time of use and critical peak pricing programs and aim to balance the consumption of the peak periods by adopting hourly basis prices to reflect the real-time cost to the consumers. Incentive-based programs direct consumers to reduce their consumption by offering special rewards to manage excessive demand. One of these programs, which is called behavioral demand–response, aims to reduce consumption by encouraging customers to use less energy during peak-demand events.
Australian renewable energy agency (ARENA) has started a behavioral demand response program integrating SMS-based notification messages [8]. The program is based on the behavioral response from customers in Victoria. When there is a peak demand event, participant customers are notified and asked to voluntarily reduce their energy consumption for a set period. If participants reduce their usage, they are rewarded with a power credit. The program not only aims to lower the load during peak periods but also helps to understand how and to what extent communication technology can play a role in the residential demand response.
Incentive-based programs require communication with the customer to convey the events. The use case, given in Figure 1, aims to balance the load by sending a DR notification message via SMS to the consumer. The SMS message can be a simple one, like; “Reduce your consumption during 7–9 a.m. tomorrow”, or it can be more specific, like, “Reduce your consumption to 5 kWh during 7–9 a.m. tomorrow by switching off the TV and avoid using your air-conditioner”. In the Australian case, customers receive three different types of SMS notification messages: Heads-up SMS to remind the event, Event start SMS, Event stop SMS. These messages just indicate the timing of the events. Incentives and ways of participation are agreed with the customer during DR program enrollment.

3.1.1. Use Case Information Flow

In this section, DR use case actors and information flow are explained. Actors and related interfaces are listed below.
Customer Information System (CIS): Utility’s back-end system that stores long term information for energy customers such as contacts, meter ID, bills.
Data Concentrator (DC): A device working as an intermediary gateway between Smart Meters (SM) and the central Head End System (HES) to communicate with SM and collect meter data.
Distribution Management System (DMS): A system that provides services to monitor and control the distribution grid.
Head End System (HES): Utility’s central data system collecting consumption data from smart meters in its service area.
Meter Data Management System (MDMS): Utility’s system for managing the metering data, coming from the HES.
Utility: As stated in [27], “a natural or legal person responsible for operating, ensuring the maintenance of and, if necessary, developing the distribution system in a given area and, where applicable, its interconnections with other systems and for ensuring the long-term ability of the system to meet reasonable demands for the distribution of electricity”.
Appliances: Power consuming home devices.
Smart Meter (SM): Utility’s metering end device at customer’s premises that has bidirectional communication functionality.
Short Messaging Service (SMS) Gateway: Provides SMS application interface to the utility’s corporate server and communicates with a mobile network to deliver the message to the recipient customer.
Use case interactions are depicted in Figure 1, with the communication order given in numbered lines. The use case is triggered when the DMS detects the need for lower power consumption in a certain area. DMS then asks for information from the CIS regarding which customers have enrolled in the DR program, resulting in a reply from CIS with a list of customers. DMS checks customer’s consumption from HES, selects customers and then informs CIS which customers will be receiving SMS messages together with the content of the message. CIS prepares the SMS message content and identifies the customers’ phone numbers. Then, SMS gateway delivers the message to the customer through the mobile telecom infrastructure. When the customer receives the message, he/she decides whether to participate in the event by saving power. Note that the customer is a registered user of the utility and has already enrolled in the utility’s DR program. It is also assumed that CIS possesses required customer data.

3.1.2. SMiShing Attacks

The human element is becoming prevalent to define the security level of a network, system, or device. As they are prone to social engineering attacks, the unforeseeable low hanging fruit is the human element for the attacker’s best interest.
Phishing attacks, considering the mobile phone possession extent SMS phishing attacks, namely SMiShing attacks, are perfect instruments since they are more severe than their competitor, e-mail phishing, in terms of market availability and human behavior. To launch a SMiShing attack, attacker presence is not needed. Attackers can sit wherever they want and send fraudulent SMS messages to victims to influence them. The success of the SMiShing attacks comes from the fact that victims can carry their cellphones always and they do not have any mechanism to check the authenticity of the SMS.
In order to provide an analytic view of SMiShing victimization, we benefited from the framework provided by Cohen and Felson’s [28] Routine Activity Theory (RAT) which explains changes in crime fueled by technological developments, including the behavior of victims not just focusing solely on the offender. Hutchings et al. [29] applied RAT for phishing victimization. These studies show that RAT is a practical theoretical framework to evaluate SMiShing attacks. Consequently, the SMiShing scenario suitable to Felson’s definition of a “predatory crime” as “at least one person takes or damages the person or property of others.” Property in SMiShing case refers to the property of others, which is the distribution grid in our case. Therefore, according to RAT framework, SMiShing happens when a possible offender (attacker) is present, an appropriate target (power grid or customer) is present, and capable guardian (an actor that has the potential to discourage offenders) is absent. In order to examine RAT on SMiShing, hypotheses should be defined and then be tested.
Hypothesis 1 (H1): 
The lower the level of mobile phone experience, the lower the level of SMS messaging experience, and the higher the use of the DR program, the higher the risk for victimization.
Hypothesis 2 (H2): 
The lower the level of mobile phone experience, the lower the level of SMS messaging experience, and the higher the use of the DR program, the higher the risk for SMiShing attack.
Hypothesis 3 (H3): 
The use of mobile security or SMS filtering software reduces the risk of SMiShing attack.
Hypothesis 1 tests the relationship of three independent behavioral variables, namely mobile phone experience, SMS messaging experience and the use of the DR program, with the dependent variable, SMiShing victimization. Hypothesis 2 tests the relationship of the same three independent behavioral variables, with the dependent variable, SMiShing attack status. Hypothesis 3 is that those who use mobile security software are less likely to receive a SMiShing attack. These three hypotheses should be tested by conducting case studies with participants to see whether an individual’s mobile phone and DR experience affect how they process and comply with SMiShing attacks. This knowledge helps to target the prevention efforts to reduce the incidence of SMiShing. We limited our perspective, defining hypotheses and leaving the testing phase to further research since it requires a detailed study on its own.
There are several studies conducted periodically by security companies [30] to show how SMiShing attacks have evolved over the years. According to the reports, mobile is the new frontier for cybercrime. A total of 48% of phishing attacks are on mobile and the number of mobile phishing attacks is doubling every year. Additionally, 42% of the users click on malicious URLs from a mobile device, reported by Stanford University [31].
The extent and the impact of the attacks vary with the motivation of the attacker. Reportedly, financial benefits highly attract attackers. One of the focuses of interest is the banking sector. For example, in March 2017, three Santander customers lost a combined total of EUR 41,345.31 to a SMiShing scam [32] due to the victims’ fraud claims being refuted by their banks. The range of the attacks depends on the creativity of attackers, even confusion about a disease can be spotlighted by the attackers as studied in [33]. Recently, the health sector has faced similar attacks using the COVID-19 pandemic via several phishing means, including SMiShing. They send coronavirus-related phishing messages masquerading as trusted entities. COVID-19 SMiShing messages also follow the financial themes, especially on governments’ employment and financial support packages. For example, an SMS message masks the UK government, saying that all residents will be paid 458 GBP by the government. The attack aims to harvest the email, address, name, and banking information. They can reach large audiences by abusing people’s sensitivity towards COVID-19. Unfortunately, the impact of attacks cannot be analyzed easily since target and theme changes. Hence, we focused on this point in our work via simulating the effect with different scenarios.
What makes SMiShing attacks more dangerous than other phishing methods is human behavior and low realization effort. It is easier to trick individuals into falling for phishing attacks on mobile than it is on desktop. The reason is about trust and awareness. People are somehow aware of e-mail phishing or web-based phishing but not about SMiShing. The simulated attacks show that people are less wary when they are on their phones. Many assume that their smartphones are more secure than computers. However, smartphones have their limitations and cannot directly protect against SMiShing. There are some studies regarding SMiShing and SMS scam detection which fall into two groups. In the first one, users need to download a mobile application on their phones, this application runs a learning-based model to detect if SMS is legitimate or SMiShing via [34,35,36]. In the second approach, a whitelist or blacklist is stored on the phone to filter the sender’s caller ids [37]. Considering the usability aspect, the first approach is not practical, and it requires high awareness. The second approach is vulnerable to Caller id spoofing attacks. Additionally, SMiShing attacks require very low effort to perform. There are some free products that attackers can take advantage of. The only requirement for placing the attack is a mobile phone number list of the victims. Therefore, from the customer perspective, still, a viable solution is missing. Hence, people need to be vigilant and must pay attention to directions and information from their utilities, banks, and government agencies.

4. Risk Assessment

Risk assessment comprises the overall process of impact, likelihood analysis and risk evaluation of the identified threat to estimate the level of risk by means of the magnitude of the impact and probability of occurrence. Threats stem from weaknesses in the system leading to the circumstances that adversely impact organizational assets, individuals, and others. The impact value of the threat component is determined by evaluating how each threat source would affect the identified assets. The probability of occurrence for a specific threat in terms of attacker capabilities gives the likelihood level. The function of the impact and likelihood level gives the risk level.
There are different risk management methodologies based on the ISO27005 framework [38] such as HMG IA [12], ISO/IEC 31000 [39] and frameworks for organizational information security risk assessment. Although they are not specified for smart grid use cases, they can be used as a baseline. The Smart Grid Information Security (SGIS) risk methodology [11] was issued by the standardization bodies CEN, CENELEC and ETSI to address cybersecurity and risk assessment in smart grids regarding the M/490 Smart Grid Mandate by the European Commission. The approach is adopted by several EU funded projects, such as SPARK and SOES for smart grid use cases. Although there are some deficiencies (see Annex C of [11]) it is still the most appropriate methodology for our case. Hence, in this study, SGIS methodology is embraced for the demand response use case and the identified shortcoming in the Likelihood analysis method is fixed. In the following sections, assets are identified, then, for each asset, impact and likelihood are estimated. Using impact and likelihood levels, the risk level is evaluated. As for the scoring, we follow [11] for the sake of compliance. There are four levels and a 4 to 1 rating for the Impact and Likelihood scoring: Very High (4), High (3), Medium (2) and Low (1).

4.1. Identifying Assets

To identify the assets, all the components given in Section 3.1.1 are grouped according to the network area they belong as such:
  • CIS and MDMS are grouped as Utility Corporate Network (UCN),
  • DMS and HES are grouped as Utility Operational Network (UON),
  • SM and Appliances are grouped as Customer Network (CN),
  • SMS Gateway, Mobile Network, and Mobile Phone are grouped as SMS Network,
  • DC is considered as a separate component.
The identified threat has an impact on the UON, DC, CN. Therefore, these three components are selected as the assets for the risk assessment.

4.2. Impact Analysis

Risk impact is derived from different measurement categories and presented in five Risk Impact Levels. SGIS Impact Analysis methodology identifies five different categories: Operational (Energy, Population Infrastructure), Legal, Human, Reputational and Financial. Each category is investigated for its impacts. The financial category is neglected due to evaluation complexity. The Legal category is out of our scope since we do not focus on information leakage attacks.
EPRI provided the NESCOR study [40] which identifies the failure scenarios and impacts from smart grid domains. The possible threats sources for DR use case are excerpted as follows;
  • Publicly disclosing the private information (consumer’s power signature) on the communication channel by eavesdropping on the network.
  • Modifying or spoofing messages (e.g., smart meter last gasp message) on the communication link which may cause power loss.
  • Preventing legitimate DR messages from being retrieved and transmitted by tampering with the communication or bursting channel by other messages.
  • Compromising one or more DR system devices causing inappropriate DR messages at undesired times to be sent to unintended devices/customers.
  • Malware injection to the one or more DR system device causing malicious use of system resources (slowing down the system, sending unwanted DR messages, etc.), and unauthorized access to customer data.
These threats focus on and stem from the DR network. The NESCOR study points out social engineering attacks as well, specifically spear-phishing attacks, targeting the utility employee; however, customer-oriented attacks and their effects are not considered. In this study, the overlooked external threat source, SMiShing attacks, is identified which can be used to trigger inappropriate DR events aiming to manipulate demand and may eventually cause power loss.
The impact caused by the SMiShing attack is assessed in different aspects; energy, population, infrastructure, human, and reputation. In the energy aspect, the impact level is determined based on the loss of energy supply caused by the attack. The larger area loss impacts in a larger manner. In the population category, the scale of the people affected in the area defines the level. The size of the damages on the critical infrastructure due to power loss gives the impact level in the infrastructure category. Human category measures how power loss impacts directly or indirectly on people’s health. Utilities’ reputation is another dimension of interest that is affected by the attack. Considering all these dimensions, the impact levels are determined as in Table 1, (N/A stands for Not Applicable).

4.3. Likelihood Analysis

The SGIS methodology does not offer its own likelihood analysis method; rather, it refers to the HM/IS1 standard’s [12] method. It gives suggestions on the threat factors in [11] without considering vulnerability factors. In this study, we integrate the OWASP [13] methodology to the SGIS methodology aiming to complete the methodology so that we can handle the likelihood analysis in a broader sense. To combine the two methodologies, OWASP’s ratings are converted into a five-scale approach and calculate the likelihood with the following formula given in (1):
L i k e l i h o o d   L e v e l = ( R a t i n g   ( T h r e a t   C a p a b i l i t y + T h r e a t   I n t e r e s t   ( 1 ) + O p p o r t u n i t y + E a s e   o f   D i s c o v e r y + E a s e   o f   E x p l ) ) / 5
Considering the attacker’s capabilities and their motivations to perform an attack, the four attacker types are identified, which are Customer, Hacker, Dishonest Employee, and Terrorist actors. They differ in motivation (money, grudge, political aspects, etc.), tools used, capabilities and access privileges to the asset. Customer type is more focused on CN level assets and is unaware of the utility site, hence the likelihood level is only applicable for CN level. Contrary to this, Terrorist and Dishonest Employee types aim to attack Utility’s site. These types of attackers may know the transmission and distribution topology so that they can launch more targeted attacks. Hacker type could have penetrated in each level. Taking attacker features into account, the likelihood levels, computed according to likelihood formula, are shown in Table 2.

4.4. Risk Level

To determine the Risk Levels, we take the highest level from Table 1 and Table 2 for each asset and obtain the Impact and Likelihood Level columns in Table 3. Risk Levels are determined by multiplying the Impact and the Likelihood levels, then the result is mapped to the appropriate level as given in Table 3. We refer to [11] for the mapping. The mitigation and preventive actions should be decided by the Utilities according to the resulting Risk Levels.

5. Attack Scenario and Simulation Results

5.1. Simulation Environment

We simulated DDRS attacks to investigate their effects on the distribution grid via power flow analysis using Gridlab-D [41] which is an open-source power system simulation and analysis tool. IEEE European Low Voltage Test Feeder is employed to run our simulations which serves as a benchmark for researchers working on behavioral analysis of low voltage grid.
We implemented the test system on Gridlab-D and ran with its default parameters. We compared our power flow results with the results given by the test system to check if our implementation is correct. Then we amended the test case’s nominal voltage values to 230 Volt on each load and 19,918 Volt on Source Bus so that they align with the EU system as the current test cases [42] represent the North American system. The radial 0.4 kV feeder is connected to the 34.5 kV medium voltage distribution system by a transformer at a distribution substation with a base frequency of 50 Hz. The system is a typical European three-phase low voltage feeder that comprises 55 single-phase loads with its time-series load profiles based on a one-minute resolution over 24-h.

5.2. Threat Model and Attack Variations

In the threat model, the attack is formulated to created power grid disruption. Due to the nature of the SMiShing attacks, the attacker does not need to access any component of the power grid (neither power network nor IT network) that is depicted in Figure 1. An attacker, having just mobile phone numbers of customers, can benefit from a phishing software and can send fake SMS messages to start the attack. The communication medium is SMS messages and the attacker has unidirectional communication with customers means that the attacker only sends the fake SMS and no reply is required. The attacker can be any type of those given in the likelihood section providing they have a list of mobile phone numbers of the customers to conduct the attack.
The success of the attack depends on the behavior of the customers. Hence, we simulated customer behavior by running different cases. We run two cases to realize our attack simulations. The first case includes two different deterministic attack scenarios and the second case includes several randomized runs. We facilitated these cases by modifying the load profile on the simulation. For deterministic attacks, modifications are performed manually while modified loads are selected by a probabilistic distribution function for the randomized cases. Modified loads mean that the selected customers received a fake SMS message and reacted accordingly.
In the deterministic attacks, the selection of the targeted customer loads is made considering the peak times of the normal operation over 24-h simulation. We simulated the system without attacking to identify the most loaded phase and most loaded time interval. Using these, two scenarios are described. The first, Scenario 1, just attacks one customer on the system between 08:20–10:00 a.m. The second, Scenario 2, is to attack all of the customers fed on phase B which is the most loaded phase in the same interval.
In the randomized case, Scenario 3, the number of loads that will be under attack is determined according to Poisson distribution. Then, loads will be assigned randomly from 55 loads. The simulation runs several times until each load is attacked but not more than once.

5.3. Simulation of the System without Attacking

The simulation ran on normal circumstances, without attacking, is depicted in Figure 2 as time series solution of the voltage magnitude (Volt) for the Loads 1, 32, and 53. These loads are connected to different phases. Load 53 causes the biggest change, so it points the load to be attacked and the critical time interval.

5.4. Simulation of the System under Attack

In Scenario 1, the attack is launched on the selected load, Load 53, the most loaded bus on-peak time according to the outcome of the without attack run. In Scenario 2, the attack is launched on all customer loads in Phase B which is the most loaded Phase to perceive the effect of the attack scale. In Scenario 3, the loads are selected randomly according to Poisson distribution which gives the probability of a given number of events happening in a fixed interval of time. Random selection of loads represents the cases where the attacker has no prior knowledge of the consumption.
Each simulation uses load profiles that reflect the consumption for a one-day period for each customer load. The simulation is initialized so that it takes values at 00:01 a.m. then runs until 24:00 p.m. We defined the attack time interval as 100 min around the on-peak moment which is 09:28 a.m. We control the load increase or decrease with a “multiplier” parameter. The multiplier can be adjusted according to the attack target. If multiplier < 1, then attack targets decrease the load, if multiplier > 1, then attack targets increase the load. In our case, we set the multiplier to 2 to double the load during the attack. The pseudocode of the attack flow is given in Algorithm 1 below.
Algorithm 1: DDRS attack simulation
1: function: simulate_DDRS_attack()
2:  load_count = 1, multiplier = 2
3:  load_profile [1..55]=read(load_profile_files)
4:  while (load_count ! = 55)
5:  number_of_loads_to_be_attacked = poisson_rnd()
6:  for (1: number_of_loads_to_be_attacked)
7:      pick_load = rnd (1..55)
8:      for (attack_start_time: attack_end_time)
9:        new_load_profile[pick_load] = multiplier*load_profile[pick_load]
10:    end for
11:  end for
12:  write (new_load_profile [1..55])
13:  load_count = load_count + 1
14:  end while
15:  run_GridLab-D(new_load_profiles[1..55])
16:  plot_results()
17: end function
Results are analysed by means of voltage stability, line failures and phase balance as follow.

5.4.1. Voltage Stability

Figure 3 shows that the magnitude of the voltage at Load 1, Load 32, and Load 53 over the one-day period for the case we attacked on Load 53. When we compare these results with the result from that without an attack case in Figure 2, we can see that the voltage levels of Load 1 and Load 32 stay similar with normal operation values, on the other hand, voltage values on Load 53 descend as it is subjected to attack.
Figure 4 shows the magnitude of the voltage at Load 1, Load 32, and Load 53 over the one-day period for Scenario 2 that attacked all Loads on phase B. When we compare these curves with the normal operation case in Figure 2, we can see that the voltage levels of Load 1 and Load 32 stay similar because they are on different phases. On the other hand, voltage values on Load 53 descend even more comparing the first attack case which performed only one load which may cause stability problems if the voltage drop tolerance is exceeded.
Voltage stability is the capability to keep acceptable voltages in all buses in normal conditions and after disturbances. The system becomes unstable if there is an uncontrollable voltage decrease by some reason like load increment or production decrement. If the drop does not stay within the permissible range and the utility cannot stop it, voltage collapse might occur. The voltage decrease that the system can tolerate is defined as 6%. Therefore, based on the nominal voltage of our system which is 230 V, the minimum tolerable voltage is 216 V. In Scenario 1, the maximum voltage drop caused by the DDRS attack is 3% which is below 6% and within the limit. On the other hand, the maximum voltage drop in Scenario 2 is 10% which is not acceptable and may cause unwanted effects if no preventive action is applied. In different runs in Scenario 3, voltage drop changes according to which load is selected randomly; some runs preserve the healthy state while some are under 216 V.
We evaluated how the system behaves for the increasing number of customers affected by the attack in Figure 5 together with voltage drop and phase imbalance. The customers to be attacked are randomly selected. They are assumed to take the bait and increase the load accordingly. The measurements are taken at the specific bus having the most loaded customer. We set the drop threshold to 6%, indicated in the green dashed line in the figure. When the number of customers is zero, it indicates no attack case. The figure shows that voltage drop is not linear with the number of customers, such that 10 customers can cause the drop beyond the limit while 20 to 30 customers stay at the limit. The reason is that the load profile of the customers and their location on the topology directly affect the level of disruption on the system. If the customers’ load change is not major, then the attack may not cause failure and vice versa. The length of the distribution line to which the customer is connected and the number of other customers on that line affect the severeness of attack result. Voltage drop increases both as distance increases due to resistivity of the line and the number of customers increases due to feeder current.

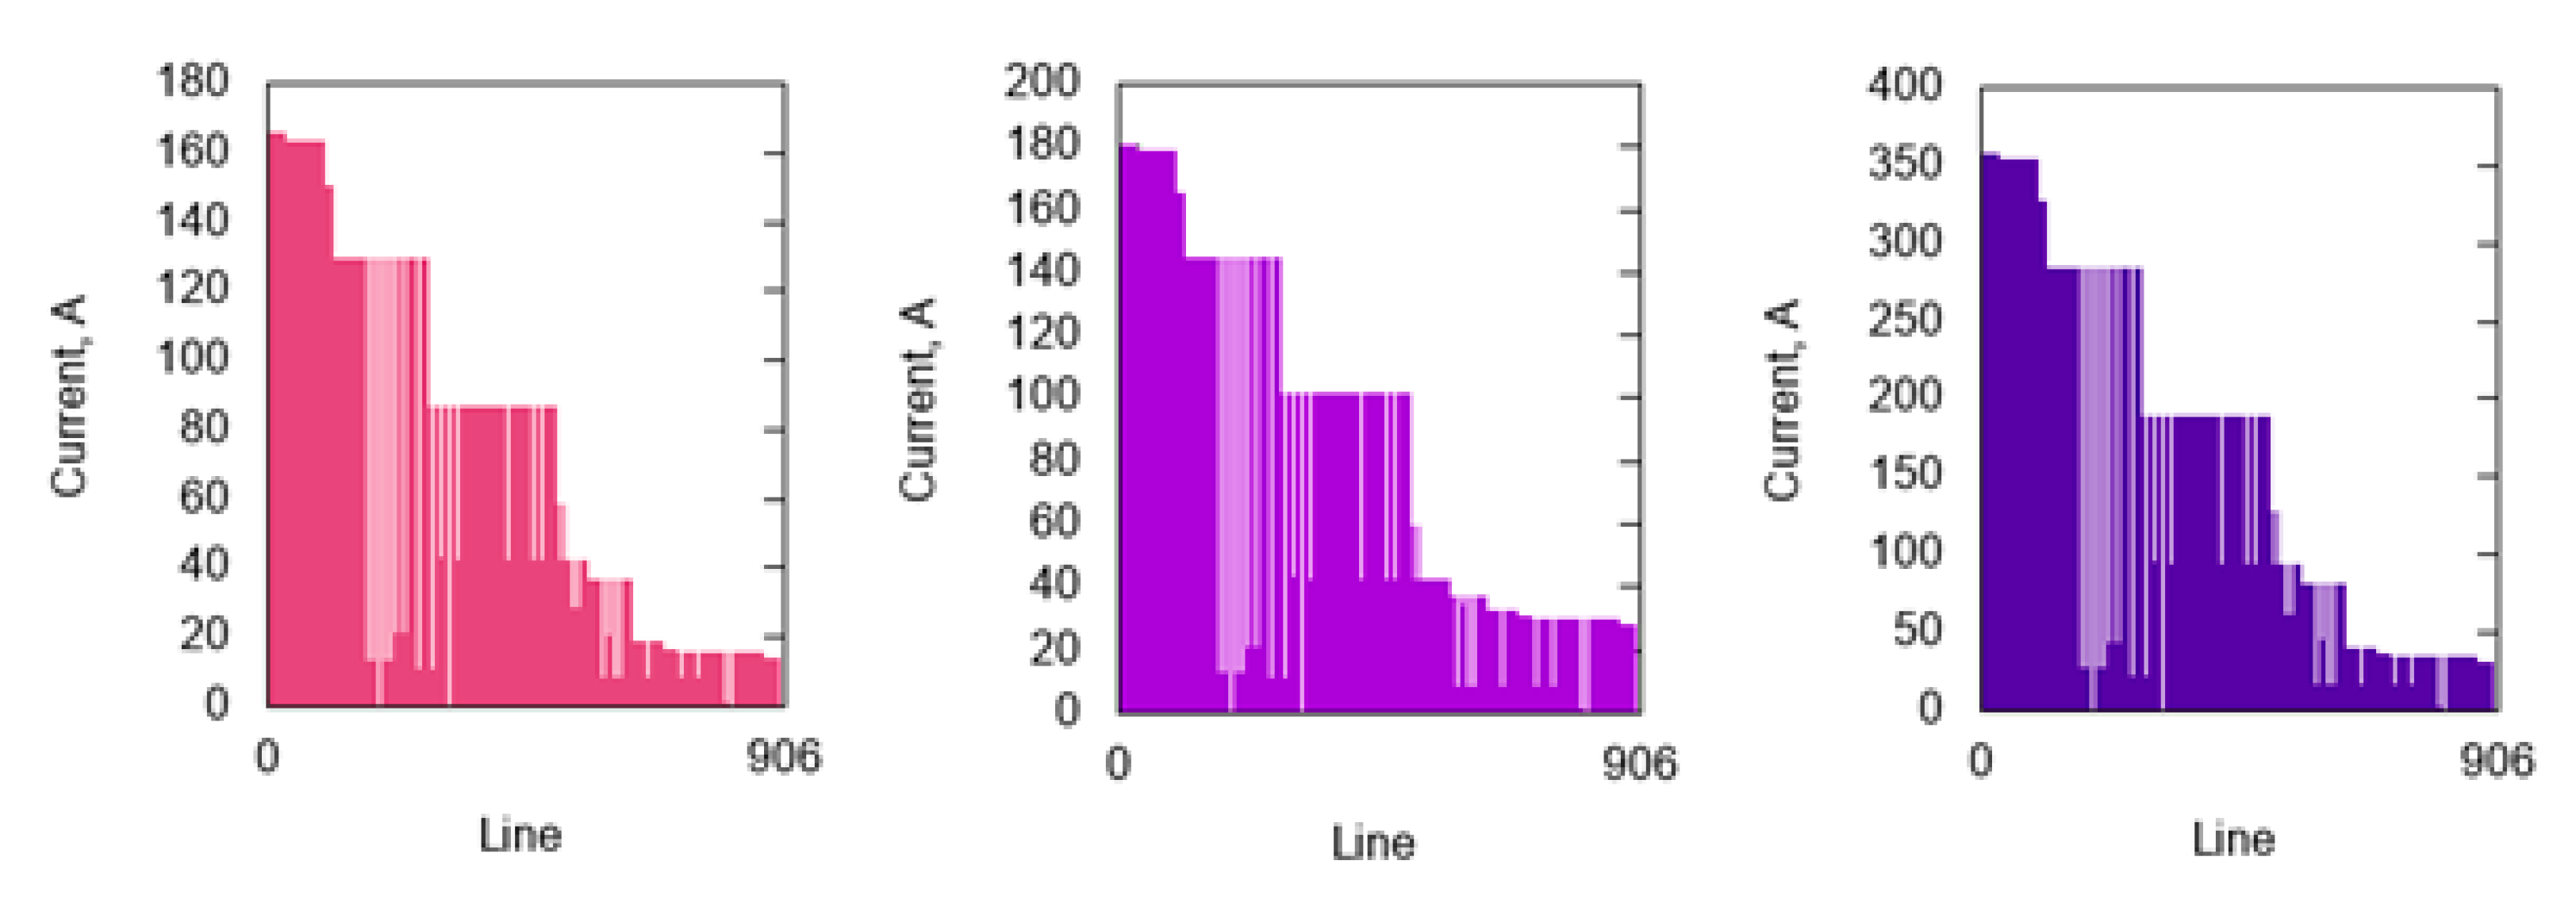
5.4.2. Line Failures

The current values increase as the loads increase due to customer behavior under attack since the DDRS attack generates unpredicted demand on the power system that may result in overload on some of the lines. This overload might cause line failures if the current carrying capacity that is maximal loading rate given in [42] is exceeded leading to energy break-outs. The power system should react to protect overloading lines.
The current change carried on the lines can be seen in Figure 6. In the without-attack case, located at the far left, maximum current magnitudes are about 170 A. In Scenario 1, located in the middle, current values slightly increase as the DDRS attack affects only one load. On the other hand, in Scenario 2 at the far right, where all phase B loads are under attack, maximum current magnitudes double which may cause line failures.

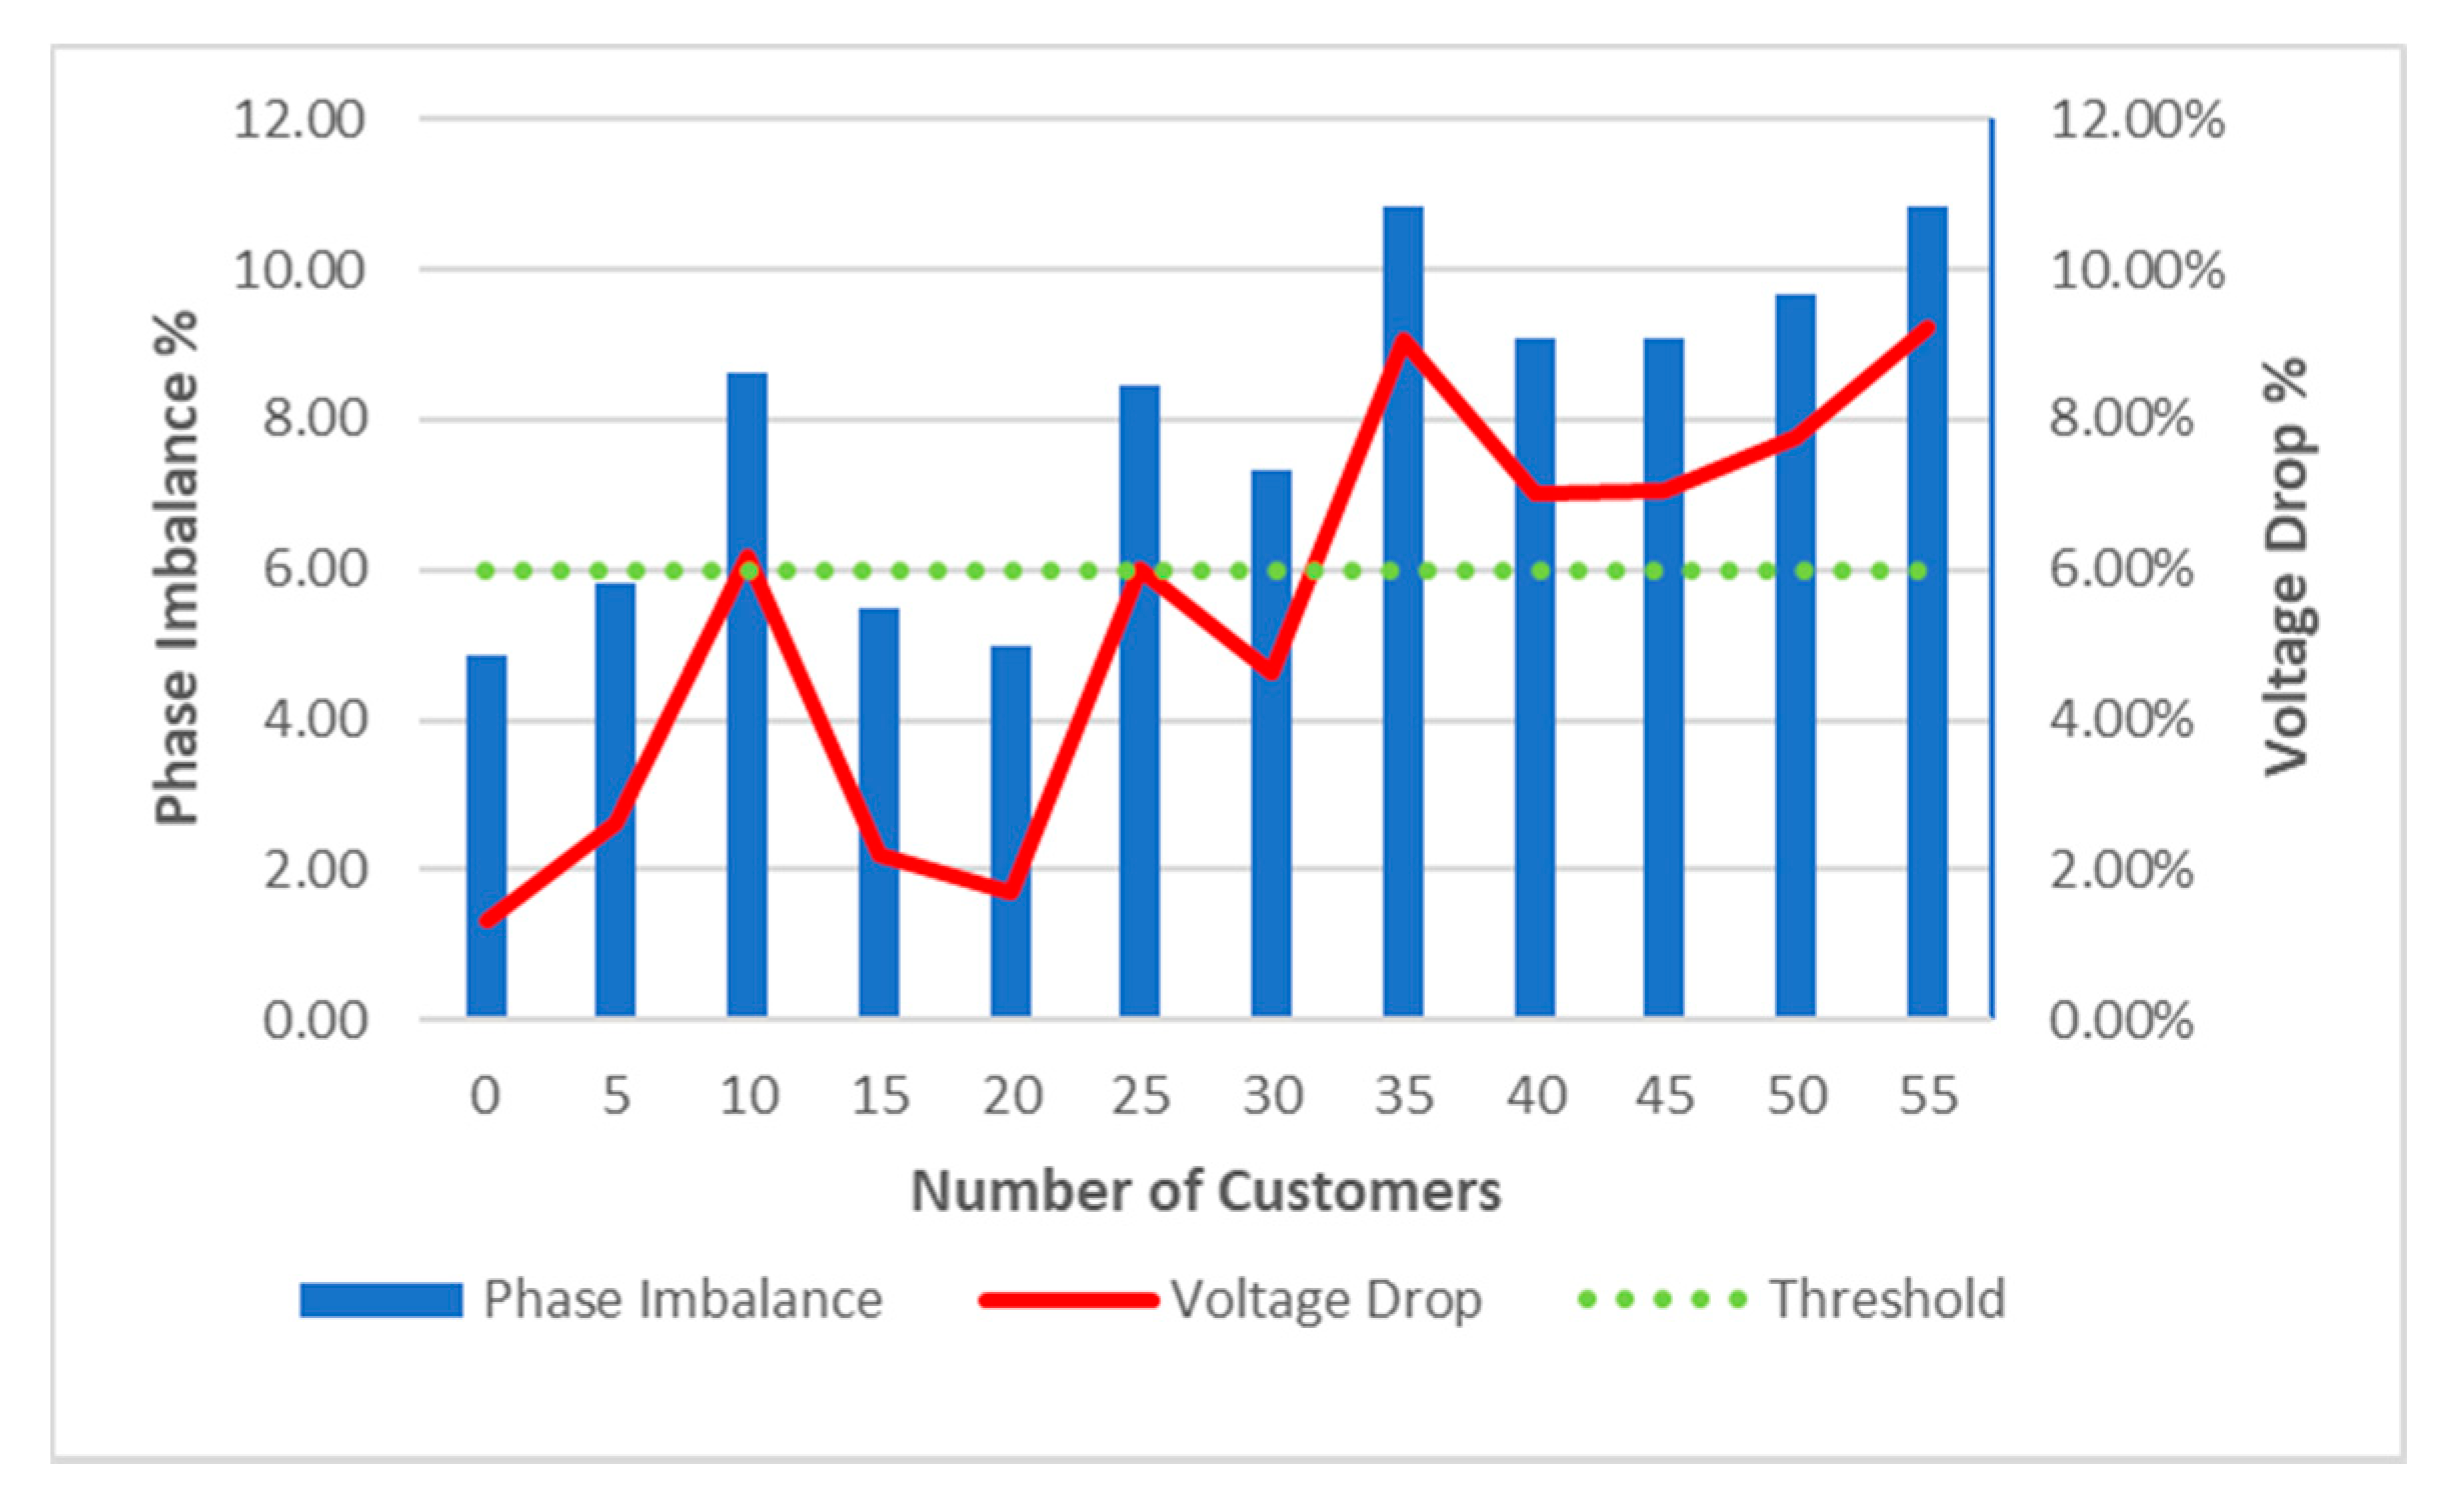
5.4.3. Phase Balance

Unbalanced loading causes phase imbalance on distribution systems which shortens the life of the appliances, damages the reliability of the equipment especially three-phase motors and controllers due to overheating.
In a three-phase system, the unbalanced phase voltages mean that voltage differences higher than allowed values. Voltages in three-phases may not be equal but the inequality should be limited. The magnitude of phase imbalance can be calculated as the ratio of the maximum deviation from the average of the voltages over average voltages as in Equation (2).
Voltage   imbalance   =   Max   Deviation   from   Average   Voltage Average   Voltage
Using (2), the evaluated voltage imbalance is 10.27% for Scenario 2 on-peak time which exceeds the tolerable threshold and can cause inevitable consequences. Figure 5 shows how the attack scale relates to phase imbalance. Like voltage drop, phase imbalance is not linear with customer size. On the other hand, changes in voltage drop and phase imbalance are not parallel such that even if voltage drop stays at the limit, phase imbalance exceeds the limit in 25 and 30 customers attack cases. Thus, if the customer is connected to one phase, the utility should pay more attention to voltage drop.

6. Discussion on Countermeasures

Some preventive actions are described here to protect utilities and customers from any harm stemming from DDRS attacks. The best—and in fact—the only way to protect the customer against SMiShing attacks is to build an awareness plan and act upon it. To increase awareness for SMiShing attacks, customers should regularly be informed regarding
  • The way of communicating,
  • Structure of legitimate messages as well as possible SMiShing messages,
  • When and how to respond to the messages,
  • What to do if a suspicious message is received.
Utilities should provide a communication channel to the customer so that they can confirm the received SMS notification is sent by the utility. There can be several ways to conduct this, for example, the utility can serve a web or mobile application that customers can log-in to and monitor demand response notification activities.
Utilities should cooperate with the SMS service providers for a reporting service, so that customers can report suspicious messages and get a response if it is a legitimate message before taking any action accordingly. From the customer perspective, people need to be vigilant and must pay attention to directions and information from their utilities and operators.
For the operational reliability of the grid, utilities recommended conducting pre-analysis on different levels such as substation or feeder level on the DR participation of the customer. Utilities can evaluate the effect of the DDRS attack to see whether critical feeders are affected. In order to detect the DDRS attack, utilities can analyze historical load data, taking the installed capacity and diversity (simultaneity) factor of the customers into account using statistical or machine learning modeling techniques. Depending on the assessment, they can apply the following preventive actions against DDRS attacks:
  • Defining the optimum DR participation-level thresholds and limiting the participation based on the threshold so that even if the attack is launched, the balance of the grid cannot be disrupted, and keep the grid robust
  • Continuously monitoring the behavior of the grid, and if an anomaly is detected, then the sheddable loads should be isolated if necessary,
  • Balancing the grid through energy storage devices. Depending on the behavior of the grid, utilities may install energy storage solutions as a source to balance the load since batteries can both take in and supply energy.
From the customer point of view, customers should be careful when receiving SMS messages from unrecognized senders, or the message content does not seem trustworthy. Some of the mobile operating systems offer SMS filtering features that customers can enable to block senders that are not included in the customer phone list.
We observed that interworking environments may cause unforeseen vulnerabilities like, in our case, the integration of SMS infrastructure with the power grid introducing a new attack surface. For this kind of architecture, the risk assessment should be explicitly carried out, and a detailed analysis should be conducted to identify assets, threats and possible countermeasures.

7. Conclusions

In this study, we demonstrated the effect of phishing attacks on the power grid, targeting the customer via fake SMS messages. We define the DDRS attack as a new type of threat to the incentive-based DR use case using SMiShing attacks. Based on the use case, we evaluated the risks related to DDRS attacks. The risk assessment approach followed in this study is built on SGIS and OWASP approaches. We combined and tailored them to obtain a more mature domain-specific methodology.
We simulated the DDRS attack on the demand response system to show the consequences of the attack. We performed the attack with deterministic and randomized scenarios then analyzed the outcomes. The analyses show us that DDRS attacks are significant and can cause critical issues on the operation of the grid as the voltage and current values go beyond tolerable values. Figure 5 shows that attacks can lead to around 9% voltage drop and 11% phase imbalance while the threshold 6% and affects the utility by means of the delivery of power, the business, and the reputation and the customer through service quality and reliability.
DDRS attacks can be performed for customers even if they are not enrolled in any DR program since anyone with a cell phone can be a victim of SMiShing attacks. This makes DDRS attacks more dangerous. Another important point here is that the security vulnerability originates from neither the power grid nor grid components. The consumer is the attack target and takes action unintentionally which leads anomalies on the grid. In this case, the utility may not sense the source of the anomalies.
We conclude the study by pointing out countermeasures to protect both consumer and utility. If proper mitigations are not applied, the consequences, like voltage collapse and line failures, may scale to larger areas leading to a more severe impact on the wealth of the population and the grid. DDRS-attack detection techniques based on statistical or machine learning techniques should be studied in the future.

Author Contributions

Conceptualization and methodology, E.U.S. and M.B.; software E.U.S.; writing—original draft, review and editing, E.U.S. and M.B.; supervision, M.B. All authors have read and agreed to the published version of the manuscript.

Funding

This research received no external funding.

Conflicts of Interest

The authors declare no conflict of interest.

References

  1. Mirzaei, M.A.; Yazdankhah, A.S.; Mohammadi-ivatloo, B. Stochastic security-constrained operation of wind and hydrogen energy storage systems integrated with price-based demand response. Int. J. Hydrogen Energy 2019, 44, 14217–14227. [Google Scholar] [CrossRef]
  2. Wang, Y.; Pordanjani, I.R.; Xu, W. An Event-Driven Demand Response Scheme for Power System Security Enhancement. IEEE Trans. Smart Grid 2011, 2, 23–29. [Google Scholar] [CrossRef]
  3. Wang, D.; Parkinson, S.; Miao, W.; Jia, H.; Crawford, C.; Djilali, N. Online voltage security assessment considering comfort-constrained demand response control of distributed heat pump systems. Appl. Energy 2012, 96, 104–114. [Google Scholar] [CrossRef]
  4. FERC. A National Assessment of Demand Response Potential. Available online: https://www.smartgrid.gov/document/national_assessment_demand_response_potential_0 (accessed on 20 June 2020).
  5. 2018 Utility Demand Response Market Snapshot. Available online: https://sepapower.org/resource/2018-demand-response-market-snapshot/ (accessed on 20 June 2020).
  6. GSM Technical Specification 3.40. Available online: http://www.etsi.org/deliver/etsi_gts/03/0340/05.03.00_60/gsmts_0340v050300p.pdf (accessed on 20 June 2020).
  7. Jain, M.; Chandan, V.; Minou, M.; Thanos, G.A.; Wijaya, T.K.; Lindt, A.; Gylling, A. Methodologies for effective demand response messaging. In Proceedings of the IEEE International Conference on Smart Grid Communications (SmartGridComm), Miami, FL, USA, 2–5 November 2015; pp. 453–458. [Google Scholar]
  8. Curb Your Power, Powershop Demand Response Program—Project Report—May 2018. Available online: https://arena.gov.au/assets/2017/12/powershop-demand-response-program.pdf (accessed on 20 June 2020).
  9. NISTIR 7628, Guidelines for Smart Grid Cyber Security. Available online: https://www.nist.gov/sites/default/files/documents/smartgrid/nistir-7628_total.pdf (accessed on 20 June 2020).
  10. Salahdine, F.; Kaabouch, N. Social Engineering Attacks: A Survey. Future Internet 2019, 11, 89. [Google Scholar] [CrossRef] [Green Version]
  11. CEN-CENELEC-ETSI Smart Grid Coordination Group. Smart Grid Information Security Report. Available online: ftp://ftp.cencenelec.eu/EN/EuropeanStandardization/HotTopics/SmartGrids/SGCG_SGIS_Report (accessed on 20 June 2020).
  12. HMG IA Standard No. 1 Technical Risk Assessment Issue 3.51. Available online: http://citeseerx.ist.psu.edu/viewdoc/download?doi=10.1.1.177.1833&rep=rep1&type=pdf (accessed on 20 June 2020).
  13. OWASP Risk Rating Methodology. Available online: https://www.owasp.org/index.php/OWASP_Risk_Rating_Methodology (accessed on 20 June 2020).
  14. European Low Voltage Test Feeder, IEEE Test Cases. Available online: http://sites.ieee.org/pes-testfeeders/resources/ (accessed on 20 June 2020).
  15. Dabrowski, A.; Ullrich, J.; Weippl, E.R. Grid Shock: Coordinated Load-Changing Attacks on Power Grids: The Non-Smart Power Grid is Vulnerable to Cyber Attacks as Well. In Proceedings of the 33rd Annual Computer Security Applications Conference (ACSAC), Orlando, FL, USA, 4–8 December 2017; pp. 303–314. [Google Scholar] [CrossRef]
  16. Soltan, S.; Mittal, P.; Vincent Poor, H. BlackIoT: IoT Botnet of high wattage devices can disrupt the power grid. In Proceedings of the 27th USENIX Conference on Security Symposium (SEC’18), Baltimore, MD, USA, 15–17 August 2018; pp. 15–32. [Google Scholar]
  17. Kim, S.K.; Kim, U.; Huh, J. A Study on Improvement of Blockchain Application to Overcome Vulnerability of IoT Multiplatform Security. Energies 2019, 12, 402. [Google Scholar] [CrossRef] [Green Version]
  18. Irshad, A.; Usman, M.; Chaudhry, S.A.; Naqvi, H.; Shafiq, M. A Provably Secure and Efficient Authenticated Key Agreement Scheme for Energy Internet-Based Vehicle-to-Grid Technology Framework. IEEE Trans. Ind. Appl. 2020, 56, 4425–4435. [Google Scholar] [CrossRef]
  19. Mohsenian-Rad, A.H.; Leon-Garcia, A. Distributed Internet-Based Load Altering Attacks against Smart Power Grids. IEEE Trans. Smart Grid 2011, 4, 667–674. [Google Scholar] [CrossRef]
  20. Amini, S.; Rad, H.M.; Pasqualetti, F. Dynamic load altering attacks in smart grid. In Proceedings of the IEEE Power & Energy Society Innovative Smart Grid Technologies Conference (ISGT), Washington, DC, USA, 18–20 February 2015; pp. 1–5. [Google Scholar]
  21. Amini, S.; Pasqualetti, F.; Mohsenian-Rad, H. Dynamic Load Altering Attacks against Power System Stability: Attack Models and Protection Schemes. In Proceedings of the IEEE Power & Energy Society General Meeting (PESGM), Chicago, IL, USA, 16–20 July 2017. [Google Scholar] [CrossRef]
  22. Liu, Y.; Ning, P.; Reiter, M.K. False data injection attacks against state estimation in electric power grids. ACM Trans. Inf. Syst. Secur. 2009, 14, 1–33. [Google Scholar] [CrossRef]
  23. Rahman, M.A.; Mohsenian-Rad, H. False Data Injection Attacks against Nonlinear State Estimation in Smart Power Grids. In Proceedings of the IEEE Power & Energy Society General Meeting, Vancouver, BC, Canada, 21–25 July 2013; pp. 1–5. [Google Scholar] [CrossRef]
  24. Sandberg, H.; Teixeira, A.M.; Johansson, K.H. On Security Indices for State Estimators in Power Networks. In Proceedings of the First Workshop on Secure Control Systems, Stockholm, Sweden, 12 April 2010. [Google Scholar]
  25. Soltan, S.; Mittal, P.; Poor, H.V. Protecting the Grid against IoT Botnets of High-Wattage Devices. arXiv 2018, arXiv:1808.03826. [Google Scholar]
  26. Dvorkin, Y.; Siddharth, G. IoT-enabled distributed cyber-attacks on transmission and distribution grids. In Proceedings of the North American Power Symposium (NAPS), Morgantown, WV, USA, 17–19 September 2017; pp. 1–6. [Google Scholar]
  27. 2009/72/EC of the European Parliament and of the Council of 13 July 2009 Concerning Common Rules for the Internal Market in Electricity and Repealing Directive 2003/54/EC. Available online: https://eur-lex.europa.eu/legal-content/EN/ALL/?uri=celex%3A32009L0072 (accessed on 20 June 2020).
  28. Cohen, L.E.; Felson, M. Social change and crime rate trends: A routine activity approach. Am. Sociol. Rev. 1979, 44, 588–608. [Google Scholar] [CrossRef]
  29. Hutchings, A.; Hayes, H. Routine Activity Theory and Phishing Victimisation: Who Gets Caught in the ‘Net’? Curr. Issues Crim. Justice 2009, 20, 433–452. [Google Scholar] [CrossRef] [Green Version]
  30. Mobile Phishing 2018: Myths and Facts Facing Every Modern Enterprise Today. Available online: https://info.lookout.com/rs/051-esq-475/images/lookout-phishing-wp-us.pdf (accessed on 20 June 2020).
  31. Stanford University. The Human Factor Report. Available online: https://seclab.stanford.edu/courses/cs203/lectures/humanfactor.pdf (accessed on 20 June 2020).
  32. SMiShing: New Age Phishing. Available online: https://www.vanillaplus.com/2017/09/29/30811-smishing-new-age-phishing/ (accessed on 20 June 2020).
  33. Moon, S.; Park, D. Forensic Analysis of MERS Smishing Hacking Attacks and Prevention. Int. J. Secur. Its Appl. 2016, 10, 181–192. [Google Scholar] [CrossRef]
  34. Joo, J.W.; Moon, S.Y.; Singh, S.; Park, J.H. S-Detector: An enhanced security model for detecting Smishing attack for mobile computing. Telecommun. Syst. 2017, 66, 29–38. [Google Scholar] [CrossRef]
  35. Jain, A.K.; Gupta, B.B. Rule-Based Framework for Detection of Smishing Messages in Mobile Environment. Procedia Comput. Sci. 2018, 125, 617–623. [Google Scholar] [CrossRef]
  36. Sonowal, G.; Kuppusamy, K.S. SmiDCA: An Anti-Smishing Model with Machine Learning Approach. Comput. J. 2018, 61, 1143–1157. [Google Scholar] [CrossRef]
  37. Prakash, P.; Kumar, M.; Kompella, R.R.; Gupta, M. Phishnet: Predictive Blacklisting to Detect Phishing Attacks. In Proceedings of the 2010 Proceedings IEEE INFOCOM, San Diego, CA, USA, 14–19 March 2010; pp. 1–5. [Google Scholar]
  38. ISO/IEC 27005:2011 Information Technology, Security Techniques, Information Security Risk Management (Second Edition). Available online: http://www.27000.org/iso-27005.htm (accessed on 20 June 2020).
  39. ISO/IEC. ISO 31000:2009, Risk Management—Principles and Guidelines. 2009. Available online: http://www.iso.org/iso/home/standards/iso31000.htm (accessed on 20 June 2020).
  40. NESCOR. Electric Sector Failure Scenarios and Impact Analyses—Version 3.0. Available online: https://smartgrid.epri.com/doc/NESCOR%20Failure%20Scenarios%20v3%2012-11-15.pdf (accessed on 20 June 2020).
  41. Gridlab, D. Available online: https://www.gridlabd.org/ (accessed on 20 June 2020).
  42. Kersting, W. Radial Distribution Test Feeders. In Proceedings of the IEEE Power Engineering Society Winter Meeting, Columbus, OH, USA, 28 January–1 February 2001; Volume 2, pp. 908–912. [Google Scholar]
Figure 1. Infrastructure of the use case.
Energies 13 04542 g001
Figure 2. Time series solution on the absence of attack—normal circumstances.
Energies 13 04542 g002
Figure 3. Attack scenario 1—Voltage levels under attack.
Energies 13 04542 g003
Figure 4. Attack scenario 2—Voltage levels under attack.
Energies 13 04542 g004
Figure 5. Phase imbalance and voltage deviation percentages for the different number of customers.
Energies 13 04542 g005
Figure 6. Snapshot of Current levels at peak time. Normal circumstances, under Scenario 1 attack, under Scenario 2 attack respectively.
Energies 13 04542 g006
Table 1. Impact Levels for SMiShing Attack.
AssetsImpact Categories
EnergyPopulationInfrastructureHumanReputation
UONVery HighHighHighN/ALow
DCMediumLowMediumN/ALow
CNLowLowMediumLowLow
Table 2. Likelihood Levels for SMiShing Attack.
AssetsAttacker Types
CustomerHackerDishonest EmployeeTerrorist
UONN/AHighVery HighVery High
DCN/AHighVery HighVery High
CNVery HighHighN/AN/A
Table 3. Risk Levels for SMiShing Attack.
AssetsImpact LevelLikelihood LevelRisk Level
UON4 (Critical)4 (Very High)4 × 4 (Critical)
DC2 (Medium)4 (Very High)2 × 4 (Medium)
CN2 (Medium)4 (Very High)2 × 4 (Medium)

