Abstract
Specific features of the catalytic tar cracking in the presence of formic acid, BEA zeolite and 8% Ni-2.5% Mo/Sibunit catalyst were studied at 350 °C and 1.0 MPa pressure. The obtained results evidenced that formic acid can be used as a hydrogen donor during catalytic reactions. The formic acid addition made it possible to perform efficient hydrocracking of heavy feed such as tar. It was found that both the tar conversion and selectivity to light (gasoline-diesel) fractions grew in the sequence: tar < (tar - formic acid) < (tar - formic acid - BEA zeolite) < (tar - formic acid - BEA zeolite - 8% Ni-2.5% Mo/Sibunit catalyst). Furthermore, significantly lower concentrations of impurities containing sulfur and nitrogen were observed for the (tar - formic acid - BEA zeolite - 8% Ni-2.5% Mo/Sibunit catalyst) system. For example, the sulfur and nitrogen concentrations in the tar precursor were 1.50% and 0.86%, respectively. Meanwhile, their concentrations in the liquid products after the catalytic cracking were 0.73% and 0.18%, respectively.
1. Introduction
Due to increasing worldwide demand for motor fuel, the need to utilize non-traditional heavy oil feedstock (HOF), including heavy oils, natural bitumen, heavy residual oil fractions (tar, black oil), bituminous sands and pyroshales is also rapidly growing. A number of methods for deep processing of heavy oil fractions, heavy oils and oil residues in the presence of catalysts have been reported. Traditional approaches to HOF processing can be divided into two main types [1,2,3,4]. The first type includes deasphalting, thermal processes: gasification and carbonization (delayed, flexicoking, etc.), viscosity breaking and catalytic cracking. The second type includes various hydrogenation processes. Therefore, there is great interest in hydrocracking of heavy residual oil fractions, particularly tar, aimed at the production of the main products of the gasoline and diesel fractions that are in great demand. The chemistry of hydrogenation processes is based on the efficient use of hydrogen. However, reactors used for hydrocracking processes operate under high pressure and require complex instrumentation. Thus, researchers are currently looking for new sources of hydrogen.
One of the actively developing areas combining the advantages of the thermal and hydrogenation refinement processes is catalytic vapor cracking of HOF [5,6,7]. In this process water acts as a hydrogen donor. Its participation makes it possible to increase the yield of the light fraction (boiling point below 360 °C) and decrease the coke yield as well as the contents of sulfur and heteroatoms in the liquid products. The use of catalysts based on Ni [8,9], Fe [10,11], Mo [8,12], Co [13] and Zr [14,15] in the catalytic vapor cracking favors stronger HOF interaction with water, including partial oxidation, low-temperature partial steam reforming and catalytic cracking processes, thus substantially improving the overall efficiency of the process.
A different approach was demonstrated in other publications. It was suggested to add methane to CO2 for cracking of resins obtained by coal pyrolysis. Due to its high H/C ratio, methane is considered to be a hydrogen substitute. Hydrogen is formed by methane reforming with carbon dioxide [16,17].
However, these approaches are complicated for practical implementation because two complex processes have to be optimized: hydrogen production and the hydrocracking itself. The use of formic acid as a hydrogen donor significantly simplifies the process. Formic acid is a high-quality organic hydrogen source, as it has relatively high hydrogen content (4.4 wt.%), low flammability and low toxicity. It is important to note that formic acid can be prepared from the biomass or from CO2 [18,19,20].
Delayed carbonization is the most popular scheme for processing of tar and other heavy residues. In the current study, modification of the tar carbonization was attempted. The formic acid addition was suggested as a means to regulate the yield and properties of the formed carbonization products. The goal of the current study was to investigate the effect of the formic acid addition and different catalysts on the yield and properties of liquid tar hydrocracking products.
2. Materials and Methods
Tar from the Omsk Oil Refinery (Omsk, Russia) was used as a feedstock. The elemental and fraction compositions of the used tar are reported in Table 1.

Table 1.
Characteristics of the studied tar.
Hydrocracking catalysts are bifunctional. Their hydrogenation–dehydrogenation function and activity in all reactions related to hydrorefining is usually associated with MoS2 or WS2 promoted with nickel sulfide. Amorphous or crystalline aluminosilicates, Y [21] or BEA [22,23,24] zeolites are typically responsible for the cracking function. Based on this information, a nickel–molybdenum catalyst and a BEA zeolite were used in this study for the tar hydrocracking.
The use of carbon supports for tar carbonization is desirable because they do not increase the ash content of the resulting oil coke. The artificial mesoporous carbon support “Sibunit” [25,26], which has a surface of 480 m2/g and a graphite-like structure, was used for the catalyst synthesis. A TEM image of the Sibunit support is shown in Figure 1. The support particles have an egg-shell shape. Sibunit is a graphite-like carbon material with an interlayer distance of d002 = 3.52 Å and an average crystallite size in this direction of about 25 Å.
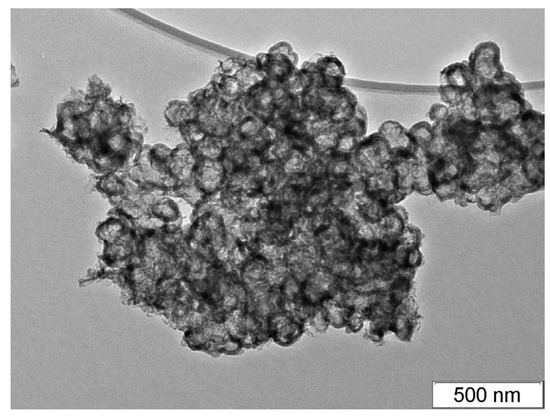
Figure 1.
TEM image of the Sibunit support.
The 8% Ni-2.5% Mo/Sibunit catalyst was prepared by impregnation. Precalculated amounts of Ni(NO3)2·6H2O and (NH4)2MoO4 (Reakhim, 98% purity) were dissolved in 10 mL of distilled water and added to a beaker containing 10 g of Sibunit. Then, the sample was dried on a hot plate with a magnetic stirrer and calcined in a muffle furnace in air at 250 °C for 30 min. The obtained NiO-MoO/Sibunit sample was reduced in the hydrogen flow in a flow reactor at 400 °C for 1 h. After reduction the catalyst composition was 8% Ni-2.5% Mo/Sibunit. The XRD pattern of 8% Ni-2.5% Mo/Sibunit reduced in hydrogen is shown in Figure 2.
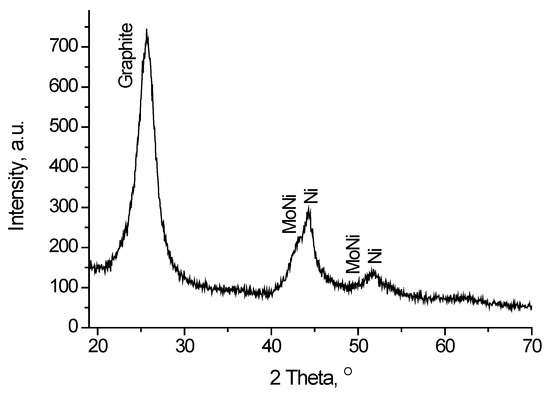
Figure 2.
XRD pattern of 8% Ni-2.5% Mo/Sibunit.
The peaks observed in the XRD pattern of 8% Ni-2.5% Mo/Sibunit can be attributed to nickel metal or a nickel–molybdenum phase (Figure 2). The peak at 2θ ~ 44° is formed by overlapping of different peaks and has a shoulder. This shoulder (2θ ~ 42–43°) can be attributed either to graphite or to a nickel–molybdenum phase. The position of the peak close to the shoulder (2θ ~ 44.3°) is typical for the nickel metal phase. The diffraction characteristics of the active component of the Ni-Mo/Sibunit catalyst are reported in Table 2.
Table 2.
Diffraction characteristics of the active component of supported Ni-Mo/Sibunit.
BEA zeolite (SiO2/Al2O3 = 27) produced by AZKiOS (Angarsk, Russia) was used. Its characteristics are reported in Table 3 and Table 4.
Table 3.
Characteristics of the BEA zeolite.
Table 4.
Textural characteristics of the BEA zeolite.
Catalytic reactions of tar were performed in an autoclave at 350–500 °C and 1 MPa pressure. A scheme of the autoclave unit for catalytic reactions of tar is shown in Figure 3. A tar sample (~16 g) or a tar sample (~16 g) with a catalyst (0.4 g) was loaded in the sample holder basket. In another series of experiments, a tar sample (~16 g) with formic acid (0.4 g) or a tar sample (~16 g) with formic acid (9 g) and a catalyst (0.4 g) was loaded in the sample holder basket. Then, the autoclave was heated to the desired temperature and maintained at it for 2 h.
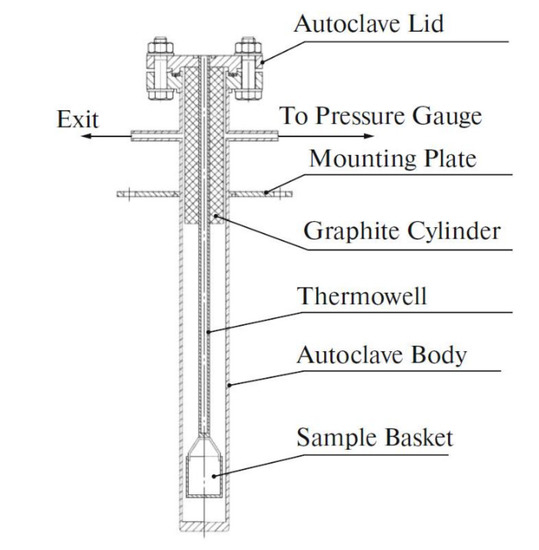
Figure 3.
Scheme of the autoclave unit for catalytic reactions of tar.
The gas phase components were analyzed using a Kristall-2000M gas chromatograph (Chromatec, Yoshkar-Ola, Russia). A thermal conductivity detector was used for analysis of H2S, COS, SO2, H2, O2, CO2 and CH4 after their separation on a packed column (2 mm × 1.5 m) filled with SKT activated carbon “AQUACHEM” Kazan. A flame ionization detector was used for analysis of the gas phase organic components after separation on a packed column (2 mm × 3 m) filled with Hayesep Q + 0.9% PTMSP (Hayes Separations, Inc. of Bandera, TX, USA).
The concentrations of sulfur and nitrogen and the H:C ratio in the initial tar and products of its processing were determined using a VARIO EL CUBE CHNS-O-analyzer (Elementar Analysensysteme GmbH, Langenselbold, Germany). The fraction compositions of the tar and products formed from it were determined by imitation distillation according to ASTM D7169 using an Agilent 7890В gas chromatograph (Santa Clara, CA, USA).
The elemental compositions of solid phases were determined using the X-ray fluorescence spectrometer ARL Perform’X (Bruker, Germany) with a Rh anode for fluorescence excitation. Powder samples were ground in an agate mortar to a homogeneous finely dispersed state. Powder and liquid (viscous) samples were placed into a special holder covered with a Spectrolenesix polypropylene film that is transparent to the X-ray irradiation. Then, this holder was placed into the spectrometer chamber filled with helium. Automatic spectrum smoothing, background subtraction and calculation of the concentrations were performed using the UniQuant software package (Germany).
The phase composition of the samples was studied by the X-ray diffraction analysis. Diffraction patterns were recorded with a Thermo ARL X’TRA diffractometer (Thermo Fisher Scientific, Basel, Switzerland) using CuKα radiation with a wavelength of 1.54184 Å. The 2θ scan range was 5–75°, the scanning step was 0.05° and the accumulation time at each point was 5 s. Diffraction (Powder Diffraction Files) (PDF) and structural (Inorganic Crystal Structure Database) (ICSD) databases were used to identify the phase compositions. The average crystallite sizes were determined using the Selyakov–Scherrer formula from the integral widths of the diffraction peaks.
High-resolution transmission electron microscopy (HRTEM) images were obtained using a JEOL JEM-2010 (Tokyo, Japan) electron microscope with a lattice resolution of 0.14 nm.
The experiments on the formic acid (FA) decomposition were performed in a flow installation using a quartz reactor (inner diameter 6 mm). The catalyst loading was 20 mg. The catalyst was uniformly mixed with 0.5 cm3 of quartz. The feed consisted of 5 vol.% FA in helium. Its flow rate was 20 cm3/min. The experiments were performed in a temperature-programmed mode with a temperature increase rate of 2 °C/min. The reaction progress was followed by monitoring the release of CO and CO2.
3. Results and Discussion
3.1. Thermal Transformations of Tar
The tar carbonization was studied in the temperature range of 350–500 °C. At 350 °C, the tar carbonization yielded gaseous and liquid products as well as oil coke. The amount of liquid product was about 15 wt.%. At 450 °C only gaseous and solid carbonization products were formed. The temperature increase favors conversion of liquid products into gases. The composition of gaseous products obtained at 350–500 °C is reported in Table 5. Methane, ethane and propane were the main gaseous carbonization products. The methane concentration in the products grew with carbonization time.
Table 5.
The effect of tar carbonization temperature on the composition of gaseous products (reaction time: 1 h).
Significant amounts of H2S and COS were observed in the reaction products. The contents of the sulfur-containing compounds in gaseous products formed during the tar carbonization at 450 °C are reported in Table 6. Hydrocarbon gases, as well as sulfur-containing H2S and COS products, were formed during the process. Gaseous products were periodically removed from the autoclave, and therefore a release of weakly bound sulfur from the tar decreased as the coking process proceeded. This explains the decreasing concentration of sulfur-containing products in the gas as the reaction time increased.
Table 6.
Concentrations of sulfur-containing compounds in gaseous products of tar carbonization at 450 °C as a function of reaction time.
3.2. Catalytic Decomposition of Formic Acid
Hydrogen can be produced from formic acid by a catalytic or non-catalytic reaction. The formic acid decomposition in the gas phase can follow two pathways: dehydrogenation with the formation of H2 and CО2 (Equation (1)), and dehydration with the formation of CО and H2O (Equation (2)).
Formic acid decomposition can be catalyzed by a number of metals. Palladium catalysts are the most efficient for the hydrogen production from formic acid according to Equation (1) [27,28,29,30,31]. Nickel catalysts have lower activity [32]. However, from the economic viewpoint nickel catalysts deserve more attention than noble metal catalysts. The catalyst supports play an important role in the catalytic activity, especially when a highly dispersed active metal is used. Porous carbon materials are suitable candidates, since they have all the properties required for such support.
Experiments in a flow installation with a quartz reactor were carried out to determine the pathways of the formic acid decomposition over the 8% Ni-2.5% Mo/Sibunit catalyst. The 8% Ni-2.5% Mo/Sibunit catalyst was pre-treated in a flow of 5 vol.% FA in helium at 300 °C to remove the oxide layers formed by contact of metal particles with air. The FA conversion was calculated as a ratio of the sum of the CO and CO2 concentrations to the initial FA concentration. The selectivity to CO2 (H2) was determined as a ratio of the CO2 concentration to the sum of the CO and CO2 concentrations. The results of the formic acid catalytic decomposition over the 8% Ni-2.5% Mo/Sibunit catalyst are presented in Figure 4.
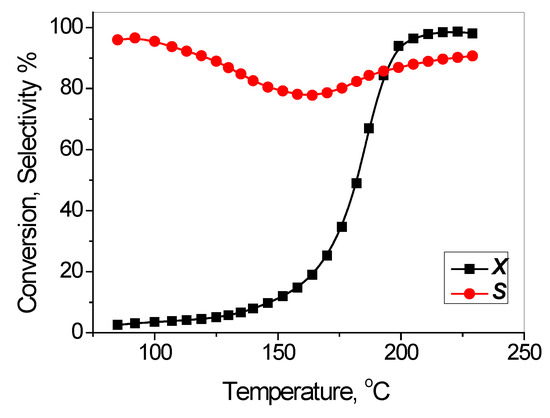
Figure 4.
FA decomposition on 8% Ni-2.5% Mo/Sibunit catalyst after pretreatment in FA at 300 °C for 1 h.
The formic acid decomposition on the 8% Ni-2.5% Mo/Sibunit catalyst preferentially follows the pathway of Equation (1) with the formation of CO2 and H2 (Figure 4). Similar experiments on the formic acid decomposition were performed in an empty autoclave without a catalyst. About 3 mL of formic acid was placed into a 300 mL autoclave. The autoclave was gradually heated to 250 °C and maintained at this temperature for 30 min. Then, the temperature was increased in several steps to 350 °C. It was found that the pressure growth in the autoclave began at 120 °C. At 250 °C the pressure was equal to 4 atm. The gas phase composition was studied by gas chromatography. The dependence of the gas phase composition and pressure on temperature is reported in Table 7. Even in the empty autoclave the formic acid decomposition followed the pathway of Equation (1). This is most likely caused by the catalytic effect of the steel autoclave walls on the formic acid decomposition. A CO methanation reaction also occurred to some extent. The obtained results evidenced that formic acid can be used as a source of hydrogen during catalytic reactions of tar. The change in pressure at 250 and 300 °C occurs because the system needs time to reach a steady state.
Table 7.
Changes of the gas phase composition and pressure in the autoclave during the formic acid decomposition as a function of temperature.
It should be noted that products of formic acid decomposition might be in equilibrium with each other. The water–gas shift (WGS) reaction described in Equation (3) is an industrial process in which water in the form of steam is mixed with carbon monoxide to obtain hydrogen and carbon dioxide.
H2O + CO = CO2 + H2
The WGS reaction is reversible and exothermic (ΔHo = −41.2 kJ/mol). The WGS reaction is thermodynamically favorable at temperatures of 300–400 °C [33]. Iron-based catalysts are typically used industrially. Therefore, the water–gas shift (WGS) reaction also favors the formation of hydrogen and CO2.
3.3. Effect of Formic Acid on the Catalytic Transformations of Tar
The data on the tar, FA and catalyst loadings, and the selectivity to different fractions are summarized in Table 8. The reaction was performed at 350 °C for 2 h.
Table 8.
The influence of formic acid and catalysts on the tar transformations at 350 °C.
In addition to the total tar conversion, it is important to control the composition of liquid products. They were analyzed using the imitation distillation method. The fractions of gasoline (0–180 °C) and diesel (180–360 °C) fractions, vacuum gasoil (360–550 °C), vacuum residue (550–720 °C) and non-eluted residue were calculated according to ASTM D7169 on Agilent 7890B. The fraction compositions of the obtained liquid products are presented in Table 9 and Figure 5.
Table 9.
Fraction distribution of liquid product formed by tar conversion in different systems.
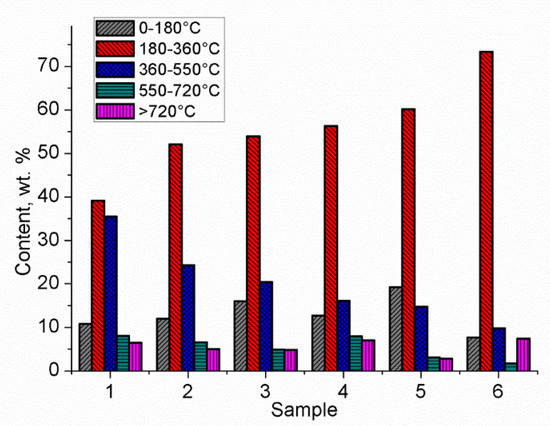
Figure 5.
Fraction composition of liquid products.
The presented data demonstrate that the addition of formic acid and the catalysts resulted in redistribution of the liquid products between different fractions. The lowest amount of the gasoline (10.8%) and diesel (39.1%) fractions was observed in the liquid products formed by the thermal tar cracking. The addition of formic acid alone or together with the BEA zeolite to tar increased the contributions of these fractions among the liquid products.
Substitution of the BEA zeolite for the 8% Ni-2.5% Mo/Sibunit catalyst led to a decrease of the gasoline fraction concentration from 16% to 12.7%. This means that the 8% Ni-2.5% Mo/Sibunit catalyst has lower cracking ability than the BEA zeolite. Nickel metal is known to be a good catalyst for methanation and hydrogenolysis of C-C bonds [34,35,36,37]. These properties lead to its higher selectivity to gaseous products (Table 8). Meanwhile, simultaneous addition of the BEA zeolite and the 8% Ni-2.5% Mo/Sibunit catalyst (sample 380) led to the highest yields of both the gasoline and the diesel fractions.
Changes of the sulfur and nitrogen contents in the liquid reaction products were also studied. The results are presented in Table 10. Variations of the sulfur and nitrogen concentrations were symbatic, most likely due to similarities in the mechanisms of desulfurization and denitrogenation of liquid products during the catalytic transformations of tar.
Table 10.
Changes of the sulfur and nitrogen concentrations in liquid products depending on the addition of formic acid and the catalysts.
The lowest sulfur concentration was observed for sample 5. This result was observed despite the fact that the original carbon support Sibunit contained 0.5 wt.% S. Ni-Mo catalysts are known to be among the best catalysts for purification of diesel fuel from sulfur. When the BEA zeolite is present together with the 8% Ni-2.5% Mo/Sibunit catalyst, it also contributes to desulfurization of the liquid products.
4. Conclusions
Thermal cracking of tar was studied at 350–500 °C and 1.0 MPa pressure. At 350 °C the tar carbonization resulted in the formation of gaseous and liquid products as well as oil coke. The fraction of liquid products was about 15 wt.%. Only gaseous and solid products were observed when the carbonization temperature was increased to 450 °C. Apparently, the temperature increase led to the conversion of liquid products to gases. The main gaseous tar carbonization products were methane, ethane and propane. H2S and COS were observed in the reaction products. Due to this fact, the sulfur concentration on the oil coke decreased in comparison with the precursor tar from 1.5 to 1.28 wt.%.
Specific features of the catalytic tar cracking in the presence of formic acid, BEA zeolite and the 8% Ni-2.5% Mo/Sibunit catalyst were studied at 350 °C 1.0 MPa pressure. The experiments showed that the formic acid addition made it possible to perform efficient hydrocracking of heavy feeds such as tar. Both the tar conversion and selectivity to light (gasoline–diesel) fractions increased in the sequence: tar < (tar - formic acid) < (tar - formic acid - BEA zeolite) < (tar - formic acid - BEA zeolite - 8% Ni-2.5% Mo/Sibunit catalyst). Furthermore, significantly lower concentrations of impurities containing sulfur and nitrogen were observed for the (tar - formic acid - BEA zeolite - 8% Ni-2.5% Mo/Sibunit catalyst) system. For example, the sulfur and nitrogen concentrations in the tar precursor were 1.50% and 0.86%, respectively. Meanwhile, their concentrations in the liquid products after the catalytic cracking were 0.73% and 0.18%, respectively.
Author Contributions
Conceptualization, V.V.C.; methodology, V.V.C.; writing—original draft preparation, V.V.C.; investigation, P.P.D.; characterization, P.P.D.; measurements, P.P.D.; synthesis, A.S.C.; measurements, A.S.C.; data analysis, A.S.C. All authors have read and agreed to the published version of the manuscript.
Funding
This study was supported by the Russian Science Foundation, project 17–73–30032.
Conflicts of Interest
The authors declare no conflict of interest.
Nomenclature
| HOF | heavy oil feedstock |
| HRTEM | high resolution transmission electron microscopy |
| Powder Diffraction Files | |
| ICSD | Inorganic Crystal Structure Database |
| BET | Brunauer–Emmett–Teller |
| XRD | X-ray diffraction |
| WGS | water–gas shift reaction |
References
- Ancheyta, J.; Speight, J.G. Hydroprocessing of Heavy Oils and Residua; CRC Press: Boca Raton, FL, USA, 2007. [Google Scholar]
- Surkov, V.G.; Pevneva, G.S.; Golovko, A.K. Structural and chemical transformations of asphaltenes and tar resins under conditions of mechanical influence. Neftepererab. Neftekhim. 2015, 12, 6–10. [Google Scholar]
- Ruiz, J.C.S. Applied Industrial Catalysis; Archer Press: New York, NY, USA, 2017. [Google Scholar]
- Gary, J.H.; Handwerk, G.E.; Kaiser, M.J. Oil Refining: Technology and Economics, 5th ed.; CRS Press: New York, NY, USA, 2007. [Google Scholar]
- Zaikina, O.O.; Saiko, A.V.; Sosnin, G.A.; Yeletsky, P.M.; Gulyaeva, Y.K.; Klimov, O.V.; Noskov, A.S.; Yakovlev, V.A. Investigation of the properties of semisynthetic oils obtained in the presence of dispersed catalysts based on Mo and Fe-Co in the process of catalytic steam cracking of vacuum residue. J. Sib. Fed. Univ. Chem. 2019, 12, 512–521. [Google Scholar] [CrossRef]
- Eletskii, P.M.; Mironenko, O.O.; Kukushkin, R.G.; Sosnin, G.A.; Yakovlev, V.A. Catalytic steam cracking of heavy oil feedstocks: A review. Catal. Ind. 2018, 10, 185–201. [Google Scholar] [CrossRef]
- Eletskii, P.M.; Sosnin, G.A.; Zaikina, O.O.; Kukushkin, R.G.; Yakovlev, V. Heavy oil upgrading in the presence of water. J. Sib. Fed. Univ. Chem. 2018, 10, 545–572. [Google Scholar] [CrossRef]
- Reina, T.R.; Yeletsky, P.; Bermúdez, J.M.; Arcelus-Arrillaga, P.; Yakovlev, V.A.; Millan, M. Anthracene aquacracking using NiMo/SiO2 catalysts in supercritical water conditions. Fuel 2016, 182, 740–748. [Google Scholar] [CrossRef]
- Cabrales-Navarro, F.A.; Pereira-Almao, P. Catalytic steam cracking of a deasphalted vacuum residue using a Ni/K ultradispersed catalyst. Energy Fuels 2017, 31, 3121–3131. [Google Scholar] [CrossRef]
- Kukushkin, R.G.; Eletskii, P.M.; Zaikina, O.O.; Sosnin, G.A.; Bulavchenko, O.A.; Yakovlev, V.A. Studying the steam cracking of heavy oil over iron- and molybdenum-containing dispersed catalysts in a flow-type reactor. Catal. Ind. 2018, 10, 344–352. [Google Scholar] [CrossRef]
- Clark, P.D.; Kirk, M.J. Studies on the upgrading of bituminous oils with water and transition metal catalysts. Energy Fuels 1994, 8, 380–387. [Google Scholar] [CrossRef]
- Mironenko, O.O.; Sosnin, G.A.; Eletskii, P.M.; Gulyaeva, Y.K.; Bulavchenko, O.A.; Stonkus, O.A.; Rodina, V.O.; Yakovlev, V.A. A study of the catalytic steam cracking of heavy crude oil in the presence of a dispersed molybdenum-containing catalyst. Pet. Chem. 2017, 57, 618–629. [Google Scholar] [CrossRef]
- Golmohammadi, M.; Ahmadi, S.J.; Towfighi, J. Catalytic cracking of heavy petroleum residue in supercritical water: Study on the effect of different metal oxide nanoparticles. J. Supercrit. Fluids 2016, 113, 136–143. [Google Scholar] [CrossRef]
- Fedyaeva, O.N.; Antipenko, V.R.; Vostrikov, A.A. Conversion of sulfur-rich asphaltite in supercritical water and effect of metal additives. J. Supercrit. Fluids 2014, 88, 105–116. [Google Scholar] [CrossRef]
- Fumoto, E.; Sato, S.; Takanohashi, T. Characterization of an Iron-Oxide-Based Catalyst Used for Catalytic Cracking of Heavy Oil with Steam. Energy Fuels 2018, 32, 2834–2839. [Google Scholar] [CrossRef]
- Xu, L.; Liu, Y.; Li, Y.; Lin, Z.; Ma, X.; Zhang, Y.; Argyle, M.D.; Fan, M. Catalytic CH4 reforming with CO2 over activated carbon based catalysts. Appl. Catal. A Gen. 2014, 469, 387–397. [Google Scholar] [CrossRef]
- Bermúdez, J.M.; Fidalgo, B.; Arenillas, A.; Menéndez, J.A. Dry reforming of coke oven gases over activated carbon to produce syngas for methanol synthesis. Fuel 2010, 89, 2897–2902. [Google Scholar] [CrossRef]
- Bulushev, D.A.; Ross, J.R.H. Towards sustainable production of formic acid. ChemSusChem 2018, 11, 821–836. [Google Scholar] [CrossRef] [PubMed]
- Bulushev, D.A.; Ross, J.R.H. Heterogeneous Catalysts for hydrogenation of CO2 and bicarbonates to formic acid and formates. Catal. Rev. 2018, 60, 566–593. [Google Scholar] [CrossRef]
- Reichert, J.; Brunner, B.; Jess, A.; Wasserscheid, P.; Albert, J. Biomass Oxidation to Formic Acid in Aqueous Media Using Polyoxometalate Catalysts—Boosting Fa Selectivity by in-Situ Extraction. Energy Environ. Sci. 2015, 8, 2985–2990. [Google Scholar] [CrossRef]
- Cui, Q.; Zhou, Y.; Wei, Q.; Tao, X.; Yu, G.; Wang, Y.; Yang, J. Role of the Zeolite Crystallite Size on Hydrocracking of Vacuum Gas Oil over NiW/Y-ASA Catalysts. Energy Fuels 2012, 26, 4664–4670. [Google Scholar] [CrossRef]
- Landau, M.V.; Vradman, L.; Valtchev, V.; Lezervant, J.; Liubich, E.; Talianker, M. Hydrocracking of Heavy Vacuum Gas Oil with a Pt/H-beta-Al2O3 Catalyst: Effect of Zeolite Crystal Size in the Nanoscale Range. Ind. Eng. Chem. Res. 2003, 42, 2773–2782. [Google Scholar] [CrossRef]
- Camblor, M.A.; Corma, A.; Martinez, A.; Martinez-Soria, V.; Valencia, S. Mild Hydrocracking of Vacuum Gasoil over NiMo-Beta Zeolite Catalysts: The Role of the Location of the NiMo Phases and the Crystallite Size of the Zeolite. J. Catal. 1998, 179, 537–547. [Google Scholar] [CrossRef]
- Dik, P.P.; Danilova, I.G.; Golubev, I.S.; Kazakov, M.O.; Nadeina, K.A.; Budukva, S.V.; Pereyma, V.Y.; Klimov, O.V.; Prosvirin, I.P.; Gerasimov, E.Y.; et al. Hydrocracking of vacuum gas oil over NiMo/zeolite-Al2O3: Influence of zeolite properties. Fuel 2019, 237, 178–190. [Google Scholar] [CrossRef]
- Surovikin, V.F.; Plaxin, G.V.; Semikolenov, V.A.; Likholobov, V.A.; Tiunova, I.J. Porous Carbonaceous Material. U.S. Patent 4978649, 18 December 1990. [Google Scholar]
- Yermakov, Y.I.; Surovikin, V.F.; Plaxin, G.V.; Semikolenov, V.A.; Likholobov, V.A.; Chuvilin, L.V.; Bogdanov, S.V. New carbon material as support for catalysts. React. Kinet. Catal. Lett. 1987, 33, 435–440. [Google Scholar] [CrossRef]
- Wang, Q.; Tsumori, N.; Kitta, M.; Xu, Q. Fast Dehydrogenation of Formic Acid over Palladium Nanoparticles Immobilized in Nitrogen-Doped Hierarchically Porous Carbon. ACS Catal. 2018, 8, 12041–12045. [Google Scholar] [CrossRef]
- Navlani-García, M.; Mori, K.; Salinas-Torres, D.; Kuwahara, Y.; Yamashita, H. New Approaches toward the Hydrogen Production from Formic Acid Dehydrogenation over Pd-Based Heterogeneous Catalysts. Front. Mat. 2019, 6. [Google Scholar] [CrossRef]
- Podyacheva, O.; Bulushev, D.; Suboch, A.; Svintsitskiy, D.; Lisitsyn, A.; Modin, E.; Chuvilin, A.; Gerasimov, E.; Sobolev, V.; Parmon, V. Highly Stable Single-Atom Catalyst with Ionic Pd Active Sites Supported on N-Doped Carbon Nanotubes for Formic Acid Decomposition. ChemSusChem 2018, 11, 3724–3727. [Google Scholar] [CrossRef]
- Bulushev, D.A.; Zacharska, M.; Shlyakhova, E.V.; Chuvilin, A.L.; Guo, Y.; Beloshapkin, S.; Okotrub, A.V.; Bulusheva, L.G. Single Isolated Pd2+ Cations Supported on N-Doped Carbon as Active Sites for Hydrogen Production from Formic Acid Decomposition. ACS Catal. 2016, 6, 681–691. [Google Scholar] [CrossRef]
- Fujitsuka, H.; Nakagawa, K.; Hanprerakriengkrai, S.; Nakagawa, H.; Tago, T. Hydrogen Production from formic acid using Pd/C, Pt/C, and Ni/C catalysts prepared from Ion-exchange resins. J. Chem. Eng. Jpn. 2019, 52, 423–429. [Google Scholar] [CrossRef]
- Wang, S.; Yin, Q.; Guo, J.; Zhu, L. Influence of Ni Promotion on Liquid Hydrocarbon Fuel Production over Co/CNT Catalysts. Energy Fuels 2013, 27, 3961–3968. [Google Scholar] [CrossRef]
- Satterfield, C.N. Heterogeneous Catalysis in Industrial Practice, 2nd ed.; McGraw-Hill: New York, NY, USA, 1991. [Google Scholar]
- Escola, J.M.; Aguado, J.; Serrano, D.P.; Briones, L.; Díaz De Tuesta, J.L.; Calvo, R.; Fernandez, E. Conversion of polyethylene into transportation fuels by the combination of thermal cracking and catalytic hydroreforming over Ni-supported hierarchical beta zeolite. Energy Fuels 2012, 26, 3187–3195. [Google Scholar] [CrossRef]
- Akhmedov, V.M.; Al-Khowaiter, S.H.; Akhmedov, E.; Sadikhov, A. Low temperature hydrocracking of hydrocarbons on Ni-supported catalysts. Appl. Catal. A 1999, 181, 51–61. [Google Scholar] [CrossRef]
- Li, X.B.; Wang, S.R.; Cai, Q.J.; Zhu, L.J.; Yin, Q.Q.; Luo, Z.Y. Effects of preparation method on the performance of Ni/Al2O3 catalysts for hydrogen production by bio-oil steam reforming. Appl. Biochem. Biotechnol. 2012, 168, 10–20. [Google Scholar] [CrossRef] [PubMed]
- De Haan, R.; Joorst, G.; Mokoena, E.; Nicolaides, C.P. Non-sulfided nickel supported on silicated alumina as catalyst for the hydrocracking of n-hexadecane and of iron-based Fischer−Tropsch wax. Appl. Catal. A 2007, 327, 247–254. [Google Scholar] [CrossRef]


© 2020 by the authors. Licensee MDPI, Basel, Switzerland. This article is an open access article distributed under the terms and conditions of the Creative Commons Attribution (CC BY) license (http://creativecommons.org/licenses/by/4.0/).