Article

Redox Flow Batteries: A Literature Review Oriented to Automatic Control

Institut de Robòtica i Informàtica Industrial, CSIC-UPC, Llorens i Artigas 4-6, 08028 Barcelona, Spain
*
Author to whom correspondence should be addressed.
Energies 2020, 13(17), 4514; https://doi.org/10.3390/en13174514
Submission received: 30 June 2020 / Revised: 16 August 2020 / Accepted: 27 August 2020 / Published: 1 September 2020

Abstract

:
This paper presents a literature review about the concept of redox flow batteries and its automation and monitoring. Specifically, it is focused on the presentation of all-vanadium redox flow batteries which have several benefits, compared with other existing technologies and methods for energy stored purposes. The main aspects that are reviewed in this work correspond to the characterization, modeling, supervision and control of the vanadium redox flow batteries. A research is presented where redox flow batteries are contextualized in the current energy situation, compared with other types of energy storage systems. Furthermore, a presentation about the current challenges on research, and the main existing installations is view. A discussion about the main dynamic models that have been proposed during last years, as well as the different control strategies and observers, is presented.

Graphical Abstract

1. Introduction

It is well-known that we are currently living a situation of environmental crisis. This environmental crisis is linked to the need to obtain the necessary energy for society. Over recent decades, most of the energy came from fossil fuels [1] that generated a large number of greenhouse gas emissions, such as CO 2 emissions [2,3]. For this reason, there has been a change in the energy paradigm, adopting a global transition towards more environmentally friendly activities [4].
Nowadays, the use of renewable energy sources (RES) to produce energy is growing significantly [5]. Most of these RES (wind, solar and marine) are usually discontinuous, due to their dependency on the weather conditions. This results in the difficulty, even impossibility, to schedule this type of energy source. In order to satisfy the energy demand at times of low energy production, the need of an energy storage system (ESS) is mandatory [6,7]. ESS can store energy, normally the surplus energy from renewable sources, and provide it when the environmental conditions do not make possible to generate all the energy required. Therefore, ESS is seen as an element that can be combined with power generation systems, such as photovoltaic or wind systems [8,9]. Another important advantage apart from the load leveling, is its function as a support element for generation and distribution lines of the electricity grid [10].
There are different types of ESS depending on how energy is obtained. Mainly, it can be differentiated between mechanical, electrical and electrochemical storage systems [11]. Especially, the search for large-scale energy storage system solutions, in terms of capacity and time, has great importance due to its many benefits. During periods of RES low production, ESS can increase considerably the available power and therefore contribute to guarantee the energy supply. Table 1 summarizes the principal characteristics of the main ESS.
Inside the group of mechanical large-scale ESS, the most popular ones are the pumped hydro energy storage (PHES) and compressed air energy storage (CAES) systems [12]. The main advantage of PHES and CAES systems is their high energy capacity. PHES systems have also high efficiencies between 70% and 80%, claiming up to 90% in some installations [13]. PHES systems are also the largest-capacity form of grid energy storage available, being in 2017 the type of active installations with the highest capacity with more than 184 GW worldwide, which represented 95% of all active tracked storage installations [14]. As disadvantages, both PHES and CAES require stable geological structures, which substantially limit the use of this type of systems [15]. CAES also has the drawback that its energy efficiency is less than 70% [16], even reaching values below 45% [17,18].
As for electric large-scale ESS, the most common is the superconducting magnetic energy storage (SMES) system [19], which is based on the use of electro-magnetic energy, and the electric double layer capacitor (EDLC) which directly uses electric energy. The main advantage of SMES is its energy efficiency, about 90% [20]. The main disadvantage is the high cost of superconducting wire, which, with the refrigeration energy that this system needs, makes this technology more appropriate for short-term applications [21]. The main advantages of EDLC are that can deliver large amounts of power and its long life cycle (supporting more than one million of charge and discharge cycles). On the other hand, they have low energy density, and they only can store energy for short periods of time due to the self-discharge phenomenon [22].
In the last group of ESS, which corresponds to the energy storage from chemical reactions, there are different batteries and emerging technologies [23]. Typical batteries that have been used for many years are lead-acid, sodium-sulphur and lithium-ion. The strengths of lead-acid batteries are their low cost and good efficiencies from 75% to 80% [24]. In counterpart, they have short life (between 200 and 1800 charge and discharge cycles) and they are extremely toxic [25]. Sodium-sulphur has higher energy density than lead-acid batteries, with similar efficiencies but with larger lifetime around 2500 cycles [26,27]. The main problem of this type of technology is its operating temperature (about 300 C) and a poor safety due to possible leaks of the liquids inside it. Finally, lithium-ion is the best choice compared to the previously named ones, having a larger energy density [28], and a long life, greater than 2500 cycles [29]. On the other hand, it is important to remark that some damages, such as overcharge or perforation cause damage to the battery, leading to explosions and fires if is damaged or incorrectly charged.
Nowadays, inside the group of electrochemical ESS, more research is being done, specially in fuel cells and redox flow batteries. Fuel cells [30,31] convert chemical energy from a fuel (usually hydrogen) into electric energy through an electrochemical reaction between the fuel with an oxidizing agent (oxygen). Its main distinction from a battery is that requires a continuous source of species. Combining the fuel cell with an electrolyzer it is possible to store the chemical energy, becoming an ESS, which is called regenerative fuel cell (RFC) [32,33]. One of the main advantages of its use is that is a clean ESS, being water vapor the residue that comes out. In terms of efficiency, typical values oscillate between 40% and 60% [34,35]. Most losses are in the form of heat, so in the case of an application in which it is necessary to capture waste heat in a cogeneration system, efficiencies can reach 85% [36].
Redox flow batteries (RFB) are composed of an electrochemical cell where chemical energy is provided by two chemical components dissolved in liquids contained within the system and separated by a membrane. They have become one of the most promising options for large-scale energy storage systems [37,38]. Depending on the nature of the fuel, there are two modes of operation for a redox flow battery. If the flowing fuel is depleted by the reaction, and cannot be reused, then it is removed from the system and new flow is added. In this situation, it actuates as a fuel cell. The second possibility, is that it works like a rechargeable battery, where there is always fuel flowing in the system. In this second case, it is called RFB.
One of the main characteristics of RFBs and RFCs is the duality between energy capacity and power. Energy capacity is function of the electrolyte volume, which is usually stored in tanks. Depending on their volume, they can provide energy from minutes to several hours [39]. The power is directly related with the surface of the electrodes, and the number of cells that compose the system [40]. Other important advantages are their safety, flexible design, long life and that they are specially designed for large-scale storage applications, because self-discharge is practically non-existent, saving or providing energy during long periods of time. In terms of charge/discharge efficiency, RFBs have values between 75% and 85% [41], while RFCs have lower efficiencies. For that reason, comparing both of them, RFBs are a great proposal for large-scale ESS.
Comparing RFBs with other ESS, taking into account 
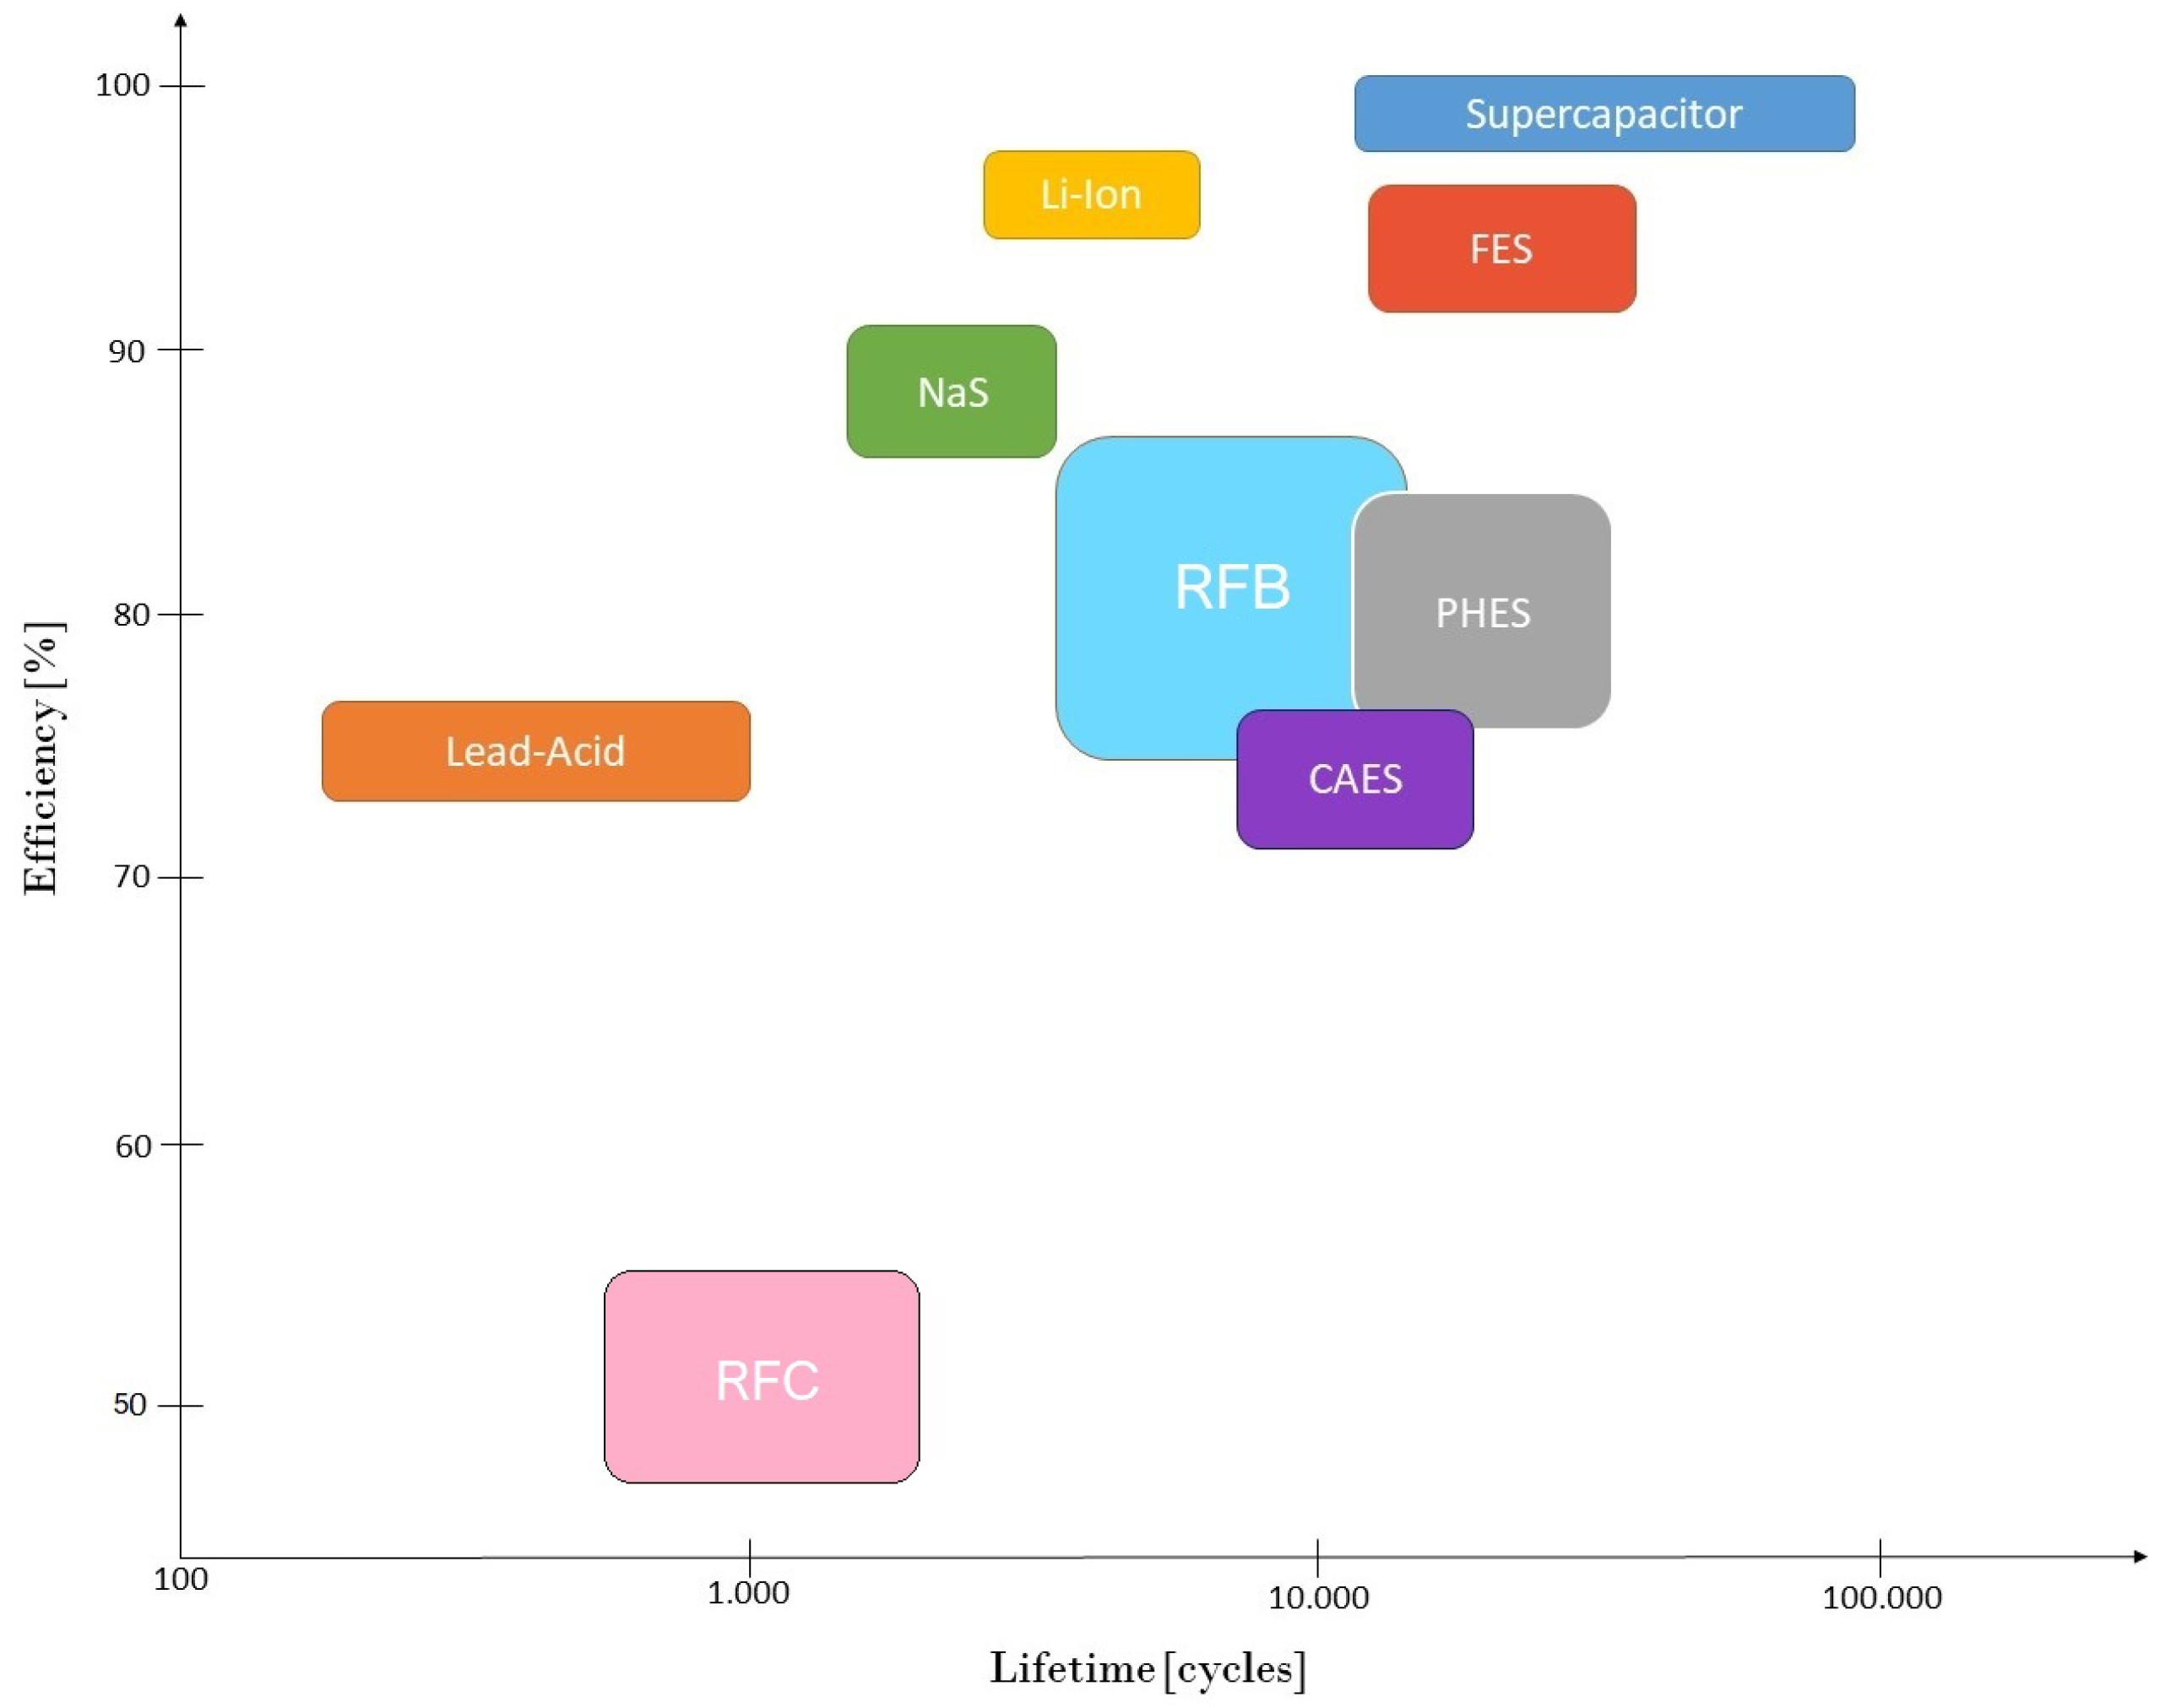
Table 1 it is possible to make clear that RFBs allow large amounts of energy to be delivered over long periods of time, without the need for a specific geographical location, as in the case of PHES and CAES systems. In terms of safety, they are better than classical batteries such as lead-acid, sodium-sulphur and lithium-ion. If they are compared in terms of efficiency and lifetime, RFBs are also a good choice, as can be noticed in Figure 1.
In comparison with lithium-ion batteries, which have become one of the most promising options in electrochemical ESS, RFBs have as benefits their greater lifetime, safety and low cost [
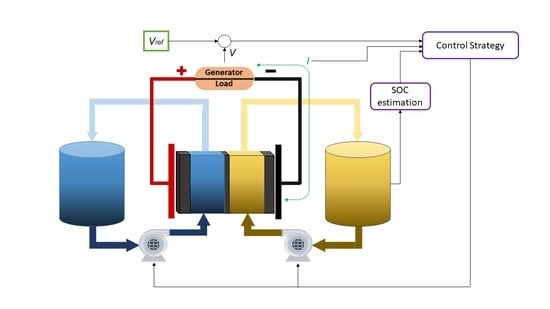
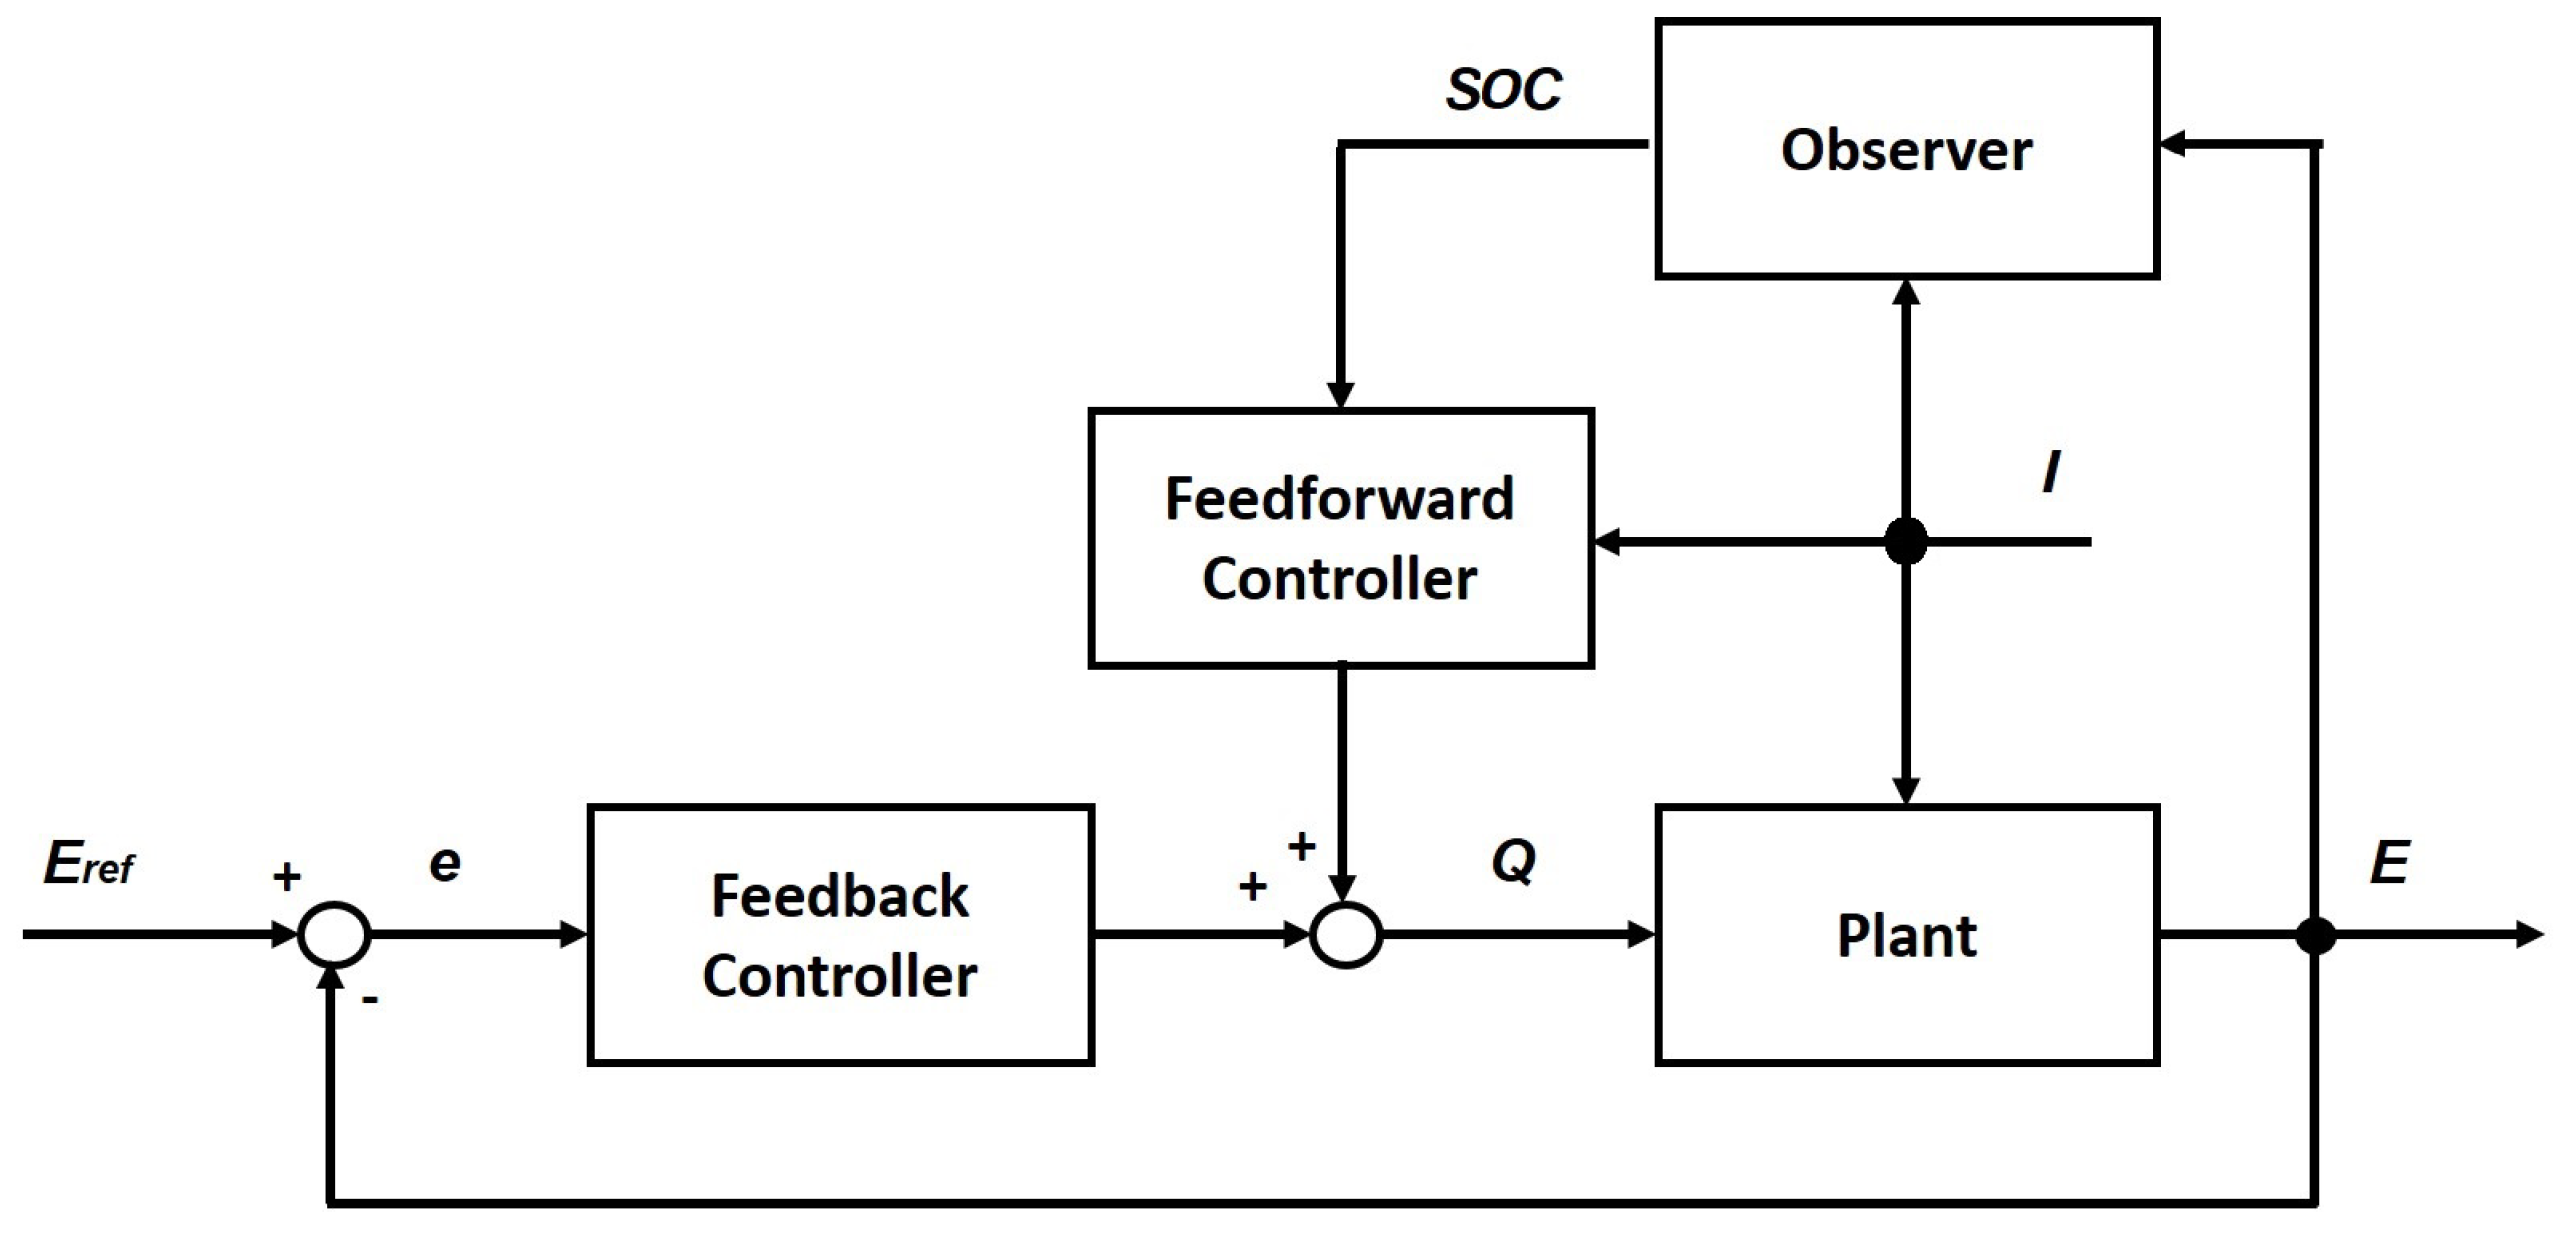
43]. However, lithium-ions batteries present higher energy density. In terms of sizing, RFB differs from lithium-ion technology in the duality between power and energy capacity. From an automatic control point of view, lithium-ion batteries contain no active elements consequently do not require any control [44]. On the other hand, RFBs require a good control strategy to improve its efficiency, required by the pumps which make the electrolyte flow in the system. In both technologies, obtaining good control-oriented models and developing methodologies to estimate most relevant parameters from empirical data are important research topics. Their tuning are of great relevant to estimate the State Of Charge (SOC) and the State Of Health (SOH). In the case of RFB, the SOH study has not yet been developed while for lithium-ion batteries there are already numerous studies. Although there has been a lot research in this topic it is still and open research area [44,45,46,47].
Analyzing the RFB individually, the main benefits of this type of ESS are [48]:
  • High duration in terms of energy supply, managing to reach hours. There are several facilities in operation whose supply period is around 5 h, although there are operational cases in which it reaches 10 h [49].
  • Modular technology, existing an independence between power and energy density. This allows to have a flexible design depending on the required operation conditions.
  • Long life, higher than thousands of cycles [50].
  • Thermally safe, operating at low temperatures close to ambient ones [51].
  • Quickly recharge by replacing the electrolyte or reversing the redox reaction.
  • Self discharge is not significant, only takes place in the cell where species react. The active species stored in the containers (which are usually much larger than the cell) do not react and self-discharge does not take place [52].
  • Its operation could be stopped quickly by cutting off the flow of electrolytes.
Although the advantages listed above, make RFBs a good large-scale storage system, there are some drawbacks to consider. The main one is their low energy density, in comparison with other systems. In order to store large amounts of energy, it is necessary to have larger tanks. Although its charge and discharge efficiencies are high, reaching the order of 80%, is lower than other ESS, due to the energy consumption to allow the flow of electrolytes in the system.
There are different types of RFBs according to the species that react, but all of them present the same operating mechanism. A typical example is the Fe-Cr RFB, which uses Fe(III) and Fe(II) as positive active species, and the species Cr(III) and Cr(II) as negative ones, all of them dissolved in HCl [53]. Other examples are the iron-chromium (I-Cr) and the zinc-bromide (Zn-Br) batteries [54,55].
Specially, vanadium redox flow batteries (VRFB) are of great importance due to their benefits compared to other species, being the object of study in recent years [56]. The main reason for its use is that since it is made up of only vanadium, there is no possibility that different substances mix and degrade the battery. The VRFB use V(IV) and V(V) oxidation states as positive active species, and V(II) and V(III) as negative species, all of them dissolved in a solution of H 2 SO 4 [57].
Due to the complexity of a RFB system, that depends on different variables such as the electrolyte concentration, current density, temperature or flow management, more research will be done to understand better the RFB operation that will be directly translate in well optimized RFB systems. Moreover, due to the presence of harmful phenomena such as leakage currents, electrolyte escape and the possible corrosion and degradation of membrane, electrodes and other stack components, a research in mitigation strategies of these phenomena will be necessary [58].
Another important aspect to consider is the cost of the RFB system. Inside this economical scenario, more research is being done in order to design low-cost RFB systems that are capable to store large quantities of energy maximizing the performance of the battery. In order to accomplish it, the correct choice of the main components such as electrodes, membranes, bipolar plates and cells is critical. Selecting a good electrode structure allows to have a higher electrocatalytic activity, and if the surface area is higher enough, it will be possible to increase the volume production of new species. For the membrane, there are different studies that analyze and compare different materials in order to find the one that best suits with the designed battery. Thus, taking into account the species that react, as well the design of the other components, further investigations will be conducted to find an equilibrium between a better selectivity and stability, as also a lower cost. In terms of bipolar plates, more research is necessary to scale-up the battery, increasing both power and energy density.
Considering the materials with which the RFB are built, the search for organic materials in terms of active materials, electrolytes and membranes is one of the research hot topics. In this scenario, there is recent progress in the search for organic RFB [59], which would allow to have a more environmentally attractive technology.
Taking into account the great possibilities that RFBs present as large-scale storage systems, as well as the numerous studies that are being carried out on them, in this work a review of most relevant concepts in RFB, from an automatic control point of view, will be presented. As previously stated, other topics such as materials will be very important in the near future but are outside the scope of this work.
The work has the following organization: Section 2 shows the composition of a RFB; Section 3 presents the main expressions needed to determine the battery sizing according to specific conditions of power and energy; Section 4 shows the main characteristics and applications of RFB; Section 5 presents a review on the literature of RFB models; Section 6.1 presents the main control strategies of RFB systems; Section 6.2 presents the main techniques to estimate the state of charge, and other parameters and variables. Finally, Section 7 contains some conclusions and future investigations.

2. Composition and Operation of VRFB

RFB are secondary batteries, which means they are rechargeable. Its principle of energy conversion is based on electrochemical reactions of two redox couples [60]. As its name suggests, they are based on the principle of redox reactions. A redox reaction can be defined as a phenomenon in which there exists an exchange of electrons between two different species [61]. On the one hand, species that losse electrons are called oxidized species. On the other hand, species that win electrons are the reduced ones. The gain or loss of an electron is equivalent to a change in the oxidation state of the element. Then, both process of oxidation and reduction can be defined as:
  • Oxidation: increased oxidation state of a specie, caused by the loss of one or more electrons.
  • Reduction: decreased oxidation state of a specie, caused by the gain of one or more electrons.
Once the principles of redox reaction have been explained, it is possible to understand the operation of a redox flow battery, and their main components. 
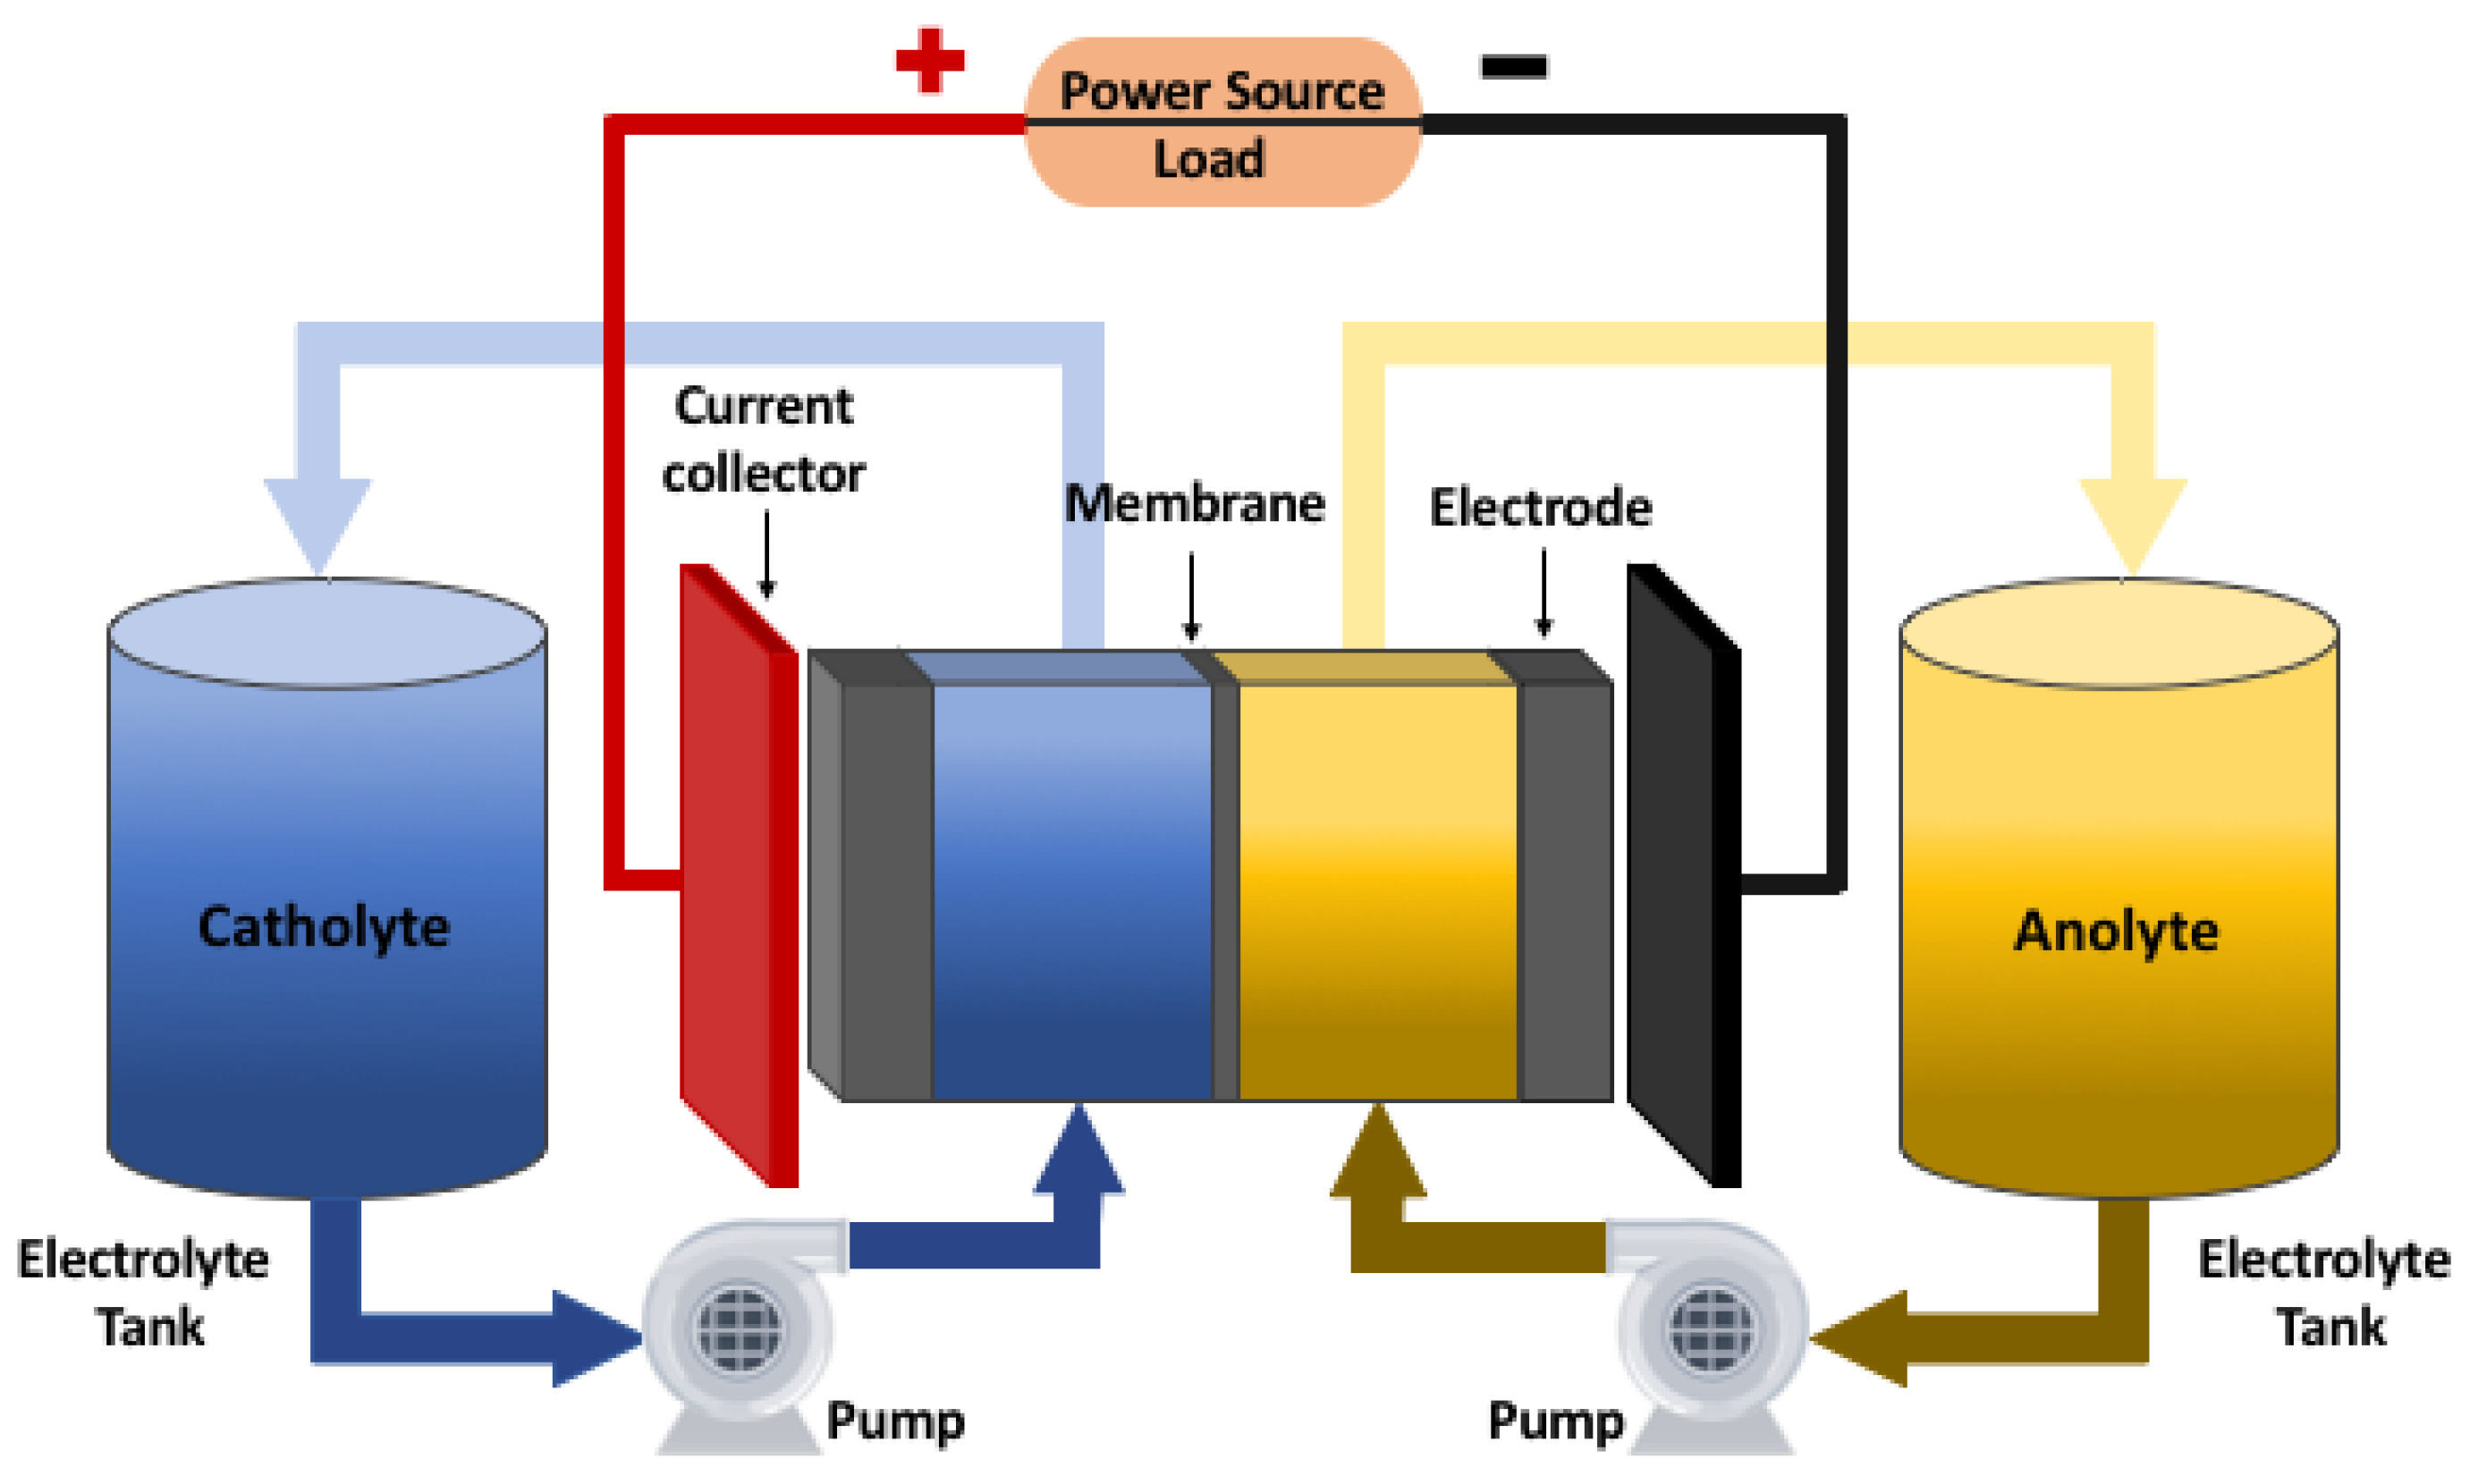
Figure 2 shows the scheme of a redox flow battery with its main components.
A redox flow battery is composed by two electrodes whose function is to be the surface where oxidation-reduction reactions take place. The potential difference that is generated between the electrodes is determined by the electrochemical reaction that occurs, which depends on the chemical elements that make up the reaction. Lot of research has been done to find the best materials and dimensions for the electrodes. In terms of electrode composition, first investigations analyzed carbon and non-carbon materials. For the case of non-carbon materials as metals, it was found that were unsuitable for use in both half-cells [62]. Carbon has been identified as the best material for use in both electrodes of a VRFB, and different studies have been done that analyze its use and advantages [63,64,65,66].
The electrons that appear on the redox reaction can be defined as a current that passes through the cell continuously. Current flow exists due to the presence of two collector plates located at the end of the cell. The direction of current flow depends on whether the battery is in the process of charging or discharging. The number of electrons will depend on the current density and the electrode surface area. Typical values of current densities vary between 10 mA/cm 2 to 800 mA/cm 2 , depending on the design of the VRFB [67]. Using a Nafion membrane, usual values of current densities must vary only in a window between 80 mA/cm 2 to 140 mA/cm 2 obtaining efficiencies between 80% and 90%, because increasing the current density above the 150 mA/cm 2 lower efficiency is observed due to the higher ohmic resistance of Nafion membrane [68]. Different studies have analyzed the limitation of the maximum current density for VRFB obtaining 750 mA/cm 2 for three layers of carbon fiber paper [69]. Taking into account that typical current values vary from 20 A to 150 A it is possible to have an idea about the surface of the electrode, taking values between 100 cm 2 and 2000 cm 2 .
The main feature of this type of system is that the electrolytes are not only contained within the cell as in conventional batteries, but are stored in two independent tanks. The electrolytes are composed by the active species in an specific concentration, and are dissolved in a strong acid solution that typically is hydrochloric acid (HCl) or sulfuric acid (H 2 SO 4 ). One tank contains the positive electrolyte (catholyte) and the other contains the negative electrolyte (anolyte). Fluids from the tanks containing the electrolytes are pumped into two closed circuits through the battery stack (consisting of several flow cells stacked together) and the redox reaction occurs. The new species after the reaction are recirculated to their corresponding tank due to the closed circuit.
The electrolytes tanks always contain the same amount of liquid, but the oxidation state of each specie will depend on the reaction that takes place in the cell during the operation of the system. As long as there are species that can be transformed, the battery can continue the process of charging or discharging.
The membrane has the function of separating the electrolytes inside the cell, preventing them from mixing with the redox species. At the same time, it has to allow the transfer of ions to maintain the electroneutrality of the system [68]. For that reason, it is necessary to choose an special ion-selective membrane depending on the species [70]. Different types of membranes have been explored and investigated as Nafion cation exchange membranes (CEMs), tungstophosphoric acid (TPA), sulfonated polymer membranes and others [71,72]. Some studies have shown that over time, the membrane degrades and begins to appear the crossing of ions from one electrolyte to the other, polluting both electrolytes [73]. This fact causes a reduction of the efficiency and lifetime of the complete system, making it necessary to change the cell and electrolytes. Taking into account this common problem in redox flow batteries, the best solution that has been implemented in the recent years is the use of vanadium species as electrolytes [58,72]. The first VRFBs explorations were done in the 1930s, by Pissoort [74]. In the 1970s, Pellegri and Spaziante patent the VRFB [75], but they could not demonstrate the correct operation of this technology. Skyllas-Kazacos in the 1980s was the first person to succesfully demonstrate the all-vanadium RFB [76].
In a VRFB, the electrolytes contain vanadium salts dissolved in concentrated solutions of sulfuric acid. Their redox reactions involve four oxidation states of vanadium (+II, +III, +IV, +V). They are the same one with different oxidation states, allowing the possible mixing of electrolytes without becoming a problem for the system [77].
The negative electrolyte (anolyte) is composed by V 2 + and V 3 + vanadium species. The positive electrolyte (catholyte) is composed by V 4 + and V 5 + . The maximum vanadium ion concentration that can be employed for wide temperature range operation is typically 2 M or less [57,78]. This means that for each liter of solution is composed of vanadium ions and H 2 SO 4 , there are 2 mols of vanadium species dissolved on it. This concentration is equivalent to an energy density of around 25 Wh/kg. This value ensures the solubility of vanadium ions even in temperatures below 5 C. At the same time ensures the stability of vanadium ions at possible temperatures above 40 C [79].
During the charging process, the V 4 + oxidizes and becomes V 5 + releasing an electron. This electron is transferred from the anode to the cathode through external circuit, and reduces V 3 + to V 2 + on the other electrode.
During the discharging process, the oxidation of V 2 + to V 3 + takes place in the negative electrolyte (anode) and the released electron goes to cathode reducing V 5 + to V 4 + . The vanadium species V 4 + and V 5 + exist as oxides, which are respectively, V O 2 + and V O 2 + .
The chemical reactions that take place in the cell are the following ones:
V 2 + V 3 + + e V O 2 + + 2 H + + e V O 2 + + H 2 O
where → represents the charge process, and ← the discharge process.
The electrochemical cell, can be seen from a chemical point of view, as a two-part system according to the presented redox equations. The cell potential has a contribution from both anode and cathode reactions. In the anode as a measure of its ability to lose electrons (oxidation potential). The cathode has a contribution based on its ability to gain electrons (reduction potential). The standard cell potential E θ can then be written as:
E θ = E c a t h o d e θ E a n o d e θ .
The standard potential for each half-reaction process in standard conditions of pressure, concentration and temperature are defined in chemistry reaction tables [80,81]. For the case of the VRFB, the standard potential is:
V 2 + V 3 + + e E a n o d e θ = 0.255 V V O 2 + + 2 H + + e V O 2 + + H 2 O E c a t h o d e θ = 1.004 V
Taking into account (1) and (3), it is possible to write the global reaction obtained from both reactions together, with his cell standard potential:
V 2 + + V O 2 + + 2 H + V O 2 + + V 3 + + H 2 O E θ = 1.259 V .
The cell standard potential gives only information about the chemical part of the reaction that takes place inside the cell. The electrode potential E depends on the concentrations of vanadium species c i that exist in the cell. Its value can be obtained using (5) which is the Nerst equation:
E = E θ + R T F ln c V O 2 + c H + 2 c V O 2 + c a t h o l y t e · c V 2 + c V 3 + a n o l y t e ,
where R and F are, respectively, the gas and Faraday constant, and c i is the concentration of each vanadium species, which is found in the catholyte or anolyte electrolyte (see Table 2).
Taking into account Equation (5) it is possible to obtain the theoretical value of the cell voltage. As it can be noticed, it only depends on the vanadium concentrations, without any external load connected. For that reason, it is called open-circuit voltage (OCV). It is important to take into account that the theoretical OCV of the VRFB has two extreme values which correspond to a state of complete or null charge of the cell. In both cases, these extreme values are far from those measured experimentally (theoretically tend to infinity). For this reason, the extreme values of the OCV are considered experimentally. Many studies agree that the maximum value of the cell voltage during the charge is between 1.6 and 1.7 V, and drops to 1.1 V in the discharge case [82,83].
From this experimental value it is possible to see that the power that the cell can generate is not very high. As it has been explained, VRFBs are especially useful to work with high values of power and energy. In order to increase the power, a number of cells have to be connected in series, obtaining what is commonly named stack. The total voltage of the stack can be calculated as the sum of all cells voltage connected in series.

3. Battery Sizing

The main characteristics of VRFBs is their modularity in terms of power and energy stored. The power directly depends on the current and stack voltage. The energy capacity depends on the volume of the tanks. Taking into account both concepts, the objective of this section is to determine the volume of the tanks, and the number of cells needed for the stack to guarantee any operational specifications.

3.1. Stack Sizing

The power depends on the discharge/charge current and the voltage that is generated between the electrodes of the stack. The maximum value will be reached when both current and voltage are maximum.
The current is conditioned by the effective surface of the electrodes and the density of electric current. Assuming a constant density current (J), the effective area of the electrode for a maximum current will be:
S = I m a x J .
For this maximum current, the voltage need for the stack is calculated as:
E s t a c k = P I m a x ,
where P is the maximum amount of power that the system can generate. Then, the number of cells connected in series in the stack need to guarantee this voltage is:
N = E s t a c k E c e l l ,
where E c e l l represents the voltage that will be reached between the extremes of a cell, according to (5). As the experimental values of cell voltage vary between 1.6 and 1.7 V [82] for the charging operation, and between 1.0 and 1.1 during the discharge, it is a good assumption to consider that the E c e l l value is approximately 1.1 V. With this value, it is possible to obtain a good approximation of the number of cells that must compose the stack to obtain the desired power that the VRFB must deliver.

3.2. Tank Sizing

The energy ( E ) can be defined in the field of electricity as the power needed to move a charge of 1 Coulomb through a potential difference of 1 V. Then, it can be expressed as:
E = E c e l l · Q c ,
where E c e l l represents the potential difference, and Q c the charge. The charge inside the tank can be calculated as follows:
Q c = c V V t a n k s N A e ,
being c V the total concentration of vanadium dissolved in the solution, V t a n k s the total volume of electrolyte (vanadium species and solvent) that must be stored in the system, N A the Avogadro constant and e the electron charge.
Taking into account that the redox reactions occur simultaneously in both half-cells, the total energy stored in W · h in the system is divided between the catholyte and anolyte:
E = 1 2 E c e l l c V V t a n k N A e 3600 .
Finally, the necessary volume of each tank to store a required amount of energy is obtained from Equation (11):
V t a n k = 7200 · E c V E c e l l N A e .
Table 3 summarizes all parameters that must be taken into account to design the battery sizing.
It is important to notice that from Equation (12) it is possible to derive the energy density per volume unit ( E ρ ) as:
E ρ = E 2 V t a n k .
The energy density of the complete system that makes up the VRFB is smaller than the ones calculated by (13). Theoretically, the energy density of VRFB systems is about 28 Wh/L, but in real applications it has been found that the ranges go from 15 to 25 Wh/L [84].
The difference between the theoretical energy density value and the real one found experimentally, is due to the following factors [82]:
  • The pump consumes energy to make the liquid flow.
  • The power converter has electrical losses, while the pipes and pumps have hydraulic losses.
  • The electrochemical is subject to reaction Internal losses such as activation overpotential, concentration overpotential and ohmic losses, which depend on the operational conditions [85].
All these factors are difficult to collect in analytical models and expressions. For that reason, to check the real effect is necessary to develop experiments or simulations with high accuracy. Therefore, it is necessary to correctly determine the parameters of all elements, obtaining non-general results. According to literature, the total efficiency is around an 80 % of the theoretical one [86].

3.3. Example

In order to have a practical idea of the battery sizing of a VRFB with real values, an example is shown. The proposed VRFB is a 1.5 kW, and 15 kWh system operating at a nominal current of 50 A. Table 4 shows the battery parameters for this example.
As it can be seen in Table 4, two tanks of 400 L capacity would be needed. This would represent a total amount of approximately 732 kg of H 2 SO 4 which is the solvent, and 178 kg of vanadium species which represent the solutes that react inside the cell, based on the molar mass of the electrolyte species [84,87]. These amounts of chemical species have been calculated taking into account the typical value of vanadium ion concentration, which, as explained, usually is 2 M.

4. Main Existing Applications and Installations

One of the main characteristics of flow batteries is that they are considered to be used for large energy storage applications. Taking into account its large operational range in terms of power and energy, these systems are a good choice for all those stationary applications that require large stored energy. Some examples are:
  • Interstational storage, due to the volume of the systems they are designed to be placed in stationary applications that require a specific demand of power depending on factors such as the weather, season or day, among others.
  • Load leveling function, storing the surplus energy during off-peak demand periods, and using it during periods of high demand of energy. This guarantees the existence of a balance between the supply and the demand energy [88].
  • Uninterruptible power supply (UPS) in case of failure of the main power source, being necessary to provide power continuously for a certain period of time [89].
  • Support systems in renewable energy installations, such as wind or solar, during periods of high energy demand. Specially, in stand alone power systems where power can not be obtained from the electric grid [90].
  • Electric or hybrid vehicles, especially those of large dimensions due to its low energy density [91]. Some examples are buses and maritime vehicles such as boats, ships or submarines.
  • Storage applications that require a full charge from an initial, empty state to full load. Due to the VRFBs ability to perform full charge cycles, they are useful in this regard. A particular case are solar installations where you want to be able to store as much energy as possible depending on weather conditions.
There are different installations that have adopted VRFBs for some of the different applications described. Table 5 lists the main existing facilities, with their respective details regarding operational characteristics and applications.
In 1996 the Kashima-Kita Electric Power group from Japan, develop a VRFB of 200 kW of power and 800 kWh, for load-leveling applications [57]. Kansai Electric company, has been developing RFB in collaboration with Sumitomo Electric Industries, since 1985. In 2000 they installed in Tatsumi substation a prototype of 200 kW 8 h system [92]. It was conceived for applications in load-leveling and peak-shaving. Sumitomo Electric Group from Japan, developed a 4 MW 6 MWh VRFB, in 2005, for peak-shaving and UPS applications [93]. It is one of the leading companies of RFBs, and has successfully run many pilot projects worldwide. In 2016, the Hokkaido Electric Power Company (HEPCO), developed the largest flow battery project until that moment. The installation of 15 kW 60 MWh was aimed to the grid integration of wind renewable energy [94]. In Pfinztal, Germany, the Frauhofer institute launched a project to installate a VRFB of 2 kW and 20 MWh for testing purposes [95].
It is important to notice how the amount of stored energy has been growing over the years. The Hubei Zaoyang project planned to install in Zaoyang an installation that could reach 10 MW of power and 40 MWh of energy stored [96]. This project took place in China, where a great investment in VRFBs has been launched by the China National Development and Reform Commission (NDRC) to develop different projects. Hubei Zaoyang has launched the installation of a 100 MW and 500 MWh redox flow system [97]. Another project under way is a 200 MW and 800 MWh vanadium ESS in Dalian, carried out by chinese companies UniEnergy Technologies (UET) and Rongke Power [97].

5. Mathematical Models

To study the behaviour of the VRFBs from a theoretical point of view, it is necessary to model the real system taking into account the variables that make it up. Most of the systems use mathematical models, that can take different forms using dynamic formulation, differential equations, statistical models or logical formulation, among others. The mathematical model of a system can be based on one or more parts of study.
The first distinction that exists between models is how the behaviour of the system is described as a function of time. That is to say, whether the effect of time is taken into account or not. If time is taken into account, the model is dynamic whereas if the system is not time dependent, it is called static [98]. In terms of model VRFBs, it is obvious that due to the characteristics of both flow and current, it must be modelled taking into account the behaviour along the time.
The second distinction for modelling is taking into account, or not, the space dimension. Models that take into account the space dimension are usually named Distributed parameter models and use partial derivative equations. In RFBs there exist many phenomena that can only be described through distributed models, such as the distribution of the vanadium species or temperature along the tanks and cells, or the flow rate in the pipes. There are different studies that have modelled some aspects of the RFB using this type of model [99]. These models make possible to analyse how the flow is distributed along the cells, obtaining a realistic approximation about the distribution of vanadium concentration inside them [100]. Non-uniform distribution of flow field is analysed using a parameter distributed model in [101,102]. One of the main computational tools that exist to obtain 3D models, is COMSOL [103], which is a finite element analysis, that allows to solve multiphysics systems. This software has been used to analyse the VRFB performance taking into account the electrode and flow field [104].
The disadvantage of Distributed parameter models, is that they are very complex and they can not be used for analytical analysis. Their solution requires relevant computational resources and can not be solved in short time.
For this reason, RFB automatic control problems are addressed using reduced order models, or Lumped parameter models. In this type of models most relevant variables, such as current or flow, do not depend on space. These assumptions allows to simplify the model. These models allow to perform analytical analysis and obtain their solution with a reduced computational cost. Despite its simplicity these models closely resemble the actual behaviour of the system [105]. In this scenario, multiple and different models have been proposed. Table 6 contains a classification of most relevant RFB models.
A VRFB system, can be mainly separated in three different physical models, which are the electrochemical, the thermal and the hydraulic. All of them are interconnected. In the electrochemical part, the current and flow rate play a key role, but the temperature has also importance. In the thermal model, the concentration of species from the electrochemical part, together with the flow rate and current are the important factors to take into account. Finally, the hydraulic part is related to the other models by the flow rate, which is the variable that plays the key role. In the following, a review of the characteristics of each of these parts is presented.

5.1. Electrochemical Model

One of the main parts of interest of the VRFBs is the behaviour of the vanadium concentrations. As have been explained, it has a direct effect on the voltage and therefore, in the power and energy of the system. There are different approaches to model the electrochemical part.
Some studies use differential equations that determine the behaviour of concentration of vanadium species through the redox reactions that take place [106,107]. Another ones, take into account the Nerst equation, and by measuring the voltage are able to model the behaviour of vanadium concentration species inside the system [108]. This second approach, has the drawback that it only takes into account the cell voltage, and not the input variables such as the flow rate or current. For this reason, it cannot be used for control purposes, since input variables such as current or flow rate, that are the only ones that the user can manage, have not effect in the model presented. Finally, there are some studies which use equivalent circuit models, to describe the behaviour of the electrochemical part. An electric circuit model is used in [118,119] to model the state of charge. Another study that uses this type of model to monitor the capacity decay of the VRFB is [120].
Using directly the redox reactions that take place, it is possible to obtain a model of the vanadium concentration variation along the time. A realistic electrochemical model was develop by Maria Kazacos [107], which is based on the determination of the vanadium concentrations behaviour with respect to the current and the flow rate of electrolytes. This model has been widely used in different studies [109,110,111].
The model assumes an homogeneous concentration in the cell. The behaviour of the concentrations changes in a cell ( c i c e l l ) for RFB of any species is described by the following differential equation:
V c e l l 2 d c i c e l l d t = Q ( c i t a n k c i c e l l ) ± I z F D i ,
where V c e l l is the volume of the cell, c i t a n k is the concentration of vanadium in the tank and F the Faraday’s constant. As can be noticed in Equation (14) the concentration of each vanadium species, i, depends on three different factors, which are the flow rate, the current and the diffusion:
  • Q: is the electrolyte flow rate. The amount of new electrolyte inside the cell, be understood as the difference between the input flow of concentrations (which comes from the tanks) and the output (the previous time concentration in the cell).
  • I: represents the current and is directly related to the redox reaction that takes place in the cell. The relation between the reduction or oxidation of a vanadium specie and an electron is 1/1 ( z = 1 for vanadium redox flow systems) as can be observed in VRFBs’ redox reaction (1). For a positive current, vanadium species V 2 + and V 5 + increases, while V 3 + and V 4 + species decreases in the cell. For discharge currents, the opposite happens. Using the Faraday’s constant is possible to establish the concentration of vanadium species in mols.
  • D i : is the diffusion part. Depends on each vanadium specie, and is defined and modelled by Fick’s law:
    D i = S d ( α I I i k 2 c 2 c e l l + α I I I i k 3 c 3 c e l l + α I V i k 4 c 4 c e l l + α V i k 5 c 5 c e l l ) ,
    where S is the membrane surface, d the membrane thickness, α I i express the mass balance between the vanadium species and k i is the diffusion coefficient of each specie, which depends on the temperature by the following Arrhenius equation [109]:
    k i = A 0 e E i R T s t a c k ,
    being A 0 a pre-factor, E i the activation energy of specie i, R the universal gas constant and T the temperature of the electrolyte inside the stack.
Finally, it is possible to model the concentration of vanadium specie in a cell using the state-space representation for the case of a charging process (positive current):
V c e l l d d t c 2 c e l l c 3 c e l l c 4 c e l l c 5 c e l l = c 2 t a n k c 2 c e l l c 3 t a n k c 3 c e l l c 4 t a n k c 4 c e l l c 5 t a n k c 5 c e l l Q + 1 z F 1 1 1 1 I + S d k 2 0 k 4 2 k 5 0 k 3 2 k 4 3 k 5 3 k 2 2 k 3 k 4 0 2 k 2 k 3 0 k 5 c 2 c e l l c 3 c e l l c 4 c e l l c 5 c e l l .
In the case of a discharging process, the unique difference will be the sign of the current vector. The tanks, can be modelled taking into account the number of cells that compose the stack:
V t a n k d d t c 2 t a n k c 3 t a n k c 4 t a n k c 5 t a n k = N c 2 c e l l c 2 t a n k c 3 c e l l c 3 t a n k c 4 c e l l c 4 t a n k c 5 c e l l c 5 t a n k Q ,
where V t a n k is the volume of each electrolyte tank and N is the number of cells that compose the stack.
The states of the system are the vanadium concentrations of both tanks and cells, while the other parameters are constants or variables that can depend on the operating conditions as the temperature.
It is important to remark, that this mathematical model is a realistic approach of a VRFB, and it allows to understand what factors change the vanadium concentrations inside the cell and in the tanks. This is of great importance, since the concentrations in the cell determine the voltage, which is calculated by Nerst expression (5), and the concentrations inside the tank determine the state of charge (SOC) of the battery:
S O C = c 2 t a n k c 2 t a n k + c 3 t a n k = c 5 t a n k c 4 t a n k + c 5 t a n k
All parameters that appear are summarized in Table 7.

5.2. Thermal Model

Usually, the effect of temperature on VRFBs is not detrimental to the system efficiency, since it is normally found close to environmental values [109]. However, it has been seen that under certain operational conditions, and depending on the membrane, there can be an increase in the temperature above the environmental one [110]. In this situation, a heat exchanger mechanism could be necessary to improve the behaviour of the battery. Furthermore, as the temperature is an easy variable to measure in any physical system, obtaining a thermal model for VRFBs can help to monitor its correct operation, or even its possible automatic control [111].
The correct determination of the temperature inside the stack is necessary for two main factors. On the one hand, it can determine how much heat is absorbed or generated during the reaction [112]. On the other hand, it is directly related with the diffusion coefficients which play an important role inside the electrochemical model.
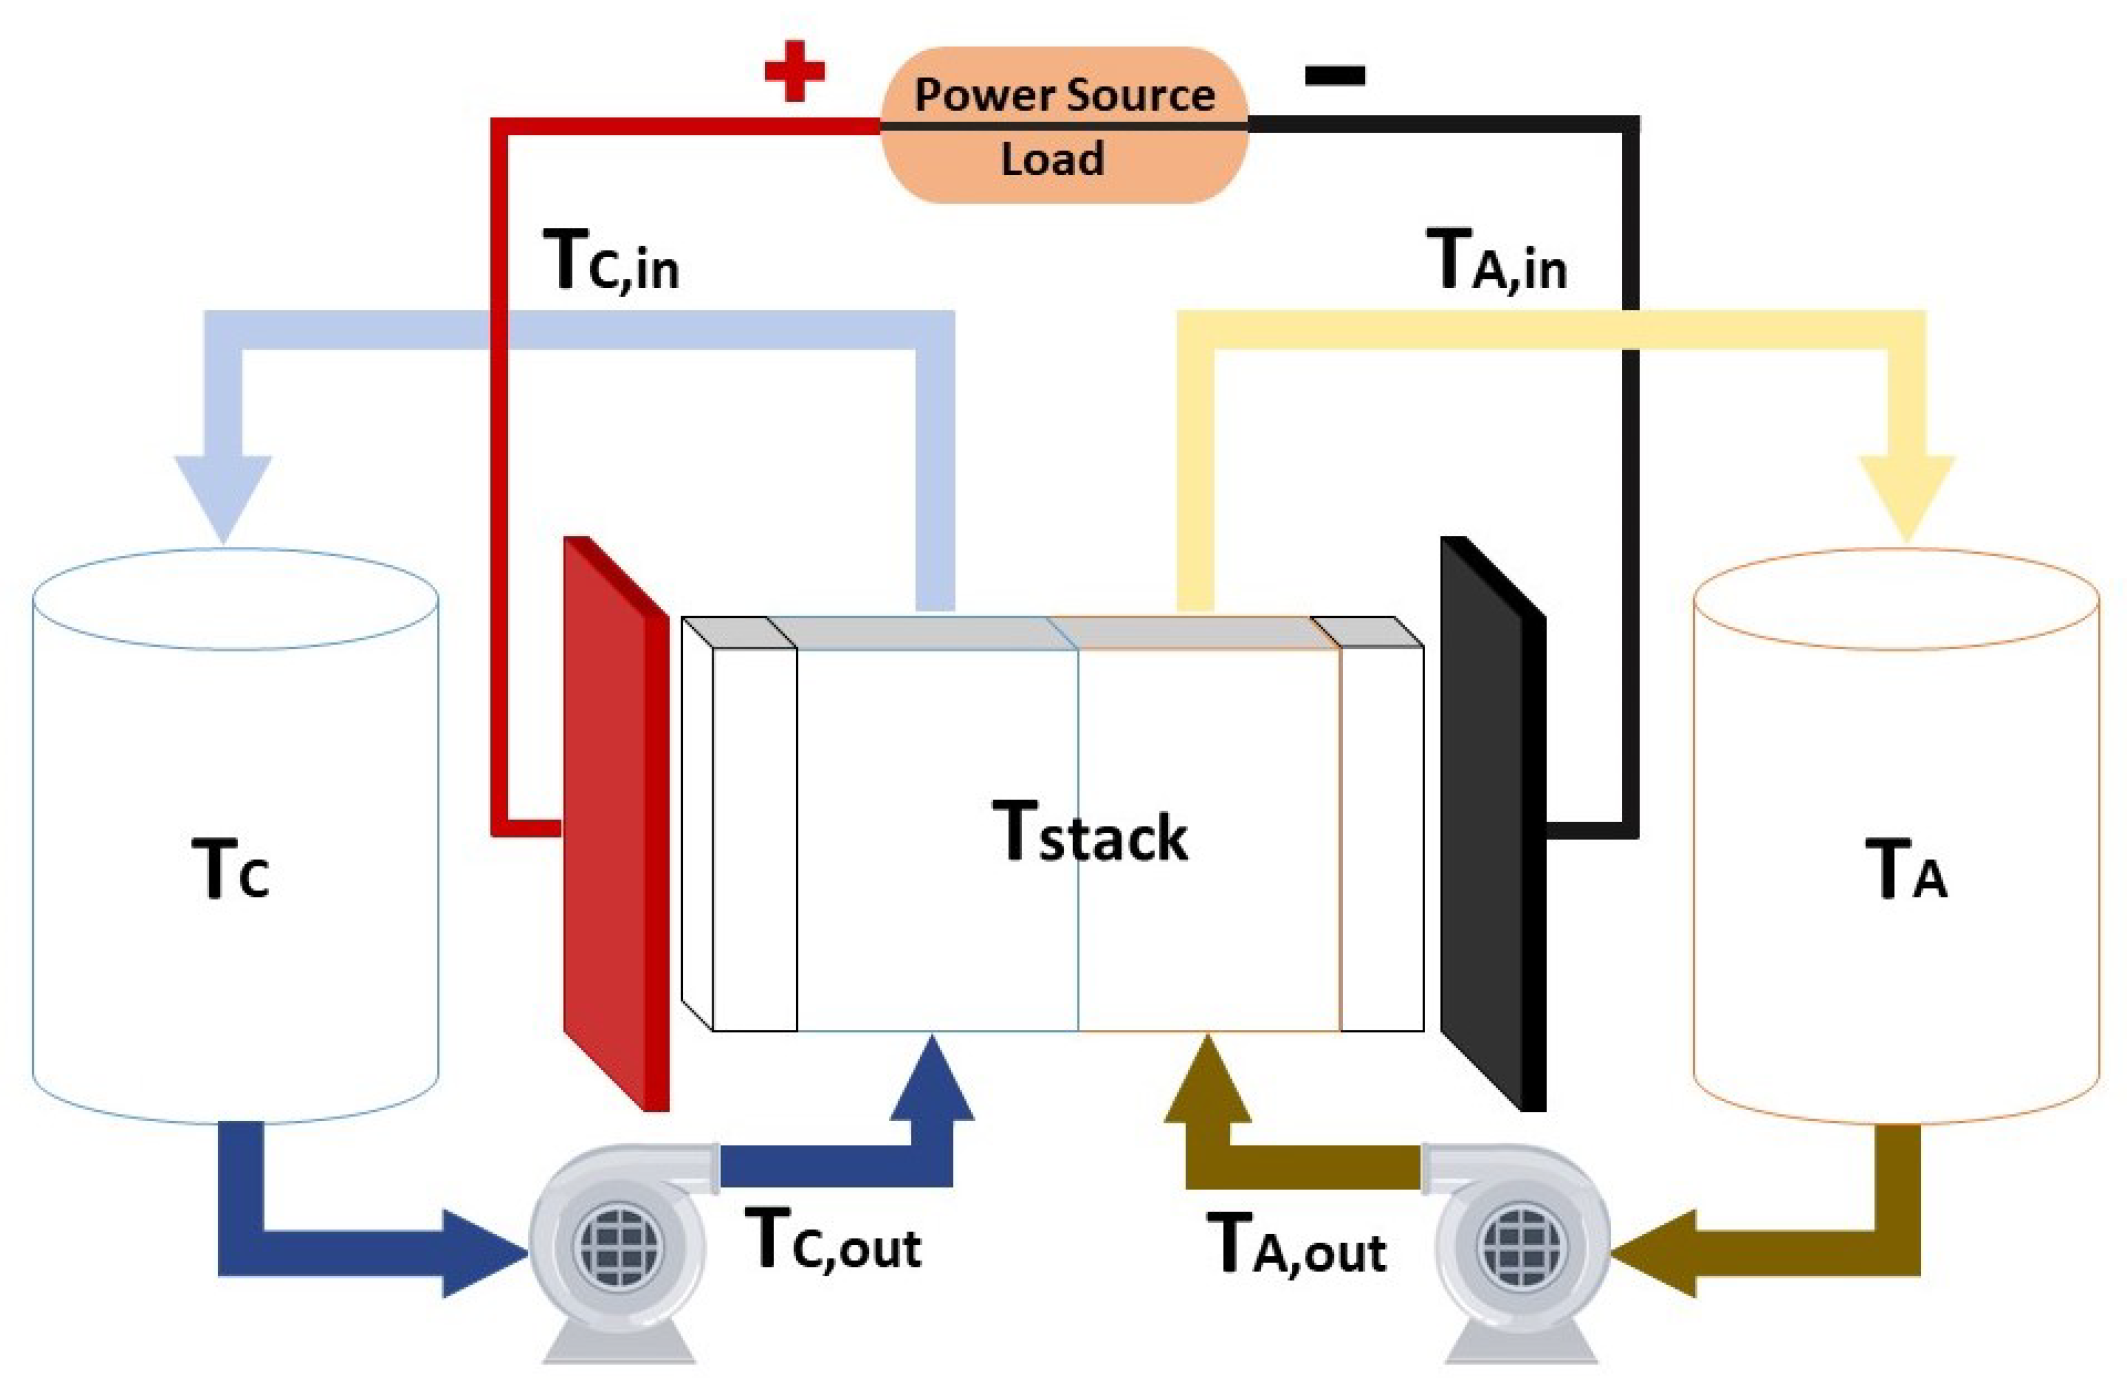
Taking into account the main components of the system, which are the stack, the tanks and the hydraulic transmission line composed by the pipes and pumps, it is possible to model the temperature of each part as it is done on [112]. It is important to consider the external temperature of the system, which is that of the air (T a i r ). Figure 3 shows the different points where the temperature of the system is modeled.
The nomenclature of the subscripts of the temperature variables is summarized in Table 8.
The variation of the different temperatures can be model by using the energy balance equations. Equation (20) model the behaviour of the temperature in the stack [110].
C p ρ V s t a c k d T s t a c k d t = Q C p ρ [ T C , o u t T s t a c k ] + Q C p ρ [ T A , o u t T s t a c k ] + U s A s [ T a i r T s t a c k ] + N S d ( k 2 Δ H 2 k 3 Δ H 3 k 4 Δ H 4 k 5 Δ H 5 ) · c 2 c e l l c 3 c e l l c 4 c e l l c 5 c e l l + I 2 r ,
where C p is the specific heat, ρ is the density of electrolyte, Q is the flow rate and U s A s is the heat transfer capability of the stack. The parameters Δ H 2 , Δ H 3 , Δ H 4 and Δ H 5 represent the change of enthalpy, which have an experimental value calculated at 298.15 K for each reaction [113]. The values of the enthalpies are negative [110] during the charging process, which yields to the conclusion that the reaction is exothermic. This means that the system releases energy in form of heat to the environment. During the discharging process, the sign of the enthalpy part in (20) changes, taking place an endothermic reaction. In (20) also appears the thermal factor due to the ohmic losses produced by the stack resistance, r, which experimentally changes its value during operation, but for practical purposes it can be assumed constant [110]. It should be noted that most of the heat generated is due to the ohmic effect, having values between few tens of Joules (currents below 50 A) and hundreds of Joules (for currents in the order of 100 A) [109].
In the tank and transmission line corresponding to the catholyte part of the system, the temperature equations are:
C p ρ V t a n k d T C d t = Q C p ρ [ T C , i n T C ] + U t a n k A t a n k [ T a i r T C ]
C p ρ V p i p e d T C , i n d t = Q C p ρ [ T s t a c k T C , i n ] + U p i p e A p i p e [ T a i r T C , i n ]
C p ρ V p i p e d T C , o u t d t = Q C p ρ [ T C T C , o u t ] + U p i p e A p i p e [ T a i r T C , o u t ] + W p u m p
For the case of the negative side of the system, the same equations model the behaviour of the temperature in a symmetrical way respect to Figure 3. If it is assumed that the four parts in which the pipes are divided are equals and the flow rate that circulates along the pipes is the same, then same temperatures will exist on both sides of the system. Table 9 summarizes all parameters of the thermal model.
There exist different studies done in terms of thermal parameters of RFBs. This is the case of [114], that presents a dynamic electro-thermal model. A thermal model with heat exchangers is presented in [115], proposing an effective cooling strategy.

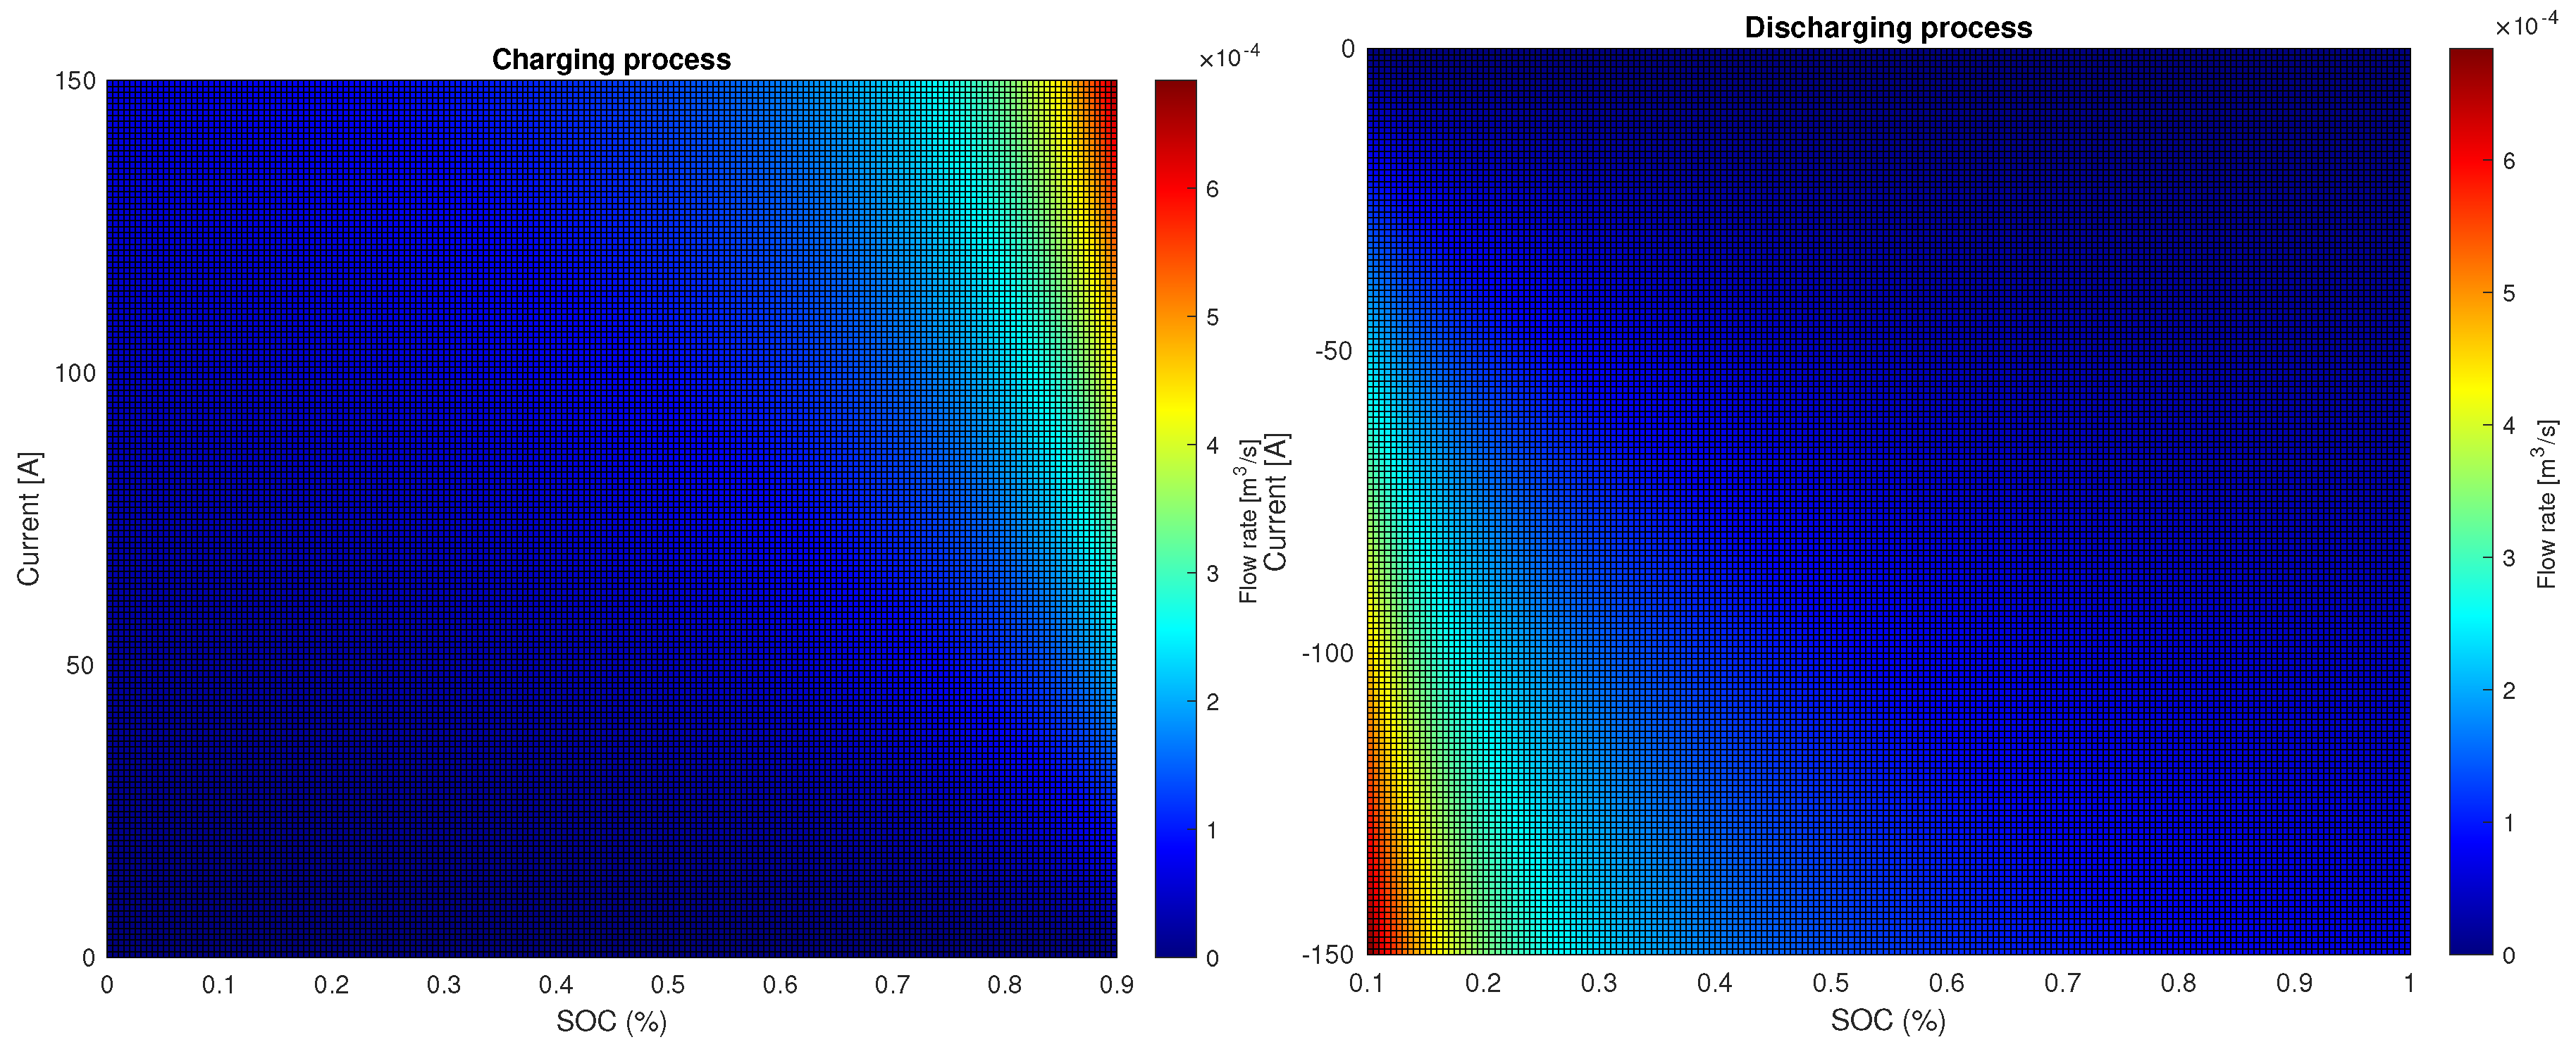
5.3. Hydraulic Model

A part of the system that has great importance is the hydraulic part. The pumps are dynamic elements, and their choice in terms of the maximum flow rate they can pump, will depend on the operating conditions of the system. For that reason, it is necessary to determine the power of the pump need to make the electrolytes flow taking into account possible losses due to pressure and friction. The power of the pump affects the temperature model, as can be seen from Equation (23). Moreover, taking into account that to maximize the efficiency of the VRFB, it is necessary to minimize losses (such as pump power), the obtaining of a correct model will allow to obtain the optimal flow rate that plays the most important role in a flow battery.
The value of the pump power can be obtained through the calculation of the losses in the stack and pipes, following the principle of energy conservation [116,117]. The power loss is the product between the pressure drop in the system and the flow rate Q:
W p u m p = Δ p · Q .
The pressure drop in the pipes can be calculated using the principles of fluid mechanics. In some studies, appears that it can be directly calculated considering two different parts. On the one hand, the friction pressure drop Δ p f r i c t i o n which comes from fluid viscosity, which is calculated by (25) [117]. On the other hand, the losses due to a change in flow direction of the pipes Δ p p i p e s given by Equation (26).
Δ p f r i c t i o n = f L D h ρ v 2 2 .
Δ p p i p e s = K ρ v 2 2 .
The pressure drop in the stack can be calculated considering the pressure drop in the electrodes, that have been found to contribute considerably to the total pressure drop of the system.
Δ p e l = μ · Q · K c k · ( 1 ϵ ) 2 d f 2 · ϵ 3 L e l w e l · t e l .
Then, the pressure drop of the system is the sum of the previous pressure drops:
W p u m p = ( Δ p f r i c t i o n + Δ p p i p e s + Δ p e l ) · Q .
Parameters of the hydraulic model are summarized in Table 10.

6. Control and Supervision

In this section, the main techniques which are currently used to control and automate RFB are going to be described. The variables that are usually measured and used to regulate the RFB are the current and the flow rate. The output variables of a RFB typically are the stack voltage which is directly related with the power, and the state of charge (SOC) of the system, which is related with the stored or delivered energy.

6.1. Control Strategy for RFB Systems

For a RFB system, the control strategy plays a crucial role to guarantee the correct and optimal operation of the battery for charge and discharge cycles, having a direct effect on the system efficiency.
The main variables to design a controller for RFB systems are the current, the stack voltage, the temperature and the SOC. As mentioned, both the stack voltage and the current are easy variables to measure, as well as the temperature. However, the SOC can not be measured so easily. For that reason, there are different techniques to estimate its value, as will be seen later in Section 6.2. Taking into account these variables, there are different control strategies in the field of RFB that have been implemented.
The most relevant objective in a RFB consists of guaranteeing that the system can store or provide the required reactants during the charging/discharging process in a sure and efficient manner. Usually, as the charged/discharged current is assumed to be externally fixed, the only variable that regulates the operation of the battery is the flow rate. Therefore, the vast majority of control strategies are based on obtaining the optimal flow according to the operational conditions. It is obvious that taking into account that the operational conditions of the system vary, since it is dynamic, the optimal flow rate will also be variant [121]. Therefore, these type of systems require to have pumps capable of providing a variable flow in the system. The presence of pumps increases the losses inside the system due to the energy consumption required to make them work. Moreover, the presence of hydraulic losses as the ones presented in Section 5.3, makes necessary to find a compromise between efficiency and safety (understood as the possibility of guaranteeing reactants at all times and places). There exist different strategies that are based on a mathematical expression, that define an optimal flow rate.
One of the most commonly used is based on the minimum flow. It appears in many studies, such as [11,122], and it is based on the Faraday’s law of electrolysis:
Q m i n = N · I F · ( 1 S O C ) · c v , for charging N · | I | F · S O C · c v , for discharging
where N is the number of cells that compose the stack, and c v is the total concentration of vanadium in the solution. It expresses the theoretical minimum flow rate value of the RFB with respect to the current and the SOC, to guarantee that there are enough reactants in the system. Ideally, using that expression would be enough, but in practice due to its distributed nature using this value would not guarantee that there are enough reactants everywhere, or any desynchronization between the current and the controller would cause problems. Due to this, in most cases bigger values are used, by means of a constant called flow factor, F F , which typically varies between 4 and 10 [117].
Q = F F · Q m i n
The behaviour that presents this minimum flow rate with respect to the SOC and the current, has been studied for the example of the RFB designed in Section 3.3. Figure 4 shows the minimum flow for both charging and discharging processes. A F F of 8 and a current range from 0 to 150 A have been chosen. As can be noticed, using this strategy the flow rate must increase when the battery is near to its full charge or discharge.
Other strategies are based on using an optimal flow rate that maximizes the efficiency of the complete system taking into account the effect of the possible losses. The criterion to maximize the battery efficiency is minimizing the system energy during the charging process and maximizing it during discharge as is expressed in (31), within the same time window.
E b a t t e r y = E s t a c k E p u m p = P s t a c k d t P p u m p d t , during discharge E s t a c k + E p u m p = P s t a c k d t + P p u m p d t , during charge
where E s t a c k is the energy in the stack that can be affected by internal losses such as overpotentials, and E p u m p is the power along the time from the pumps, taking into account the hydraulic losses.
There are different studies that use this criterion to develop an optimal flow rate strategy. For example, [123] presents a dynamic flow rate strategy for VRFB that takes into account the concentration overpotential and the pump power consumption. In this area, Skyllas-Kazacos has also developed an optimal flow rate strategy to maximize the efficiency of the battery at different charge and discharge processes [122]. Other studies such as [117,124,125] present optimal flow rate strategies to maximize the efficiency of the battery system, minimizing the pump losses at the same time that maximize the power taking into account the losses affected by the overpotential effect.
These optimal controllers are usually very sensitivity to uncertainty in the model and its parameters; due to this, they are usually combined with other types of controllers. These new strategies are based on regulating some variables, which typically is the stack voltage, using a feedback controller and combine it with the optimal controller, which acts as a feedforward control law [126]. Another study uses a feedback controller to regulate the stack temperature [127] using a thermal model based on [110], applying a variable flow rate to keep the temperature within safe limits, increasing the efficiency of the system.
A general regulation scheme that considers an optimal flow rate strategy in terms of current and SOC, and the regulation of the voltage corresponds to the architecture shown in Figure 5.
Figure 5 presents a conventional controller scheme composed by a feedback controller that regulates the voltage, E, and a feedforward controller. The current, I, is assumed to be an measurable exogenous signal, and the SOC is obtained through an observer (Section 6.2).

6.2. Observers and Parameter Estimation

SOC is one of the most important variables in RFB because it indicates how much energy is stored in the system. Moreover, it is used in most control strategies, as shown in the previous section, so obtaining its value is crucial for the proper functioning of these controllers. As it is shown in (19), its value depends only in the concentration of vanadium species inside the electrolyte tanks. Unfortunately, there is no sensor which allows to automatically measure this magnitude. There exist different indirect techniques which allow to estimate the concentration of vanadium species inside the tanks, i.e., estimate the SOC. One technique is the color analysis [12], based on the fact that each vanadium species has its own color. Measuring the color inside the tank allows to estimate the amount of vanadium species, and therefore, the SOC. Another technique to estimate the SOC is measuring the electrolyte density inside the tanks [128]. Similarly, to what happens with color, each vanadium species has its own density. Spectrophotometric can be used to analyze the conductivity of the vanadium species contained in the tank, this technique is widely used in chemical studies to obtain the concentration of certain species dissolved in a solution [129]. Recently, the use of an amperiometric sensor [130] has been proposed. It estimates the vanadium species by measuring the current response at a fixed stack voltage.
All these techniques require incorporating sophisticated and expensive instrumentation into the system. This increases the cost of the installation in addition to its complexity. Most of these techniques are indirect measurements and therefore require significant calibration and sophisticated post-processing. An additional problem that must be taken into account is that the storage tanks are normally large, which implies that the distribution of the species is not homogeneous and therefore low precision exists despite having sophisticated instrumentation.
An alternative way of dealing with the problem is to use the model and easily measurable information, such as stack voltage, current or temperature, to estimate the variables of interest. The use of state observers and parameter estimators can be a very efficient solution to estimate the SOC. Apart from the SOC, there are other highly relevant variables, that must be estimated since their theoretical values differ from those found in practice and can not be directly measured. Different methodologies are discussed in the following subsections.

6.2.1. State Observers to Estimate the SOC

State observers are algorithms that allow estimating the value of state variables, whose evolution is described by the system model, combining the use of the model and information from the measured variables [131,132]. In Figure 6 it is shown an scheme of a state observer with its main blocks and variables, where x ^ corresponds to the state estimation, u is the input control action, y is the output measured, p corresponds to the model parameters, f represents the model, h is the output computation function, Φ is the correction action function and v is the correction control action.
There are different techniques to design these algorithms, being Kalman filters and sliding mode observers two of the most popular [133].
In the models described in the Section 5, tank concentrations are state variables, from which the SOC can easily be estimated using (19). Therefore, it is possible to build state observers that allow estimating the SOC in real-time. Table 11 summarizes the states observers found in the literature, with their measured variables and methods used to estimate the SOC.
Based on conductivity and spectrophotometric measurements, Skyllas-Kazacos presented two estimation methods for the SOC in [129]. The first method uses variations in conductivity to independently determine the SOC of each half-cell electrolyte. The second approach is based on the optical absorbance detected to monitor the system balance and SOC of the negative half-cell.
Using the measures of half-cell potential and electrolyte density, and an electrochemical model it has also been also possible to estimate the SOC as it is presented in [128]. This study presents two approaches. The first one, measures the OCV combined with Coulomb counting, to estimate the SOC assuming the same concentrations of vanadium species inside the tanks and the cell. The second approach, uses the temperature and electrolyte density measurements for estimate the SOC. Both strategies can be recalibrated during the battery operation increasing the reliability of the estimation.
The thermal model described in Section 5.2, is used in [134], with a Kalman filter to estimate SOC precisely. An electrical model is defined using the cell voltage which varies with the stack temperature, and the cell concentrations. In this way, measuring both cell voltage and temperature is possible to obtain the SOC estimation. Another electrical model is proposed in [119], which consists on a basic resistor-capacitor (RC) ladder. The capacity of a RFB represents the amount of energy that can be extracted under certain specified conditions [135]. Therefore, it has a direct dependence on the stored energy, and thus, on the SOC. Measuring the cell voltage and with the aim of a Kalman filter the SOC is estimated.
The extended Kalman filter (EKF) is one of the widely methods used to estimate the SOC of RFB systems [134,136,137]. In those cases, electrochemical and thermal models, as well as OCV expression are used to estimate the SOC. Adaptive estimation techniques have also been used to estimated with precision the SOC, using similar models. In [138] an adaptive observer design for simultaneous estimation of SOC and crossover flux is presented; the work assumes a nonaqueous RFB that is simply modelled with a isothermal lumped parameter model, measuring the temperature and the flow rate. Another adaptive technique is proposed in [139], which consists on a novel joint real time estimator based on the EKF, which estimates the SOC using the recursive least squares (RLS) method, measuring the OCV and the current.
Differently from the Kalman and the EKF which requires linearizing the model, sliding mode control (SMC) can directly deal with nonlinear models. This is the case of [140,141], that use sliding mode observers to predict the value of the SOC. For both cases, the model used is based on the conservation of mass and energy, as the ones shown in the electrochemical and thermal model part, In Section 5.1 and Section 5.2, respectively.
An empirical neural network (NN) is employed in [142] to estimate the SOC measuring the temperature and the viscosity of the electrolyte. In that case, by means of Nerst equation, an empirical model is develop that links the SOC with respect to the temperature and viscosity of the electrolyte.
Other intelligent methods such as fuzzy logic (FL) [143] or support vector machines (SVM) [144,145] have been also used to estimate the SOC. They perform the estimation by analyzing the data provided from different experiments on wide operational ranges. Similarly, ref. [143] involves the fuzzy logic to analyze impedance spectroscopy and coulomb counting measures. In terms of SVM, ref. [144] uses data to estimate the SOC and model parameters from charging/discharging data, using the current, the voltage and the temperature of a cell. In [145], both the current and the temperature are used to estimate the SOC using a thermal dependant model.

6.2.2. Model Tuning and Parameter Estimation

The models described, including those used in observer development, contain a large number of parameters that must be adjusted. Although many of these parameters could be measured, it is a current trend to adjust the models using the variables usually measured.
These adjustments can be made following two types of approaches, depending on whether the estimation is done in real time or not. Online parameter estimation is based on updating the estimation when new information is available. Thus, the estimation is make in real-time [30]. This adjustment only needs a parameter estimation algorithm that calibrates the model parameters each time it receives information for the input signals and measured variables. Offline parameter estimation is made with data that has been previously acquired [146]. Firstly, it estimates the output variables that can not measure in real time, to compare with real data that has been previously acquired. Then, takes place the tuning of parameters minimizing the error between the variables estimated and the real ones. Figure 7 shows the schemes of each one of these approaches.
Examples of this type of parameters that present uncertainty are the diffusion coefficients, k, appearing in (15), the standard electrode potential, E 0 , (2) or the charge/discharge resistance r. Usually, all these values are assumed to be constant to facilitate the analysis of the model carried out. In [147] an offline estimation of stack resistance and standard electrode potential is presented, using the least square method for the curve fitting between the experimental data and the model, measuring the current and the stack voltage of the battery.
Other type of variables appearing in RFB models are the capacity loss or the peak power, which consists on the maximum point of power that the VRFB can supply taking into account the operational conditions in terms of current and voltage. Capacity fading appears when VRFB work long and causes the ion diffusion and depletion of active materials. This yields not only to a capacity loss, but also to an increasing of the internal resistance [141]. There are several studies that estimate the capacity fading using online estimation methods, being one of the most common techniques the EKF. In [139] uses this technique to online estimate the capacity loss, and the parameters of an electrical model, measuring the OCV and the current. A similar approach is presented in [148], measuring the same variables, and using a first-order electrical circuit model to capture the dynamics of the VRFB. Using the RLS method with the EFK technique, the model parameters and the capacity are online estimated with high accuracy. Differently from the previous two studies, ref. [108] uses an autoregressive exogenous model to estimate the capacity loss, measuring with an H-infinity observer the current, the voltage and the temperature of the stack.
In terms of peak power, ref. [149] uses and adaptive model that allows to estimate its value. Using the RLS and the EKF an online adaptive estimation of the RFB parameters is obtained and by means of measuring the current and voltage of the system.
In [150,151] an algorithm to online estimate different parameters using a time-varying recursive least squares method is proposed. These parameters are the resistors and capacities of a second order Thevenin model used to characterize a VRFB. Both studies use data from pulse charging experiments, measuring the current and voltage.
Using genetic algorithm, it is also possible to offline estimate the different parameters of a RFB model as is presented in [146], measuring the voltage. In that case, the parameters of the model define the electrolyte properties, such as the diffusion and the transfer function coefficients, the electrode and membrane properties, the electrode porosity or specific surface area. Finally, a multi-time scale method is used in [152] to online estimate independently the model parameters and OCV, measuring the current, temperature, flow rate and density.

7. Conclusions and Future Direction

This paper has introduced the concept of redox flow batteries, contextualizing them within the current energy situation and comparing them with other type of energy storage systems.
The main characteristics and its operation have been explained taking into account the equations that characterize its behaviour, as well as the expressions needed to design the battery sizing for a specific conditions of power and energy. A review in the literature of the existing models has been shown, explaining in detail one of the most used and cited. This dynamic model is decomposed in three main parts that are interconnected: the electrochemical, the thermal and the hydraulic. Attending to the need for optimal control and characterization of the RFB, a discussion about the existing control strategies that are mainly used within the field of redox flow batteries has been presented. Similarly, a discussion about the different methods used to estimate the SOC has been presented, introducing the use of state observers. Finally, some studies have been presented that calibrate the models estimating their parameters and variables. All these techniques constitute an excellent alternative to include complex and expensive instrumentation in the RFB. It has been prove in the literature that these techniques offer very interesting results.
Modelling plays a key role for control purposes inside the RFB. It allows to describe the real system behaviour, providing information and knowledge of the system operation. Moreover, these models are very important to analyse and improve the control systems, observers and parameter estimators. In this sense, until now different studies have been designed with the purpose to obtain a realistic model of a VRFB. Most of them are lumped parameter models that describe with simplicity the behaviour of the RFB, obtaining a behavior which closely resembles the real system. There are few studies that present more complex models that take into account undesired effects such as corrosion, degradation or unexpected reactions. In this scenario, more research will appear in the following years to manage with more realistic models, that will allow to perform more tests to analyze the behaviour of a specific RFB, reducing the R&D (Research and Development) costs. For these purposes, it will be necessary to analyze in which scenarios the use of a lumped or distributed parameter model will be the best option, attending to the practical use that will be given to it. Furthermore, if a distributed parameter model is selected, an analysis of the level of distribution will be required.
Looking to the future, there are different directions in the research of RFB systems. Within the field of control and supervision, research in terms of flow management and parameter estimation will continue to grow, following methodologies such as those described in Section 6. In particular, the search for online estimators will be one of the key studies in the future, to estimate the different parameters. Therefore, integrating these parameters in the control laws will improve their robustness. Inside this field, a determination of the main parameters to estimate will be required. In addition, parameters that vary over the time and are currently considered constant to simplify the analysis, such as the ohmic resistance or the standard electrode potential, will be online estimated obtaining a more realistic adjustment. It will also be necessary to determine what parameters are affected by the undesired effects such as degradation or corrosion, and its level of affection. As a battery system, it will be important to define the state of health (SOH) which until now has not been studied in detail. Another field of study will be the detection of failures, characterizing the possible failures, what they are due to and the level of damage that they cause within the system. Taking into account all these objectives, a large number of experimental tests will be carried out, being decisive to correctly define the working conditions, the variables to be measured and the instrumentation to be used, seeking a balance between efficiency and experimental cost.
The automation will contribute to the reduction of costs and will open the door to the implementation of fault detection and isolation mechanisms. This will improve their performance and make them even more secure and reliable devices.
Other important investigations will correspond to develop an efficient integration of RFBs in energetic environments such as renewable energy plants, or microgrids.

Author Contributions

Conceptualization, R.C.-C. and A.C.; methodology, R.C.-C. and A.C.; investigation, R.C.-C. and A.C.; writing—original draft preparation, A.C.; writing—review and editing, R.C.-C.; visualization, A.C.; supervision, R.C.-C.; project administration, R.C.-C.; funding acquisition, R.C.-C. All authors have read and agreed to the published version of the manuscript.

Funding

This research was funded by the CSIC under the PTI FLOWBAT 2021 project (reference: 642 201980E101), the Spanish Ministry of Economy and Competitiveness under Projects CICYT RTI2018-094665-B-I00, DOVELAR ref. RTI2018-096001-B-C32 (MCIU/AEI/FEDER, UE) and María de Maeztu Seal of Excellence to IRI (MDM-2016-0656), and by the Generalitat de Catalunya through the Project 2017 SGR 482.

Conflicts of Interest

The authors declare no conflict of interest.

Abbreviations

The following abbreviations are used in this manuscript:
CAESCompressed air energy storage
CEMCpation exchange membrane
EDLCElectric double layer capacitor
ESSEnergy storage systems
EKFExtended Kalman filter
FLFuzzy logic
NNNeural network
OCVOpen circuit voltage
PHESPumped hydro energy storage
RESRenowable energy sources
RFBRedox flow battery
RFCRegenerative fuel cell
SMCSliding mode control
SMESSuperconducting magnetic energy storage
SOCState of charge
SOHState of health
SVMSupport vector machines
UPSUninterruptible power supply
VRFBVanadium redox flow battery

References

  1. Martins, F.; Felgueiras, C.; Smitkova, M.; Caetano, N. Analysis of Fossil Fuel Energy Consumption and Environmental Impacts in European Countries. Energies 2019, 12, 964. [Google Scholar] [CrossRef] [Green Version]
  2. Van den Bergh, J.; Botzen, W. Monetary valuation of the social cost of CO2 emissions: A critical survey. Ecol. Econ. 2015, 114, 33–46. [Google Scholar] [CrossRef]
  3. Üney, M.; Çetinkaya, N. Comparison of CO2 emissions fossil fuel based energy generation plants and plants with Renewable Energy Source. In Proceedings of the 2014 6th International Conference on Electronics, Computers and Artificial Intelligence (ECAI), Bucharest, Romania, 23–25 October 2014; Volume 20, pp. 29–34. [Google Scholar]
  4. Caetano, N.S.; Mata, T.M.; Martins, A.A.; Felgueiras, M.C. New Trends in Energy Production and Utilization. Energy Procedia 2017, 107, 7–14. [Google Scholar] [CrossRef]
  5. Gielen, D.; Boshell, F.; Saygin, D.; Bazilian, M.D.; Wagner, N.; Gorini, R. The role of renewable energy in the global energy transformation. Energy Strategy Rev. 2019, 24, 38–50. [Google Scholar] [CrossRef]
  6. Peker, M.; Kocaman, A.S.; Kara, B.Y. Benefits of transmission switching and energy storage in power systems with high renewable energy penetration. Appl. Energies 2018, 228, 1182–1197. [Google Scholar] [CrossRef]
  7. Root, C.; Presume, H.; Proudfoot, D.; Willis, L.; Masiello, R. Using battery energy storage to reduce renewable resource curtailment. IEEE Power Energy Soc. 2017, 1, 1–5. [Google Scholar] [CrossRef]
  8. Padiyar, K.R.; Kulkarni, A.M. Solar Power Generation and Energy Storage. In Dynamics and Control of Electric Transmission and Microgrids; John Wiley & Sons, Incorporated: Hoboken, NJ, USA, 2019; pp. 391–414. [Google Scholar] [CrossRef]
  9. Lu, M.; Chang, C.; Lee, W.; Wang, L. Combining the Wind Power Generation System with Energy Storage Equipment. IEEE Trans. Ind. Appl. 2009, 45, 2109–2115. [Google Scholar] [CrossRef]
  10. Das, C.K.; Bass, O.; Kothapalli, G.; Mahmoud, T.S.; Habibi, D. Overview of energy storage systems in distribution networks: Placement, sizing, operation, and power quality. Renew. Sustain. Energy Rev. 2018, 91, 1205–1230. [Google Scholar] [CrossRef]
  11. Blanc, C. Modeling of a Vanadium Redox Flow Battery Electricity Storage System; Swiss Federal Institute of Technology Lausanne: Lausanne, Switzerland, 2009. [Google Scholar] [CrossRef]
  12. Mallick, K.; Das, S.; Sengupta, A.; Chattaraj, S. Modern Mechanical Energy Storage Systems and Technologies. Int. J. Eng. Res. Tech. 2016, 5, 727–730. [Google Scholar] [CrossRef]
  13. Yang, C.J.; Jackson, R. Opportunities and barriers to pumped-hydro energy storage inthe united states. Renew. Sustain. Energy Rev. 2011, 15, 839–844. [Google Scholar] [CrossRef]
  14. Hernández, J.; Gyuk, I.; Christensen, C. DOE global energy storage database—A platform for large scale data analytics and system performance metrics. In Proceedings of the 2016 IEEE International Conference on Power System Technology (POWERCON), Wollongong, NSW, Australia, 28 September–1 October 2016; Volume 1, pp. 1–6. [Google Scholar] [CrossRef]
  15. Chen, R.; Kim, S.; Chang, Z. Large-scale energy storage. In Redox Flow Batteries: Fundamentals and Applications; Zhanga, H., Li, X., Zhang, J., Eds.; CRC Press: Boca Raton, FL, USA, 2018; pp. 3–43. [Google Scholar] [CrossRef] [Green Version]
  16. Chen, L.; Zheng, T.; Mei, S.; Xue, X.; Liu, B.; Lu, Q. Review and prospect of compressed air energy storage system. J. Mod. Power Syst. Clean Energy 2016, 4, 529–541. [Google Scholar] [CrossRef] [Green Version]
  17. Succar, S.S.; Williams, R.H.; Cavallo, A.J.; Christopher, C.K.; Nrel, P.D.; Denkenberger, D.; Kalinowski, A.; McGill, M.; Socolow, R.H.; Vann, I.R. Compressed Air Energy Storage: Theory, Resources, and Applications for Wind Power. Princet. Environ. Inst. Rep. 2008, 37, 3149–3158. [Google Scholar]
  18. Crotogino, F.; Mohmeyer, K.U.; Scharf, R. Huntorf CAES: More than 20 Years of Successful Operation. Nat. Gas 2001, 45, 1–6. [Google Scholar]
  19. Mukherjee, P.; Rao, V. Superconducting magnetic energy storage for stabilizing grid integrated with wind power generation systems. Mod. Power Syst. Clean Energy 2019, 7, 400–411. [Google Scholar] [CrossRef] [Green Version]
  20. Chen, L.; Liu, Y.; Arsoy, A.; Ribeiro, P.; Steurer, M.; Iravani, M. Detailed modeling of superconducting magnetic energy storage (SMES) system. IEEE Trans. Power Deliv. 2006, 21, 699–710. [Google Scholar] [CrossRef]
  21. Wagner, L. Overview of Energy Storage Technologies. In Future Energy, 2nd ed.; Letcher, T.M., Ed.; Elsevier: Boston, MA, USA, 2014; pp. 613–631. [Google Scholar] [CrossRef]
  22. Vangari, M.; Pryor, T.; Jiang, L. Supercapacitors: Review of materials and fabrication methods. Energy Eng. 2013, 139, 72–79. [Google Scholar] [CrossRef]
  23. Poullikkas, A. A comparative overview of large-scale battery systems for electricity storage. Renew. Sustain. Energy Rev. 2013, 27, 778–788. [Google Scholar] [CrossRef]
  24. Linden, D.; Reddy, T. Lead-Acid batteries. In Handbook of Batteries; handbooks, M.H., Ed.; McGraw-Hill: New York, NY, USA, 2002; pp. 1–88. [Google Scholar]
  25. Rydh, C. Environmental assessment of vanadium redox and lead-acid bat-teries for stationary energy storage. Power Sources 1999, 1, 21–29. [Google Scholar] [CrossRef]
  26. Wen, Z.; Cao, J.; Gu, Z.; Xu, X.; Zhang, F.; Lin, Z. Research on sodium sulfur battery for energy storage. Solid State Ionics 2008, 179, 1697–1701. [Google Scholar] [CrossRef]
  27. Oshima, T.; Kajita, M.; Okuno, A. Development of sodium-sulfur batteries. Int. J. Appl. Ceram. Technol. 2005, 1, 269–276. [Google Scholar] [CrossRef]
  28. Korthauer, R. Lithium-Ion Batteries. In Lithium-Ion Batteries: Basics and Applications; Korthauer, R., Ed.; Springer: New York, NY, USA, 2018. [Google Scholar] [CrossRef]
  29. Li, J.; Murphy, E.; Winnick, J.; Kohl, P. Studies on the cycle life of commercial lithium ion batteries during rapid charge—Discharge cycling. J. Power Sources 2001, 102, 294–301. [Google Scholar] [CrossRef]
  30. Xing, Y.; Na, J.; Costa-Castelló, R. Real-Time Adaptive Parameter Estimation for a Polymer Electrolyte Membrane Fuel Cell. IEEE Trans. Ind. Inform. 2019, 15, 6048–6057. [Google Scholar] [CrossRef] [Green Version]
  31. Cecilia, A.; Costa Castelló, R. Observador de alta ganancia con zona muerta ajustable para estimar la saturación de agua líquida en pilas de combustible tipo PEM. Revista Iberoamericana de Automática e Informática Industrial 2020, 2, 169–180. [Google Scholar] [CrossRef] [Green Version]
  32. Andrews, J.; Doddathimmaiah, A. Regenerative fuel cells. In Materials for Fuel Cells; Gasik, M., Ed.; Woodhead Publishing Series in Electronic and Optical Materials; Woodhead Publishing: Sawston, CA, USA, 2008; pp. 344–385. [Google Scholar] [CrossRef]
  33. Wang, Y.; Leung, D.Y.; Xuan, J.; Wang, H. A review on unitized regenerative fuel cell technologies, part-A: Unitized regenerative proton exchange membrane fuel cells. Renew. Sustain. Energy Rev. 2016, 65, 961–977. [Google Scholar] [CrossRef]
  34. Hou, Y.; Zhuang, M.; Wan, G. The analysis for the efficiency proper-ties of the fuel cell engine. Renew. Energy 2007, 32, 1175–1186. [Google Scholar] [CrossRef]
  35. Cecilia, A.; Carroquino, J.; Roda, V.; Costa Castelló, R.; Barreras, F. Optimal energy management in a standalone microgrid, with photovoltaic generation, short-term storage, and hydrogen production. Energies 2020, 13, 1454. [Google Scholar] [CrossRef] [Green Version]
  36. Salameh, Z. Energy storage. In Renewable Energy System Design; Salameh, Z., Ed.; Academic Press: Boston, MA, USA, 2014. [Google Scholar] [CrossRef]
  37. Shigematsu, T. Redox flow battery for energy storage. SEI Tech. Rev. 2011, 73, 4–13. [Google Scholar]
  38. Alotto, P.; Guarnieri, M.; Moro, F.; Stella, A. Redox Flow Batteries for large scale energy storage. In Proceedings of the 2012 IEEE International Energy Conference and Exhibition (ENERGYCON), Florence, Italy, 9–12 September 2012; Volume 1, pp. 293–298. [Google Scholar] [CrossRef]
  39. Noack, J.; Wietschel, L.; Roznyatovskaya, N.; Pinkwart, K.; Tübke, J. Techno-Economic Modeling and Analysis of Redox Flow Battery Systems. Energies 2016, 9, 627. [Google Scholar] [CrossRef]
  40. Ye, R.; Henkensmeier, D.; Yoon, S.J.; Huang, Z.; Kim, D.K.; Chang, Z.; Kim, S.; Chen, R. Redox Flow Batteries for Energy Storage: A Technology Review. J. Electrochem. Energy Convers. Storage 2017, 15, 010801. [Google Scholar] [CrossRef]
  41. Fujimoto, C.; Kim, S.; Stains, R.; Wei, X.; Li, L.; Yang, Z.G. Vanadium redox flow battery efficiency and durability studies of sulfonated Diels Alder poly(phenylene)s. Electrochem. Commun. 2012, 20, 48–51. [Google Scholar] [CrossRef]
  42. Ibrahim, H.; Ilinca, A.; Perron, J. Energy storage systems—Characteristics and comparisons. Renew. Sustain. Energy Rev. 2008, 12, 1221–1250. [Google Scholar] [CrossRef]
  43. Uhrig, M.; Koenig, S.; Suriyah, M.R.; Leibfried, T. Lithium-based vs. Vanadium Redox Flow Batteries—A Comparison for Home Storage Systems. Energy Procedia 2016, 99, 35–43. [Google Scholar] [CrossRef] [Green Version]
  44. Vermeer, W.; Chandra Mouli, G.R.; Bauer, P. Real-Time Building Smart Charging System Based on PV Forecast and Li-Ion Battery Degradation. Energies 2020, 13, 3415. [Google Scholar] [CrossRef]
  45. Or, T.; Gourley, W.; Kaliyappan, K.; Yu, A.; Chen, Z. Recycling of mixed cathode lithium-ion batteries for electric vehicles: Current status and future outlook. Carbon Energy 2020, 2, 6–43. [Google Scholar] [CrossRef] [Green Version]
  46. Xiao, B.; Xiao, B.; Liu, L. State of Health Estimation for Lithium-Ion Batteries Based on the Constant Current—Constant Voltage Charging Curve. Electronics 2020, 9, 1279. [Google Scholar] [CrossRef]
  47. Bian, X.; Liu, L.; Yan, J.; Zou, Z.; Zhao, R. An open circuit voltage-based model for state-of-health estimation of lithium-ion batteries: Model development and validation. J. Power Sources 2020, 448, 227401. [Google Scholar] [CrossRef]
  48. Gatti, D. Redox Flow Batteries’ Advantages for Stationary Energy Storage Market; IDTechEx Ltd.: Cambridge, UK, 2020. [Google Scholar]
  49. Noack, J. Fraunhofer ICT–Redox Flow Battery Group; Fraunhofer ICT: Pfinztal, Germany, 2016. [Google Scholar] [CrossRef]
  50. Jiang, H.; Sun, J.; Wei, L.; Wu, M.; Shyy, W.; Zhao, T. A high power density and long cycle life vanadium redox flow battery. Energy Storage Mater. 2020, 24, 529–540. [Google Scholar] [CrossRef]
  51. Zhang, C.; Zhao, T.; Xu, Q.; An, L.; Zhao, G. Effects of operating temperature on the performance of vanadium redox flow batteries. Appl. Energy 2015, 155, 349–353. [Google Scholar] [CrossRef]
  52. Jizhong, C.; Hou, C.; Wu, G.; Wang, K.; Mao, H.; Dong, H. Research on Self-discharge Characteristics of a Vanadium Redox-flow Battery System. DEStech Trans. Environ. Energy Earth Sci. 2016. [Google Scholar] [CrossRef] [Green Version]
  53. Zhang, D.; Liu, Q.; Li, Y. Chapter 3—Design of Flow Battery; Elsevier: Amsterdam, The Netherlands, 2014; pp. 61–97. [Google Scholar] [CrossRef]
  54. Zeng, Y.; Zhou, X.; An, L.; Wei, L.; Zhao, T. A high-performance flow-field structured iron-chromium redox flow battery. J. Power Sources 2016, 324, 738–744. [Google Scholar] [CrossRef]
  55. Suresh, S.; Kesavan, T.; Yeddala, M.; Arulraj, I.; Dheenadayalan, S.; Ragupathy, P. Zinc-bromine hybrid flow battery: Effect of zinc utilization and performance characteristics. RSC Adv. 2014, 4. [Google Scholar] [CrossRef]
  56. Cunha, Á.; Martins, J.; Rodrigues, N.; Brito, F. Vanadium redox flow batteries: A technology review. Int. J. Energy Res. 2014, 39, 889–918. [Google Scholar] [CrossRef]
  57. Chen, R.; Kim, S.; Chang, Z. Redox Flow Batteries: Fundamentals and Applications; Intechopen: Rijeka, Croatia, 2017; pp. 103–118. [Google Scholar] [CrossRef] [Green Version]
  58. Yuan, X.; Song, C.; Platt, A.; Zhao, N.; Wang, H.; Li, H.; Fatih, K.; Jang, D. A review of all-vanadium redox flow battery durability: Degradation mechanisms and mitigation strategies. Int. J. Energy Res. 2019, 43, 6599–6638. [Google Scholar] [CrossRef]
  59. Chen, H.; Cong, G.; Lu, Y.C. Recent progress in organic redox flow batteries: Active materials, electrolytes and membranes. J. Energy Chem. 2018, 27, 1304–1325. [Google Scholar] [CrossRef] [Green Version]
  60. Alotto, P.; Guarnieri, M.; Moro, F. Redox flow batteries for the storage of renewable energy: A review. Renew. Sustain. Energy Rev. 2014, 29, 325–335. [Google Scholar] [CrossRef]
  61. Clark, J. Definitions of Oxidation and Reduction (REDOX). 2003. Available online: https://www.chemguide.co.uk/inorganic/redox/definitions.html (accessed on 5 May 2020).
  62. Kim, K.; Park, M.S.; Kim, Y.; Kim, J.H.; Dou, S.; Skyllas-Kazacos, M. A technology review of electrodes and reaction mechanisms in vanadium redox flow batteries. J. Mater. Chem. 2015, 3, 16913–16933. [Google Scholar] [CrossRef]
  63. Fan, X.; Liu, J.; Yan, C. Chapter 4: Key Materials of Vanadium Flow Batteries: Electrodes. In Redox Flow Batteries: Fundamentals and Applications; Intechopen: Rijeka, Croatia, 2017; pp. 127–217. [Google Scholar]
  64. Ke, X.; Prahl, J.M.; Alexander, J.I.D.; Savinell, R.F. Rechargeable Redox Flow Batteries: Maximum Current Density with Electrolyte Flow Reactant Penetration in a Serpentine Flow Structure. arXiv 2017, arXiv:1704.00744. [Google Scholar]
  65. Ke, X.; Prahl, J.M.; Alexander, J.I.D.; Wainright, J.S.; Zawodzinski, T.A.; Savinell, R.F. Rechargeable redox flow batteries: Flow fields, stacks and design considerations. Chem. Soc. Rev. 2018, 47, 8721–8743. [Google Scholar] [CrossRef]
  66. Melke, J.; Jakes, P.; Langner, J.; Riekehr, L.; Kunz, U.; Zhao-Karger, Z.; Nefedov, A.; Sezen, H.; Wöll, C.; Ehrenberg, H.; et al. Carbon materials for the positive electrode in all-vanadium redox flow batteries. Carbon 2014, 78, 220–230. [Google Scholar] [CrossRef]
  67. Chen, J.Y.; Hsieh, C.L.; Hsu, N.Y.; Chou, Y.S.; Chen, Y.S. Determining the Limiting Current Density of Vanadium Redox Flow Batteries. Energies 2014, 7, 5863–5873. [Google Scholar] [CrossRef] [Green Version]
  68. Gubler, L. Membranes and separators for redox flow batteries. Curr. Opin. Electrochem. 2019, 18, 31–36. [Google Scholar] [CrossRef]
  69. Ke, X.; Alexander, J.I.D.; Prahl, J.M.; Savinell, R.F. Flow distribution and maximum current density studies in redox flow batteries with a single passage of the serpentine flow channel. J. Power Sources 2014, 270, 646–657. [Google Scholar] [CrossRef] [Green Version]
  70. Prifti, H.; Parasuraman, A.; Winardi, S.; Lim, T.; Skyllas-Kazacos, M. Membranes for Redox Flow Battery Applications. Membranes 2012, 2, 275–306. [Google Scholar] [CrossRef] [PubMed] [Green Version]
  71. Fan, X.; Liu, J.; Yan, C. Chapter 6: Key Materials of Vanadium Flow Batteries: Membranes. In Redox Flow Batteries: Fundamentals and Applications; Intechopen: Rijeka, Croatia, 2017; pp. 238–239. [Google Scholar]
  72. Shi, Y.; Eze, C.; Xiong, B.; He, W.; Zhang, H.; Lim, T.; Ukil, A.; Zhao, J. Recent development of membrane for vanadium redox flow battery applications: A review. Appl. Energy 2019, 238, 202–224. [Google Scholar] [CrossRef]
  73. Lim, M.H.; Park, M.J.; Kim, S.C.; Roh, S.; Jung, S.; Kim, H.T.; Jung, H.Y. Chemical Degradation of Commercial Polymer Electrolyte Membrane for Vanadium Redox Flow Battery (VRFB). J. Nanosci. Nanotechnol. 2017, 17, 5788–5791. [Google Scholar] [CrossRef]
  74. Pissoort, P. A Storage Batteries. France Patent FR754065A, 30 October 1933. [Google Scholar]
  75. Pelligri, A.; Spaziante, P.M. Process and Accumulator for Storing and Releasing Electrical Energy. UK Patent GB2030349A, 28 July 1982. [Google Scholar]
  76. Rychcik, M.; Skyllas-Kazacos, M. Characteristics of a new all-vanadium redox flow battery. J. Power Sources 1988, 22, 59–67. [Google Scholar] [CrossRef]
  77. Farrow, C. Uses of Vanadium: Vanadium Redox Flow Battery (VRFB). 2019. Available online: http://www.gsa-env.co.uk/news/uses-of-vanadium-vanadium-redox-flow-battery-vrfb/ (accessed on 8 May 2020).
  78. Zhong, S.; Skyllas-Kazacos, M. Electrochemical behaviour of vana-dium(v)/vanadium(iv) redox couple at graphite electrodes. J. Power Sources 1992, 39, 1–9. [Google Scholar] [CrossRef]
  79. Largent, R.; Skylas-Kazacos, M.; Chieng, J. Improved pv system performance using vanadium batteries. In Proceedings of the Conference Record of the Twenty Third IEEE Photovoltaic Specialists Conference, Louisville, KY, USA, 10–14 May 1993; Volume 39, pp. 1119–1124. [Google Scholar] [CrossRef]
  80. Clark, J. Vanadium. 2015. Available online: https://www.chemguide.co.uk (accessed on 9 May 2020).
  81. Ding, C.; Zhang, H.; Li, X.; Liu, T.; Xing, F. Vanadium flow battery for energy storage: Prospects and challenges. J. Phys. Chem. Lett. 2013, 13, 342–345. [Google Scholar] [CrossRef]
  82. Knehr, K.; Kumbur, E. Open circuit voltage of vanadium redox flow batteries: Discrepancy between models and experiments. Electrochem. Commun. 2011, 13, 342–345. [Google Scholar] [CrossRef]
  83. Roznyatovskaya, N.; Noack, J.; Mild, H.; Fühl, M.; Fischer, P.; Pinkwart, K.; Tübke, J.; Skyllas-Kazacos, M. Vanadium Electrolyte for All-Vanadium Redox-Flow Batteries: The Effect of the Counter Ion. Batteries 2019, 5, 13. [Google Scholar] [CrossRef] [Green Version]
  84. Kim, S. Vanadium Redox Flow Batteries: Electrochemical Engineering; Intechopen: Rijeka, Croatia, 2019. [Google Scholar] [CrossRef] [Green Version]
  85. Trovò, A.; Picano, F.; Guarnieri, M. Comparison of energy losses in a 9kW vanadium redox flow battery. J. Power Sources 2019, 440, 227144. [Google Scholar] [CrossRef]
  86. Xu, Q.; Ji, Y.; Qin, L.; Leung, P.; Qiao, F.; Li, Y.; Su, H. Evaluation of redox flow batteries goes beyond round-trip efficiency: A technical review. J. Energy Storage 2018, 16, 108–115. [Google Scholar] [CrossRef]
  87. Atkins, P.; Jones, L. Chimie, Molécules, Matière, Métamorphoses; De Boeck: Paris, France, 1998; Volume 3. [Google Scholar]
  88. Service, R. Advances in flow batteries promise cheap backup power. Science 2018, 362, 508–509. [Google Scholar] [CrossRef] [PubMed]
  89. Buczkowski, T.; Noack, J.; FischRer, P.; Tübke, J.; Pinkwart, K. A Vanadium Redox Flow Battery for Uninterruptible Power Supply Applications. In Proceedings of the 6th International Conference Flow Battery Forum, Glasgow, UK, 27–29 May 2015. [Google Scholar]
  90. Service, R.F. New Generation of ‘Flow Batteries’ Could Eventually Sustain a Grid Powered by the Sun and Wind; American Association for the Advancement of Science: Washington, DC, USA, 2018. [Google Scholar]
  91. VanadiumCorp. Electric Vehicle Applications of Flow Batteries. 2012. Available online: https://www.vanadiumcorp.com/news/industry/electric-vehicle-applications-of-flow-batteries-2/ (accessed on 12 May 2020).
  92. Tokuda, N.; Furuya, M.; Kikuoko, Y.; Tsutui, Y.; Kumamoto, T.; Kanno, T. Development of a redox flow (RF) battery for energy storage. In Proceedings of the Power Conversion Conference-Osaka, Osaka, Japan, 2–5 April 2002; Volume 3, pp. 1144–1149. [Google Scholar] [CrossRef]
  93. Group, S.E. Redox Flow Battery. Available online: https://sei-innovation.com/energy/ (accessed on 11 May 2020).
  94. Kenning, T. Round-Up: 60 MWh Japan Project, Northern Ireland’s 10MW Array and Imergy Goes for Africa Teleco; Solar Media Ltd.: London, UK, 2015. [Google Scholar]
  95. Fraunhofer-Gesellschaft. An Affordable Way to Store Clean Energy. 2019. Available online: https://www.fraunhofer.de (accessed on 11 May 2020).
  96. Advanced-Batteries-Energy-Storage-Resources. China’s Biggest Flow Battery Project Underway. 2018. Available online: https://www.advancedbatteriesresearch.com (accessed on 11 May 2020).
  97. Energy-Storage-News. China’s Biggest Flow Battery Project So Far Is Underway with Hundreds More Megawatts to Come. 2019. Available online: https://www.energy-storage.news (accessed on 12 May 2020).
  98. Soares, R.; Secchi, A. Structural analysis for static and dynamic models. Math. Comput. Model. 2012, 55, 1051–1067. [Google Scholar] [CrossRef]
  99. Messaggi, M.; Canzi, P.; Mereu, R.; Baricci, A.; Inzoli, F.; Casalegno, A.; Zago, M. Analysis of flow field design on vanadium redox flow battery performance: Development of 3D computational fluid dynamic model and experimental validation. Appl. Energy 2018, 228, 1057–1070. [Google Scholar] [CrossRef]
  100. Yin, C.; Gao, Y.; Xie, G.; Li, T.; Tang, H. Three dimensional multi-physical modeling study of interdigitated flow field in porous electrode for vanadium redox flow battery. J. Power Sources 2019, 438, 227023. [Google Scholar] [CrossRef]
  101. Zhang, B.; Lei, Y.; Bai, B.; Xu, A.; Zhao, T. A two-dimensional mathematical model for vanadium redox flow battery stacks incorporating nonuniform electrolyte distribution in the flow frame. Appl. Therm. Eng. 2019, 151, 495–505. [Google Scholar] [CrossRef]
  102. D‘Agostino, R.; Baumann, L.; Damiano, A.; Boggasch, E. A Vanadium-Redox-Flow-Battery Model for Evaluation of Distributed Storage Implementation in Residential Energy Systems. IEEE Trans. Energy Convers. 2015, 30, 421–430. [Google Scholar] [CrossRef]
  103. COMSOL: Multiphysics Modeling Software. Available online: https://www.comsol.com/ (accessed on 1 August 2020).
  104. Wang, Q.; Qu, Z.; Jiang, Z.; Yang, W. Numerical study on vanadium redox flow battery performance with non-uniformly compressed electrode and serpentine flow field. Appl. Energy 2018, 220, 106–116. [Google Scholar] [CrossRef]
  105. Merei, G.; Adler, S.; Magnor, D.; Leuthold, M.; Sauer, D.U. Multi-physics Model for a Vanadium Redox Flow Battery. Energy Procedia 2014, 46, 194–203. [Google Scholar] [CrossRef] [Green Version]
  106. Barton, J.L.; Brushett, F.R. A One-Dimensional Stack Model for Redox Flow Battery Analysis and Operation. Batteries 2019, 5, 25. [Google Scholar] [CrossRef] [Green Version]
  107. Tang, A.; McCann, J.; Bao, J.; Skyllas-Kazacos, M. Investigation of the effect of shunt current on battery efficiency and stack temperature in vanadium redox flow battery. J. Power Sources 2013, 242, 349–356. [Google Scholar] [CrossRef]
  108. Wei, Z.; Xiong, R.; Lim, T.M.; Meng, S.; Skyllas-Kazacos, M. Online monitoring of state of charge and capacity loss for vanadium redox flow battery based on autoregressive exogenous modeling. J. Power Sources 2018, 402, 252–262. [Google Scholar] [CrossRef]
  109. Tang, A.; Bao, J.; Skyllas-Kazacos, M. Thermal modelling of battery configuration and self-discharge reactions in vanadium redox flow battery. J. Power Sources 2012, 216, 489–501. [Google Scholar] [CrossRef]
  110. Yan, Y.; Skyllas-Kazacos, M.; Bao, J. Effects of battery design, environmental temperature and electrolyte flowrate on thermal behaviour of a vanadium redox flow battery in different applications. J. Energy Storage 2017, 11, 104–118. [Google Scholar] [CrossRef]
  111. Yan, Y.; Li, Y.; Skyllas-Kazacos, M.; Bao, J. Modelling and simulation of thermal behaviour of vanadium redox flow battery. J. Power Sources 2016, 322, 116–128. [Google Scholar] [CrossRef]
  112. Tang, A.; Ting, S.; Bao, J.; Skyllas-Kazacos, M. Thermal modelling and simulation of the all-vanadium redox flow battery. J. Power Sources 2012, 203, 165–176. [Google Scholar] [CrossRef]
  113. Trovò, A.; Marini, G.; Sutto, A.; Alotto, P.; Giomo, M.; Moro, F.; Guarnieri, M. Standby thermal model of a vanadium redox flow battery stack with crossover and shunt-current effects. Appl. Energy 2019, 240, 893–906. [Google Scholar] [CrossRef]
  114. Wei, Z.; Zhao, J.; Xiong, B. Dynamic electro-thermal modeling of all-vanadium redox flow battery with forced cooling strategies. Appl. Energy 2014, 135, 1–10. [Google Scholar] [CrossRef]
  115. Shen, H.; Zhu, X.; Cao, H.; Xue, B. Thermal modeling and temperature control of an all-vanadium redox flow battery. In Proceedings of the 2019 12th Asian Control Conference (ASCC), Kitakyushu-shi, Japan, 9–12 June 2019; pp. 1536–1541. [Google Scholar]
  116. Kumar, S.; Jayanti, S. Effect of electrode intrusion on pressure drop and electrochemical performance of an all-vanadium redox flow battery. J. Power Sources 2017, 360, 548–558. [Google Scholar] [CrossRef]
  117. Tang, A.; Bao, J.; Skyllas-Kazacos, M. Studies on pressure losses and flow rate optimization in vanadium redox flow battery. J. Power Sources 2014, 248, 154–162. [Google Scholar] [CrossRef]
  118. Challapuram, Y.R.; Quintero, G.M.; Bayne, S.B.; Subburaj, A.S.; Harral, M.A. Electrical Equivalent Model of Vanadium Redox Flow Battery. In Proceedings of the IEEE Green Technologies Conference (GreenTech), Lafayette, LA, USA, 3–6 April 2019; pp. 1–4. [Google Scholar] [CrossRef]
  119. Han, D.; Yoo, K.; Lee, P.; Kim, S.; Kim, S.; Kim, J. Equivalent Circuit Model Considering Self-discharge for SOC Estimation of Vanadium Redox Flow Battery. In Proceedings of the 2018 21st International Conference on Electrical Machines and Systems (ICEMS), Jeju, Korea, 7–10 October 2018; pp. 2171–2176. [Google Scholar] [CrossRef]
  120. Meng, S.; Xiong, B.; Lim, T. Model-Based Condition Monitoring of a Vanadium Redox Flow Battery. Energies 2019, 12, 3005. [Google Scholar] [CrossRef] [Green Version]
  121. Xiao, W.; Tan, L. Control strategy optimization of electrolyte flow rate for all vanadium redox flow battery with consideration of pump. Renew. Energy 2019, 133, 1445–1454. [Google Scholar] [CrossRef]
  122. Ma, X.; Zhang, H.; Sun, C.; Zou, Y.; Zhang, T. An optimal strategy of electrolyte flow rate for vanadium redox flow battery. J. Power Sources 2012, 203, 153–158. [Google Scholar] [CrossRef]
  123. Fu, J.; Wang, T.; Wang, X.; Sun, J.; Zheng, M. Dynamic Flow Rate Control for Vanadium Redox Flow Batteries. Energy Procedia 2017, 105, 4482–4491. [Google Scholar] [CrossRef]
  124. Trovò, A.; Picano, F.; Guarnieri, M. Maximizing Vanadium Redox Flow Battery Efficiency: Strategies of Flow Rate Control. In Proceedings of the 2019 IEEE 28th International Symposium on Industrial Electronics (ISIE), Vancouver, BC, Canada, 12–14 June 2019; pp. 1977–1982. [Google Scholar] [CrossRef]
  125. Houser, J.; Pezeshki, A.; Clement, J.T.; Aaron, D.; Mench, M.M. Architecture for improved mass transport and system performance in redox flow batteries. J. Power Sources 2017, 351, 96–105. [Google Scholar] [CrossRef]
  126. Pugach, M.; Parsegov, S.; Gryazina, E.; Bischi, A. Output feedback control of electrolyte flow rate for Vanadium Redox Flow Batteries. J. Power Sources 2020, 455, 227916. [Google Scholar] [CrossRef]
  127. Bhattacharjee, A.; Saha, H. Development of an efficient thermal management system for Vanadium Redox Flow Battery under different charge-discharge conditions. Appl. Energy 2018, 230, 1182–1192. [Google Scholar] [CrossRef]
  128. Ressel, S.; Bill, F.; Holtz, L.; Janshen, N.; Chica, A.; Flower, T.; Weidlich, C.; Struckmann, T. State of charge monitoring of vanadium redox flow batteries using half cell potentials and electrolyte density. J. Power Sources 2018, 378, 776–783. [Google Scholar] [CrossRef]
  129. Skyllas-Kazacos, M.; Kazacos, M. State of charge monitoring methods for vanadium redox flow battery control. J. Power Sources 2011, 196, 8822–8827. [Google Scholar] [CrossRef]
  130. Kroner, I.; Becker, M.; Turek, T. Monitoring the State of Charge of the Positive Electrolyte in a Vanadium Redox-Flow Battery with a Novel Amperometric Sensor. Batteries 2019, 5, 5. [Google Scholar] [CrossRef] [Green Version]
  131. Xing, Y.; Na, J.; Costa-Castelló, R. Adaptive online parameter estimation algorithm of PEM fuel cells. Eur. Control Conf. 2019, 18, 441–446. [Google Scholar] [CrossRef]
  132. Ellis, G. Observers in Control Systems; Academic Press: Cambridge, MA, USA, 2002; Volume 15. [Google Scholar] [CrossRef]
  133. Khalil, H. High-Gain observers in nonlinear feedback control. Int. J. Robust Nonlinear Control 2013, 24. [Google Scholar] [CrossRef]
  134. Xiong, B.; Zhao, J.; Wei, Z.; Skyllas-Kazacos, M. Extended Kalman filter method for state of charge estimation of vanadium redox flow battery using thermal-dependent electrical model. J. Power Sources 2014, 262, 50–61. [Google Scholar] [CrossRef]
  135. Farahani, S. Chapter 6—Battery Life Analysis. In ZigBee Wireless Networks and Transceivers; Farahani, S., Ed.; Burlington: Newnes, Australia, 2008; pp. 207–224. [Google Scholar] [CrossRef]
  136. Mohamed, M.; Ahmad, H.; Seman, M.A.; Razali, S.; Najib, M. Electrical circuit model of a vanadium redox flow battery using extended Kalman filter. J. Power Sources 2013, 239, 284–293. [Google Scholar] [CrossRef]
  137. Yu, V.; Headley, A.; Chen, D. A Constrained Extended Kalman Filter for State-of-Charge Estimation of a Vanadium Redox Flow Battery With Crossover Effects. ASME J. Dyn. Syst. Meas. Control 2014, 4, 136. [Google Scholar] [CrossRef]
  138. Ascencio, P.; Smith, K.; Monroe, C.W.; Howey, D. Adaptive Observer for Charge-State and Crossover Estimation in Disproportionation Redox Flow Batteries undergoing Self-Discharge. In Proceedings of the 2019 American Control Conference (ACC), Philadelphia, PA, USA, 10–12 July 2019; pp. 5452–5457. [Google Scholar] [CrossRef]
  139. Wei, Z.; Tseng, K.J.; Wai, N.; Lim, T.M.; Skyllas-Kazacos, M. Adaptive estimation of state of charge and capacity with online identified battery model for vanadium redox flow battery. J. Power Sources 2016, 332, 389–398. [Google Scholar] [CrossRef]
  140. Xiong, B.; Zhang, H.; Deng, X.; Tang, J. State of charge estimation based on sliding mode observer for vanadium redox flow battery. In Proceedings of the 2017 IEEE Power & Energy Society General Meeting, Chicago, IL, USA, 16–20 July 2017; pp. 1–5. [Google Scholar] [CrossRef]
  141. Xiong, B.; Zhao, J.; Su, Y.; Wei, Z.; Skyllas-Kazacos, M. State of Charge Estimation of Vanadium Redox Flow Battery Based on Sliding Mode Observer and Dynamic Model Including Capacity Fading Factor. IEEE Trans. Sustain. Energy 2017, 8, 1658–1667. [Google Scholar] [CrossRef]
  142. Li, X.; Xiong, J.; Tang, A.; Qin, Y.; Liu, J.; Yan, C. Investigation of the use of electrolyte viscosity for online state-of-charge monitoring design in vanadium redox flow battery. Appl. Energy 2018, 211, 1050–1059. [Google Scholar] [CrossRef]
  143. Salkind, A.J.; Fennie, C.; Singh, P.; Atwater, T.; Reisner, D.E. Determination of state-of-charge and state-of-health of batteries by fuzzy logic methodology. J. Power Sources 1999, 80, 293–300. [Google Scholar] [CrossRef]
  144. Álvarez Antón, J.C.; García Nieto, P.J.; Blanco Viejo, C.; Vilán Vilán, J.A. Support Vector Machines Used to Estimate the Battery State of Charge. IEEE Trans. Power Electron. 2013, 28, 5919–5926. [Google Scholar] [CrossRef]
  145. Hansen, T.; Wang, C.J. Support vector based battery state of charge estimator. J. Power Sources 2005, 141, 351–358. [Google Scholar] [CrossRef]
  146. Choi, Y.Y.; Kim, S.; Kim, S.; Choi, J.I. Multiple parameter identification using genetic algorithm in vanadium redox flow batteries. J. Power Sources 2020, 450, 227684. [Google Scholar] [CrossRef]
  147. Xiong, B.; Jiyun, Z.; Jinbin, L. Modeling of an all-vanadium redox flow battery and optimization of flow rates. In Proceedings of the 2013 IEEE Power & Energy Society General Meeting, Vancouver, BC, Canada, 21–25 July 2013; pp. 1–5. [Google Scholar] [CrossRef]
  148. Wei, Z.; Bhattarai, A.; Zou, C.; Meng, S.; Lim, T.M.; Skyllas-Kazacos, M. Real-time monitoring of capacity loss for vanadium redox flow battery. J. Power Sources 2018, 390, 261–269. [Google Scholar] [CrossRef]
  149. Wei, Z.; Meng, S.; Tseng, K.J.; Lim, T.M.; Soong, B.H.; Skyllas-Kazacos, M. An adaptive model for vanadium redox flow battery and its application for online peak power estimation. J. Power Sources 2017, 344, 195–207. [Google Scholar] [CrossRef]
  150. Sun, M.; Su, Y.; Xiong, B.; Zhang, H.; Li, Y. Online Model Identification Method of Vanadium Redox Flow Battery Based on Time-varying Forgetting Factor Recursive Least Squares. In Proceedings of the 2019 Chinese Automation Congress (CAC), Hangzhou, China, 22–24 November 2019; pp. 1609–1614. [Google Scholar] [CrossRef]
  151. Chang, Y.; Sun, M.; Jia, W.; Liu, Z. Online Model Identification Method of Vanadium Redox Flow Battery Based on Multiple Innovation Recursive Least Squares. In Proceedings of the 2020 Asia Energy and Electrical Engineering Symposium (AEEES), Chengdu, China, 29–31 May 2020; pp. 758–762. [Google Scholar] [CrossRef]
  152. Wei, Z.; Lim, T.M.; Skyllas-Kazacos, M.; Wai, N.; Tseng, K.J. Online state of charge and model parameter co-estimation based on a novel multi-timescale estimator for vanadium redox flow battery. Appl. Energy 2016, 172, 169–179. [Google Scholar] [CrossRef]
Figure 1. Efficiency and lifetime comparison of main ESS. Information obtained from [42].
Energies 13 04514 g001
Figure 2. Scheme of a redox flow battery.
Energies 13 04514 g002
Figure 3. System temperature measurements.
Energies 13 04514 g003
Figure 4. Minimum flow rate profiles for charging (left) and discharging (right) processes.
Energies 13 04514 g004
Figure 5. Conventional controller block scheme in a RFB.
Energies 13 04514 g005
Figure 6. State observer scheme.
Energies 13 04514 g006
Figure 7. Parameter estimation schemes. (a) Online parameter estimation, (b) Offline parameter estimation.
Energies 13 04514 g007
Table 1. Advantages, disadvantages, power and discharge time of main ESS. Extracted from [15].
ESSMain AdvantageMain DisadvantagePowerDischarge Time
PHESHigh energy capacityGeographical environment10 MW–1 GW10–100 h
CAESHigh energy capacityGeographical environment10 MW–1 GW1–50 h
EDLCHigh power densityHigh cost10 kW–1 MW1–10 s
Lead-acidLow costShort life cycle1 kW–10 MW0.01–1 h
Sodium-sulphurHigh energyPoor safety100 kW–10 MW10 h
Lithium-ionHigh energyPoor safety1 kW–1 MW0.1–10 h
RFCHigh energy densityLow efficiency100 kW–10 MW1–10 h
RFBFlexible designLow energy density100 kW–80–90 MW1–10 h
Table 2. Parameters and constants for Nerst Equation, (5).
ParameterMeaningUnit
c i Concentration of specie imol·m 3
EElectrode potentialV
E θ Standard potentialV
TTemperature of the cellK
FFaraday’s constant96,485 C·mol 1
RGas constant8.314 J·K 1 ·mol 1
Table 3. Parameters for battery sizing.
ParameterMeaningUnit
SSurface of the electrodem 2
I m a x Maximum CurrentA
JDensity of currentA·m 2
E s t a c k Stack voltageV
E c e l l Cell VoltageV
PPowerW
NNumber of cells
E EnergyWh
Q c Electric chargeC
c V Total vanadium concentrationmol·m 3
V t a n k Tank volumem 3
N A Avogadro constant6.02 × 10 23 mol 1
e Electron charge1.602 × 10 19 C
Table 4. Battery sizing example.
ParameterMeaningUnit
PPower1.5 kW
E Energy15 kWh
I m a x Maximum Current50 A
E c e l l Cell Voltage1.4 V
c V Total vanadium concentration2 M
NNumber of cells27
V t a n k Tank volume0.4 m 3
E ρ Energy density18.75 Wh·L 1
Table 5. Main existing installations of VRFBs in the world.
NamePlaceYearEnergyPower
Kashima-Kita Electric Power [57]Japan1996800 kWh200 kW
Kansai Electric [92]Japan20001.6 MWh200 kW
Sumitomo Electric Group [93]Japan20056 MWh4 MW
Hokkaido Electric Power [94]Japan201660 MWh15 kW
Frauhofer Project [95]Germany201920 MWh2 kW
Table 6. RFB mathematical models classification.
LumpedDistributed
Electrochemical[106,107,108,109,110,111][100]
Thremal[110,111,112,113,114,115]
Hydraulic[116,117][99,101,102]
Equivalent circuit[118,119,120]
Table 7. Parameters of the electrochemical model.
ParameterMeaningUnit
c i c e l l Concentration of specie i (i = 2...5) inside the cellmol·m 3
c i t a n k Concentration of specie i (i = 2...5) inside the tankmol·m 3
V c e l l Volume of cellm 3
V t a n k Volume of each tankm 3
QFlow ratem 3 ·s 1
ICurrentA
SSurface area of the electrodem 2
dMembrane thicknessm
k i Difussion coefficientm 2 ·s 1
NNumber of cells of the stack
zNumber of electrons involved in the redox reaction1
FFaraday’s constant96,485 C·mol 1
RGas constant8.314 J·K 1 ·mol 1
Table 8. Subscripts of temperature variables.
SubscriptMeaning
CCatholyte tank
AAnolyte tank
C , o u t Pump line of catholyte
C , i n Transmission line of catholyte
A , o u t Pump line of anolyte
A , i n Transmission line of anolyte
s t a c k Stack of cells
Table 9. Parameters of the thermal model.
ParameterMeaningUnit
C p Specific heat capacity of vanadiumJ·kg 1 ·K 1
ρ Vanadium densitykg·m 3
V s t a c k Volume of the stackm 3
V p i p e Volume of pipem 3
QFlow rate of electrolytem 3 ·s 1
U s A s Heat transfer capability of the stackJ·K 1 ·s 1
U t a n k A t a n k Heat transfer capability of the tankJ·K 1 ·s 1
U p i p e A p i p e Heat transfer capability of the pipeJ·K 1 ·s 1
Δ H 2 Enthalpy change for reaction in vanadium specie V 2 + J·mol 1
Δ H 3 Enthalpy change for reaction in vanadium specie V 3 + J·mol 1
Δ H 4 Enthalpy change for reaction in vanadium specie V 4 + J·mol 1
Δ H 5 Enthalpy change for reaction in vanadium specie V 5 + J·mol 1
rOhmic resistance of the stack Ω
W p u m p Pump powerW
Table 10. Parameters of the hydraulic model.
ParameterMeaningUnit
W p u m p Pump powerW
ϵ Electrode porosity
μ Viscosity of the flowPa·s
ffriction loss factor
LLength of the pipem
L e l Length of the electrodesm
D h Hydraulic diameter of the pipem 2
d f mean diameter of the electrode fibersm
vVelocity of the flow ratem·s 1
Kpipe loss factor due to the form
K c k Kozeny-Carman constant
t e l Electrodes thicknessm
w e l Electrodes widthm
Table 11. Summary of SOC observers with their measurement variables (KF: Kalman filter; EKF: Extended Kalman filter; SMC: Slisind mode control; NN: Neural network; SVM: Support vector machines; FL: Fuzzy logic).
KF/EKFSMCNNSVMFL
Voltage/Current[119,128,139][140,141] [144,145][143]
Flow rate[138]
Temperature[128,134,138][140,141][142][144,145]
Density[128] [142]
Conductivity[129] [143]

