Article

The Impact of Pitch-To-Stall and Pitch-To-Feather Control on the Structural Loads and the Pitch Mechanism of a Wind Turbine

by
Arash E. Samani
1,2,*,
Jeroen D. M. De Kooning
1,3,
Nezmin Kayedpour
1,2,
Narender Singh
1,2 and
Lieven Vandevelde
1,2
1
Department of Electromechanical, Systems and Metal Engineering, Ghent University, Tech Lane Ghent Science Park-Campus A, Technologiepark Zwijnaarde 131, B-9052 Ghent, Belgium
2
FlandersMake@UGent—Corelab EEDT-DC, B-9052 Ghent, Belgium
3
FlandersMake@UGent—Corelab EEDT-MP, B-9052 Ghent, Belgium
*
Author to whom correspondence should be addressed.
Energies 2020, 13(17), 4503; https://doi.org/10.3390/en13174503
Submission received: 10 July 2020 / Revised: 14 August 2020 / Accepted: 22 August 2020 / Published: 1 September 2020
(This article belongs to the Special Issue Electrical Engineering for Sustainable and Renewable Energy)

Abstract

:
This article investigates the impact of the pitch-to-stall and pitch-to-feather control concepts on horizontal axis wind turbines (HAWTs) with different blade designs. Pitch-to-feather control is widely used to limit the power output of wind turbines in high wind speed conditions. However, stall control has not been taken forward in the industry because of the low predictability of stalled rotor aerodynamics. Despite this drawback, this article investigates the possible advantages of this control concept when compared to pitch-to-feather control with an emphasis on the control performance and its impact on the pitch mechanism and structural loads. In this study, three HAWTs with different blade designs, i.e., untwisted, stall-regulated, and pitch-regulated blades, are investigated. The control system is validated in both uniform and turbulent wind speed. The results show that pitch-to-stall control enhances the constant power control for wind turbines with untwisted and stall-regulated blade designs. Stall control alleviates the fore-aft tower loading and the blades flapwise moment of the wind turbine with stall-regulated blades in uniform winds. However, in turbulent winds, the flapwise moment increases to a certain extent as compared to pitch-to-feather control. Moreover, pitch-to-stall control considerably reduces the summed blade pitch movement, despite that it increases the risk of surface damage in the rolling bearings due to oscillating movements with a small amplitude.

Graphical Abstract

1. Introduction

The worldwide installed wind power capacity reached over 651 GW by the end of 2019, growing with 60.4 GW in the last year alone [1]. The exponential growth of the wind turbine market challenges manufacturers to reduce the wind turbines’ capital costs, which leads to a reduction of the Cost of Energy (CoE). More attention is required for the material use in current wind turbine designs, i.e., use of steel, concrete, and composite materials, in order to further reduce manufacturing costs. Therefore, the knowledge and reduction of mechanical loads on the structure of wind turbines are crucial to design future wind turbines with lower material costs. The fatigue loads are strongly determined by the actions of the control system, e.g., pitch control, variable speed control and yaw control. A proper control system design requires a compromise between several conflicting objectives, i.e., power output regulation versus limiting the mechanical loads. In this regard, different control concepts have been developed to improve performance and reduce structural loads and fatigue. Individual pitch systems have been implemented in order to mitigate the load without modifying the blade [2,3]. However, these systems have a higher energy consumption and a limited impact on load reduction [4]. The research on active flow control, e.g., trailing edge flaps, microtabs, and synthetic jet actuators, had much progress in the last decade. Although these systems reduce the structural loads, they significantly add more complexity to the blade design and blade manufacturing [5,6].
The Operations and Maintenance (O&M) costs are estimated to amount up to 30% of the Total Cost of Ownership (TCO) [7]. Therefore, enhancing the reliability of wind turbines is one of the important determinants in reducing the Cost of Energy (CoE). A well-designed control system can ensure the wind turbines reliability by reducing the failure rates and downtime. The pitch system accounts for one of the critical sub-assemblies with high failure rates, especially for offshore wind turbines [8]. For blade bearings, four-point contact rolling bearings are usually used to minimise the bearings’ friction moment, and to avoid undesired large pitching. The separating lubrication film is formed if the rolling bearings rotate continually under nearly constant load and speed [9]. One of the concerns in the pitch system is the risk of surface wear in the blade bearings, i.e., adhesive and abrasive wear caused by oscillating pitch movements with a small amplitude. The bearings movement pattern is dictated by the pitch control strategy, i.e., Collective Pitch Control (CPC), Individual Pitch Control (IPC), pitch-to-stall, and pitch-to-feather. In [10], Stammler et al. compared the IPC and CPC effect on the loads and blade bearing movements of wind turbines. The results show that, despite the expected negative impact of IPC on the blade bearings’ lifetime, the risk of wear decreases because of the reduction in small pitch movements. Therefore, besides the impact of the blade pitching strategy on the structural loads, its impact on the pitch mechanism needs to also be analysed.
In high wind speeds, the rotor speed can be limited by a blade pitching system either by pitching the blades to feather or to stall. The pitch-to-stall control concept has not been widely used in wind industry because of the uncertainty of the rotor aerodynamics in the stall condition. Larsen and Hansen monitored the pitch-to-stall impact on the performance of an offshore HAWT with a pitch-regulated blade design. The simulation results showed that the stall control improved the constant power generation and tower stability as compared to pitch control [11]. Additionally, Jonkman tested the pitch-to-stall control on the NREL 5 MW offshore wind turbine with a pitch-regulated blade design. The results verified that active stall control again improved the rotor speed and power control, though it does not dampen the barge-pitch motions [12]. Macquart and Maheri redesigned the original pitch regulated blade of the NREL 5 MW wind turbine in order to reach a better performance in stall-regulated operation. It was shown that the amplitude of the cyclic loads was reduced in pitch-to-stall control [13]. In [14], it is shown that back-twisted blades, together with pitch-to-stall control, improve the tower axial fatigue life and power output generation of a semi-submersible floating offshore wind turbine. In [15], Loza et al. performed a comparative fatigue life assessment for a small wind turbine operating as a stall-regulated and pitch-regulated turbine. The stall control is implemented by regulating the generator torque at high wind speeds while the pitch angle is kept at a fixed value, i.e., speed stall control. The results show that stall regulation leads to higher fatigue loads on the blades. However, the impact is smaller than thought before, and stall regulation may be a valid option for the cost-effective design for small wind turbines.
This article provides a thorough investigation of the potential benefits of the pitch-to-stall versus the pitch-to-feather control strategies. The dynamic performance under uniform and turbulent winds, the structural loading of the blades and tower, and the blade bearing movements in the pitch system will be investigated. This will be done for three wind turbines with fundamentally different blade designs, i.e., untwisted, pitch-regulated, and stall-regulated blades to represent the aerodynamic behaviour of a wide range of wind turbines in the market, i.e., from small and medium up to large scale wind turbines. The open-source FAST software (v8, National Renewable Energy Laboratory, Golden, CO, USA), which models the wind turbine, is coupled with a Matlab/Simulink (9.5, MathWorks, Natick, MA, USA) model that contains the generator and control systems.
This article is organised, as follows: Section 2.1 describes the wind turbine model and generator system. Section 2.2 explains the pitch-to-feather and pitch-to-control control systems. Their performance is validated in Section 3.1. The wind field simulation is explained in Section 3.2. The dynamic performance of the wind turbine in turbulent wind flow is assessed in Section 3.3. The impact of the control on the pitch mechanism and structural loads is assessed in Section 3.4 and Section 3.5, respectively.

2. Methodology

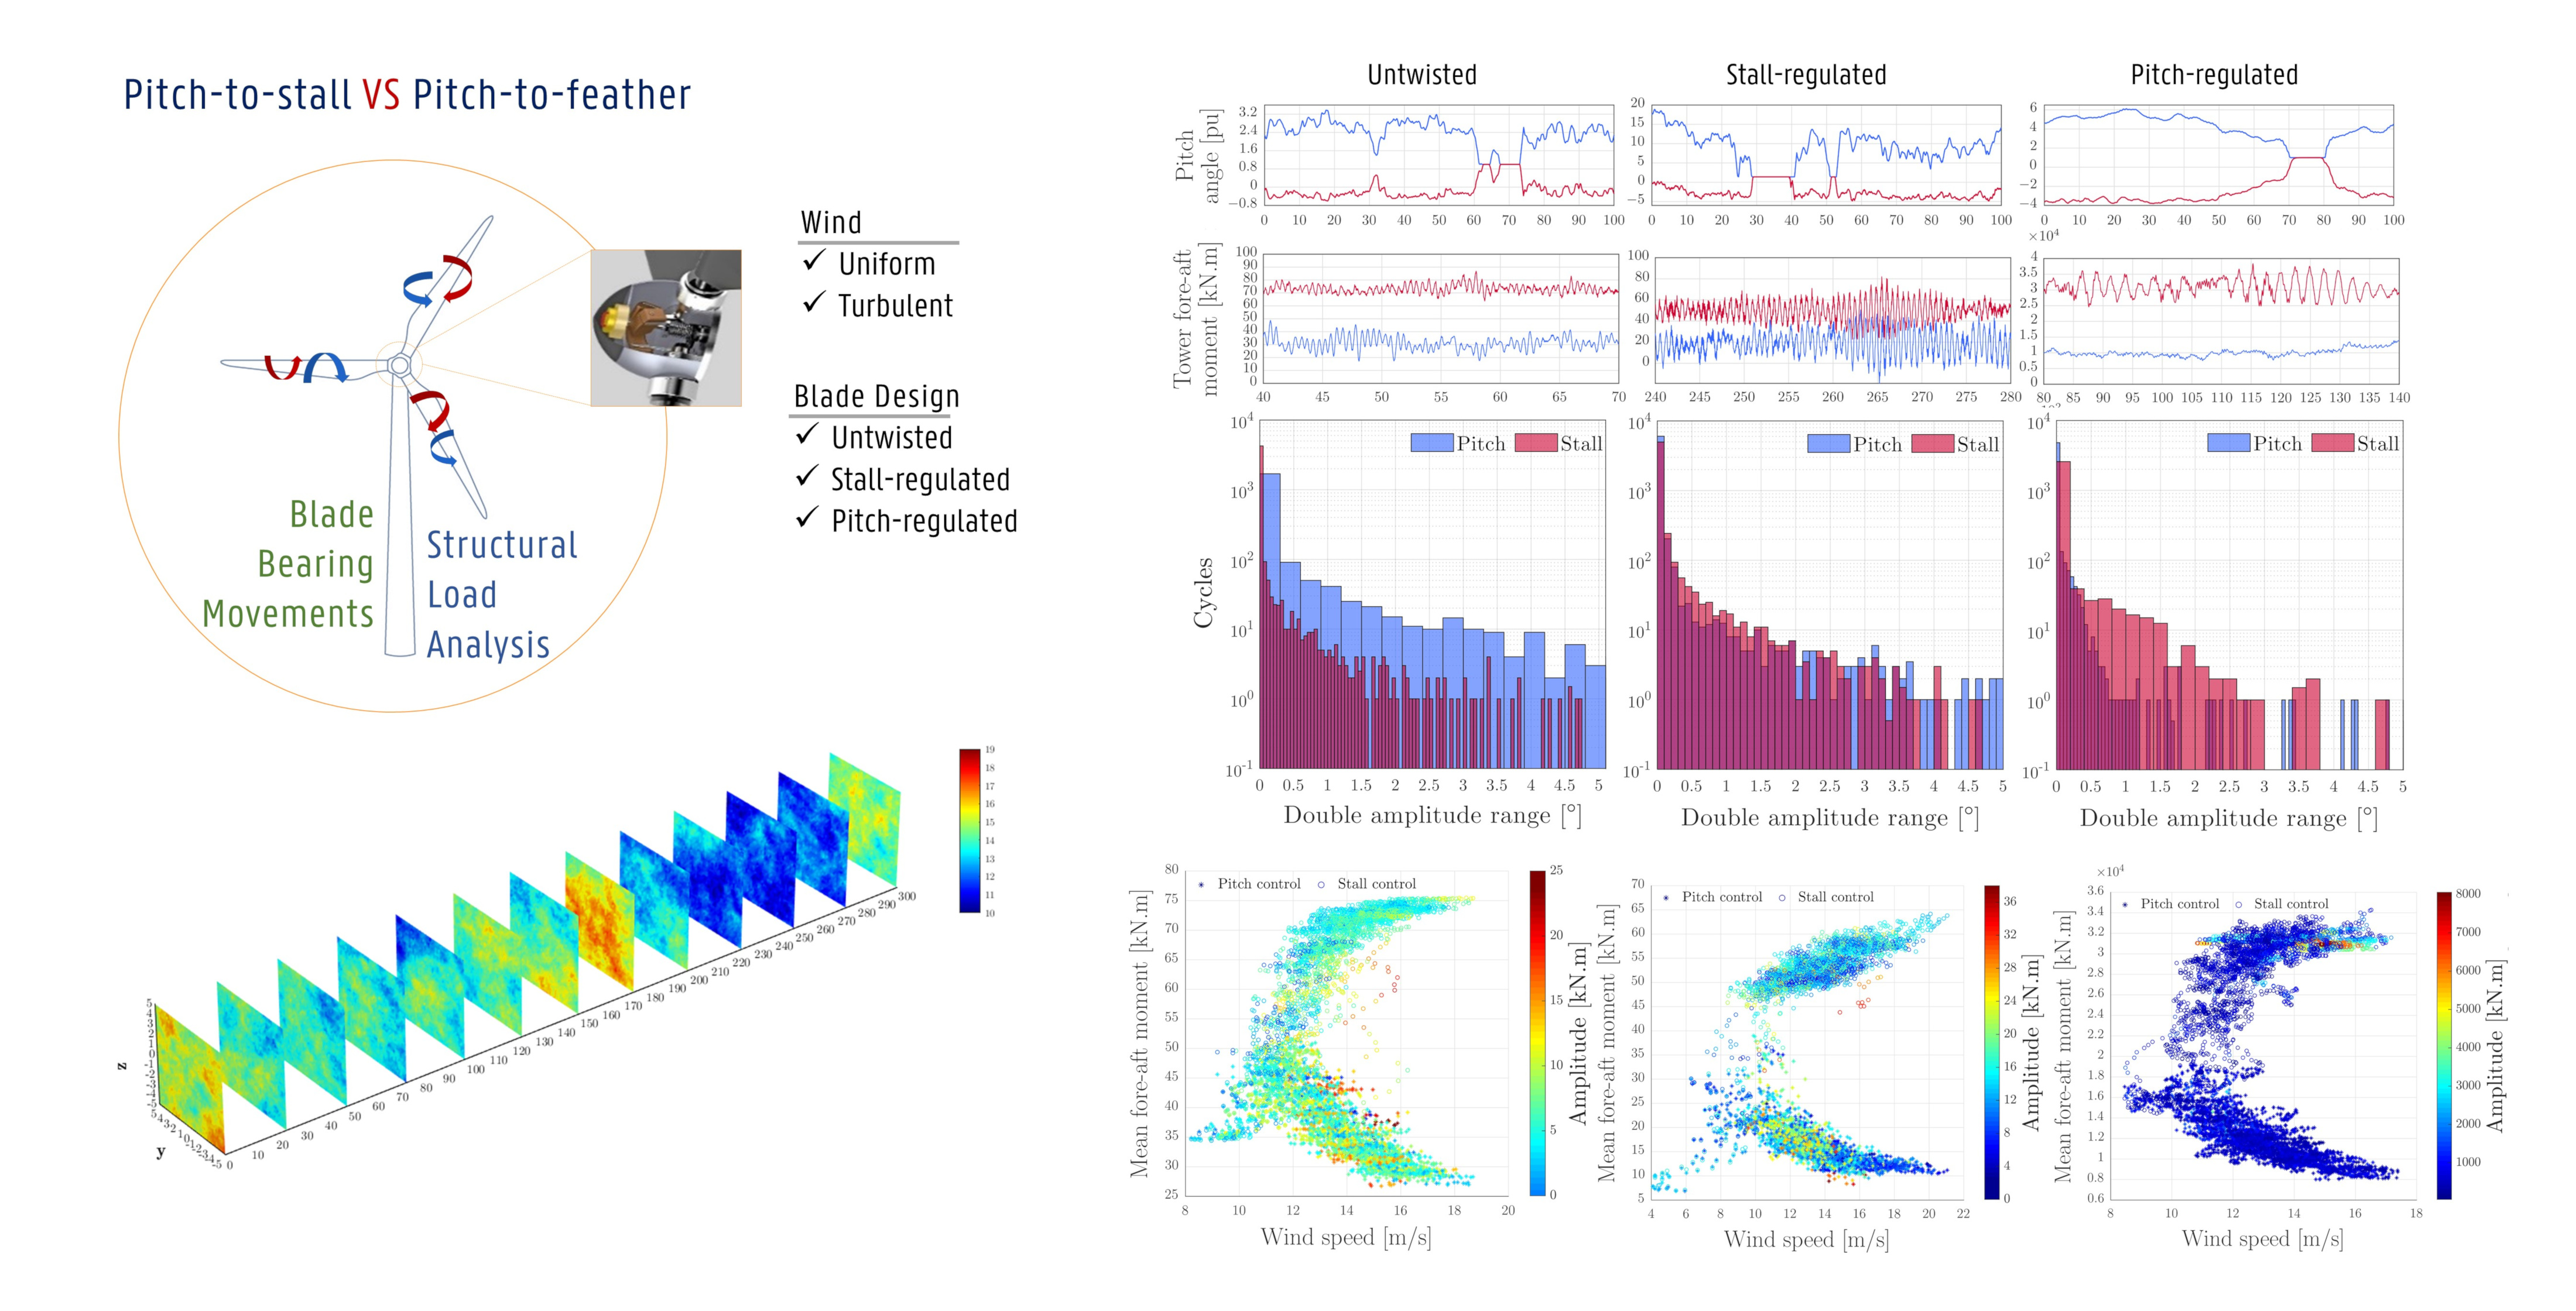
2.1. Wind Turbine Generation System

Figure 1 shows the structure of a modern wind turbine system based on a Permanent Magnet Synchronous Generator (PMSG). The turbine rotor (a) harvests the kinetic energy in the wind and drives the PMSG (b). Due to the high pole pair number of the generator, a gearbox is not used in this topology, i.e., it is a direct-drive system. The output voltage of the PMSG has a variable amplitude and frequency and it is converted to a dc voltage by the rectifier (c), which also regulates the generator torque, e.g., for Maximum Power Point Tracking (MPPT). The inverter (d) injects the electrical power into the grid (e).
Three wind turbines with a different power rating and blade design are simulated in this article, i.e., the SWRT 10 kW turbine with untwisted blades, the UAE 20 kW turbine with stall-regulated blades, and the WP 1.5 MW turbine with pitch-regulated blades. Table 1 gives the specifications of these turbines. Table A1 in the Appendix A gives more details on the blade design, i.e., the aerofoil distribution and twist angles of, respectively, the untwisted, stall-regulated, and pitch-regulated blades. Figure 2 shows the power coefficient C P of the wind turbines as a function of the pitch angle θ and the tip speed ratio λ . The FAST turbine models are coupled to a generator and converter model implemented in Matlab/Simulink. The PMSG is modelled by an equivalent scheme in the rotating reference frame, including its dynamics, copper losses and iron losses [16]. A field oriented vector control is used to regulate the generator torque.

2.2. Control System

The operating area of a wind turbine can be subdivided into four regions, as illustrated in Figure 3. In region I, below the cut-in wind speed v c u t i n , the turbine does not generate power. In region II, above the cut-in speed v c u t i n , Maximum Power Point Tracking (MPPT) is used to maximise power. Region III is a transition region between regions II and IV, and the wind turbine operates around nominal rotational speed, but below the rated power. In region IV, above the rated wind speed v r , both power and rotor speed are limited in order to avoid exceeding their rated values. If the wind speed rises above the cut-out speed v c u t o u t , the braking system brings the rotor to a standstill for safety reasons.
In region II, the control objective is to maximise power for any given wind speed by maximising the power coefficient. This is achieved by regulating the generator speed and torque in a cascaded control system. The MPPT algorithm is of the Power-Signal Feedback (PSF) type, which uses a pre-defined look-up table to determine the reference power in terms of the measured rotor speed. The look-up table data are generated by simulating power-speed characteristic curves for different wind speeds. Figure 4 shows the power-speed curves of the SWRT, UAE, and WP turbines over the wind speeds in region II. In the simulations, both the mechanical power P m of the turbine and the electrical power P e that are injected into the grid are simulated. The mechanical and electrical power differ due to the losses in the system [17,18,19]. To reach maximum efficiency, these losses must be taken into account by the MPPT. Therefore, the look-up table data are extracted from the electrical power, not the mechanical power.
At wind speeds that are higher than the nominal value, the aerodynamic power is limited by reducing the lift forces on the wind turbine blades, which is obtained by regulating the angle of attack through pitching the blades. The lift coefficient C l increases linearly when increasing the angle of attack up to a certain value, i.e., the critical or stalling angle of attack, at which the lift coefficient reaches its maximum value C l m a x . A further increase of the blades’ angle of attack leads to a drastic reduction in lift, which is known as stall. Therefore, in the high wind region, the aerodynamic power can be limited by using two different control strategies, as described below:
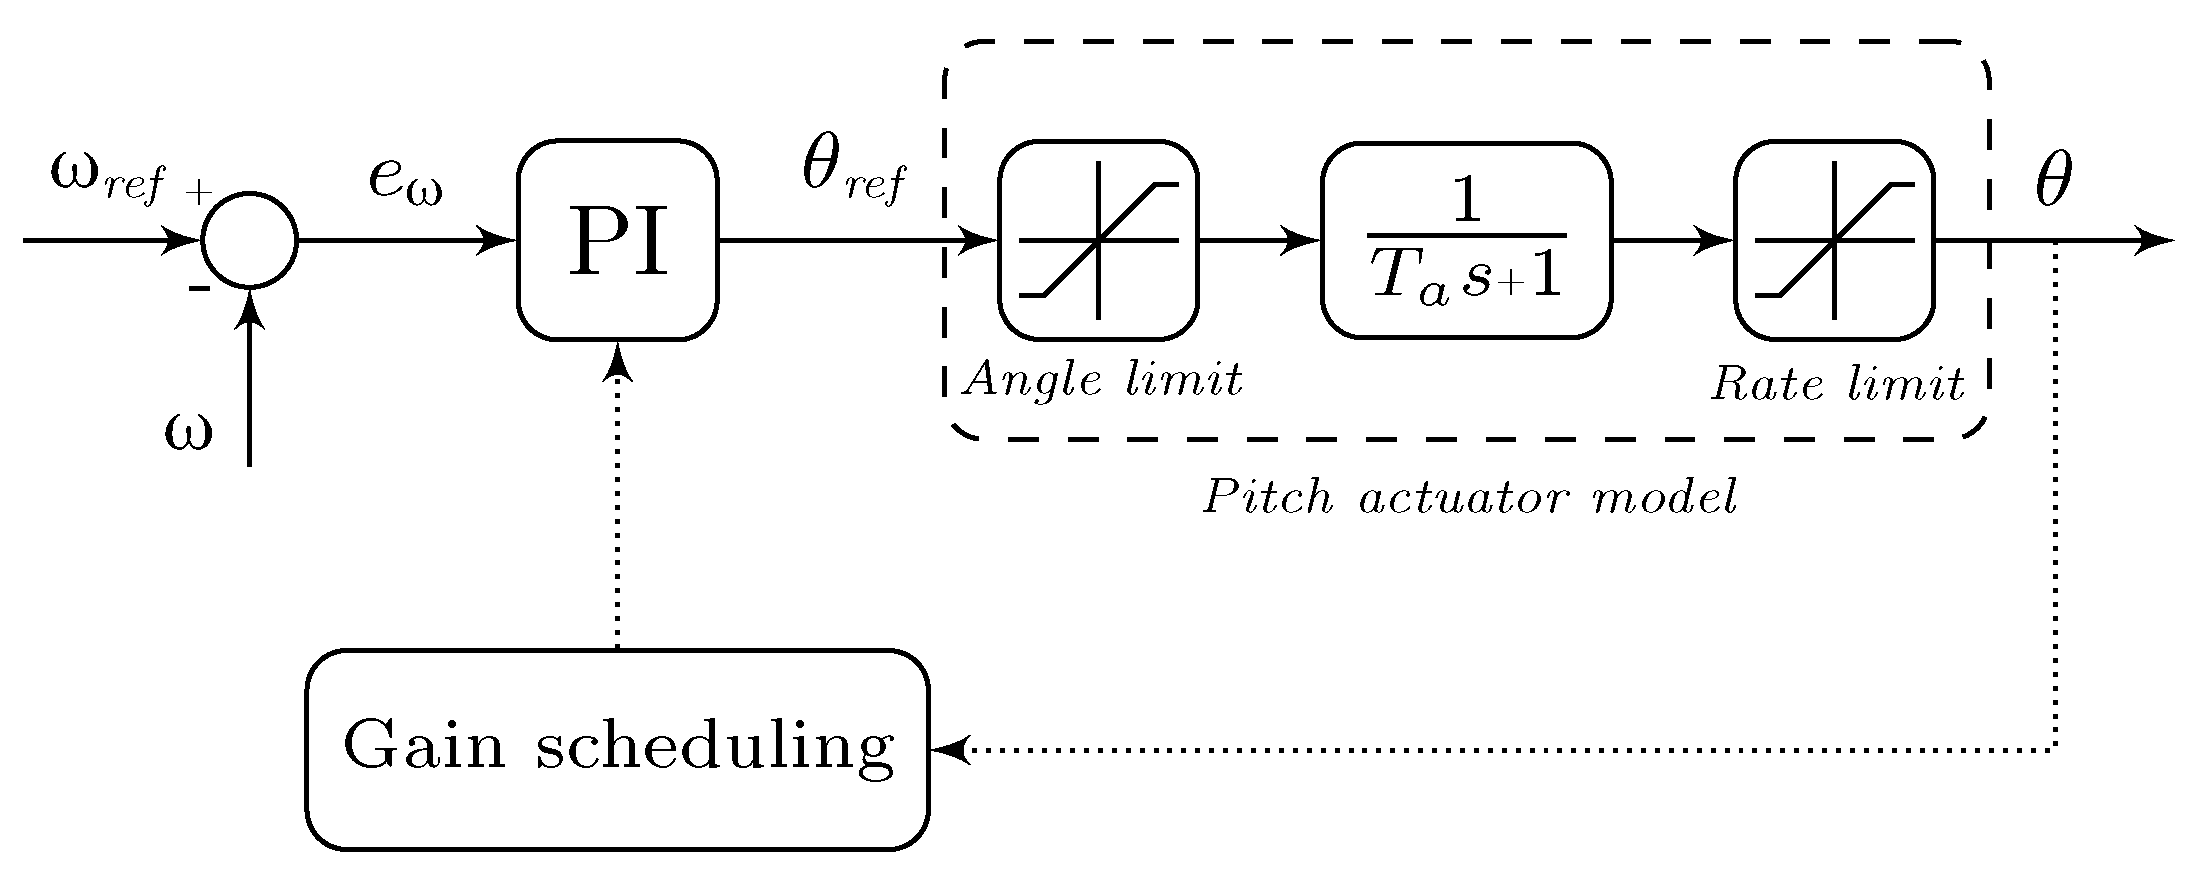
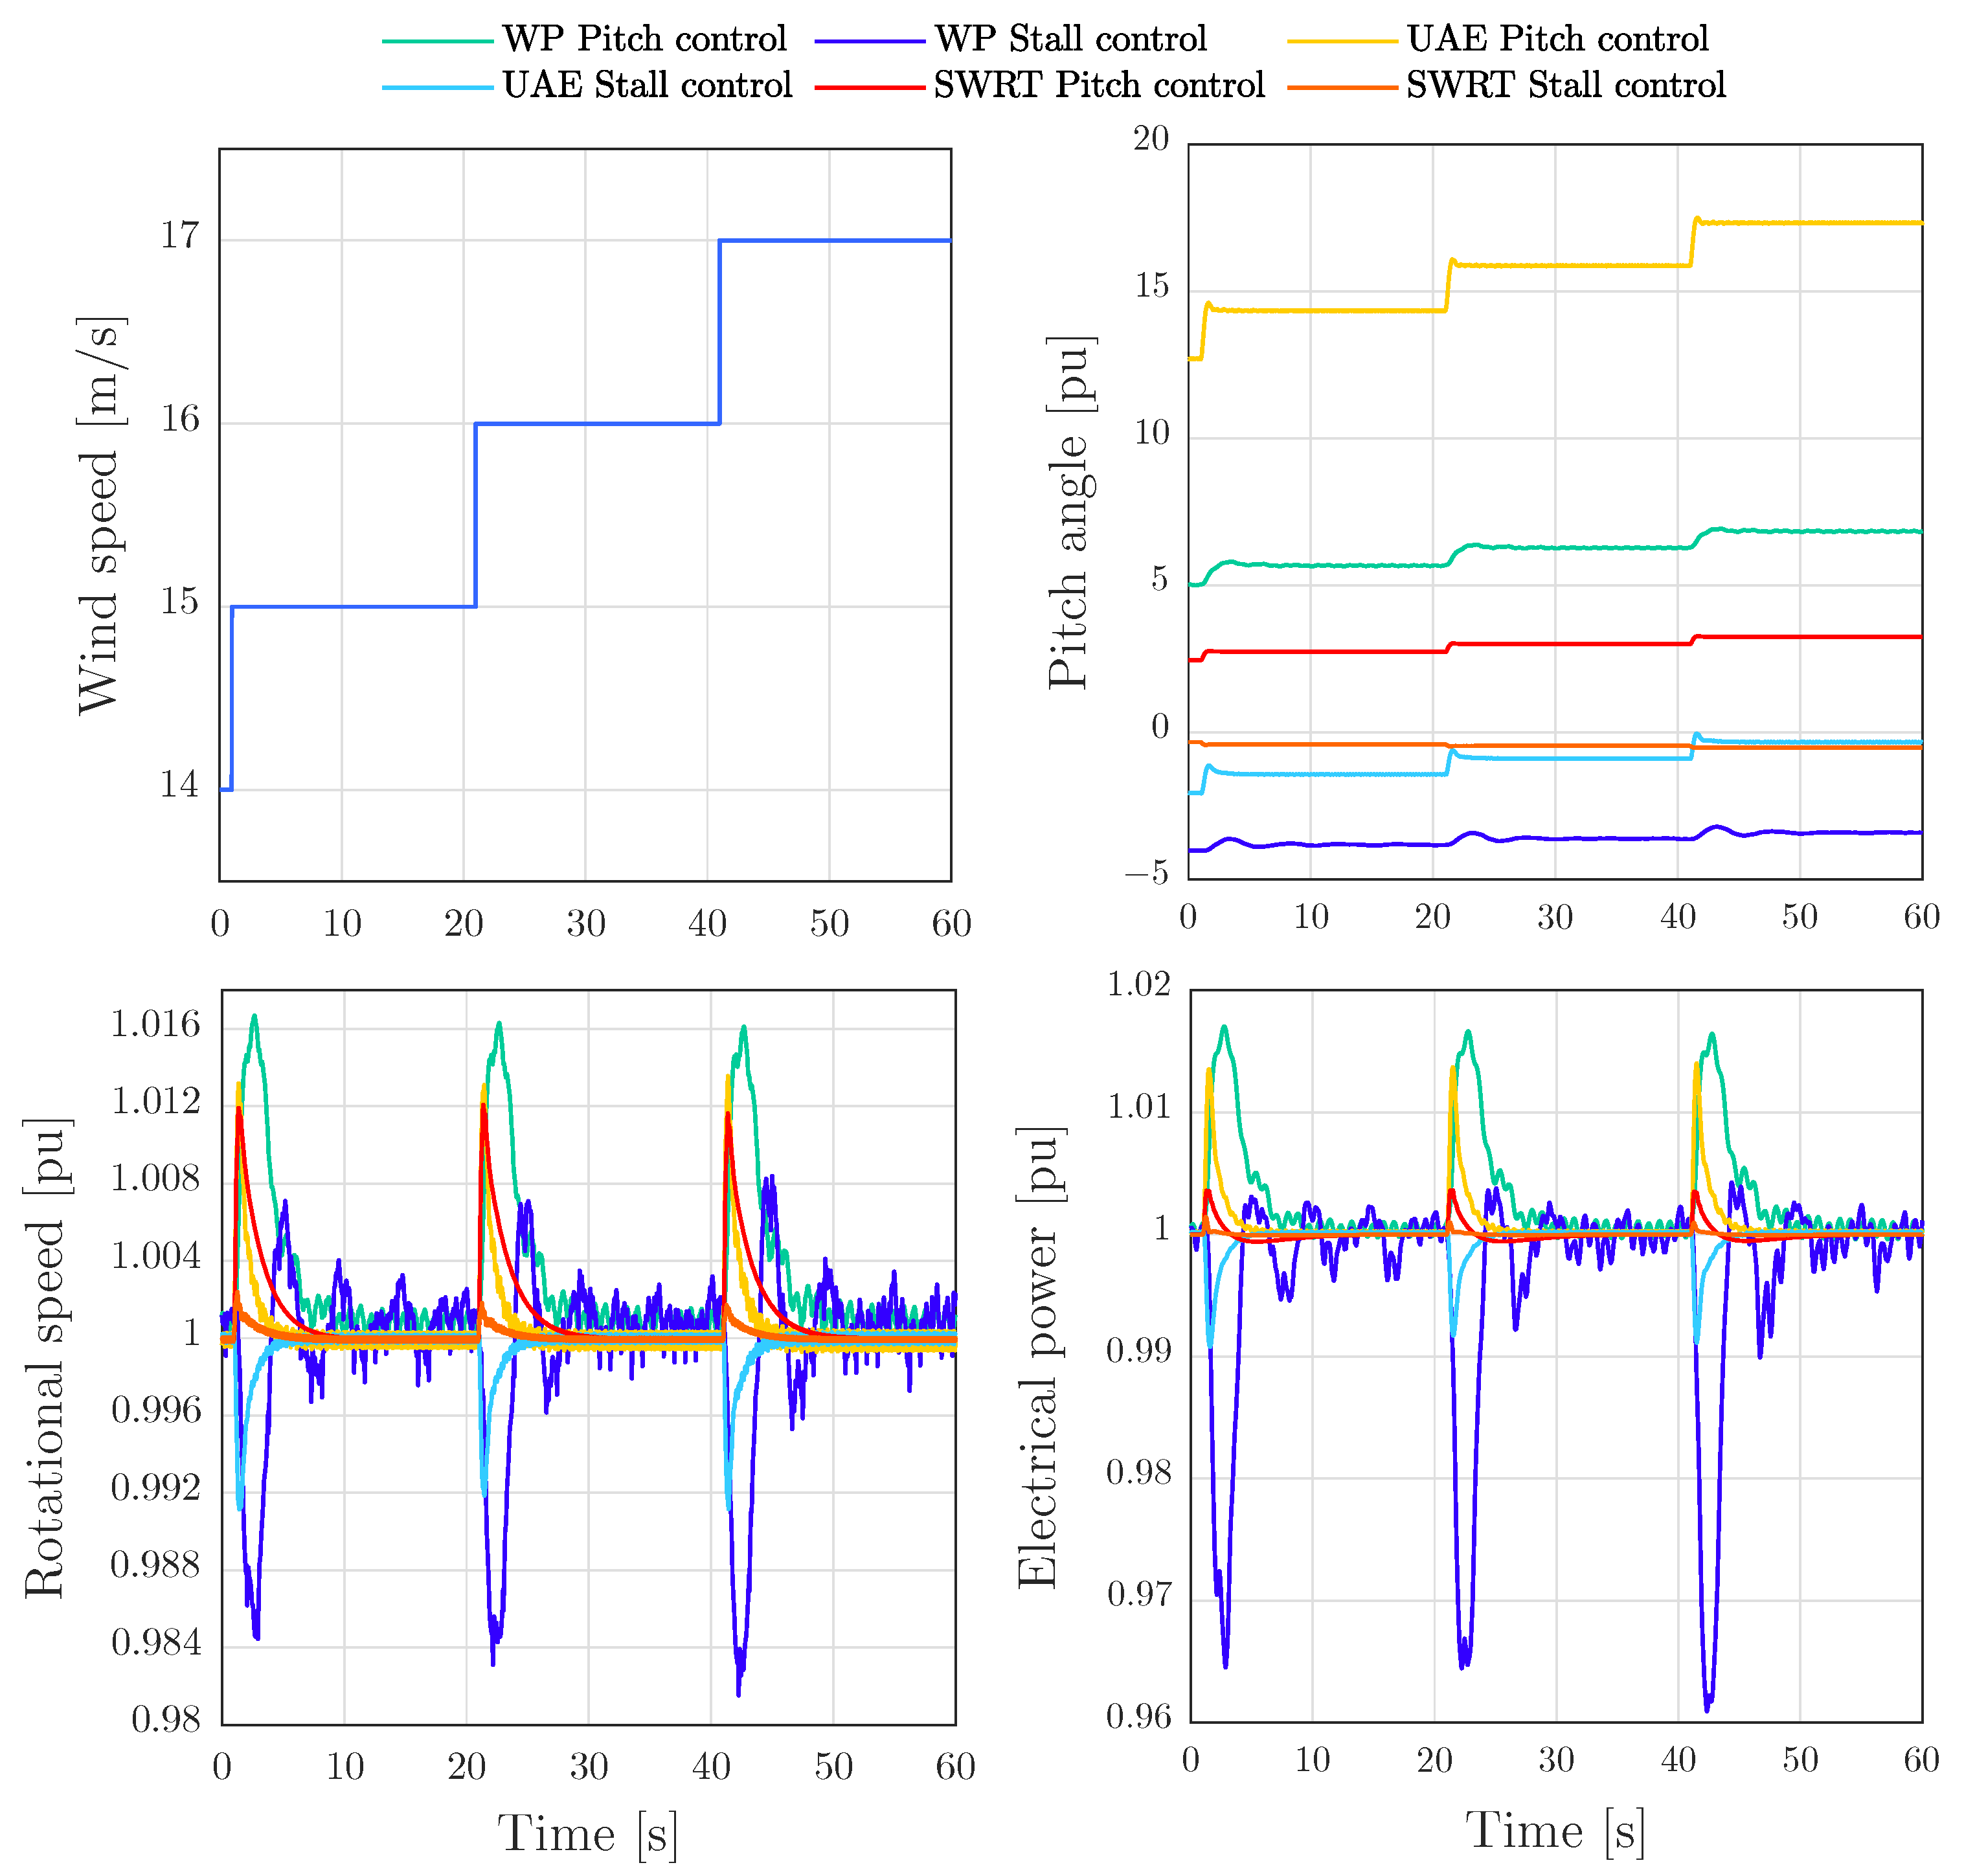
  • Pitch-to-feather (pitch control): the rotational speed is limited to the rated value by pitching the blades to feather. By pitching the blades’ leading edge into the wind, the aerodynamic process of blade feathering occurs, which causes a reduction of the aerodynamic forces. Therefore, the speed controller increases the pitch angle, thus reducing the angle of attack, in order to limit the lift forces and driving torque. The pitching rate should be high enough to keep the generator speed at its nominal value and deal with the fluctuating nature of wind.
  • Pitch-to-stall (stall control): the controller turns the blades in the opposite direction to the direction of pitch-to-feather, i.e., turning the blades’ leading edge out of the wind, thus increasing the blades’ angle of attack beyond the critical or stalling angle of attack. Therefore, the lift forces on the blades are reduced as the lift coefficient exceeds its maximum C l m a x .
Pitch control is typically nonlinear, because the sensitivity of the system varies under different operating conditions. The pitch sensitivity, denoted by the partial derivative of aerodynamic power with respect to the pitch angle P θ , is an aerodynamic property of the rotor that depends on the wind speed, rotor speed, and pitch angle. Therefore, the blade has different responses to the pitch angle variations in region IV, which is important for determining the gains of the blade pitch speed controller. Figure 5 compares the pitch sensitivity of the wind turbines in the stall and pitch mode from nominal to cut-out wind speed. The blade-pitch sensitivity is calculated for the SWRT, UAE, and WP turbines by performing a linearisation analysis in FAST. In each linearisation step, the pitch angle is altered at rated power, and the aerodynamic power sensitivity is calculated. The pitch sensitivity changes with pitch angle for wind speeds in region IV, as shown in Figure 5. The negative values of the pitch sensitivity in pitch-to-feather mode are due to the negative variation of aerodynamic power to the positive variation pitch angle, i.e., increasing the pitch angle to reduce the angle of attack. Likewise, the positive value of the pitch sensitivity in pitch-to-stall is due to a negative variation of aerodynamic power to a negative variation in pitch angle, i.e., pitching the blades to the negative direction to increase the angle of attack towards stall. The aerodynamic sensitivity is lower for the pitch-to-stall mode than pitch-to-feather, which means that the aerodynamic power varies more slowly for the negative pitch angles, as illustrated in this figure. Additionally, much smaller pitch actions are needed in order to control the aerodynamic power. The lower aerodynamic sensitivity may be an advantage to reduce fatigue loads and improve the pitch mechanisms performance, i.e., the blade’s pitch bearing movements. In pitch-to-feather, the blades are held in attached flow conditions, giving rise to high aerodynamic sensitivity while in the pitch-to-stall process, the boundary layer separates from the upper side of the blade resulting in the low aerodynamic sensitivity. The difference in behaviour of the different wind turbines in stall mode originates from their different blade geometry. The SWRT and UAE wind turbines have thin aerofoils and a high curvature around the leading edge, which tend to stall more abruptly than the WP turbine with a thick aerofoil.
In the pitch-to-feather control mode, the pitch sensitivity varies considerably over the region IV, which requires scheduling the controller gain as a function of the pitch angle. However, the variation of the pitch sensitivity with pitch angle is nearly linear, and it follows the same trend for all three wind turbines, thus:
P θ = P θ ( θ = θ r ) θ k θ + P θ ( θ = θ r )
where P θ ( θ = θ r ) is the sensitivity of aerodynamic power to the pitch angle variation at the rated operating point. The pitch angle θ k is defined as the angle at which the blade sensitivity has increased by a factor of 2, when compared to its value at the rated operating point [20], i.e.:
P θ ( θ = θ k ) = 2 P θ ( θ = θ r )
Based on the linear relation between the pitch sensitivity P θ and the pitch angle θ , the gain scheduling can be implemented by defining a dimensionless gain-correction factor G k as a function of pitch angle [20,21]:
G k = 1 1 + θ θ k
which can be written in a more general form for wind turbines with a non-zero optimal pitch angle as:
G k = 1 1 + θ θ r θ k
According to (4), the controller gains are varied in order to cope with the variation of the pitch sensitivity in region IV. A higher gain is applied where the sensitivity is low, i.e., where θ is near θ r , and vice versa.
In the pitch-to-stall mode, the pitch sensitivity varies nonlinearly with pitch angle, and its relation also depends on the blade design. The aerodynamic sensitivity of the SWRT turbine first decreases with the pitch angle before increasing again by pitching the blades more into the stall condition. A linear gain correction factor for pitch control is not able to deal with this variation of pitch sensitivity. Therefore, a gain correction function is proposed here for the stall control based on its nonlinear behaviour in the stall condition:
G s = 2 1 + θ θ k 2
The aerodynamic sensitivity of the UAE and WP wind turbines has two values at the same pitch angle and, thus, the gain schedule of the stall controller is double-valued. Therefore, the pitch angle signal is not enough to identify the exact operating point. One solution is to measure the wind speed and use the signal as an additional input to determine the operating point. Additionally, it is possible to only use the pitch signal and detune the controller in order to ensure that the controller works properly at different wind speeds in region IV [22].
Figure 6 shows the pitch system diagram. The controller gains are tuned based on the blade pitch sensitivity in the pitch-to-stall and pitch-to-feather mode. The PI speed controller generates the reference pitch signal θ r e f . This signal is sent to the pitch actuator model, which is represented by a first-order transfer function with a time constant T a . A position and rate limiter are applied in order to ensure that the actuator limits are not exceeded. The time constant T a is equal to 0.1 s, and the rate limit is set at 10 ° /s for all turbine models [21,23].

3. Verifications and Results

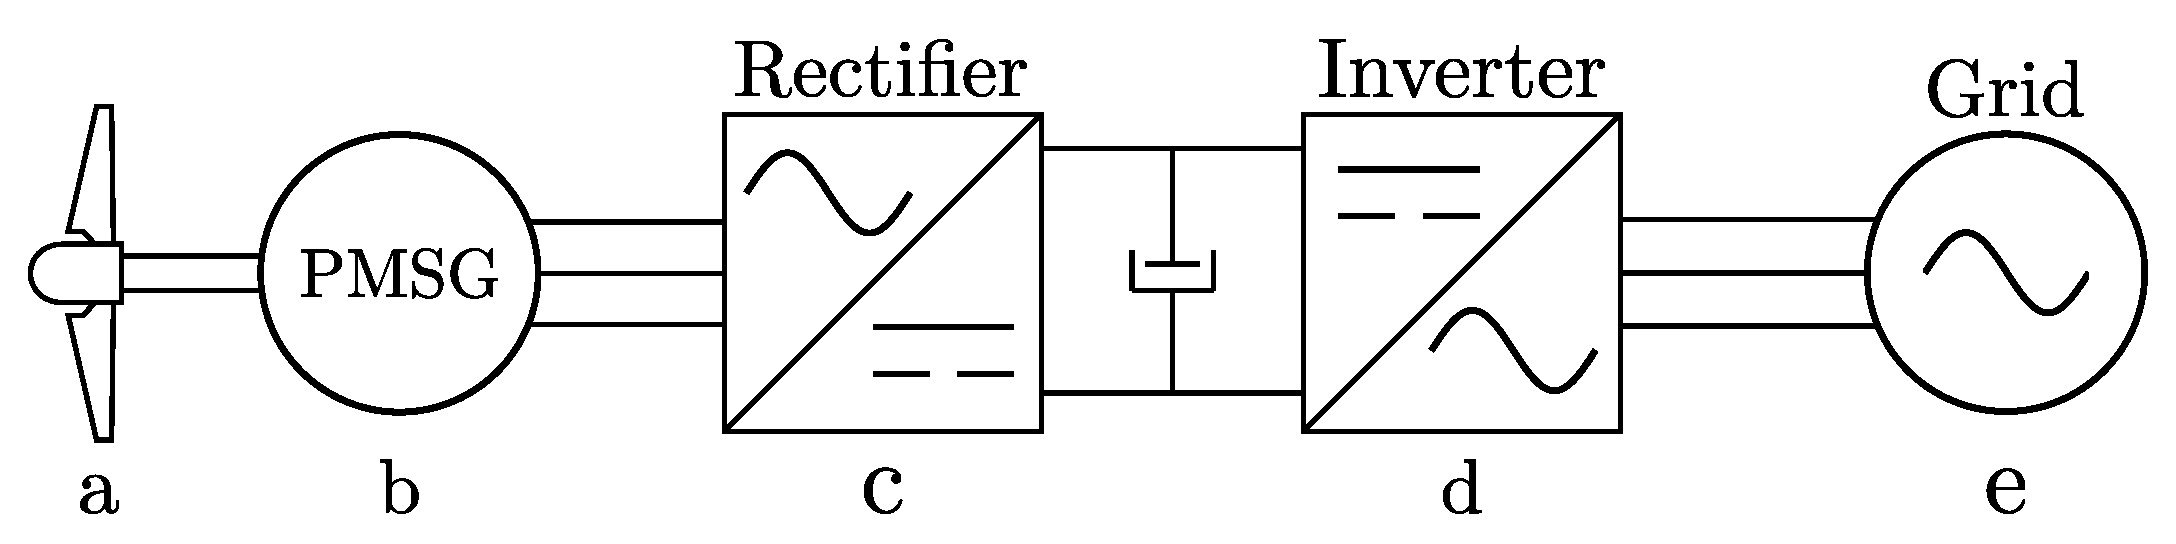
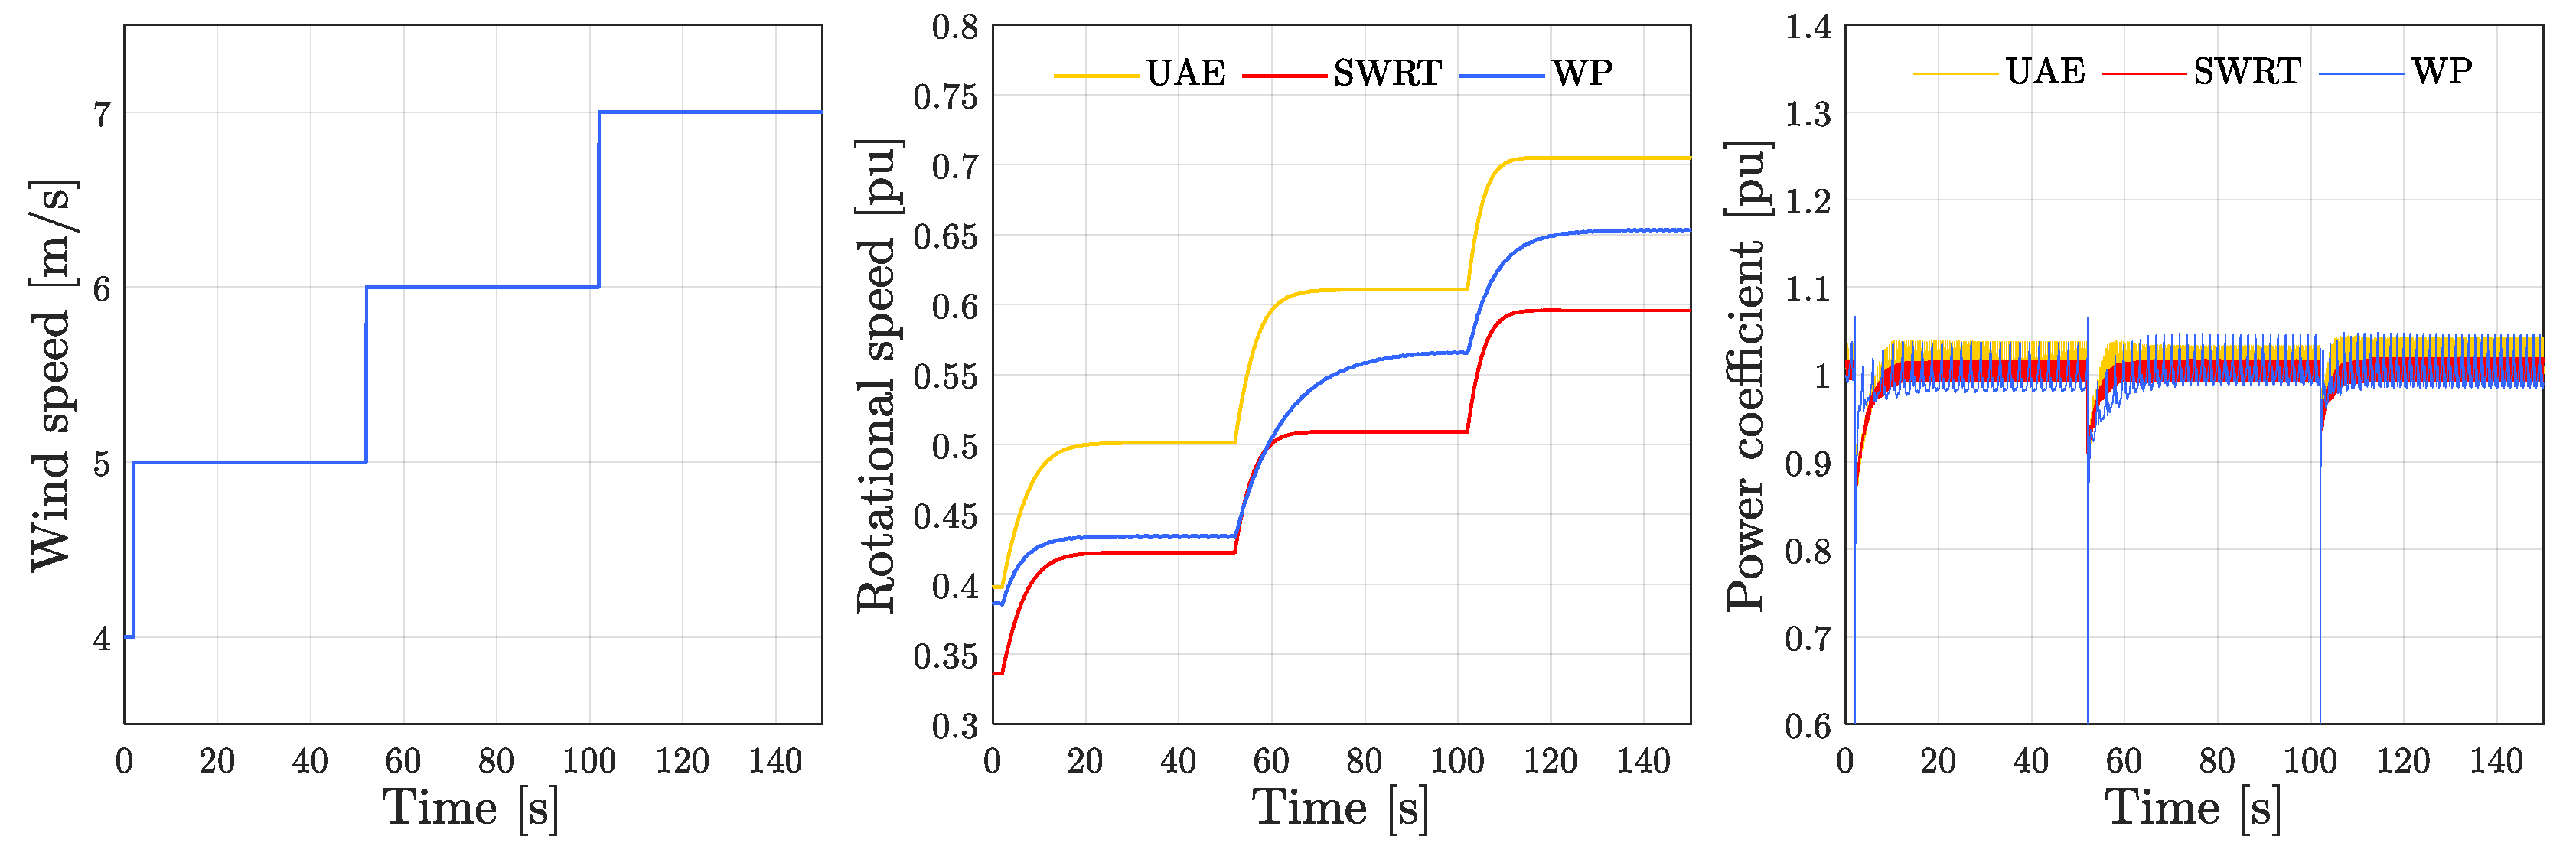
3.1. Validation of Control Performance

The performance of both the pitch-to-stall and pitch-to-feather control systems (with gain scheduling) is first verified by simulating the wind turbines in uniform winds. The following objectives are addressed in order to validate the control performance:
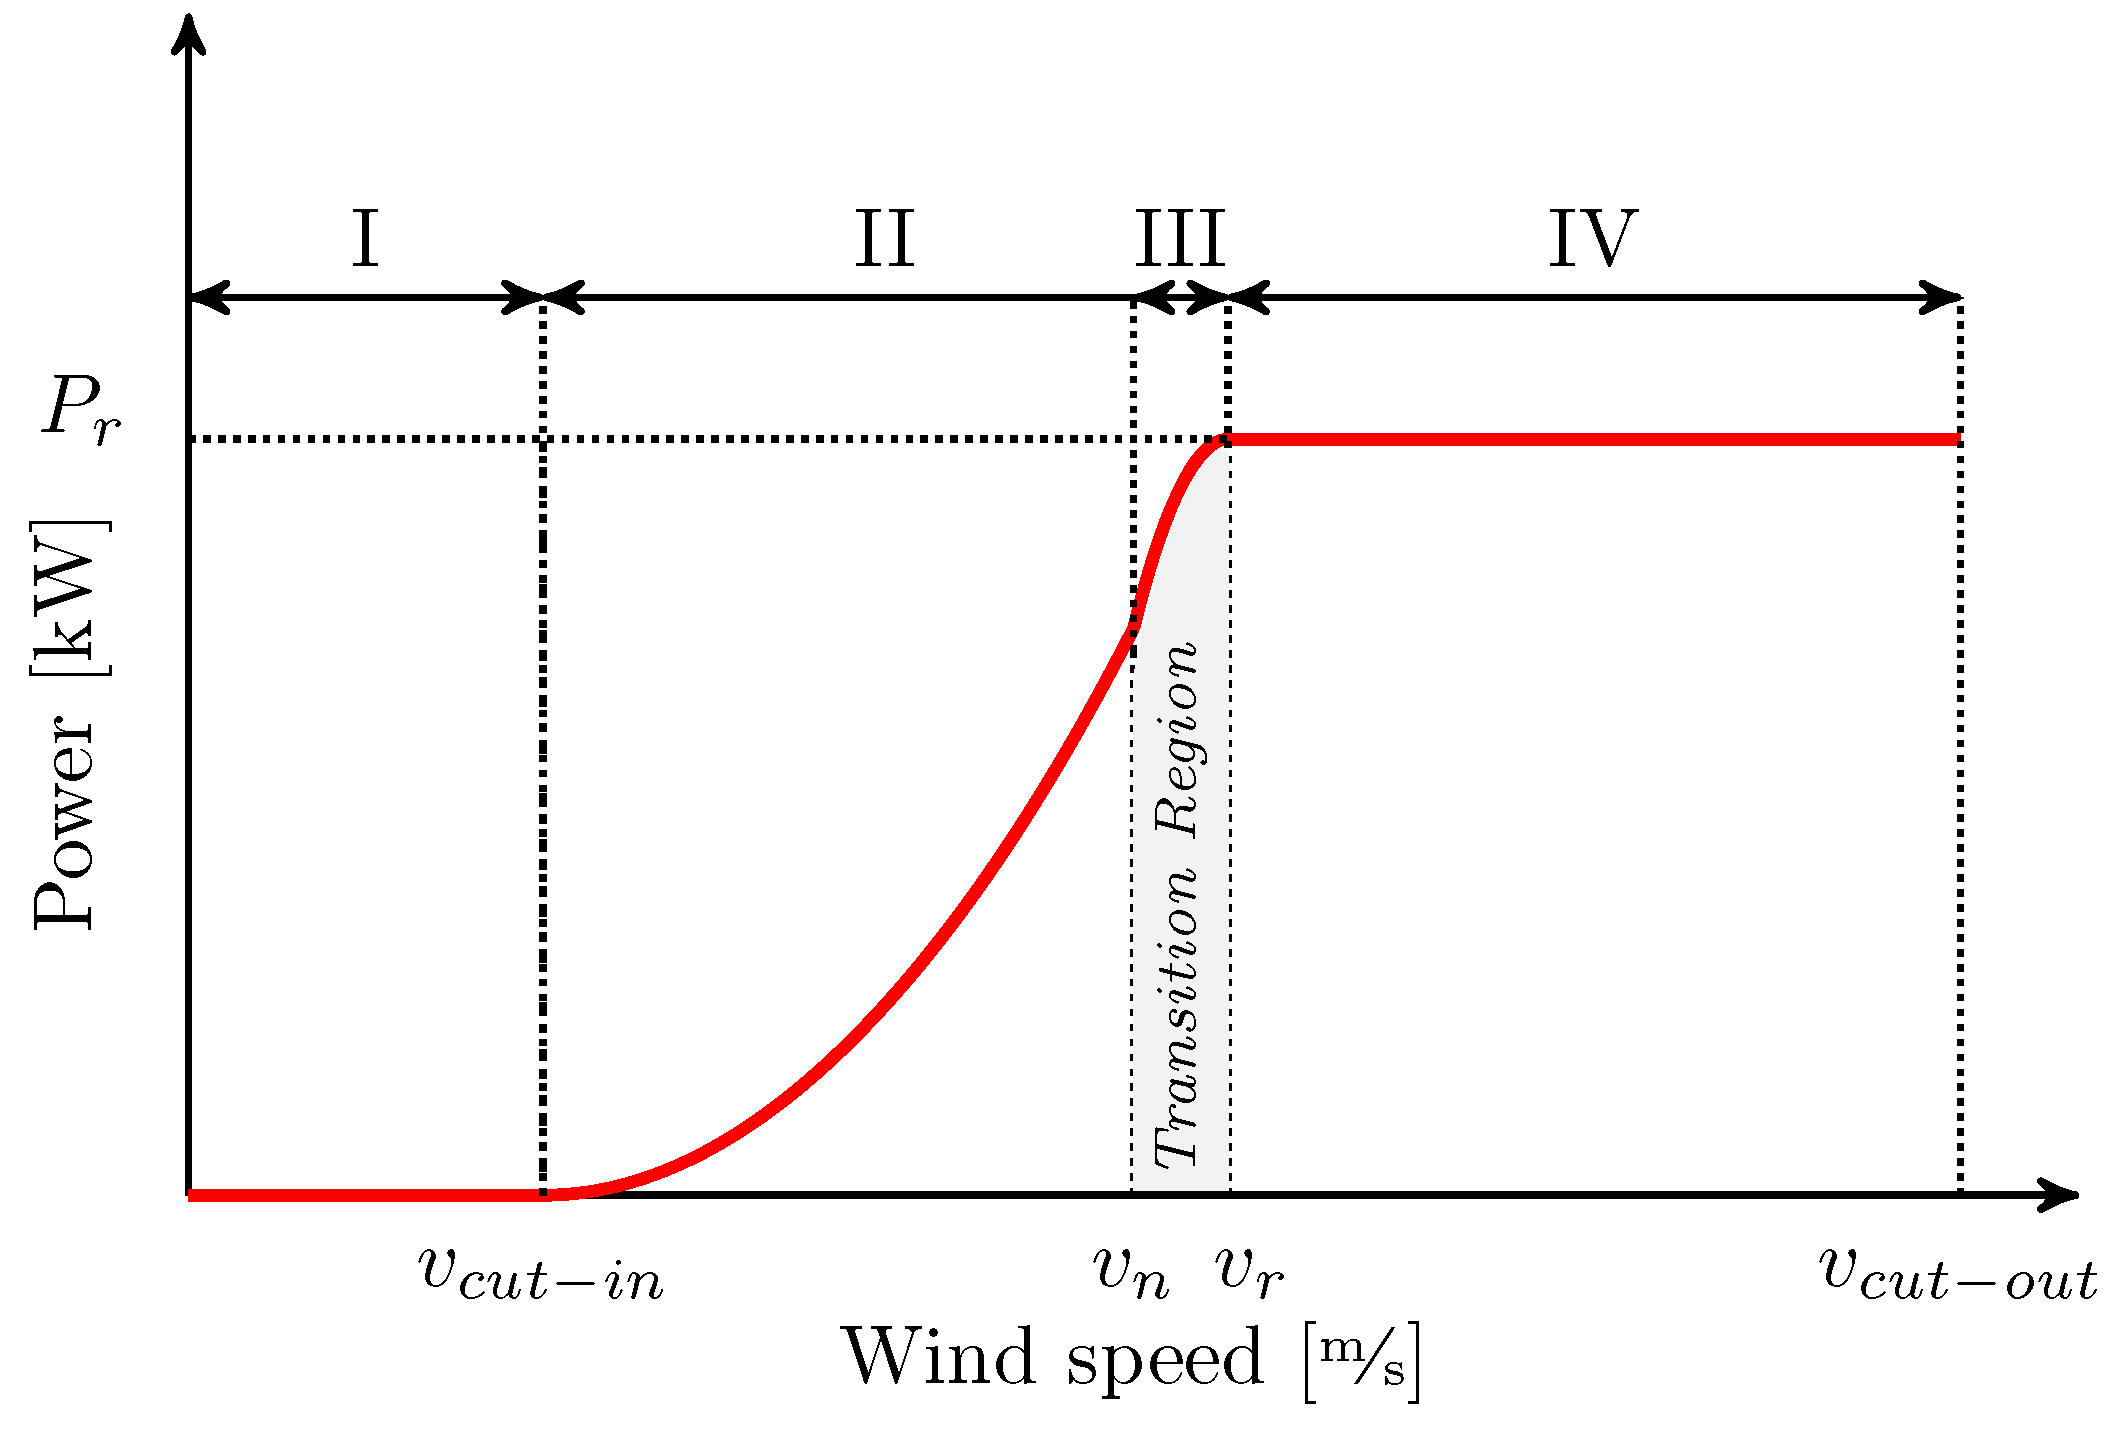
  • To maximise the energy capture in the low-speed region by maximising the aerodynamic efficiency of the wind turbine.
  • To obtain an identical response for all wind turbines in the whole wind speed range of region IV, i.e., coping with the different sensitivity of the aerodynamic power to the blade pitch angle for each wind speed.
For the uniform wind simulation, the ‘InflowWind’ module processes wind-inflow coupled with FAST. This module computes wind velocity components as a function of the input coordinate positions received from FAST glue code and internal time-varying parameters. The horizontal and vertical wind speeds are calculated, as follows [24]:
V h ( x , y , z ) = V h r e f z RefHt VShr + V h r e f HLinShr RefLength x sin ( Delta ) + y cos ( Delta ) + V h r e f VLinShr RefLength ( z RefHt ) + V G u s t V z ( x , y , z )   = VZ
where V h r e f is the horizontal wind speed (vectorial u + v ) at reference height, Delta is the wind direction, and VZ is the vertical wind speed (w component). VLinShr and HLinShr are vertical and horizontal linear wind-shear parameters, respectively. V G u s t is horizontal gust speed, and VShr is the vertical power-law wind-shear exponent. The Reference height ( RefHt ) and Reference length for linear horizontal and vertical shear ( RefLength ) values are set in the module’s input file. The power-law wind profile is used in order to define the wind profile by using the following equation, where PLexp is the Power law exponent.
u ( z ) = URef z RefHt PLexp
For wind speeds below the nominal value, the MPPT controller regulates the generator torque by tracking the reference electrical power. Thus, the optimum tip speed ratio is obtained by controlling the rotational speed. At the same time, the pitch control system keeps the pitch angle at its optimal value to maximise the aerodynamic efficiency. Figure 7 shows the step response of the wind turbines operating in low wind speeds. As can be observed, when the wind speed increases stepwise from 4 to 7 m/s, the generator speed is regulated, so that the optimum tip speed ratio is reached. Therefore, the power coefficient is maximised for all three turbines models, showing proper MPPT control.
In the transition zone, when the wind speed reaches the nominal value, the rotor speed is kept constant until the rated electrical power is generated. At wind speeds above the nominal, the speed controller keeps the generator speed at its rated value by pitching the blades based on two different control concepts, i.e., pitch-to-feather and pitch-to-stall. With pitch-to-feather, the pitch angle is increased to positive values, while pitch-to-stall decreases it to negative angles. Figure 8 compares the step response of the wind turbines to the wind variation at high wind speeds. As shown, when the wind speed increases stepwise from 14 to 17 m/s, the pitch angle is regulated in order to keep the rotational speed and thus the power output at the rated value. Additionally, an identical response of the generator speed and electrical power is obtained in all wind speeds in region IV through proper gain scheduling of the PI controllers in both operating modes, i.e., pitch-to-feather and pitch-to-stall.
When the wind turbine operates with the pitch-to-stall concept, smaller blade pithing is required to maintain the power at the rated value as compared to pitch-to-feather, as expected from the aerodynamic sensitivity analysis presented in Section 2.2. Therefore, the summed pitch manoeuvre, i.e., blade bearing movements, is reduced, and consequently, higher lifetimes of the pitch mechanism can be obtained by limiting the pitch activity. Moreover, in the stall mode, the aerodynamic power is less sensitive to the pitch angle, which increases the controllability in the high wind zone. The more stable aerodynamic response in the pitch-to-stall mode is an advantage for the control system, especially when the trade-off between the rapid changes in pitch angle on the one hand and the abrupt power increase on the other hand is needed, i.e., the power transient caused by a sudden increase of wind speed. The most significant factor in the power limiting strategy of the pitch control system is its fast response to sudden variations in the aerodynamic torque generated by the wind. The rotational speed of a wind turbine can be regulated very quickly by pitching the blades to feather with a fast pitch rate [25]. However, this requires a pitch actuator with a high pitch rate capacity. Additionally, the fatigue damage rate of the pitch bearings increases when increasing the pitch rate [26].

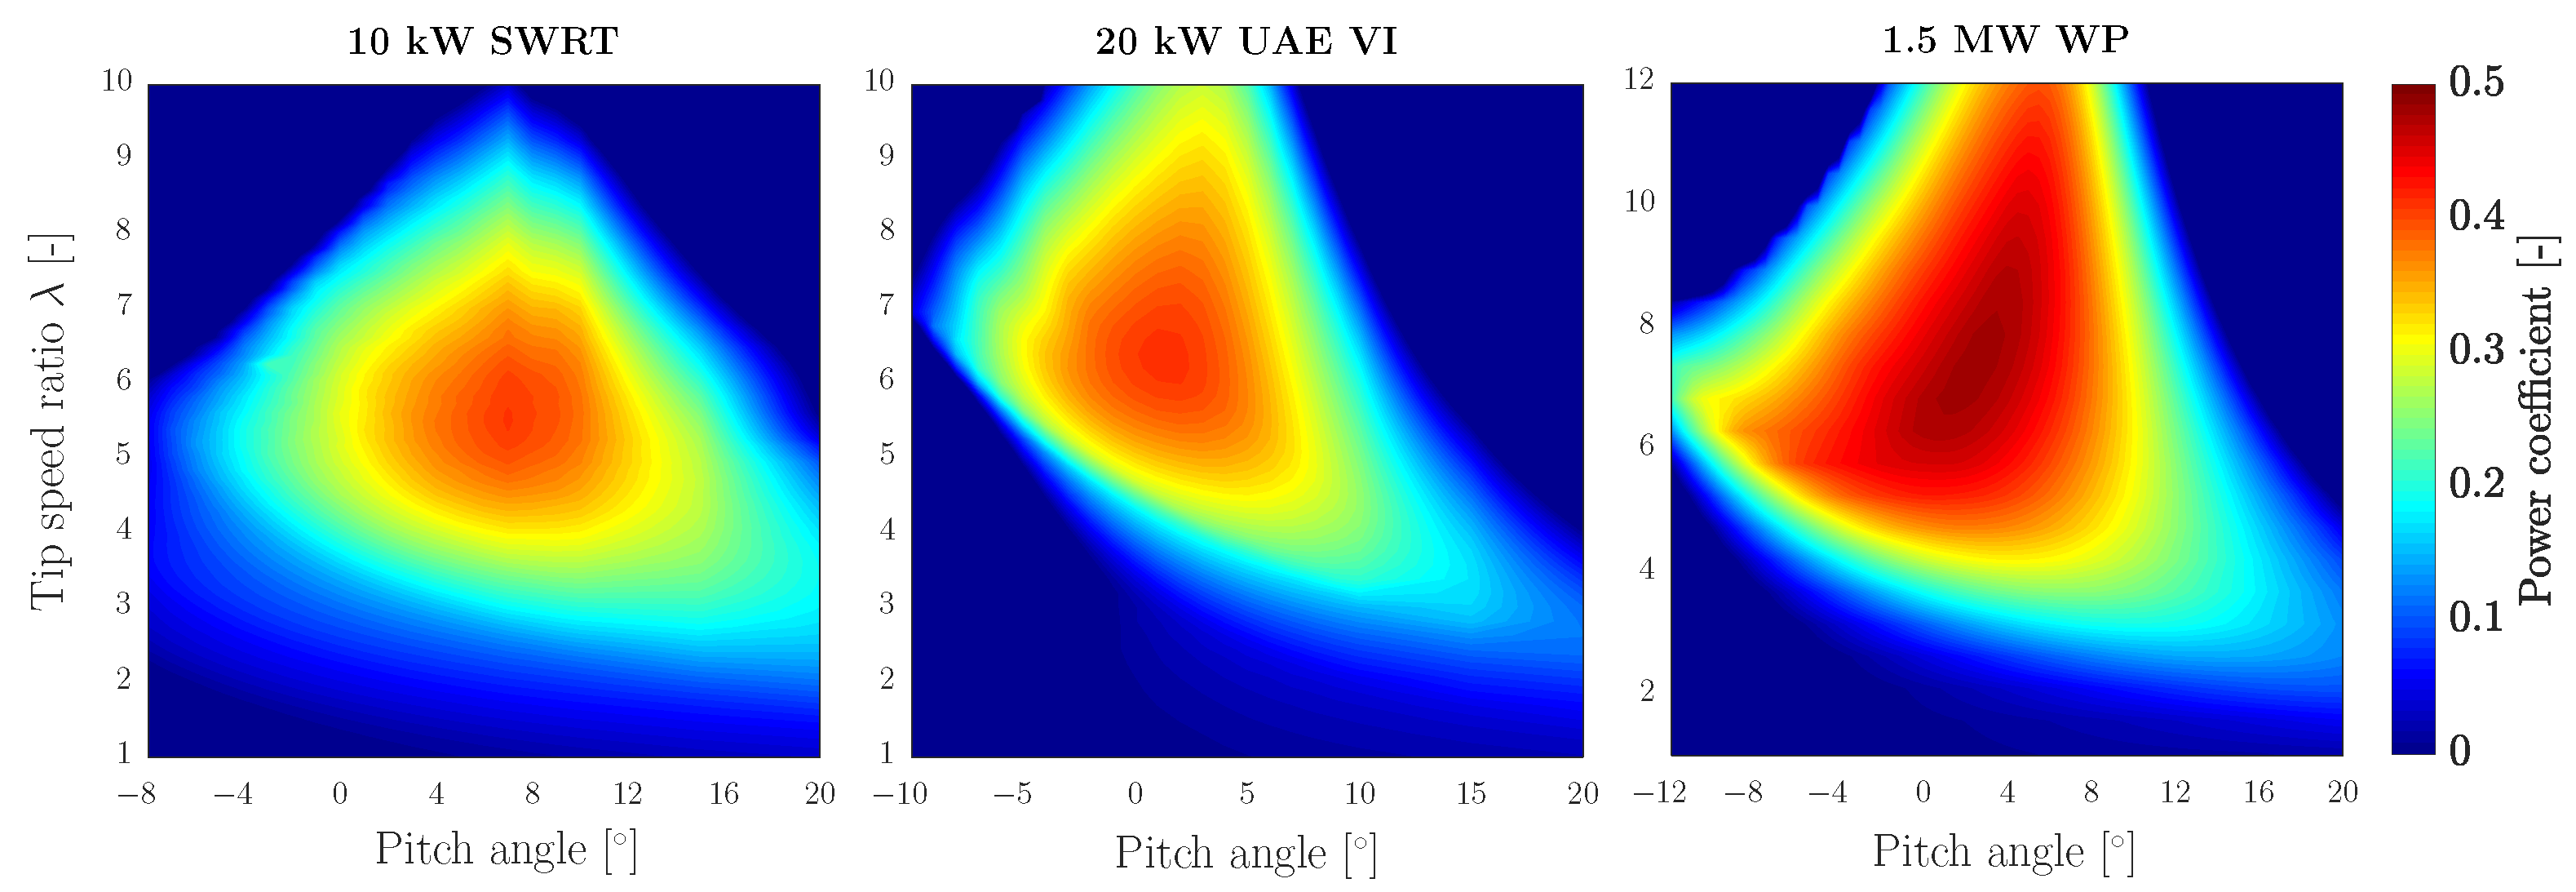
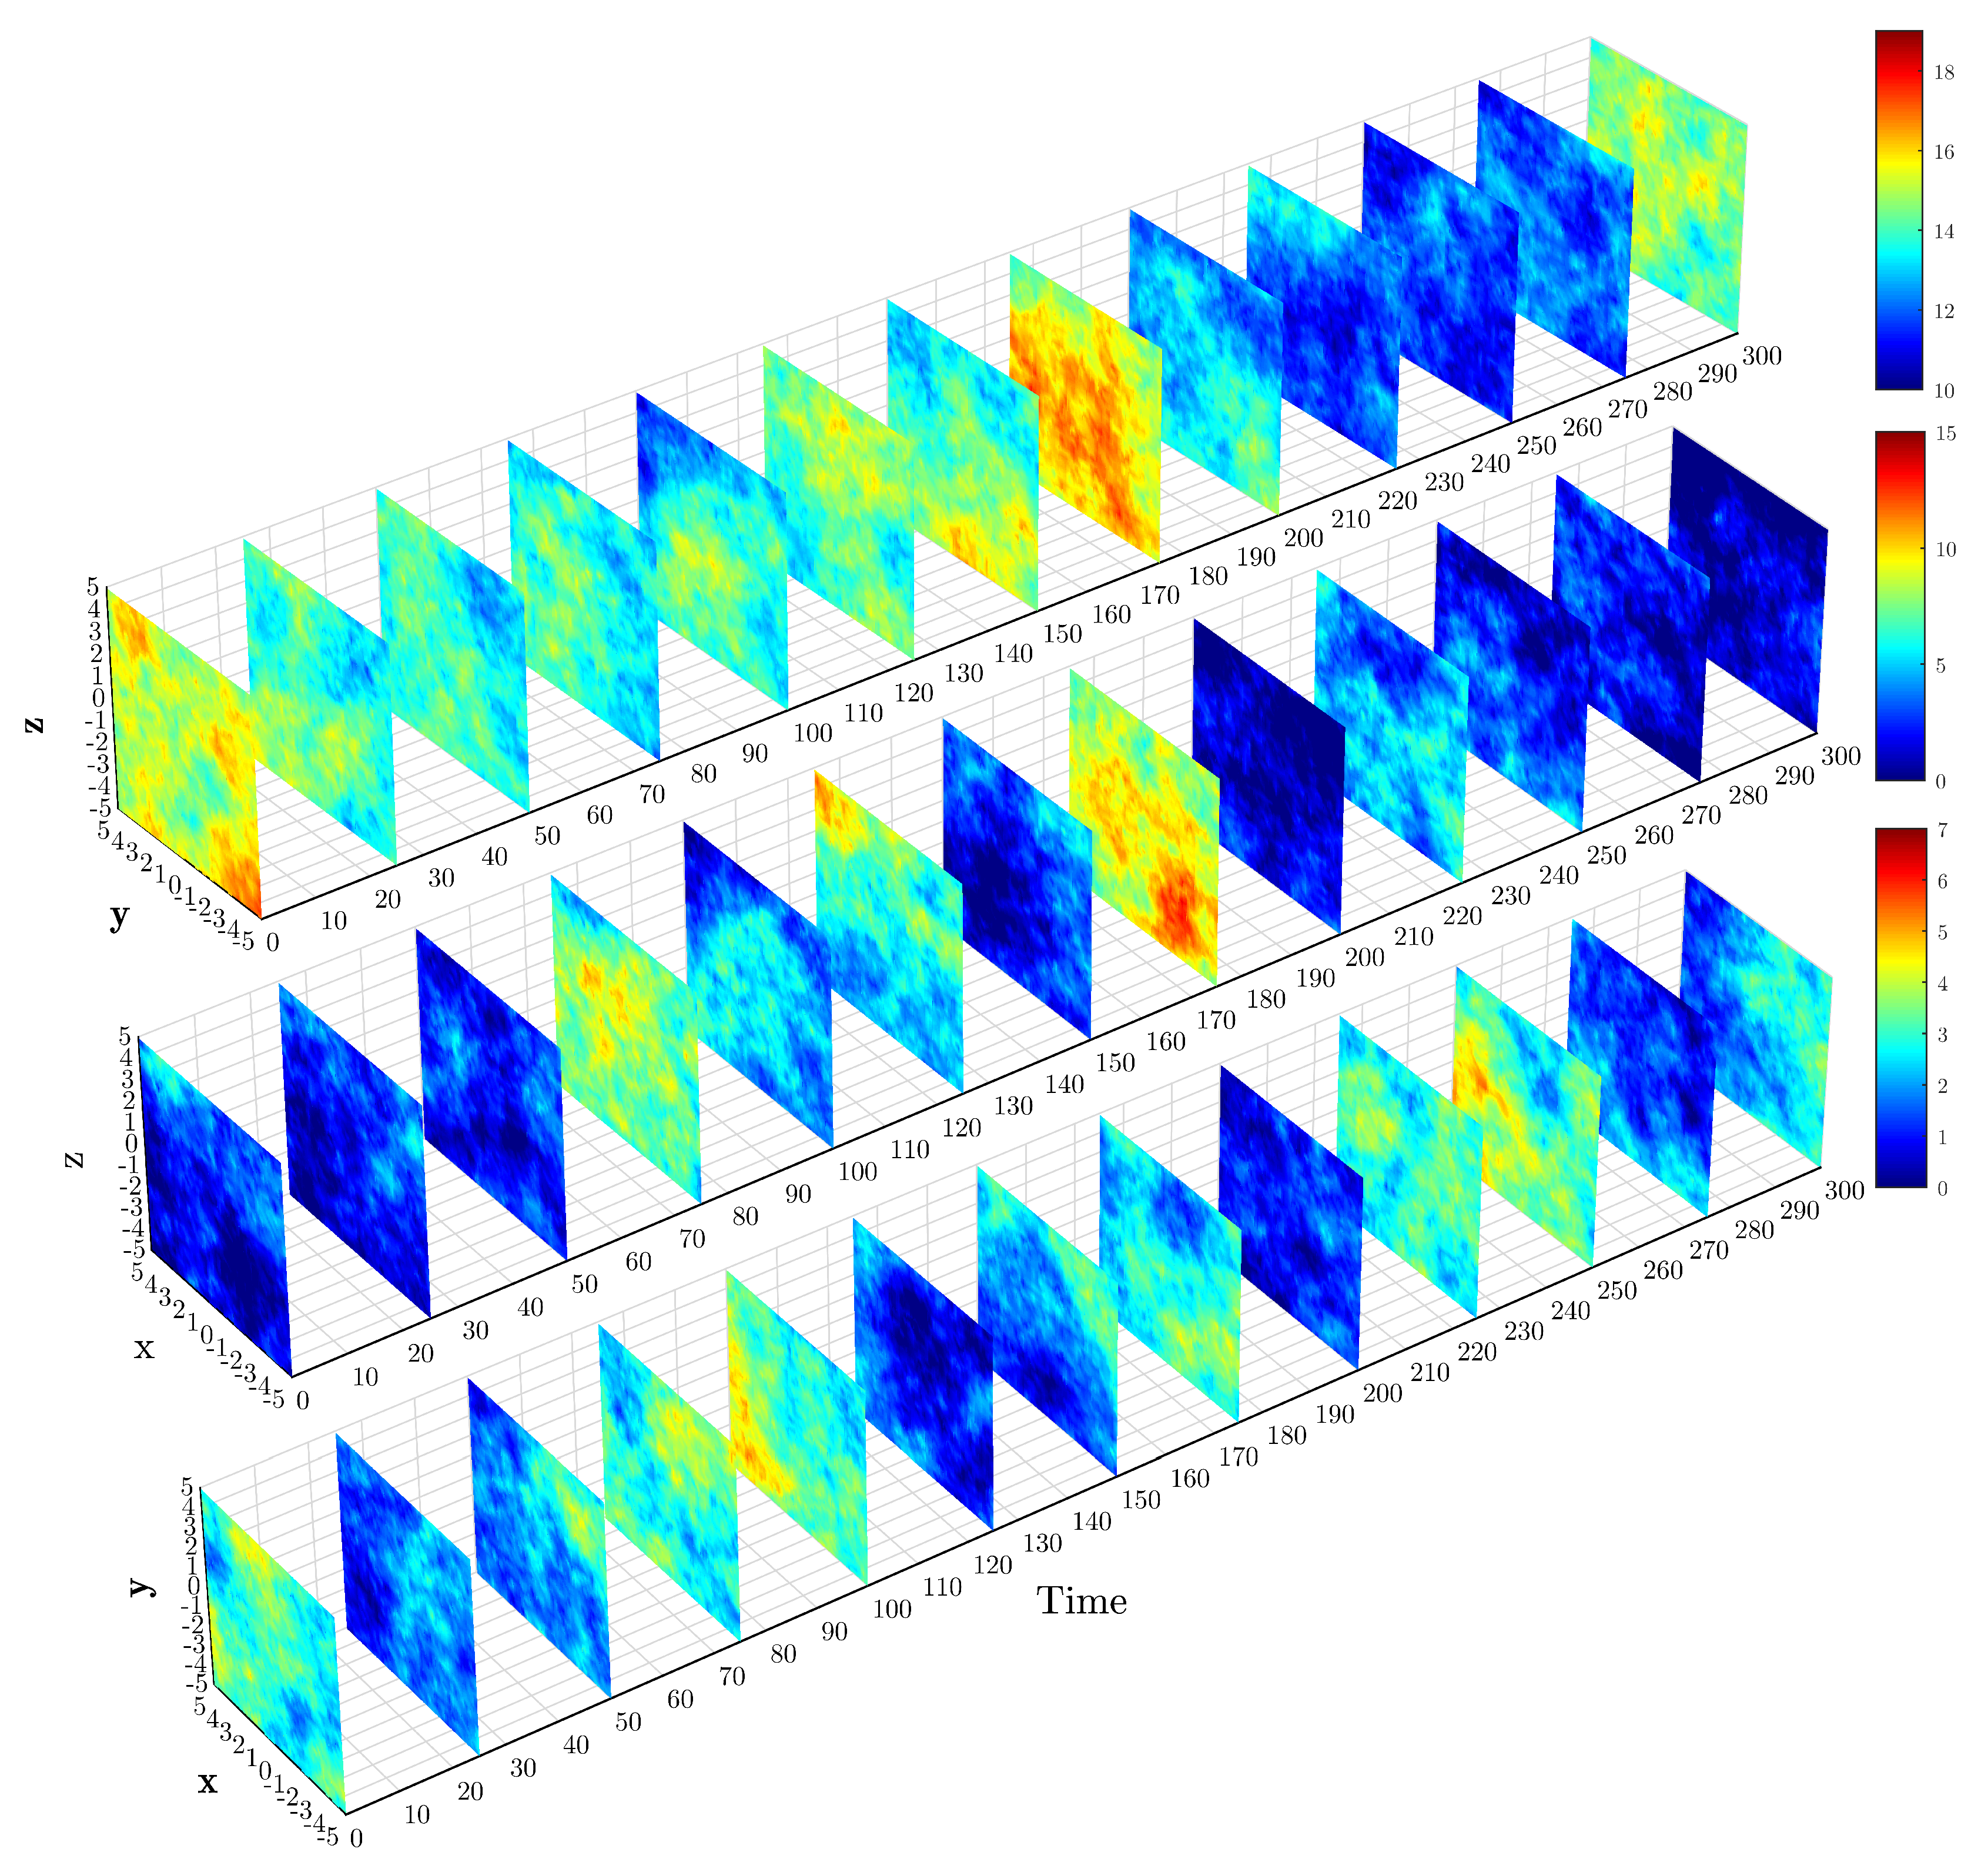
3.2. Turbulent Wind Field Simulation

The numerical simulation of the wind field is an essential part of the horizontal axis wind turbine structural analysis, due to the nonlinearity of atmospheric turbulence and its impact on the aerodynamic loads of wind turbines. The structure of the wind turbine experiences higher loads caused by the atmospheric turbulence encountered by the rotor blades. Therefore, for the dynamic aeroelastic simulation of a wind turbine, the inflow wind should be simulated, such that it includes the specific characteristics of the inflow wind that have a significant impact on the dynamic response of wind turbine. For the numerical simulation of a full-field flow, the TurbSim inflow stochastic turbulence code is used [27]. TurbSim includes many of the important fluid dynamic features that have an impact on the aeroelastic response of wind turbines. The TurbSim simulator uses a modified version of the Sandia method, which is a method for numerically simulating a three-dimensional field of turbulent wind speed, specifically for the structural analysis of horizontal axis wind turbines [28].
In TurbSim, the rotor hub is assumed to be centred on a grid of points that each represent the three-dimensional wind speed. For each wind turbine, the grid size is considered large enough to cover the whole rotor, such that no part of the rotor blade lies outside the grid, even during the wind turbine displacement. The NWTCUP spectral model is used to simulate the turbulent wind, which generates a turbulent inflow that characterises the highly turbulent conditions. This model generates default spatial coherence parameters based on experimental data performed at the National Renewable Energy Laboratory’s National Wind Technology Center (NWTC) [29]. The NWTCUP spectrum for stable flows are defined as [27]
S K ( f ) = i = 1 N u m P e a k s K p i , K S K , S M O O T H ( F i , K f )
where N u m P e a k s K is equal to 2 for all wind components. p i , K and F i , K are scaling factors, which are functions of the gradient Richardson number. The spectrum is characterised by adding scaled versions of the Risø smooth-terrain spectral model (SMOOTH), which is defined by the following equations:
S K ( f ) = U S t a r 2 s 1 , K z u ¯ ϕ M ϕ E ϕ M 2 / 3 1 + s 2 , K f z u ¯ ϕ M 5 / 3
where f is the cyclic frequency, U S t a r is the friction velocity input parameter, u ¯ is the mean wind speed at height z, and ϕ E and ϕ M are functions of the stability parameter, i.e., the gradient Richardson number. s 1 and s 2 are defined as
s 1 , K , s 2 , K = 79.0 , 263.0 K = u 13.0 , 32.0 K = v 3.5 , 8.6 K = w
For unstable flows, the NWTCUP model modifies the SMOOTH-model as:
S K ( f ) = p 1 , K S K , l o w , S M O O T H ( F 1 , K f ) + p 2 , K S K , h i g h , S M O O T H ( F 2 , K f )
where P 1 , K , P 2 , K , F 1 , K , and F 2 , K are the scaling factors that are derived from spectra calculated by using velocity measurements.
The turbulent wind fields are generated with a high turbulence intensity, a vertical mean flow (uptilt) angle of 8 ° , and a horizontal mean flow (skew) angle of 15 ° . The mean wind speeds are selected, so that the wind profiles cover both region II, where torque control is used for MPPT and pitch control is inactive, and IV, where both torque and pitch control are active to limit the power and rotor speed. Figure 9 illustrates the spatial wind field components in streamwise, crosswise, and vertical direction in different time slots for a simulation of 300 s with an average speed of 14 m/s. Table 2 provides the wind field simulation parameters.

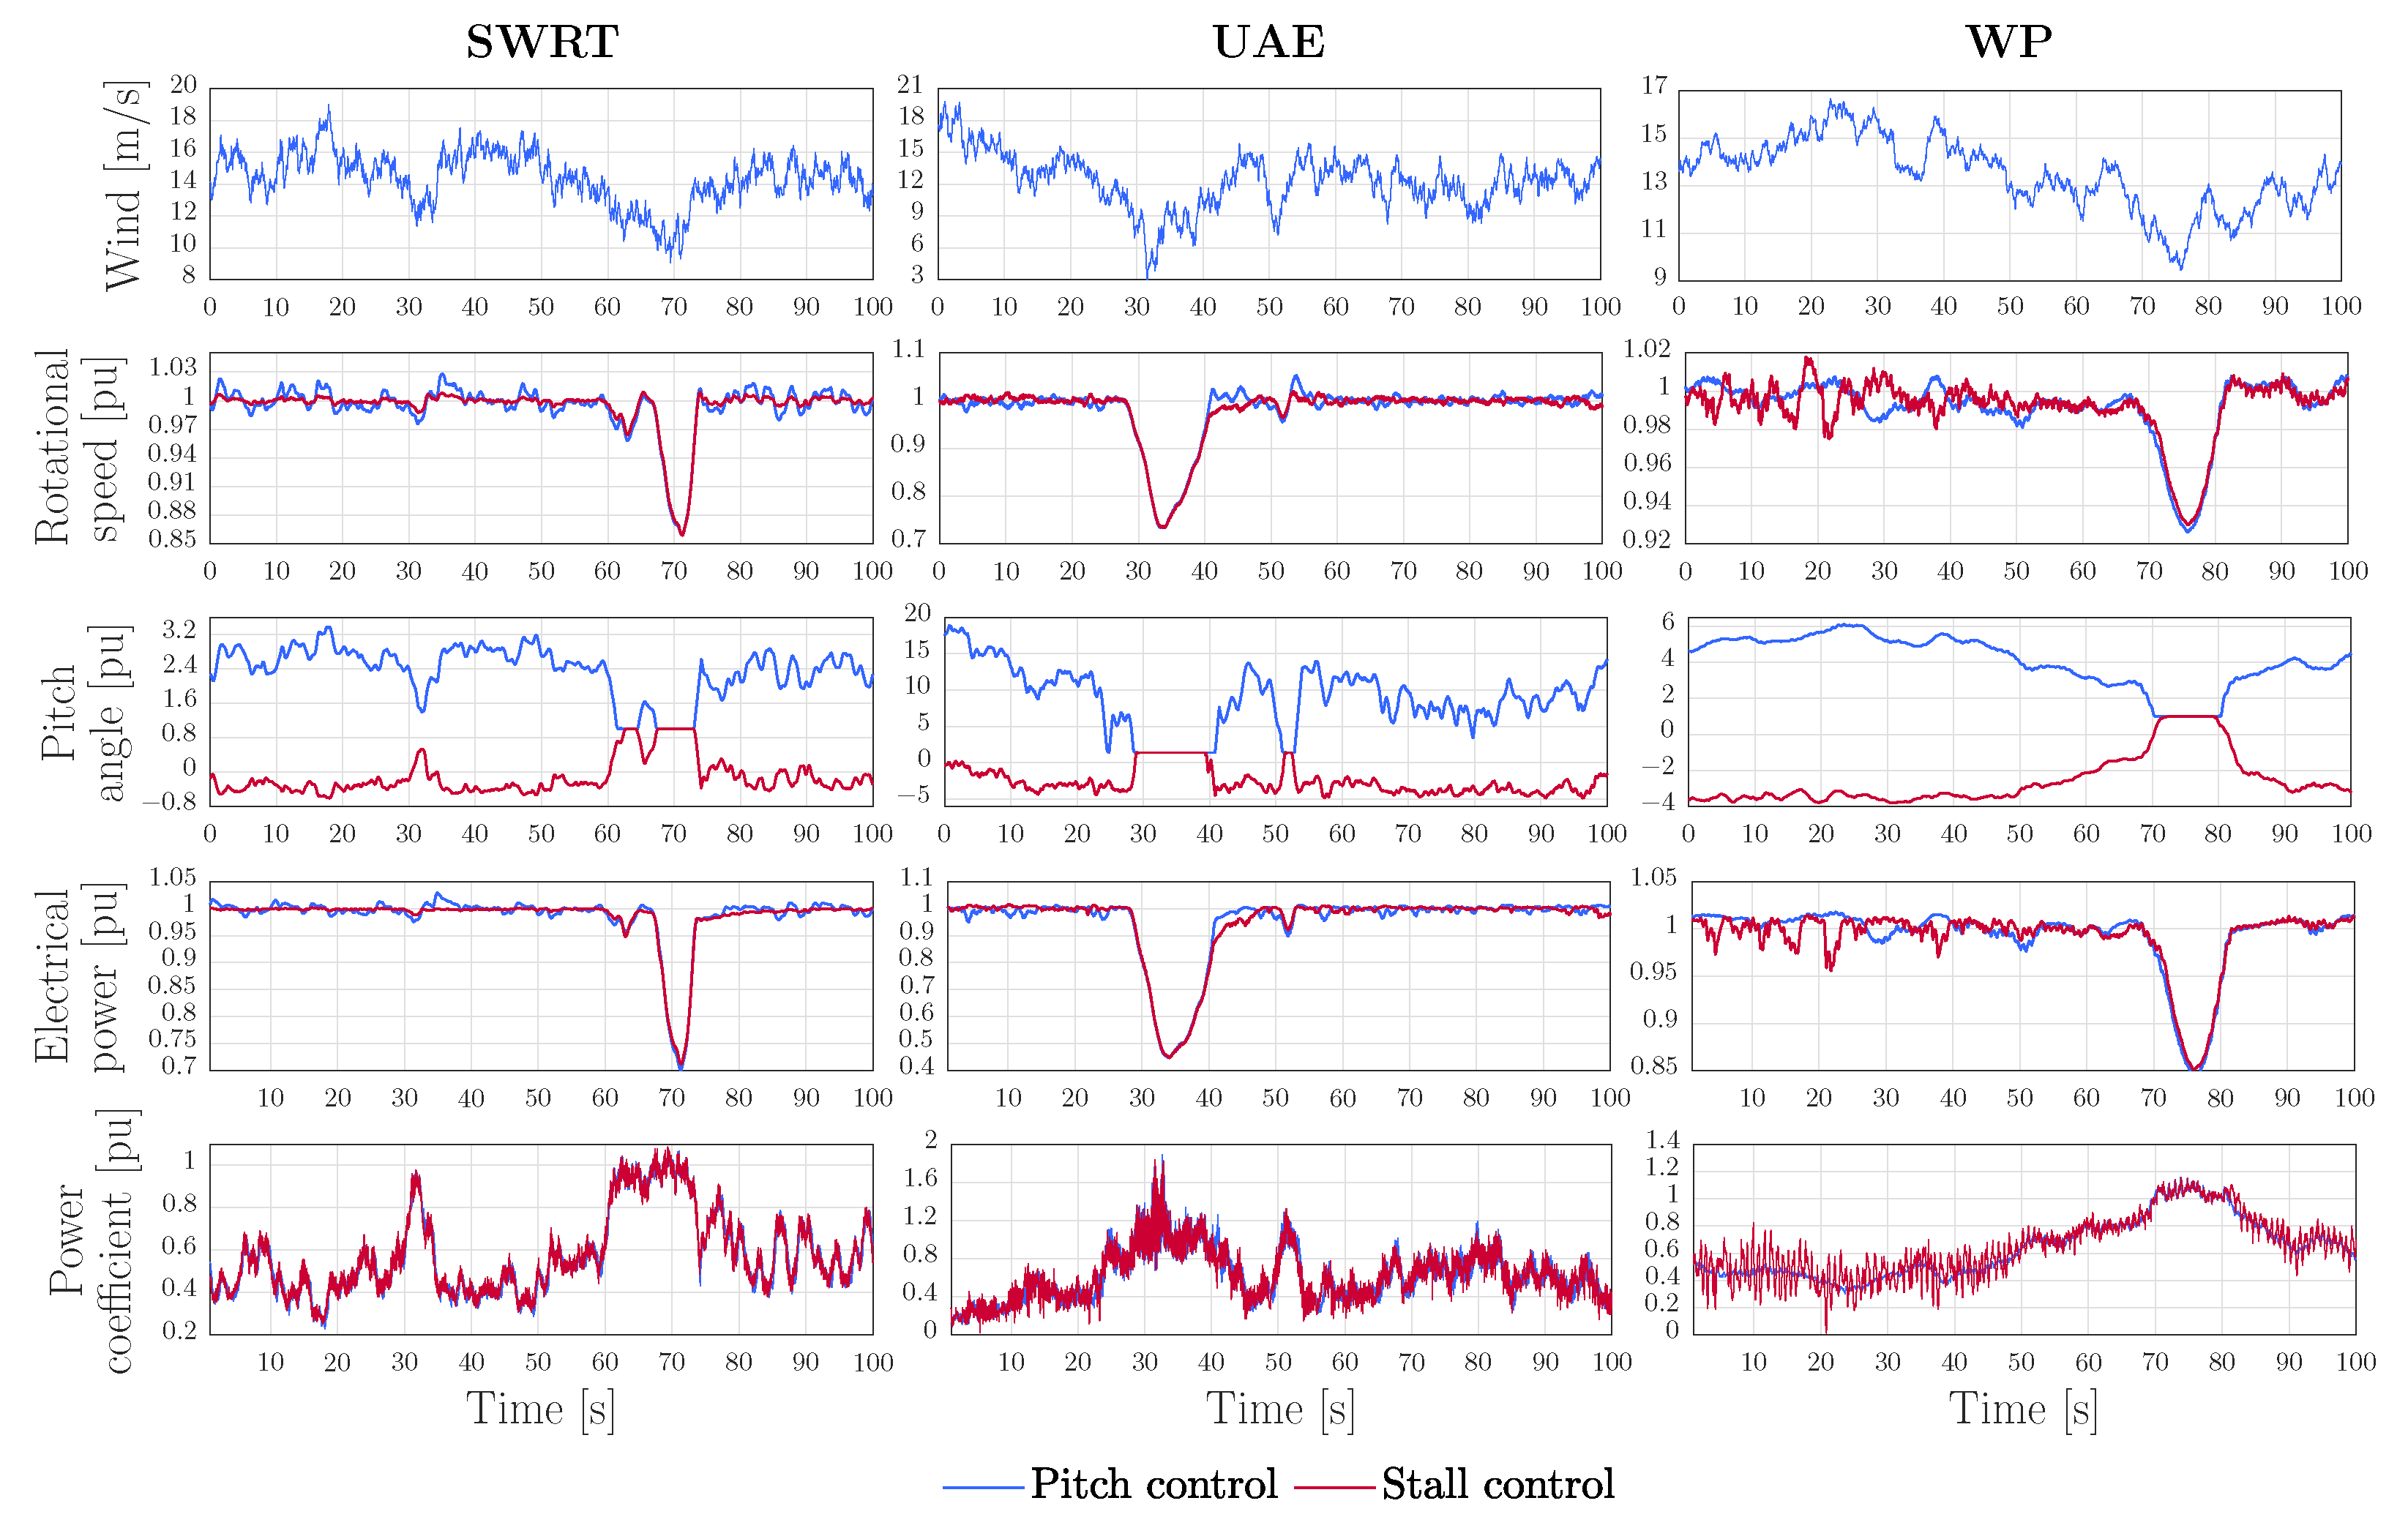
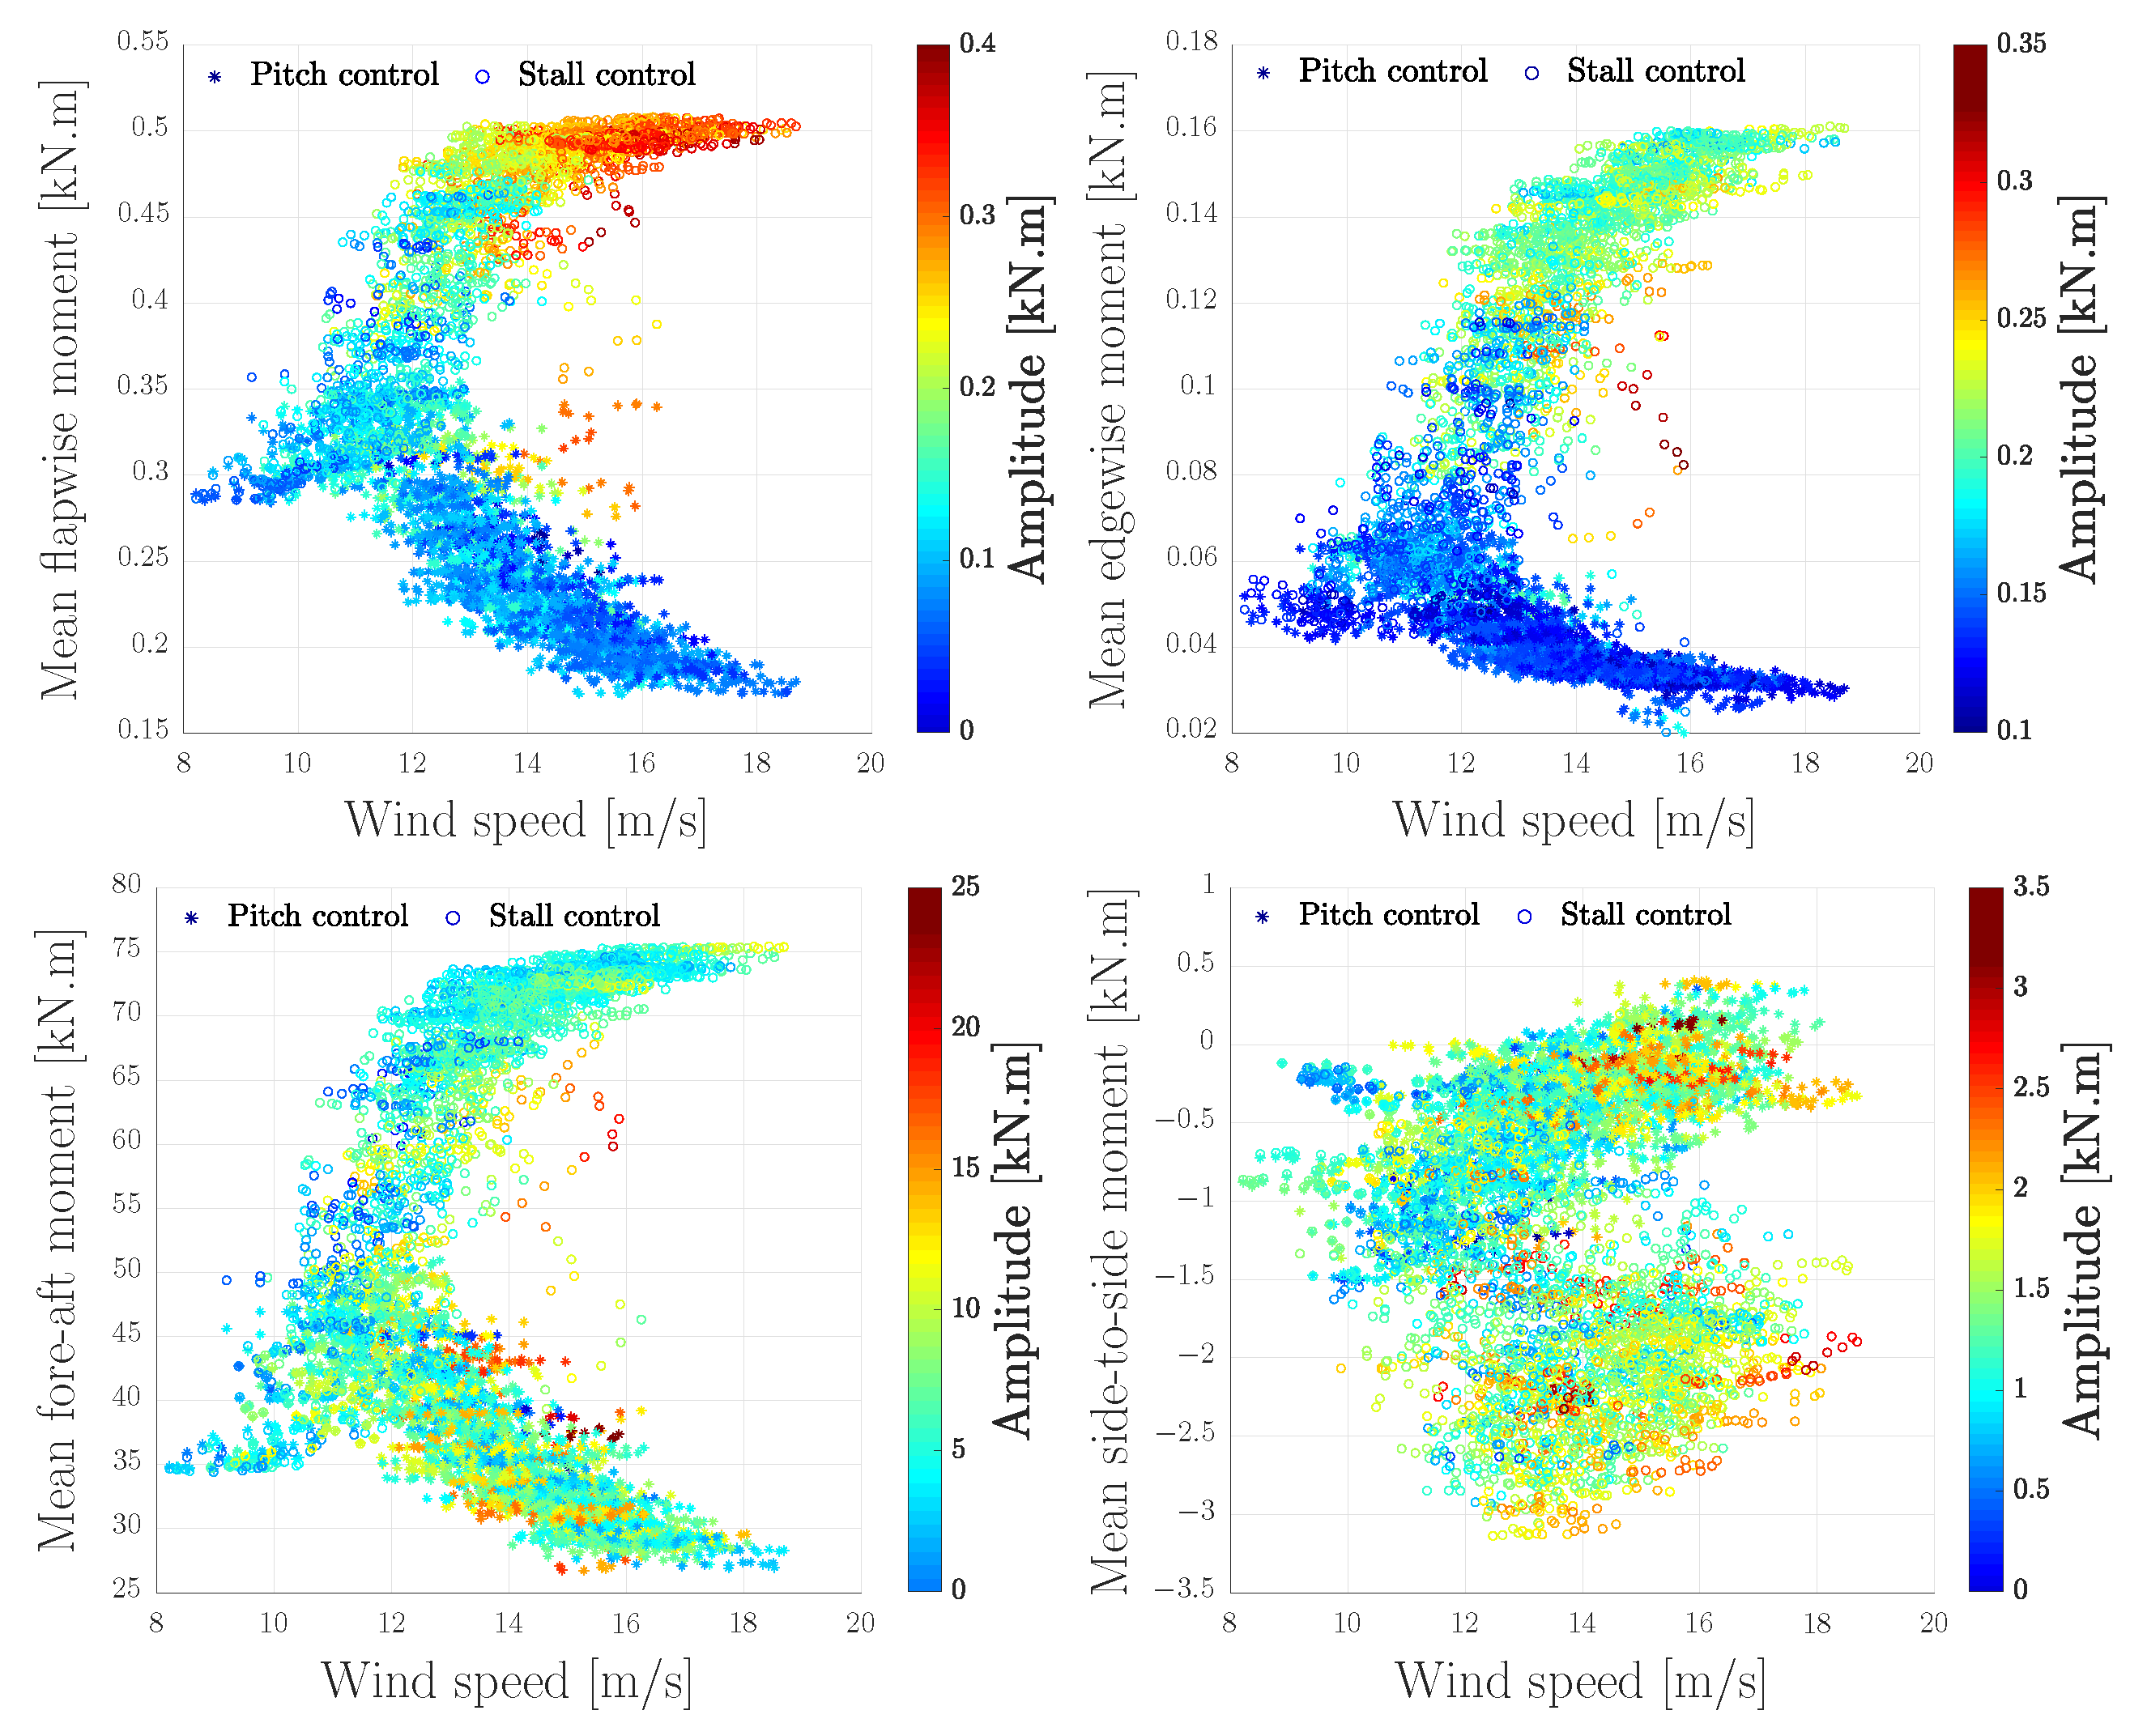
3.3. Performance in Turbulent Wind

The dynamic performance of the wind turbines is now analysed for a three-dimensional turbulent wind field to test the control system in more realistic operating conditions. Figure 10 compares the performance of the turbines operating with the pitch-to-feather and pitch-to-stall strategies in turbulent winds. The simulation results show that the electrical power and rotor speed are regulated at their rated values with a limited error. The control transitions between region II and IV are smooth without transients. Despite the satisfactory performance of the control system in the whole operating region, wind turbines have different dynamic responses under pitch-to-stall and pitch-to-feather control. The first column shows the SWRT turbine operating as a pitch regulated turbine as compared with the same turbine operating as a stall controlled turbine in turbulent wind. As can be observed, the power is well-maintained within 3% of its rated value with pitch-to-feather. However, the fluctuations in the rotor speed and electrical power are considerably smaller when using pitch-to-stall control. As expected from the aerodynamic sensitivity analysis, the aerodynamic power is less sensitive to wind speed variations in region IV. Therefore, the fluctuations in generator speed and the power transients are reduced when using pitch-to-stall control. To illustrate, when the wind turbine operates at wind speeds fluctuating between 12 to 19 m/s (Figure 10, time ≈ 10–40 s) the power generator is well-preserved within 1% of its rated value. Moreover, smoother control with much more moderate pitch movement is obtained due to the lower aerodynamic sensitivity and, thus, smaller pitch action in pitch-to-stall mode. The second column of Figure 10 illustrates the dynamic performance of the two-bladed UAE turbine with stall-regulated blade design. Additionally, here, the rotor speed and power output are regulated well around the nominal value with a limited error. However, pitch-to-stall control presents smaller fluctuations in turbulent wind conditions. As can be observed, when the wind turbine operates around the transition region between RNum2 and RNum4, with a sudden change in wind speed (time ≈ 40–60 s), a smaller peak power is obtained above the rated for pitch-to-stall control due to the lower sensitivity and smaller pitch actions in the stall mode. The third column of Figure 10 illustrates the performance of the WP turbine under turbulent wind conditions. As shown, pitch-to-stall control does not have the reduction effect on the fluctuations of rotational speed and power output. This behaviour of the WP turbine is due to its pitch-regulated blade design that tends to stall more slowly compared to the SWRT and UAE wind turbines with untwisted and stall-regulated blade designs.The corresponding time histories of tower and blade moments in turbulent wind are represented in Figure 11.

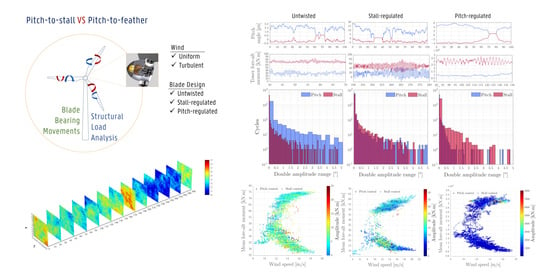
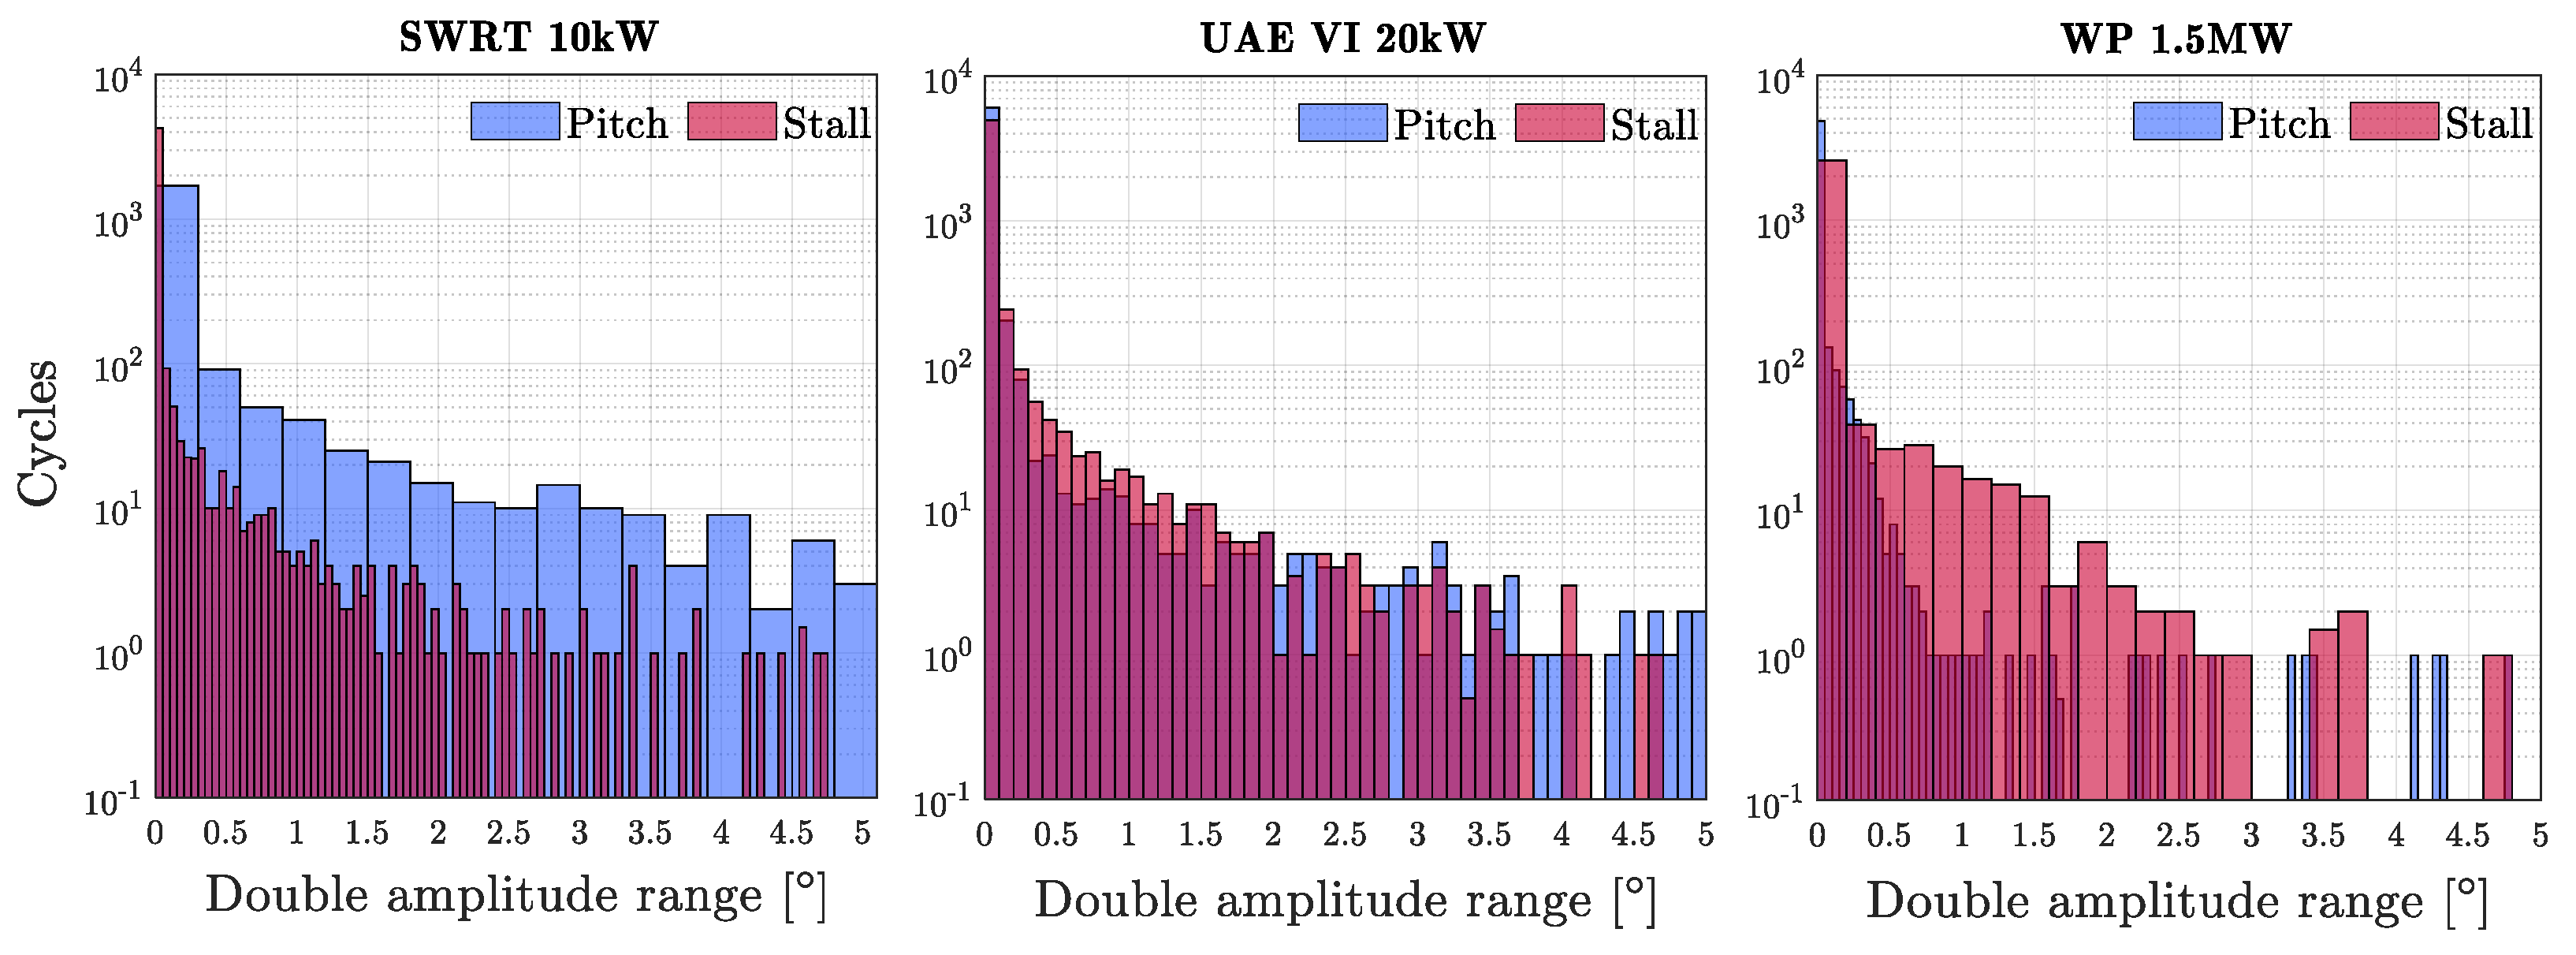
3.4. Control Impact on the Pitch Mechanism

According to [8], the pitch system accounts for one of the most critical subassemblies in terms of failure rates and downtime. Pitch oscillations with an amplitude of a few degrees increase the risk of surface damage in the rolling contacts of the blade bearings [10]. In a rolling bearing, the rolling elements are separated from the raceway by a thin film of lubricant that was formed by the nearly constant rotation of bearing under constant or almost constant loads and speeds [9]. In the blade bearings, the blade pitch manoeuvres with relatively small amplitudes often do not build up the lubricant film, which gives rise to an unlubricated contact between the rolling elements and the bearing raceway [30]. Therefore, small oscillating movements of blade bearings must be minimised to increase the reliability of the pitch mechanism. Cycle analysis is performed in order to compare the pitch movements of the wind turbines operating with the two investigated control strategies, i.e., pitch-to-stall and pitch-to-feather.
The wind turbines are operated in the full operating region, i.e., from rated wind speed v r to cut-out wind speed v c u t o u t . The wind fields are generated so that the wind speed sweeps all wind speeds in region IV with a turbulence intensity of 20%. The simulations have been run during 660 s, and the corresponding blade pitch movements are monitored. The rainflow method, as implemented in MATLAB, is used to count the cycles for the pitch time history according to the ASTM E 1049 standard. Figure 12 illustrates the results of the cycle counting of small blade pitch oscillations. For the SWRT wind turbine with untwisted blades, the summed pitch movement is reduced from 1607 ° in pitch-to-feather control to 746 ° in pitch-to-stall control. However, a higher number of pitch movements with small oscillations are observed in pitch-to-stall control, especially in the range below 0.3 ° . This behaviour can be explained by the fact that, in the stall condition and for wind speeds between 15 and 25 m/s, less pitch variation (≈ 4 ° [−7–−3]) is required to keep the power at the rated value (Figure 5). Therefore, the frequent small pitch variations are expected to limit the rotational speed. Additionally, pitch-to-stall control increases the cycles with an amplitude smaller than 1.5 ° for the UAE wind turbine, though a higher number of pitch movements are observed in the range between 1.5° and 5 ° . Additionally, here, the pitch-to-stall control reduces the summed pitch movement to 15,096 ° , as compared to 1655 ° in pitch-to-feather control. The explanation lies in the way the boundary layer separates from the surface of the blades. SWRT and UAE wind turbines tend to stall more abruptly because of their geometry, where the separation starts around the leading edge of the aerofoil. Therefore, the entire boundary layer may detach almost simultaneously with a drastic decrease in the lift coefficient. The pitch system behaviour in the WP turbine is in contrast with previous models. Due to the pitch-regulated design of the blades, i.e., the airfoils’ geometry with a more rounded leading edge, the lift coefficient reduced with a gentle slope, which can also be observed in. Therefore, the blades remain in soft stall conditions, where the fine adjustment of the blades is less required.

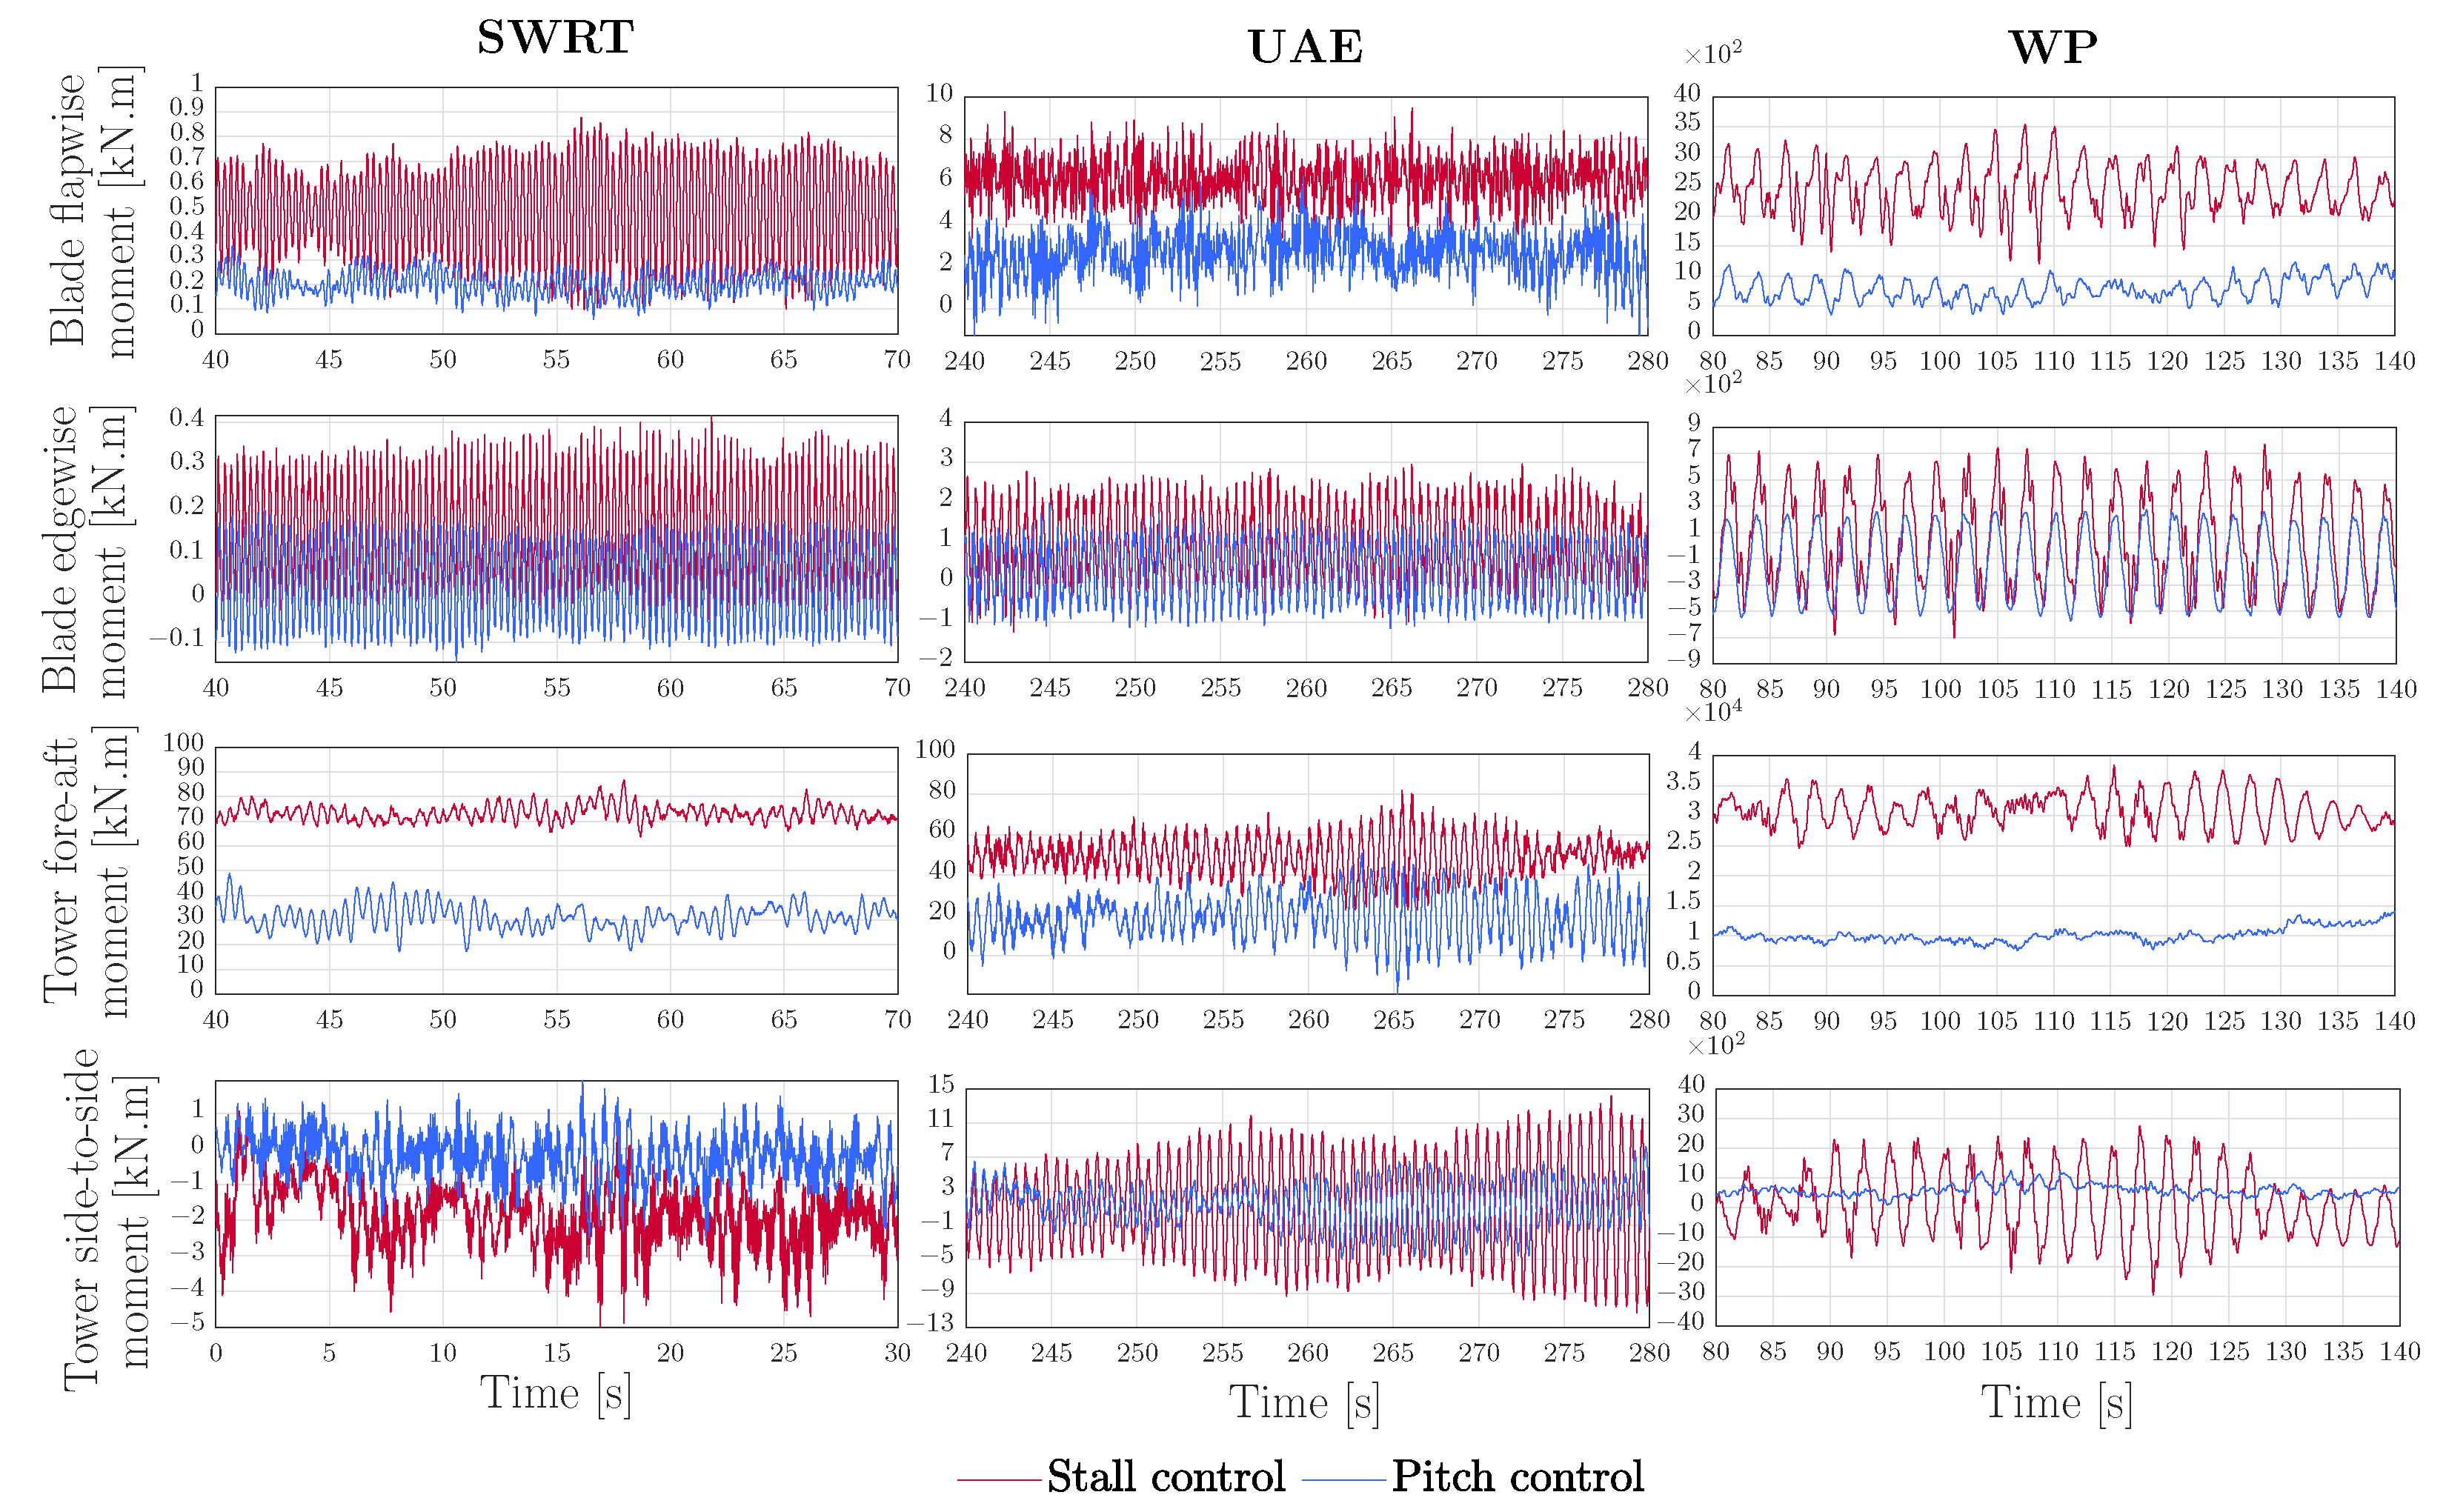
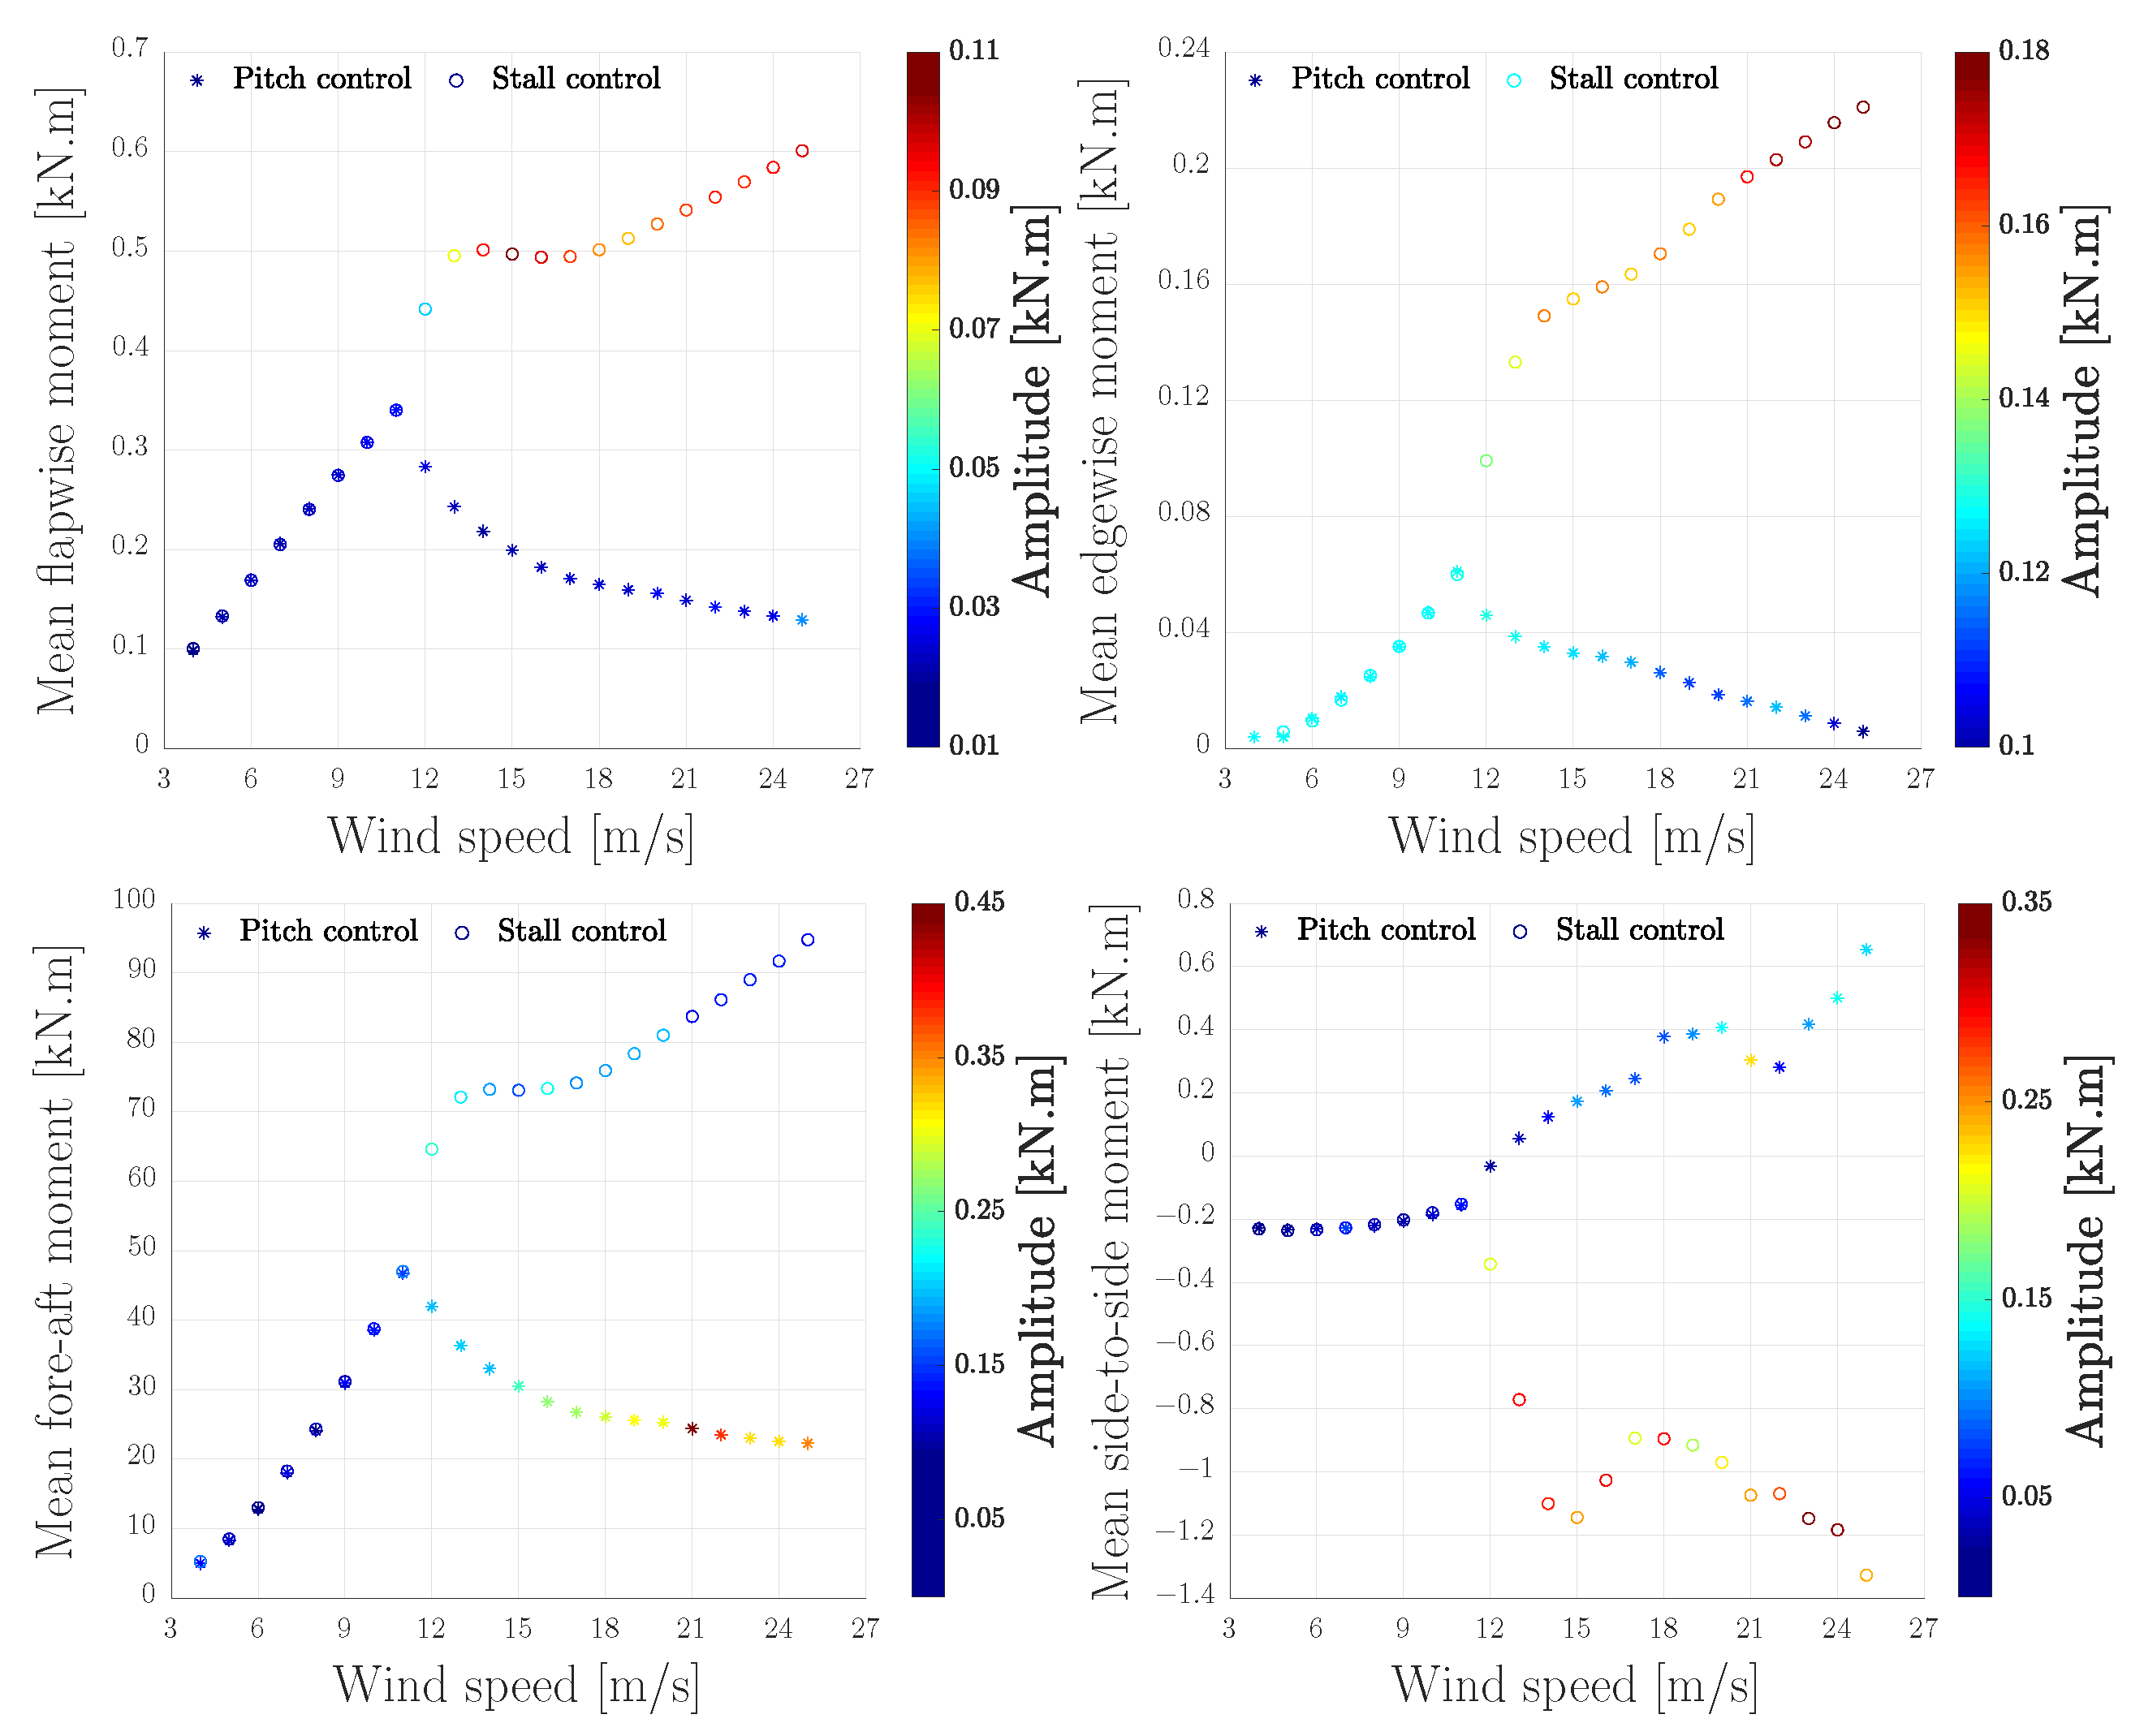
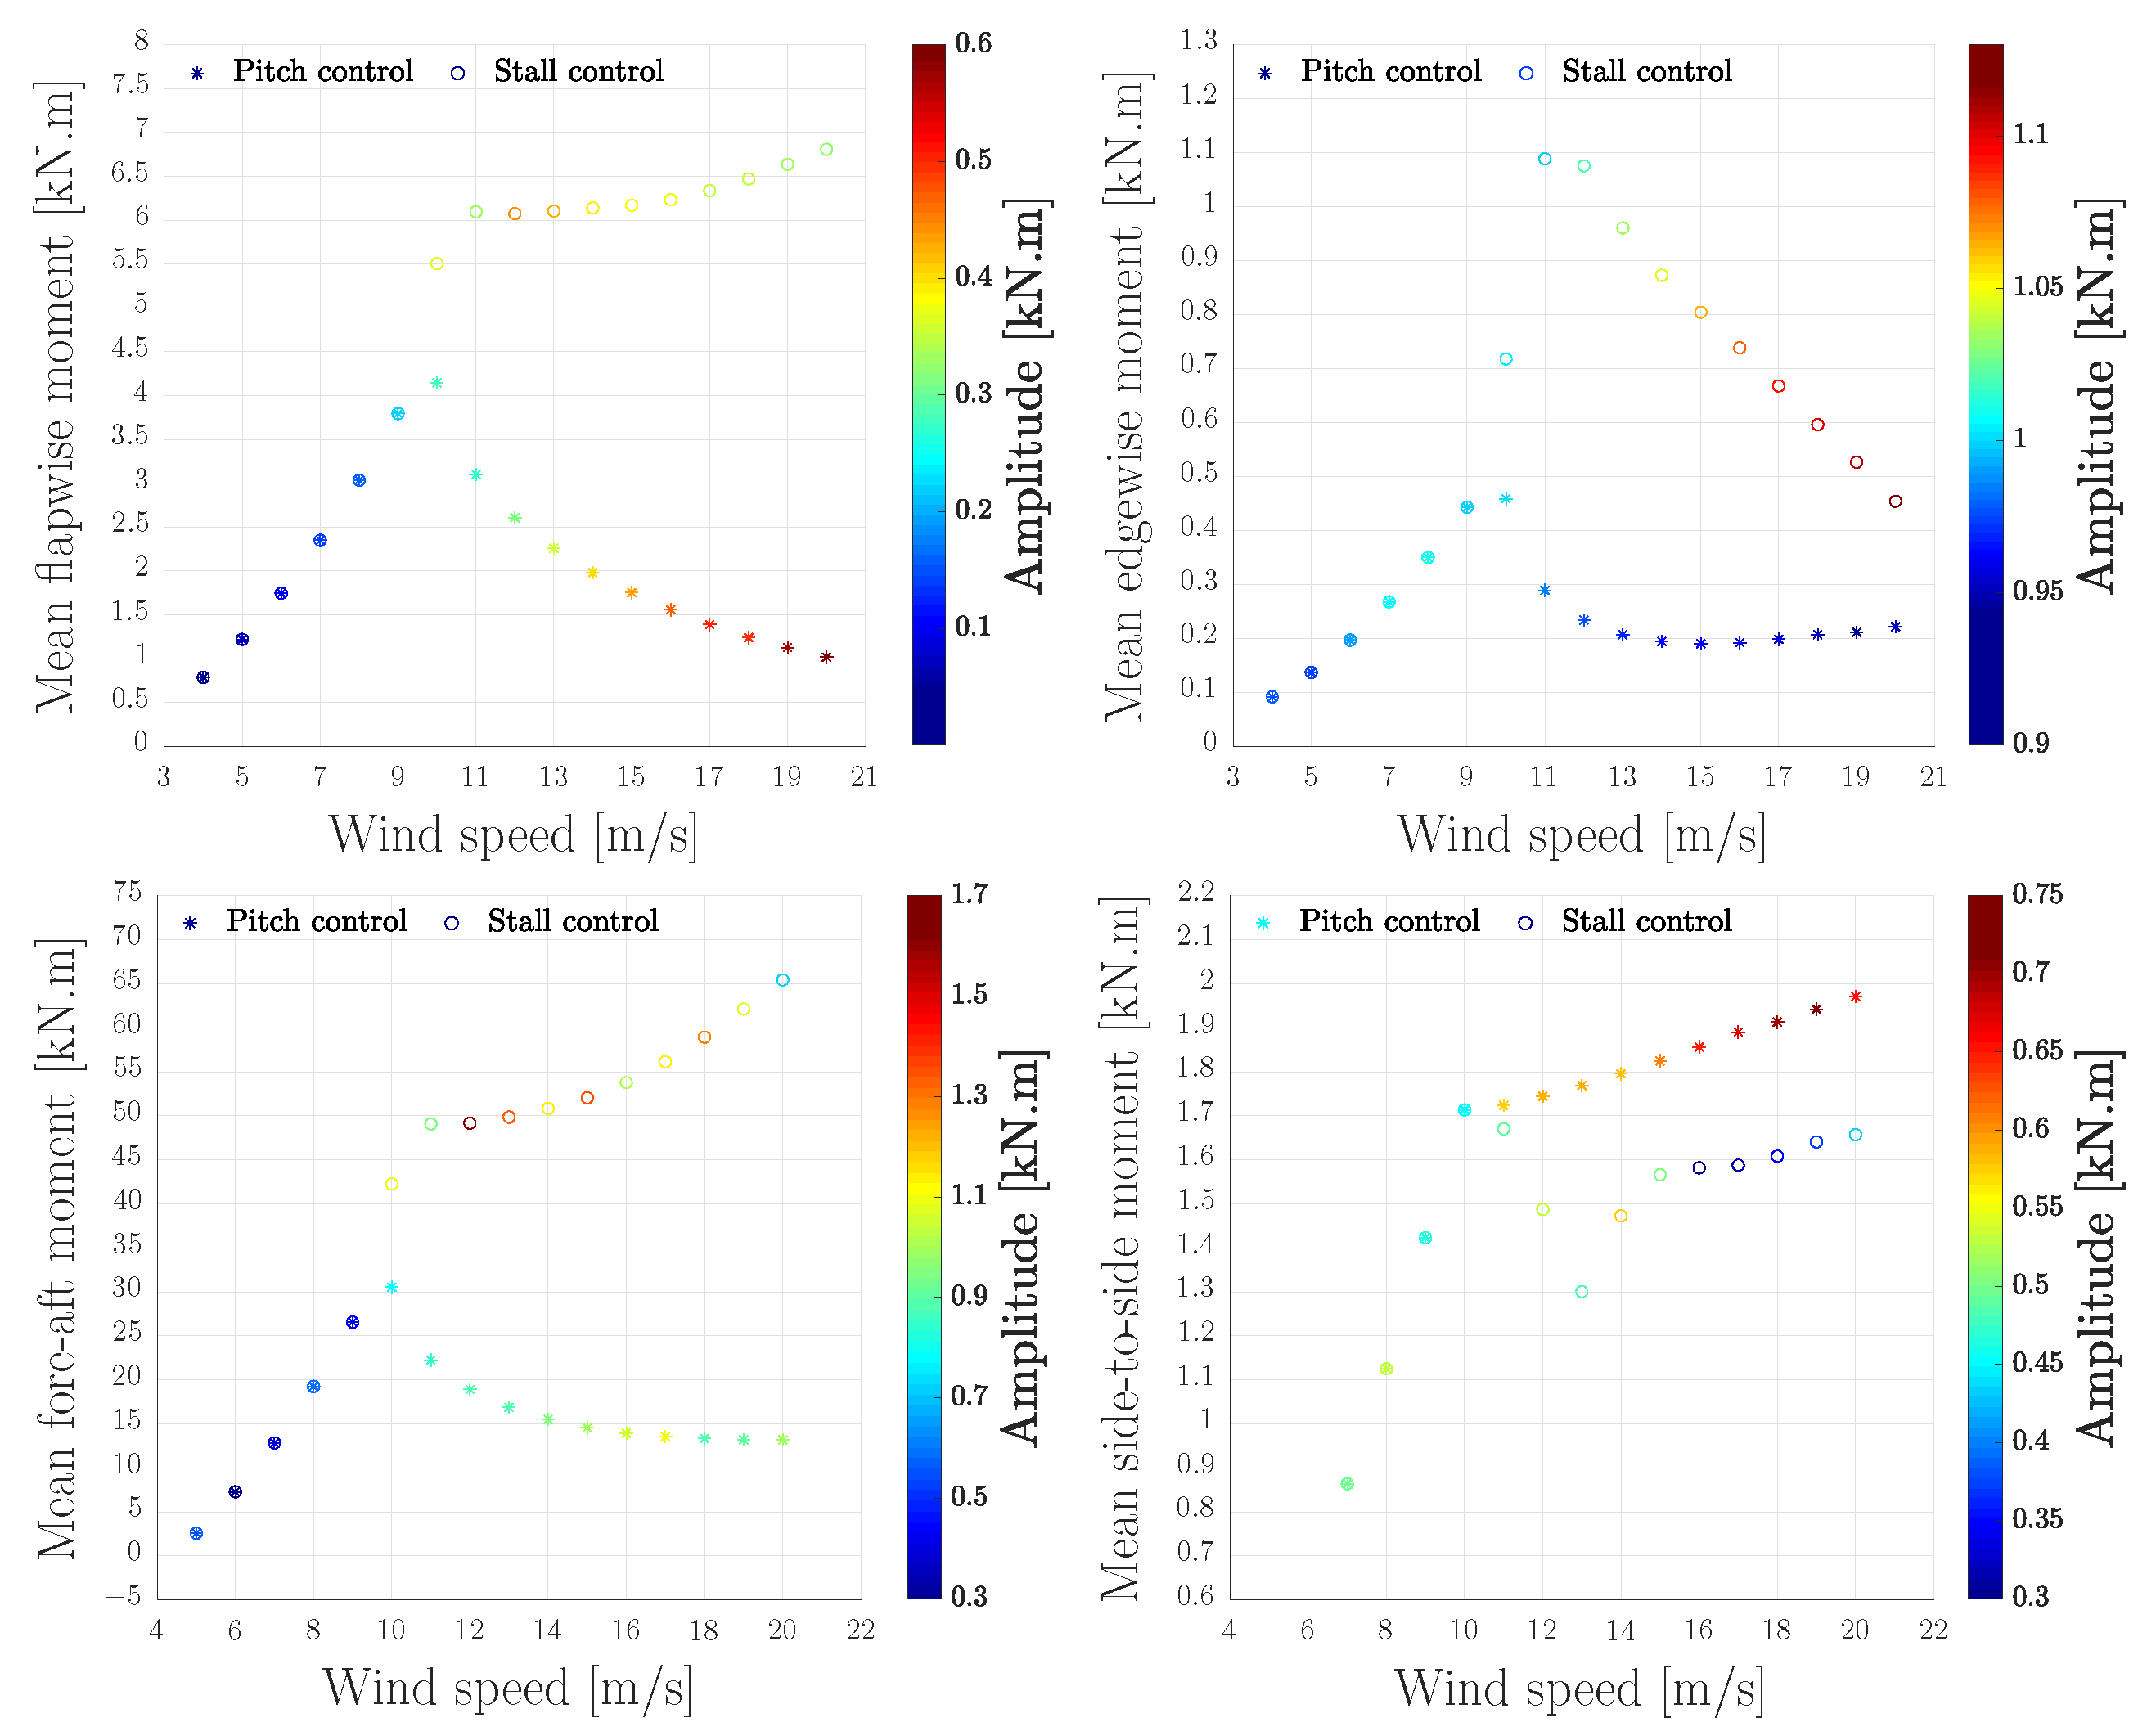
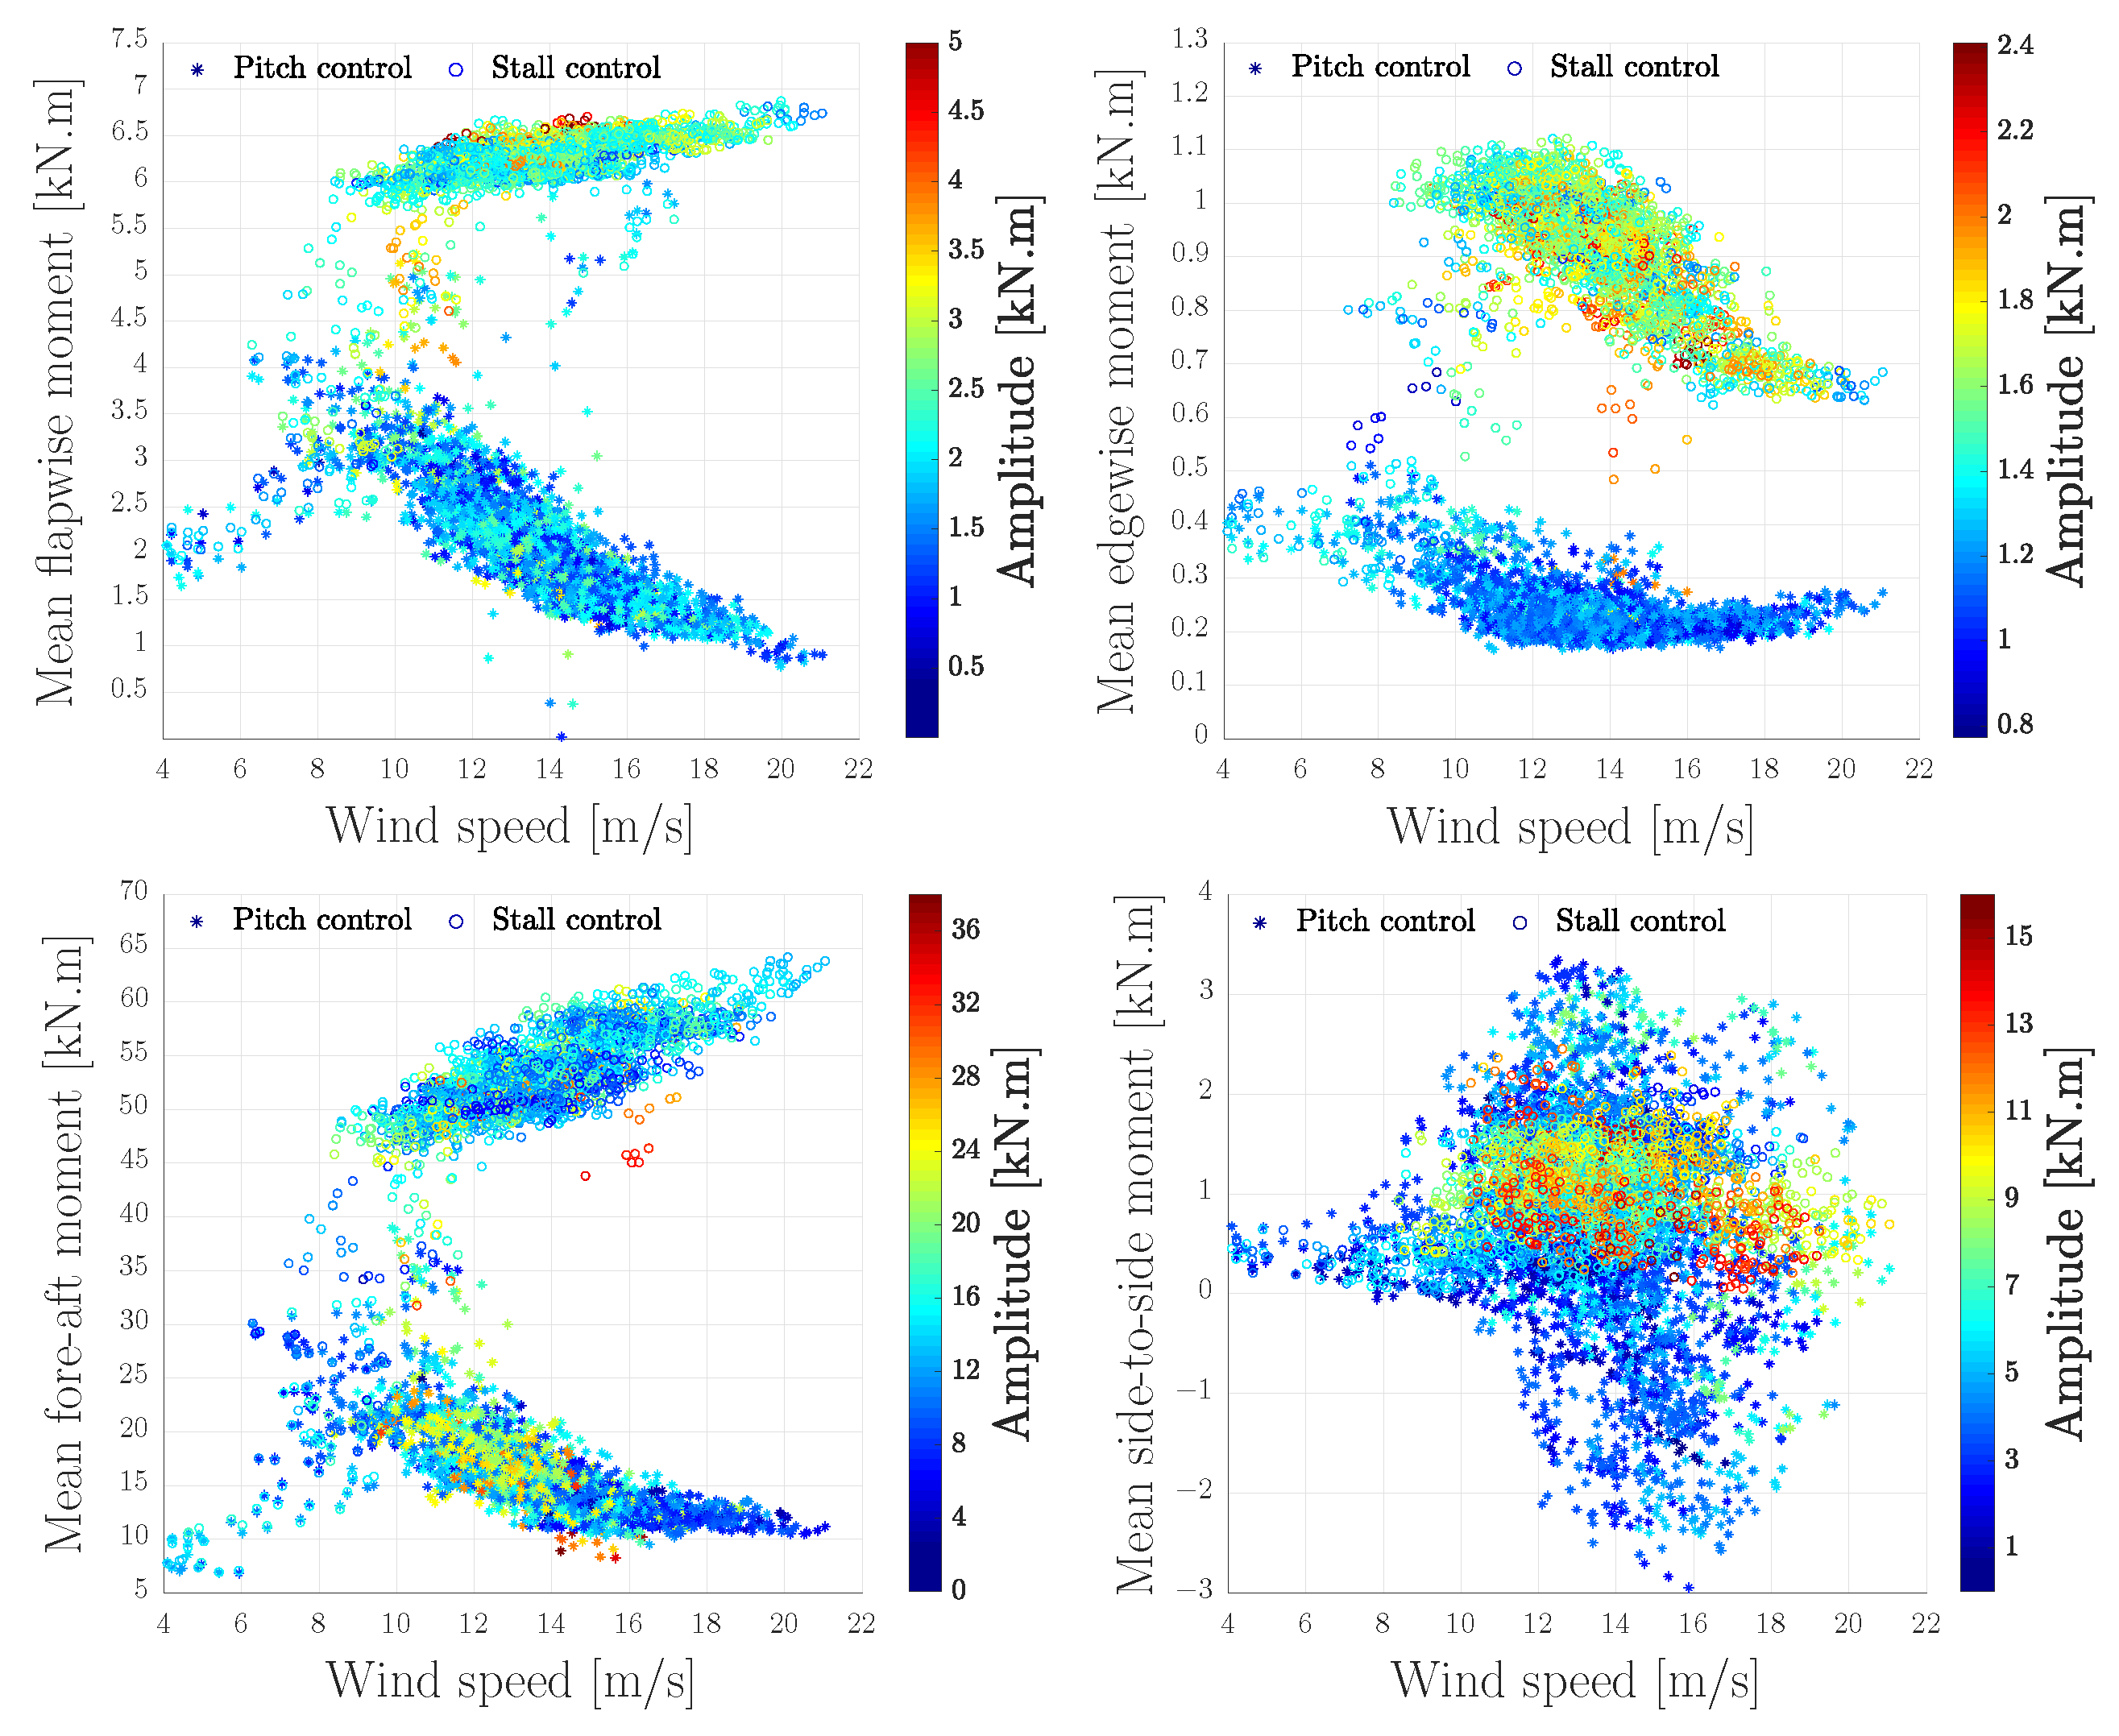
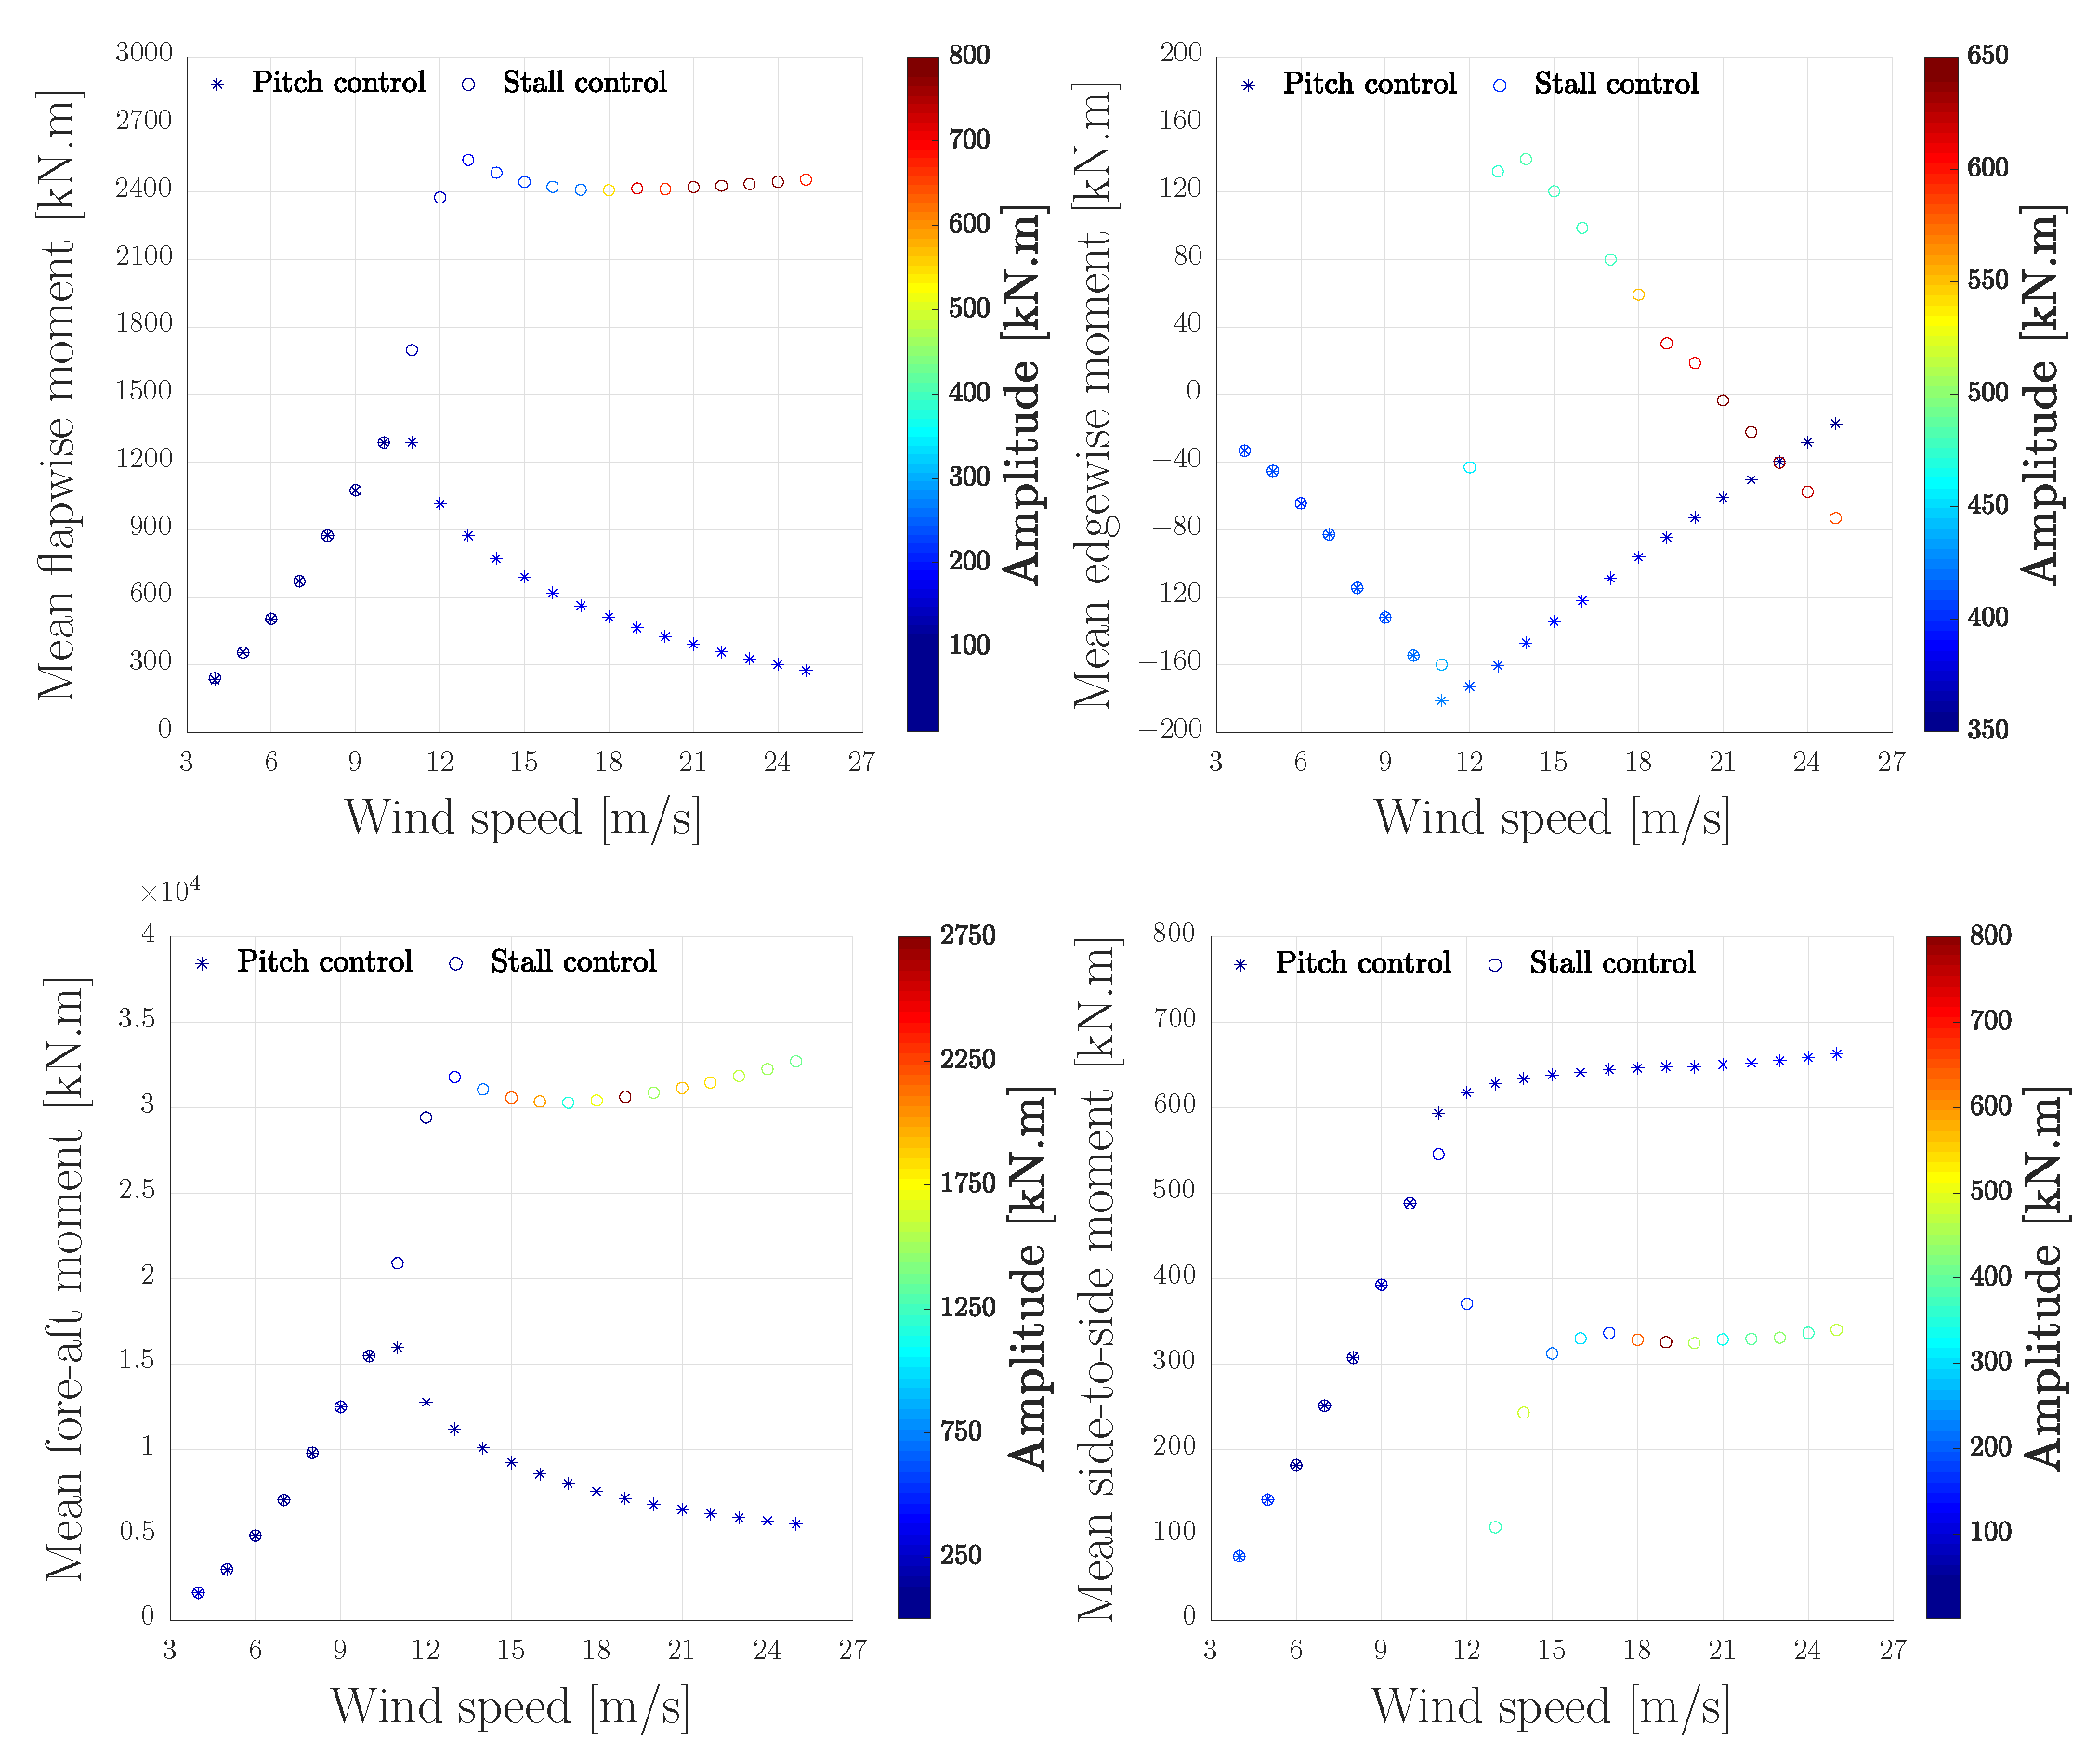
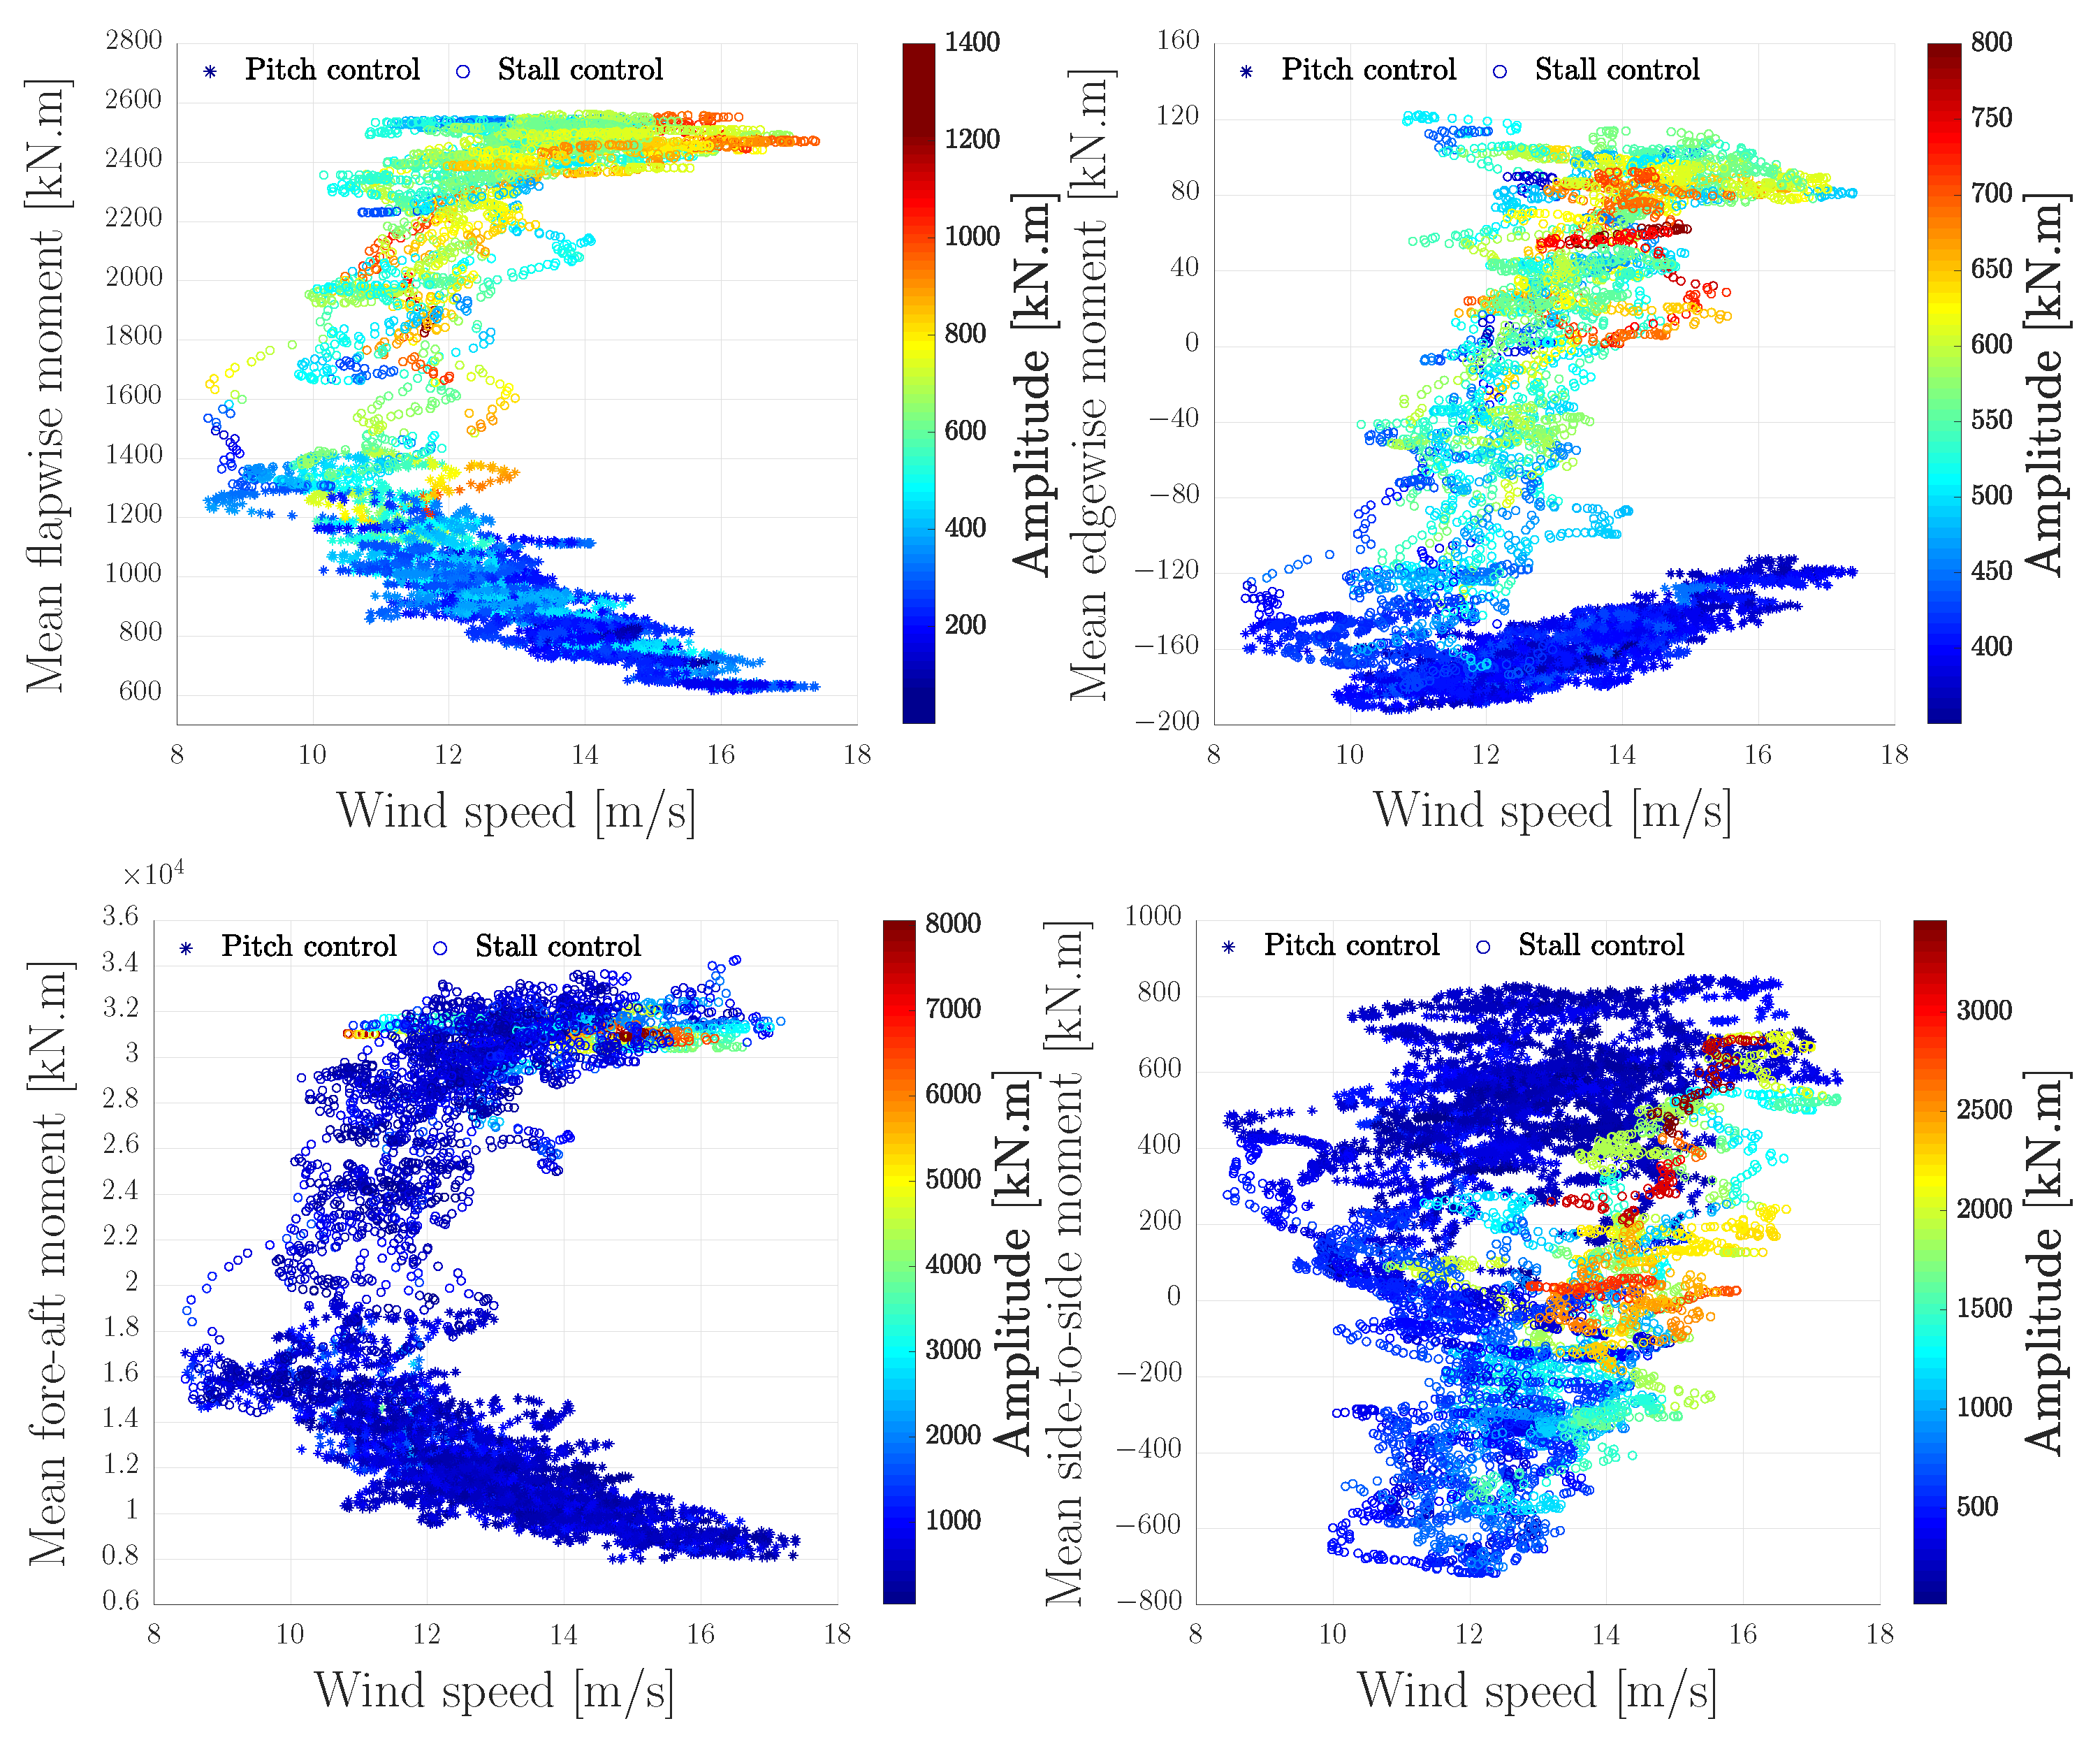
3.5. Control Impact on Structural Loads

Having discussed the performance of the wind turbines with two different control concepts, i.e., pitch-to-stall and pitch-to-feather, this section investigates the impact of these control systems on the structural loads. A profound understanding of the structural loads is needed to optimise the design to reduce the capital cost of wind turbines, and to guarantee a safe operation at high wind speeds. The increasing size of wind turbines over the past decade has made fatigue loads a critical issue in the construction of wind turbines. Higher system reliability and considerable cost reduction, i.e., material and maintenance costs, can be achieved by reducing the fatigue loads. According to [31], a load mitigation of 10–20% may bring considerable savings for the main components, such as the blade, tower, and drivetrain. Additionally, the loads on the structure of the wind turbine must be estimated to ensure a safe operation throughout its lifespan, especially in strong and gusty winds. The extreme wind conditions can lead to an accumulated fatigue damage of the blades.
The impact of the control system on the structural loads of the blades and tower is calculated using FAST in uniform and realistic winds, including turbulence. The blade root bending moments, i.e., flapwise and edgewise moments, and tower base bending moments, i.e., fore-aft and side-to-side moments, are monitored. The blade flapwise moments and the tower fore-aft moments are caused by the thrust forces, which tend to deflect the blades and tower in the downwind direction. The blades edgewise moments and tower side-to-side moments stem from the tangential forces that tend to bend the blades and tower in the rotor plane.
Figure 13 and Figure 14 compare the mean load and amplitude of the cyclic component of the blade root and tower base bending moment of the SWRT turbine in uniform and turbulent winds, respectively. In high wind speeds, the mean load on the blades of the pitch regulated wind turbine is reduced as compared to the stall controlled wind turbine, in which the mean load rises when increasing the wind speed. The mean load difference is considerably larger at cut-out wind speed, which is an advantage to mitigate the loads when the turbine brakes bring the rotor to a standstill. As it can be observed in these figures, the blades edgewise and flapwise moments amplitude increases when the wind turbine operates as a stall regulated wind turbine. Therefore, the blades experience higher fatigue loads when compared to the pitch regulated turbine. However, the stall control has a reduction effect on the tower fatigue loads in a downwind direction. As shown, the tower base fore-aft bending moment reduces in the pitch-to-stall concept, while the side-to-side moment increases. The explanation of load reduction on the tower is because of increasing the drag loading, and, hence, the thrust loading, on the turbine in stall mode. Although the thrust loads are higher in pitch-to-stall, they become more stable and are less sensitive to pitch angle changes.
Figure 15 compares the mean load and amplitude of the blade root and tower base bending moment of the UAE turbine in uniform wind. The wind speed is increased stepwise with the time interval of 30 s, and the amplitude of the fatigue load is calculated after the initial transition phase, i.e., when the load is stabilised at the corresponding wind speed. The pitch-to-stall control lightens the fore-aft bending loads on the blade compared to the pitch-to-feather control, which extends the fatigue loads on the blades in higher wind speeds, as illustrated in this figure. However, the tower base of the stall regulated wind turbine experiences a higher fatigue load in the downwind direction. The control systems have an opposite impact on in-plane loads compared to the out-plane loads. The blade edgewise moment of a stall regulated wind turbine is higher than the pitch regulated wind turbine. However, the towers side-to-side moment of the stall regulated wind turbine is reduced when compared to the same wind turbine operating as a pitch regulated wind turbine. When comparing the pitch and stall control, it is observed that, in the stall control, the structural loads initial transition occurs in a longer time. Figure 16 reflects alternating components of moments on the structure of the UAE turbine operating in turbulent wind. Despite the mitigation effect of stall control on the blades root flapwise moment in uniform wind, the alternating component of the blade root loads increases in turbulent wind, i.e., flapwise and side-to-side fatigue loads. However, the tower experiences lower fore-aft fatigue loads in the turbulent wind, while the amplitude of side-to-side moment increases. One can notice that the difference in blade loading between pitch-to-stall and pitch-to-feather is much smaller for the SWRT wind turbine. This load reduction on the structure stems from a more stable thrust loading in the stall mode, where the tower fore-aft and blade flapwise moments are less sensitive to pitch variation.
Figure 17 compares the amplitude of the cyclic components the blade root and tower base bending moments of the WP turbine in uniform wind. The pitch-to-stall control has an inconsistent effect on the blade fatigue loads, and the amplitude of the flapwise moment significantly increases at a certain range of wind speeds, i.e., the range of 18–25 m/s, as shown in this figure. Also, the blades of the stall regulated wind turbine experience higher side-to-side fatigue loads at high wind speeds when compared to the pitch regulated wind turbine. When comparing the tower moments of the WP turbine operating with pitch and stall control, it is observed that pitch-to-stall control magnifies the tower base fore-aft and side-to-side fatigue loads. The tower base and the blade rood moment of the WP turbine are also monitored in turbulent wind. Figure 18 compares the magnitudes of the alternating components of the blade root and tower base bending moments of the WP turbine in turbulent wind. A significant increase in the tower fore-aft fatigue load of the stall regulated turbine tower can be observed, which is caused by resonances due to negative damping which is known to occur in stall operation [32]. Moreover, pitch-to-stall control magnifies the side-to-side fatigue loads of the tower base.

4. Conclusions and Discussions

In this article, a comparative analysis was carried out between pitch-to-feather and pitch-to-stall control, in order to investigate the potential benefits of stall control for HAWTs. The impact of these different control schemes was investigated in terms of dynamic performance under turbulent flows, structural loading, and pitch system behaviour for three HAWTs with different blade designs, i.e., untwisted, stall-regulated, and pitch-regulated blades. A control system was designed in order to control the wind turbine in the whole operating region (II, III and IV). An MPPT algorithm was applied to maximise the power coefficient in the low wind region. The dynamic response of the wind turbines was monitored in the whole wind speed range to validate the control systems performance with gain scheduling based on aerodynamic sensitivity. The dynamic performance of the wind turbines was tested in a realistic operating condition in the presence of three-dimensional turbulent wind fields. Moreover, the oscillating movements of the blade pitch system were compared by performing cycle analysis. When considering the results, the following conclusions can be drawn:
  • Pitch-to-stall control reduces the rotor speed oscillations and power transients, as compared to pitch-to-feather, for the SWRT and UAE wind turbines with untwisted and stall-regulated blade designs, respectively.
  • Pitch-to-stall control reduces the fore-aft fatigue load on the tower, as compared to pitch-to-feather, of the wind turbines with untwisted and stall-regulated blade designs.
  • For SWRT and UAE wind turbines, pitch-to-stall control decreases the flapwise moment on the blades in uniform wind, and stabilises it in turbulent wind. However, the amplitude of the cycling component increases in turbulent wind.
  • Pitch-to-stall control magnifies the side-to-side tower fatigue loading and the blades flapwise and edgewise fatigue loads in turbulent winds. However, the difference with pith-to-feather control is minimised for the UAE wind turbines due to its stall-regulated blade design.
  • Although the pitch-to-stall control reduces the summed blade pitch movements of SWRT and UAE wind turbines, the pitch movements with small amplitude oscillation increases, which increases the risk of wear in the rolling contacts of the blade bearings.
  • Pitch-to-stall control has a negative impact on the WP wind turbine (with pitch-regulated blade design) in terms of dynamic performance and structural loading.
To conclude, pitch-to-stall control has the most positive impact on HAWTs with a stall-regulated blade design in terms of dynamic performance and fore-aft tower loading in turbulent wind, with a minimum increase of the blades flapwise moment. However, it should be considered that, although pitch-to-stall control reduces the summed blade pitch movements, it increases the risk of surface damage in the blades bearing due to the oscillating movements with a small amplitude.

Author Contributions

Conceptualisation, A.E.S.; Methodology, A.E.S., J.D.M.D.K. and N.K.; Software, A.E.S. and N.K.; Validation, J.D.M.D.K., N.K. and N.S.; Formal Analysis, A.E.S.; Writing–Original Draft Preparation, A.E.S.; Writing–Review and Editing, J.D.M.D.K. and L.V.; Visualisation, A.E.S.; Supervision, J.D.M.D.K. and L.V. All authors have read and agreed to the published version of the manuscript.

Funding

This work was performed in the framework of the Energy Transition Fund project BEOWIND of the Belgian federal government, the Catalisti cluster SBO project CO2PERATE and the FWO research project G.0D93.16N, funded by the Research Foundation Flanders.

Conflicts of Interest

The authors declare no conflict of interest.

Abbreviations

The following abbreviations are used in this manuscript:
θ Pitch angle
P θ Sensitivity of the aerodynamic power to the pitch angle
θ r Pitch angle at the rated operating point
θ k Pitch angle at which the blade sensitivity has increased by a factor of 2, compared to its value at the rated operating point
G k Gain correction factor
V h r e f Horizontal wind speed (vectorial u + v)
Delta Wind direction
VZ Vertical wind speed (w component)
VLinShr Vertical linear wind-shear parameters
HLinShr Horizontal linear wind-shear parameters
V G u s t Horizontal gust speed
VShr Vertical power-law wind-shear exponent
RefHt Reference height
RefLength Reference length for linear horizontal and vertical sheer
PLexp Power law exponent
F i , K Spectrum scaling factor
p i , K Spectrum scaling factor
fCyclic frequency
UStar Friction velocity
u ¯ Mean wind speed at height z

Appendix A. Blade Characteristic of Wind Turbine Models

Table A1. Aerofoil distribution and twist angle of untwisted, stall-regulated, pitch-regulated blades.
SWRT 10 kWUAE 20 kWWP 1.5 MW
Blade Radius (m)Twist Angle (°)AerofoilsBlade Radius (m)Twist Angle (°)AerofoilsBlade Radius (m)Twist Angle (°)Aerofoils
02SH305200cylinder011.1cylinder
0.08650SH30520.1360cylinder1.10811.1cylinder
0.4320SH30520.448−0.098cylinder3.32511.1S818
0.6050SH30520.819.423S8095.54111.1S818
0.7790SH30521.07614.318S8097.75811.1S818
0.9520SH30521.27710.971S8099.9758.38S818
1.1250SH30521.4958.244S80912.1916.35S818
1.2980SH30521.7136.164S80914.4084.33S818
1.4710SH30521.9144.689S80916.6252.85S825
1.6440SH30522.1163.499S80918.8412.22S825
1.8170SH30522.3342.478S80921.0581.58S825
1.9900SH30522.5521.686S80923.2750.95S825
2.1640SH30522.7531.115S80925.4910.53S825
2.3371.6SH30522.9540.666S80927.7080.38S825
2.5103.2SH30523.1720.267S80929.9250.23S826
2.5963.2SH30523.390−0.079S80932.1410.08S826
3.591−0.381S80933.250.08S826
3.792−0.679S809
3.968−0.933S809
4.144−1.184S809
4.345−1.466S809
4.521−1.711S809
4.597−1.815S809

References

  1. Council, G.W.E. Global Wind Report 2019; Global Wind Energy Council: Brussels, Belgium, 2020. [Google Scholar]
  2. Bossanyi, E.A. Individual blade pitch control for load reduction. Wind Energy 2003, 6, 119–128. [Google Scholar] [CrossRef]
  3. Park, S.; Nam, Y. Two LQRI based blade pitch controls for wind turbines. Energies 2012, 5, 1998–2016. [Google Scholar] [CrossRef]
  4. Macquart, T.; Maheri, A.; Busawon, K. Microtab dynamic modelling for wind turbine blade load rejection. Renew. Energy 2014, 64, 144–152. [Google Scholar] [CrossRef] [Green Version]
  5. He, K.; Qi, L.; Zheng, L.; Chen, Y. Combined pitch and trailing edge flap control for load mitigation of wind turbines. Energies 2018, 11, 2519. [Google Scholar] [CrossRef] [Green Version]
  6. Maldonado, V. Active Flow Control of Wind Turbine Blades. In Wind Turbines—Design, Control and Applications; In-Tech: Rijeka, Croatia, 2016; pp. 303–324. [Google Scholar]
  7. Dinwoodie, I.; McMillan, D.; Revie, M.; Lazakis, I.; Dalgic, Y. Development of a combined operational and strategic decision support model for offshore wind. Energy Procedia 2013, 35, 157–166. [Google Scholar] [CrossRef] [Green Version]
  8. Dao, C.; Kazemtabrizi, B.; Crabtree, C. Wind turbine reliability data review and impacts on levelised cost of energy. Wind Energy 2019, 22, 1848–1871. [Google Scholar] [CrossRef] [Green Version]
  9. Harris, T.A.; Kotzalas, M.N. Advanced Concepts of Bearing Technology: Rolling Bearing Analysis; CRC Press: Boca Raton, FL, USA, 2006. [Google Scholar]
  10. Stammler, M.; Thomas, P.; Reuter, A.; Schwack, F.; Poll, G. Effect of load reduction mechanisms on loads and blade bearing movements of wind turbines. Wind Energy 2019, 23, 274–290. [Google Scholar] [CrossRef] [Green Version]
  11. Larsen, T.J.; Hanson, T.D. A method to avoid negative damped low frequent tower vibrations for a floating, pitch controlled wind turbine. J. Phys. Conf. Ser. IOP Publ. 2007, 75, 012073. [Google Scholar] [CrossRef]
  12. Jonkman, J.M. Dynamics Modeling and Loads Analysis of an Offshore Floating Wind Turbine; Technical Report; National Renewable Energy Lab. (NREL): Golden, CO, USA, 2007.
  13. Macquart, T.; Maheri, A. A stall-regulated wind turbine design to reduce fatigue. Renew. Energy 2019, 133, 964–970. [Google Scholar] [CrossRef] [Green Version]
  14. Ward, D.; Collu, M.; Sumner, J. Reducing Tower Fatigue through Blade Back Twist and Active Pitch-to-Stall Control Strategy for a Semi-Submersible Floating Offshore Wind Turbine. Energies 2019, 12, 1897. [Google Scholar] [CrossRef] [Green Version]
  15. Loza, B.; Pacheco-Chérrez, J.; Cárdenas, D.; Minchala, L.I.; Probst, O. Comparative Fatigue Life Assessment of Wind Turbine Blades Operating with Different Regulation Schemes. Appl. Sci. 2019, 9, 4632. [Google Scholar] [CrossRef] [Green Version]
  16. De Kooning, J.D.M.; Van de Vyver, J.; Meersman, B.; Vandevelde, L. Maximum efficiency current waveforms for a PMSM including iron losses and armature reaction. IEEE Trans. Ind. Appl. 2017, 53, 3336–3344. [Google Scholar] [CrossRef]
  17. De Kooning, J.D.M.; Vandoorn, T.L.; Van de Vyver, J.; Meersman, B.; Vandevelde, L. Displacement of the maximum power point caused by losses in wind turbine systems. Renew. Energy 2016, 85, 273–280. [Google Scholar] [CrossRef]
  18. Cui, Z.; Song, L. Improvement of maximum power point tracking for a new wind power system. In Proceedings of the 2018 13th IEEE Conference on Industrial Electronics and Applications (ICIEA), Wuhan, China, 31 May–2 June 2018; IEEE: Piscataway, NJ, USA, 2018; pp. 1665–1670. [Google Scholar]
  19. Kazmi, S.M.R.; Goto, H.; Guo, H.J.; Ichinokura, O. A novel algorithm for fast and efficient speed-sensorless maximum power point tracking in wind energy conversion systems. IEEE Trans. Ind. Electron. 2010, 58, 29–36. [Google Scholar] [CrossRef]
  20. Jonkman, J.; Butterfield, S.; Musial, W.; Scott, G. Definition of a 5-MW Reference Wind Turbine for Offshore System Development; Technical Report; National Renewable Energy Lab. (NREL): Golden, CO, USA, 2009.
  21. Hansen, M.H.; Hansen, A.D.; Larsen, T.J.; ∅ye, S.; Sørensen, P.; Fuglsang, P. Control design for a pitch-regulated, variable speed wind turbine. Moment 2005, 2, 3. [Google Scholar]
  22. Bossanyi, E.A. The design of closed loop controllers for wind turbines. Wind Energy 2000, 3, 149–163. [Google Scholar] [CrossRef]
  23. Singh, M.; Muljadi, E.; Jonkman, J.; Gevorgian, V.; Girsang, I.; Dhupia, J. Simulation for Wind Turbine Generators–with FAST and MATLAB-Simulink Modules; Technical Report; National Renewable Energy Lab. (NREL): Golden, CO, USA, 2014.
  24. Platt, A.; Jonkman, B.; Jonkman, J. InflowWind Users Guide; Technical Report; National Renewable Energy Lab. (NREL): Golden, CO, USA, 2016.
  25. Muljadi, E.; Butterfield, C.P. Pitch-controlled variable-speed wind turbine generation. IEEE Trans. Ind. Appl. 2001, 37, 240–246. [Google Scholar] [CrossRef] [Green Version]
  26. Hammerum, K.; Brath, P.; Poulsen, N.K. A fatigue approach to wind turbine control. J. Phys. Conf. Ser. 2007, 75, 012081. [Google Scholar] [CrossRef] [Green Version]
  27. Jonkman, B. TurbSim User’s Guide v2.00.00; NREL: Golden, CO, USA, 2016.
  28. Veers, P.S. Three-Dimensional Wind Simulation; Technical Report; Sandia National Labs.: Albuquerque, NM, USA, 1988.
  29. Kelley, N.; Hand, M.; Larwood, S.; McKenna, E. The NREL large-scale turbine inflow and response experiment: Preliminary results. In Proceedings of the Wind Energy Symposium, Reno, NV, USA, 14–17 January 2002; Volume 7476, pp. 412–426. [Google Scholar]
  30. Stammler, M.; Poll, G.; Reuter, A. The influence of oscillation sequences on rolling bearing wear. Bear. World J. 2019, 4, 19–25. [Google Scholar]
  31. Veers, P.S.; Ashwill, T.D.; Sutherland, H.J.; Laird, D.L.; Lobitz, D.W.; Griffin, D.A.; Mandell, J.F.; Musial, W.D.; Jackson, K.; Zuteck, M.; et al. Trends in the design, manufacture and evaluation of wind turbine blades. Wind Energy 2003, 6, 245–259. [Google Scholar] [CrossRef]
  32. Riziotis, V.; Madsen, H.A. Aeroelasticity and structural dynamics of wind turbines. In Wind Energy Systems; Elsevier: Amsterdam, The Netherlands, 2011; pp. 46–111. [Google Scholar]
Figure 1. Overview of the considered wind turbine system.
Energies 13 04503 g001
Figure 2. Power coefficient C P of the wind turbines as a function of pitch angle θ and tip speed ratio λ .
Energies 13 04503 g002
Figure 3. Wind turbine power curve and operational regions.
Energies 13 04503 g003
Figure 4. Electrical Maximum Power Point Tracking (MPPT) versus mechanical MPPT for SWRT, UAE, and WP wind turbines.
Energies 13 04503 g004
Figure 5. Pitch sensitivity P θ of the SWRT (left), UAE (center), and WP wind turbines (right) at wind speeds in region IV.
Energies 13 04503 g005
Figure 6. Pitch control diagram.
Energies 13 04503 g006
Figure 7. Dynamic performance of the SWRT, UAE, and WP wind turbines in the low wind region.
Energies 13 04503 g007
Figure 8. Dynamic performance of the SWRT, UAE, and WP wind turbines in the high wind region.
Energies 13 04503 g008
Figure 9. Turbulent wind field simulation in streamwise (top), crosswise (middle), and vertical direction (bottom).
Energies 13 04503 g009
Figure 10. Dynamic performance of the SWRT, UAE, and WP wind turbines in turbulent wind.
Energies 13 04503 g010
Figure 11. Comparison of the structural bending moments of the SWRT, UAE, and WP wind turbines in turbulent wind.
Energies 13 04503 g011
Figure 12. Number of cycles pitch-to-feather and pitch-to-stall in comparison for small oscillation amplitude ranges.
Energies 13 04503 g012
Figure 13. Comparison of the fatigue loads on the structure of the SWRT wind turbine operating with pitch-to-stall and pitch-to-feather control in the whole wind speed range.
Energies 13 04503 g013
Figure 14. Comparison of the fatigue loads on the structure of the SWRT wind turbine operating with pitch-to-stall and pitch-to-feather control in the turbulent wind.
Energies 13 04503 g014
Figure 15. Comparison of the fatigue loads on the structure of the UAE wind turbine operating with pitch-to-stall and pitch-to-feather control in the whole wind speed range.
Energies 13 04503 g015
Figure 16. Comparison of the fatigue loads on the structure of the UAE wind turbine operating with pitch-to-stall and pitch-to-feather control in the turbulent wind.
Energies 13 04503 g016
Figure 17. Comparison of the fatigue loads on the structure of the WP wind turbine operating with pitch-to-stall and pitch-to-feather control in the whole wind speed range.
Energies 13 04503 g017
Figure 18. Comparison of the fatigue loads on the structure of the WP wind turbine operating with pitch-to-stall and pitch-to-feather control in the turbulent wind.
Energies 13 04503 g018
Table 1. Wind turbines model specification.
Turbine NameNumber of BladesRotor Diameter
(m)
Rated Power
(kW)
C P max
(-)
λ opt
(-)
θ opt
(°)
Rated Wind Speed
(m/s)
Rated RPM
SWRT35.8100.425.5711.5210
UAE210200.426.4110122
WP37015000.507.32.51122
Table 2. Wind field simulation parameters.
Time step0.050 (s)
Mean wind speed at hub height14 (m/s)
Turbulent Intensity (TI)13 (%)
Vertical grid-point matrix dimension40
Horizontal grid-point matrix dimension40
Surface roughness length0.021 (m)
Hub height34.6 (m)
Assumed rotor diameter10 (m)

