From Firm Solar Power Forecasts to Firm Solar Power Generation an Effective Path to Ultra-High Renewable Penetration a New York Case Study


Abstract
1. Introduction
2. Methods
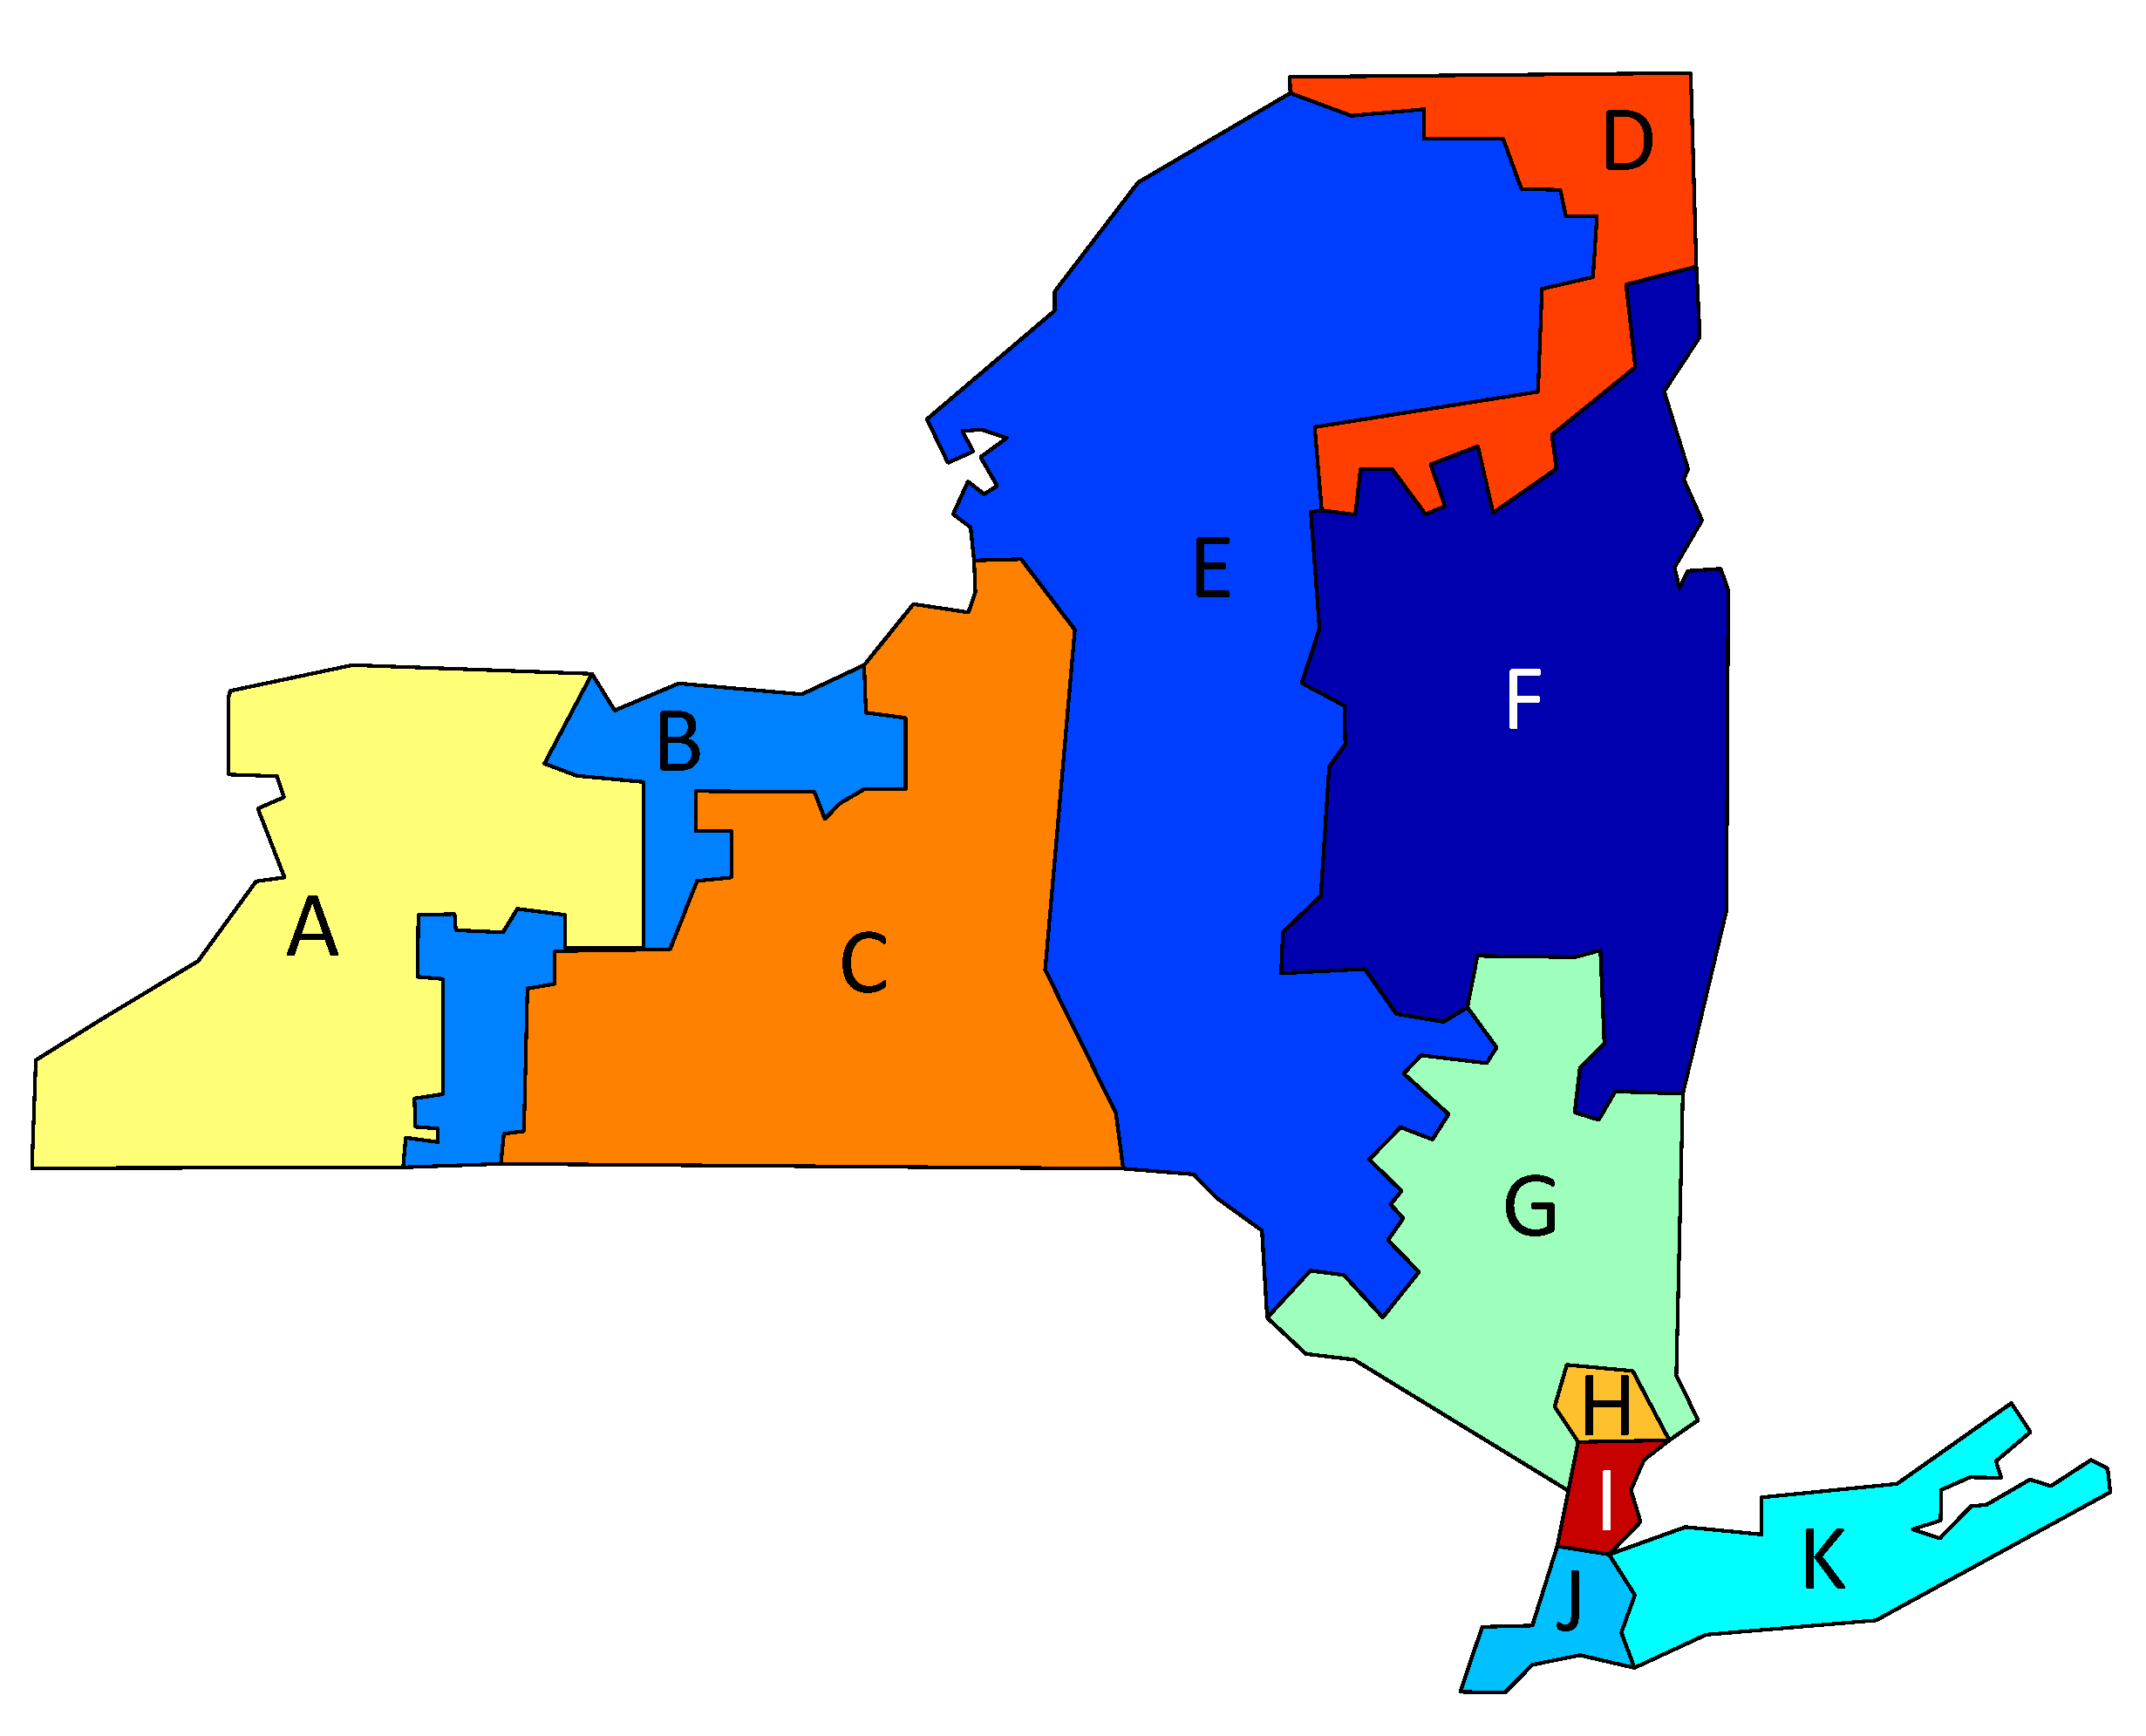
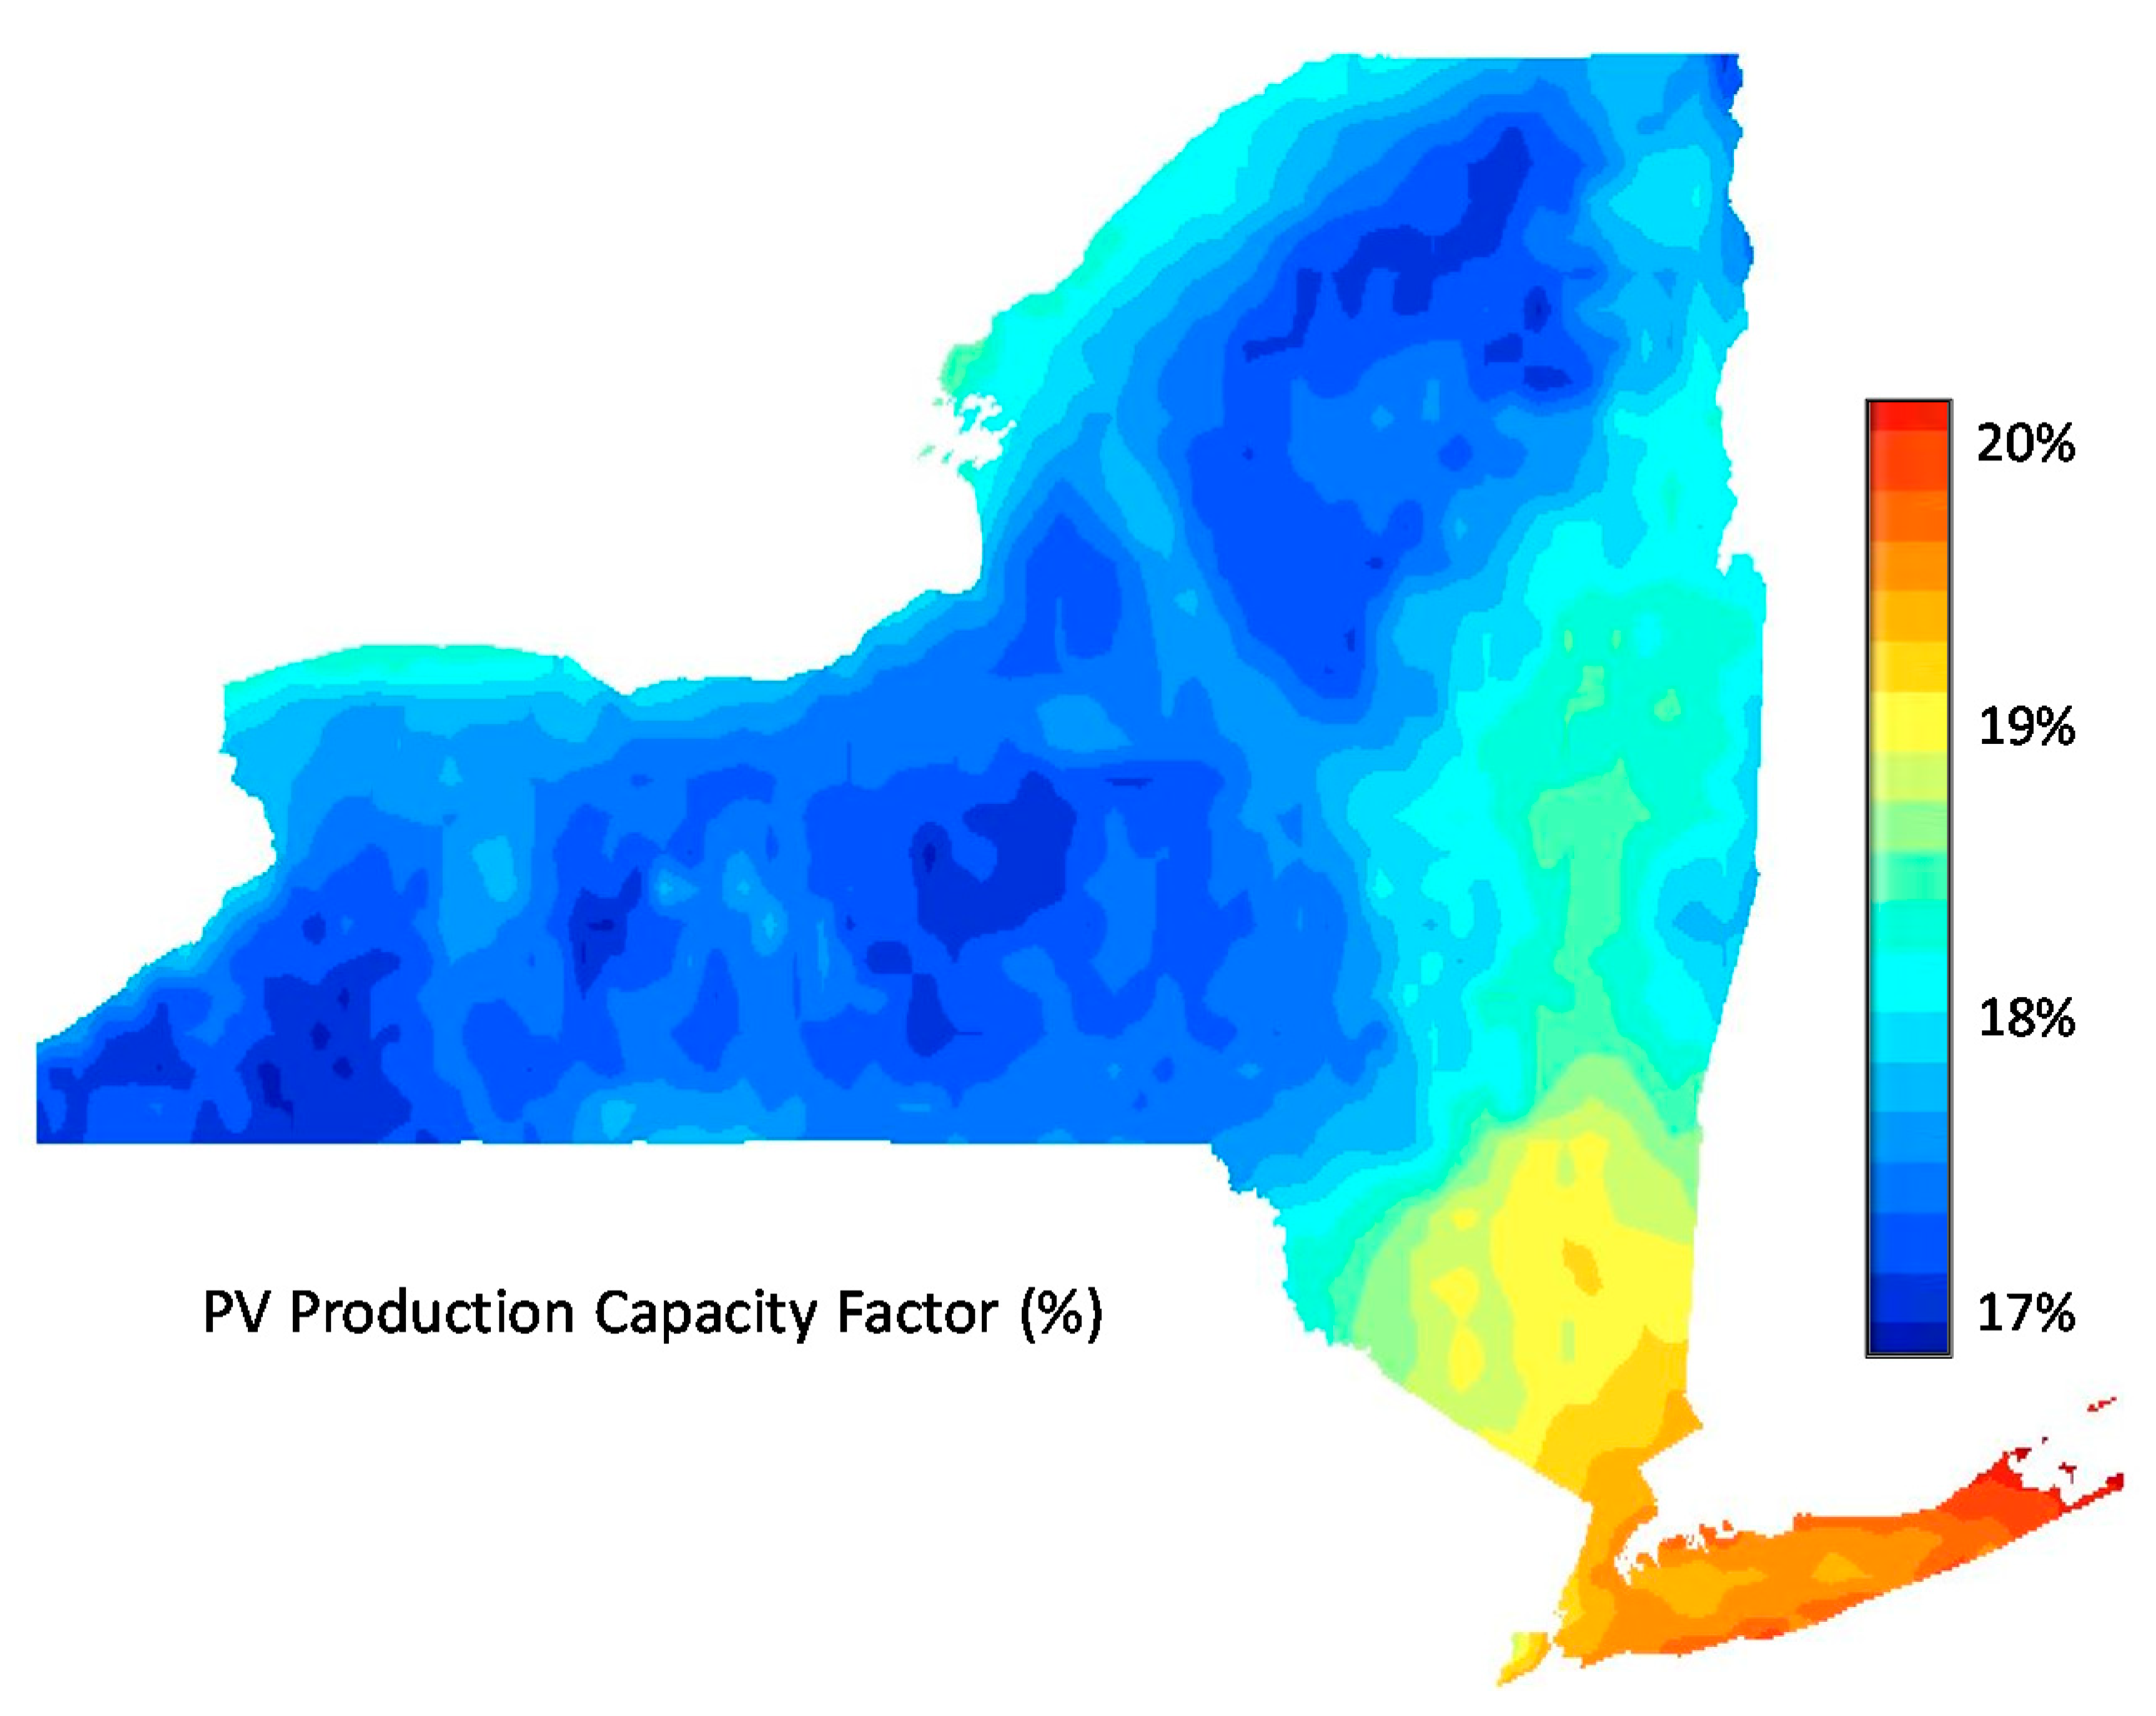
2.1. New York Independent System Operator (NYISO) Case Study
2.2. Firm Power Forecasts
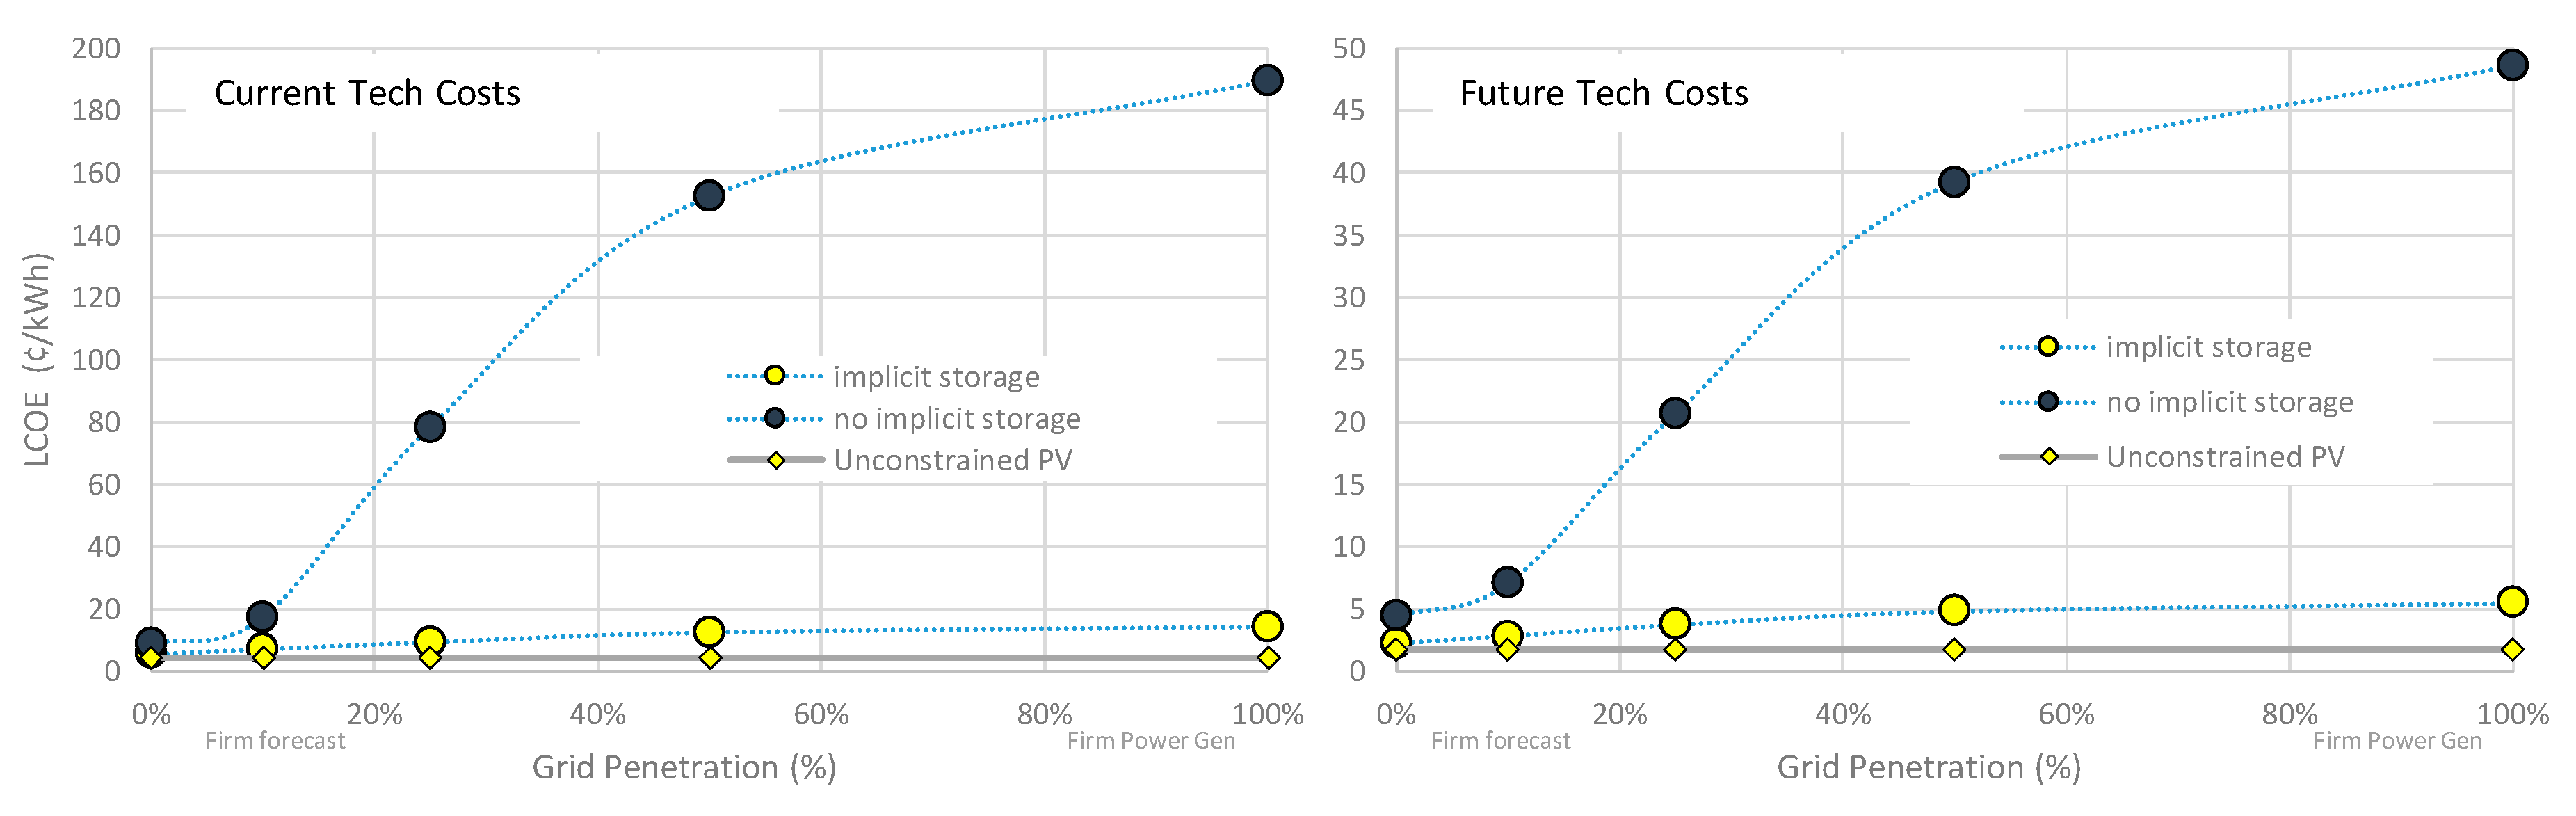
- The capital costs of PV and storage. We consider two scenarios: (1) a present/near-future scenario with PV at $1000/kWptc and storage at $200/kWh and, (2) a future scenario at the 20 years horizon with PV at $400/kWptc and storage at $50/kWh [37].
- The round-trip efficiency of storage. We assume 90%.
- Whether storage can be recharged at night during off-hours. We make this assumption here, whereby storage can be recharged at night at a conservatively ‘generic’ cost of $0.15/kWh.
- The amount of flexibility allowed by the TSOs to deem forecasts firm. We consider two scenarios: (1) 0% flexibility, i.e., the output seen by the grid must be equal to the forecast; (2) 2.5% flexibility, i.e., the output seen by the grid may differ from the forecast by an amount exceeding at most 25 Watts per installed kW; (3) 5% flexibility, where differences between actual and predicted generation must be below 50 Watts per installed PV kW.
2.3. Firm Power Generation
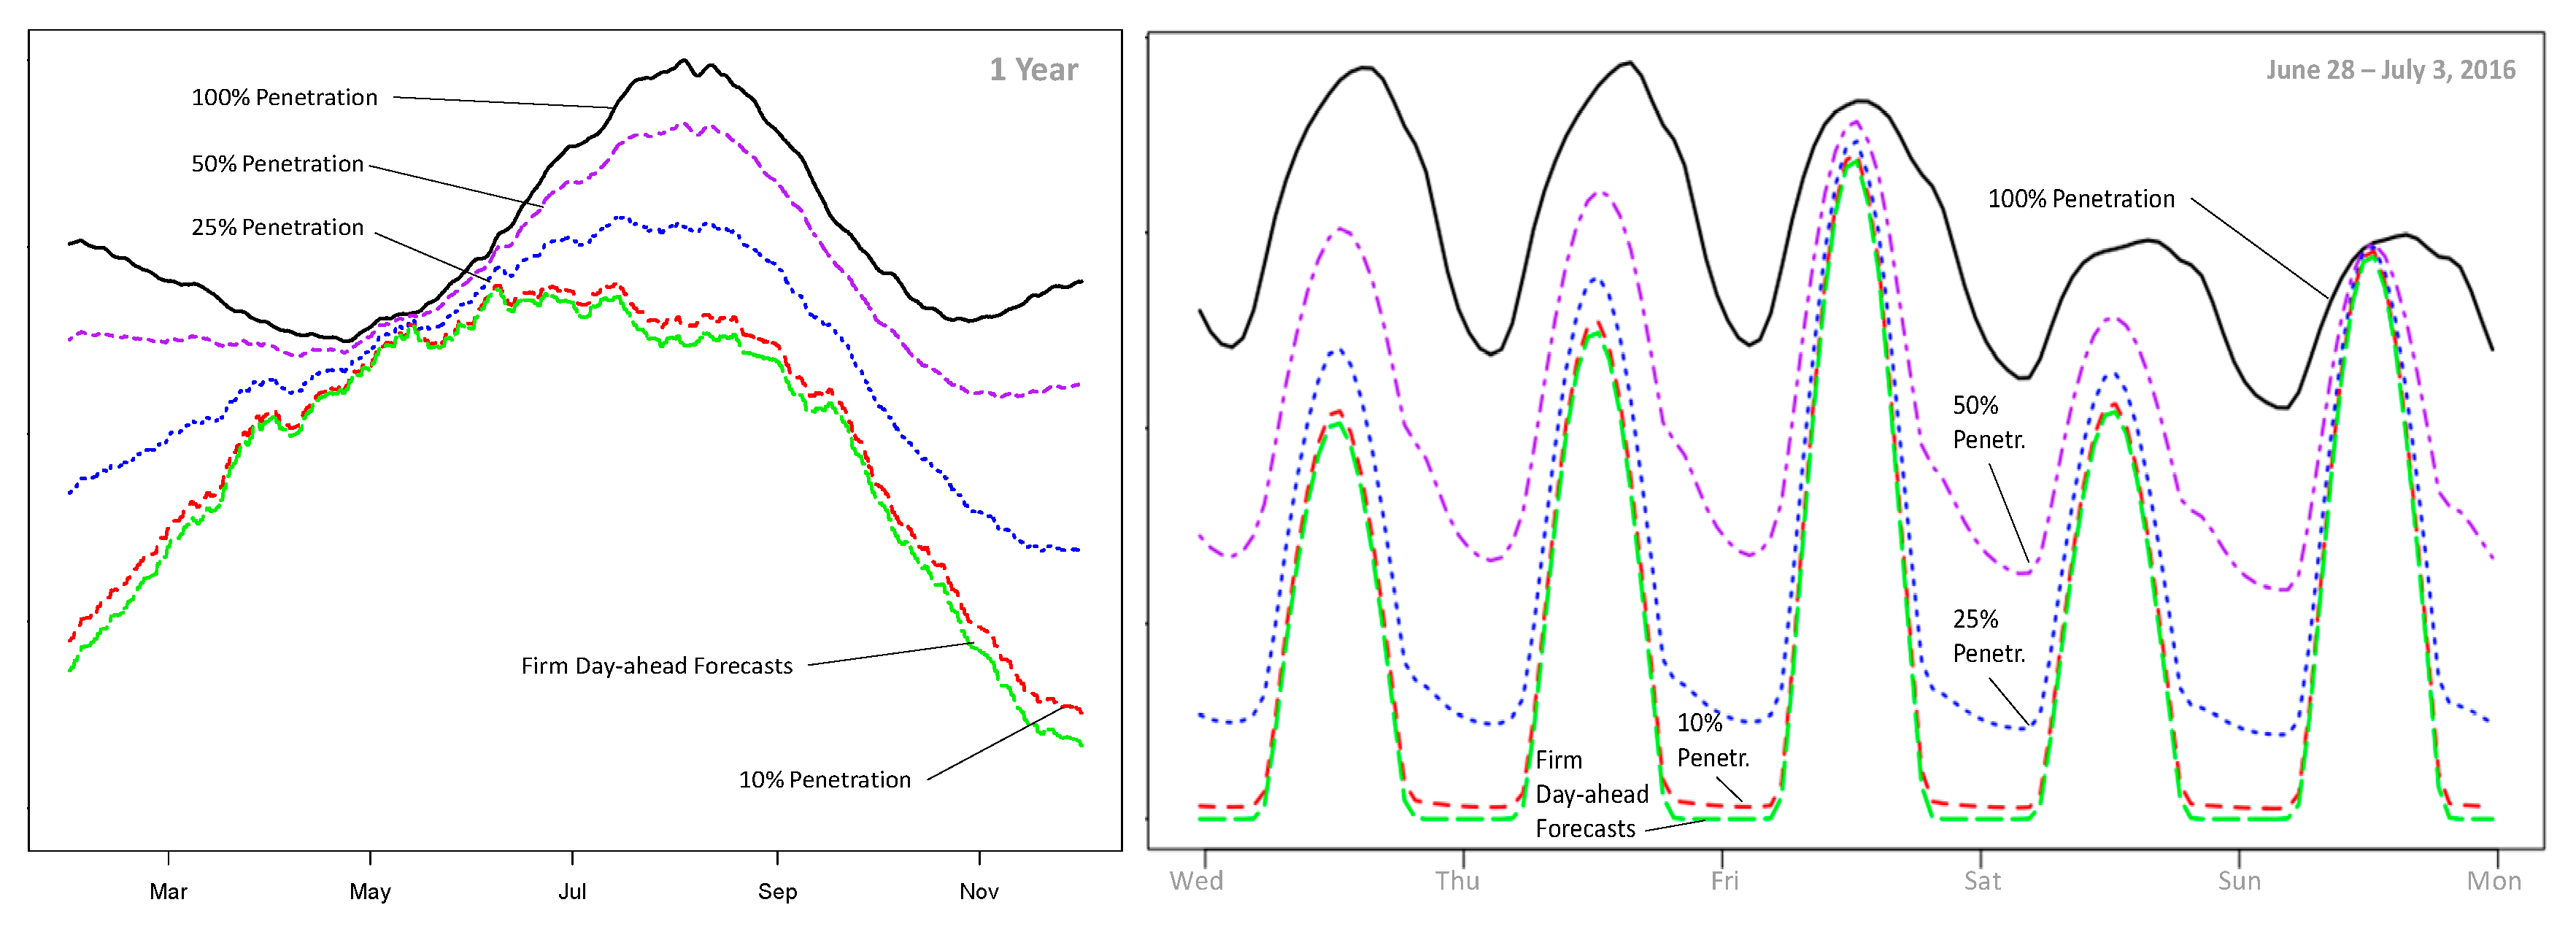
- The target output is not the forecast, but the [regional] NYISO load.
- Since the objective is to supply the demand 24/7 at high-penetration, there is no external battery recharge possibility at night or in off-hours. Storage can only be recharged when renewable production exceeds demand.
- We also consider flexibility defined not in terms of forecast guaranties, but in terms of the fraction of energy allowed from external, non-renewable sources. This external source could be supply-side, e.g., from legacy or new natural gas units, and/or demand-side from load management. We consider flexibility levels of 0%, 2.5% and 5%.
- Unlike for forecasts where the target load (i.e., the forecast production) is largely independent of PV configuration, meeting a target load shape depends on PV configuration. We selected a fixed 30° tilt south-facing array geometry.
2.4. Evolving Penetration Strategy
2.5. Key Performance Indicators
- Optimum storage requirements—quantified in terms of installed PV capacity-hours.
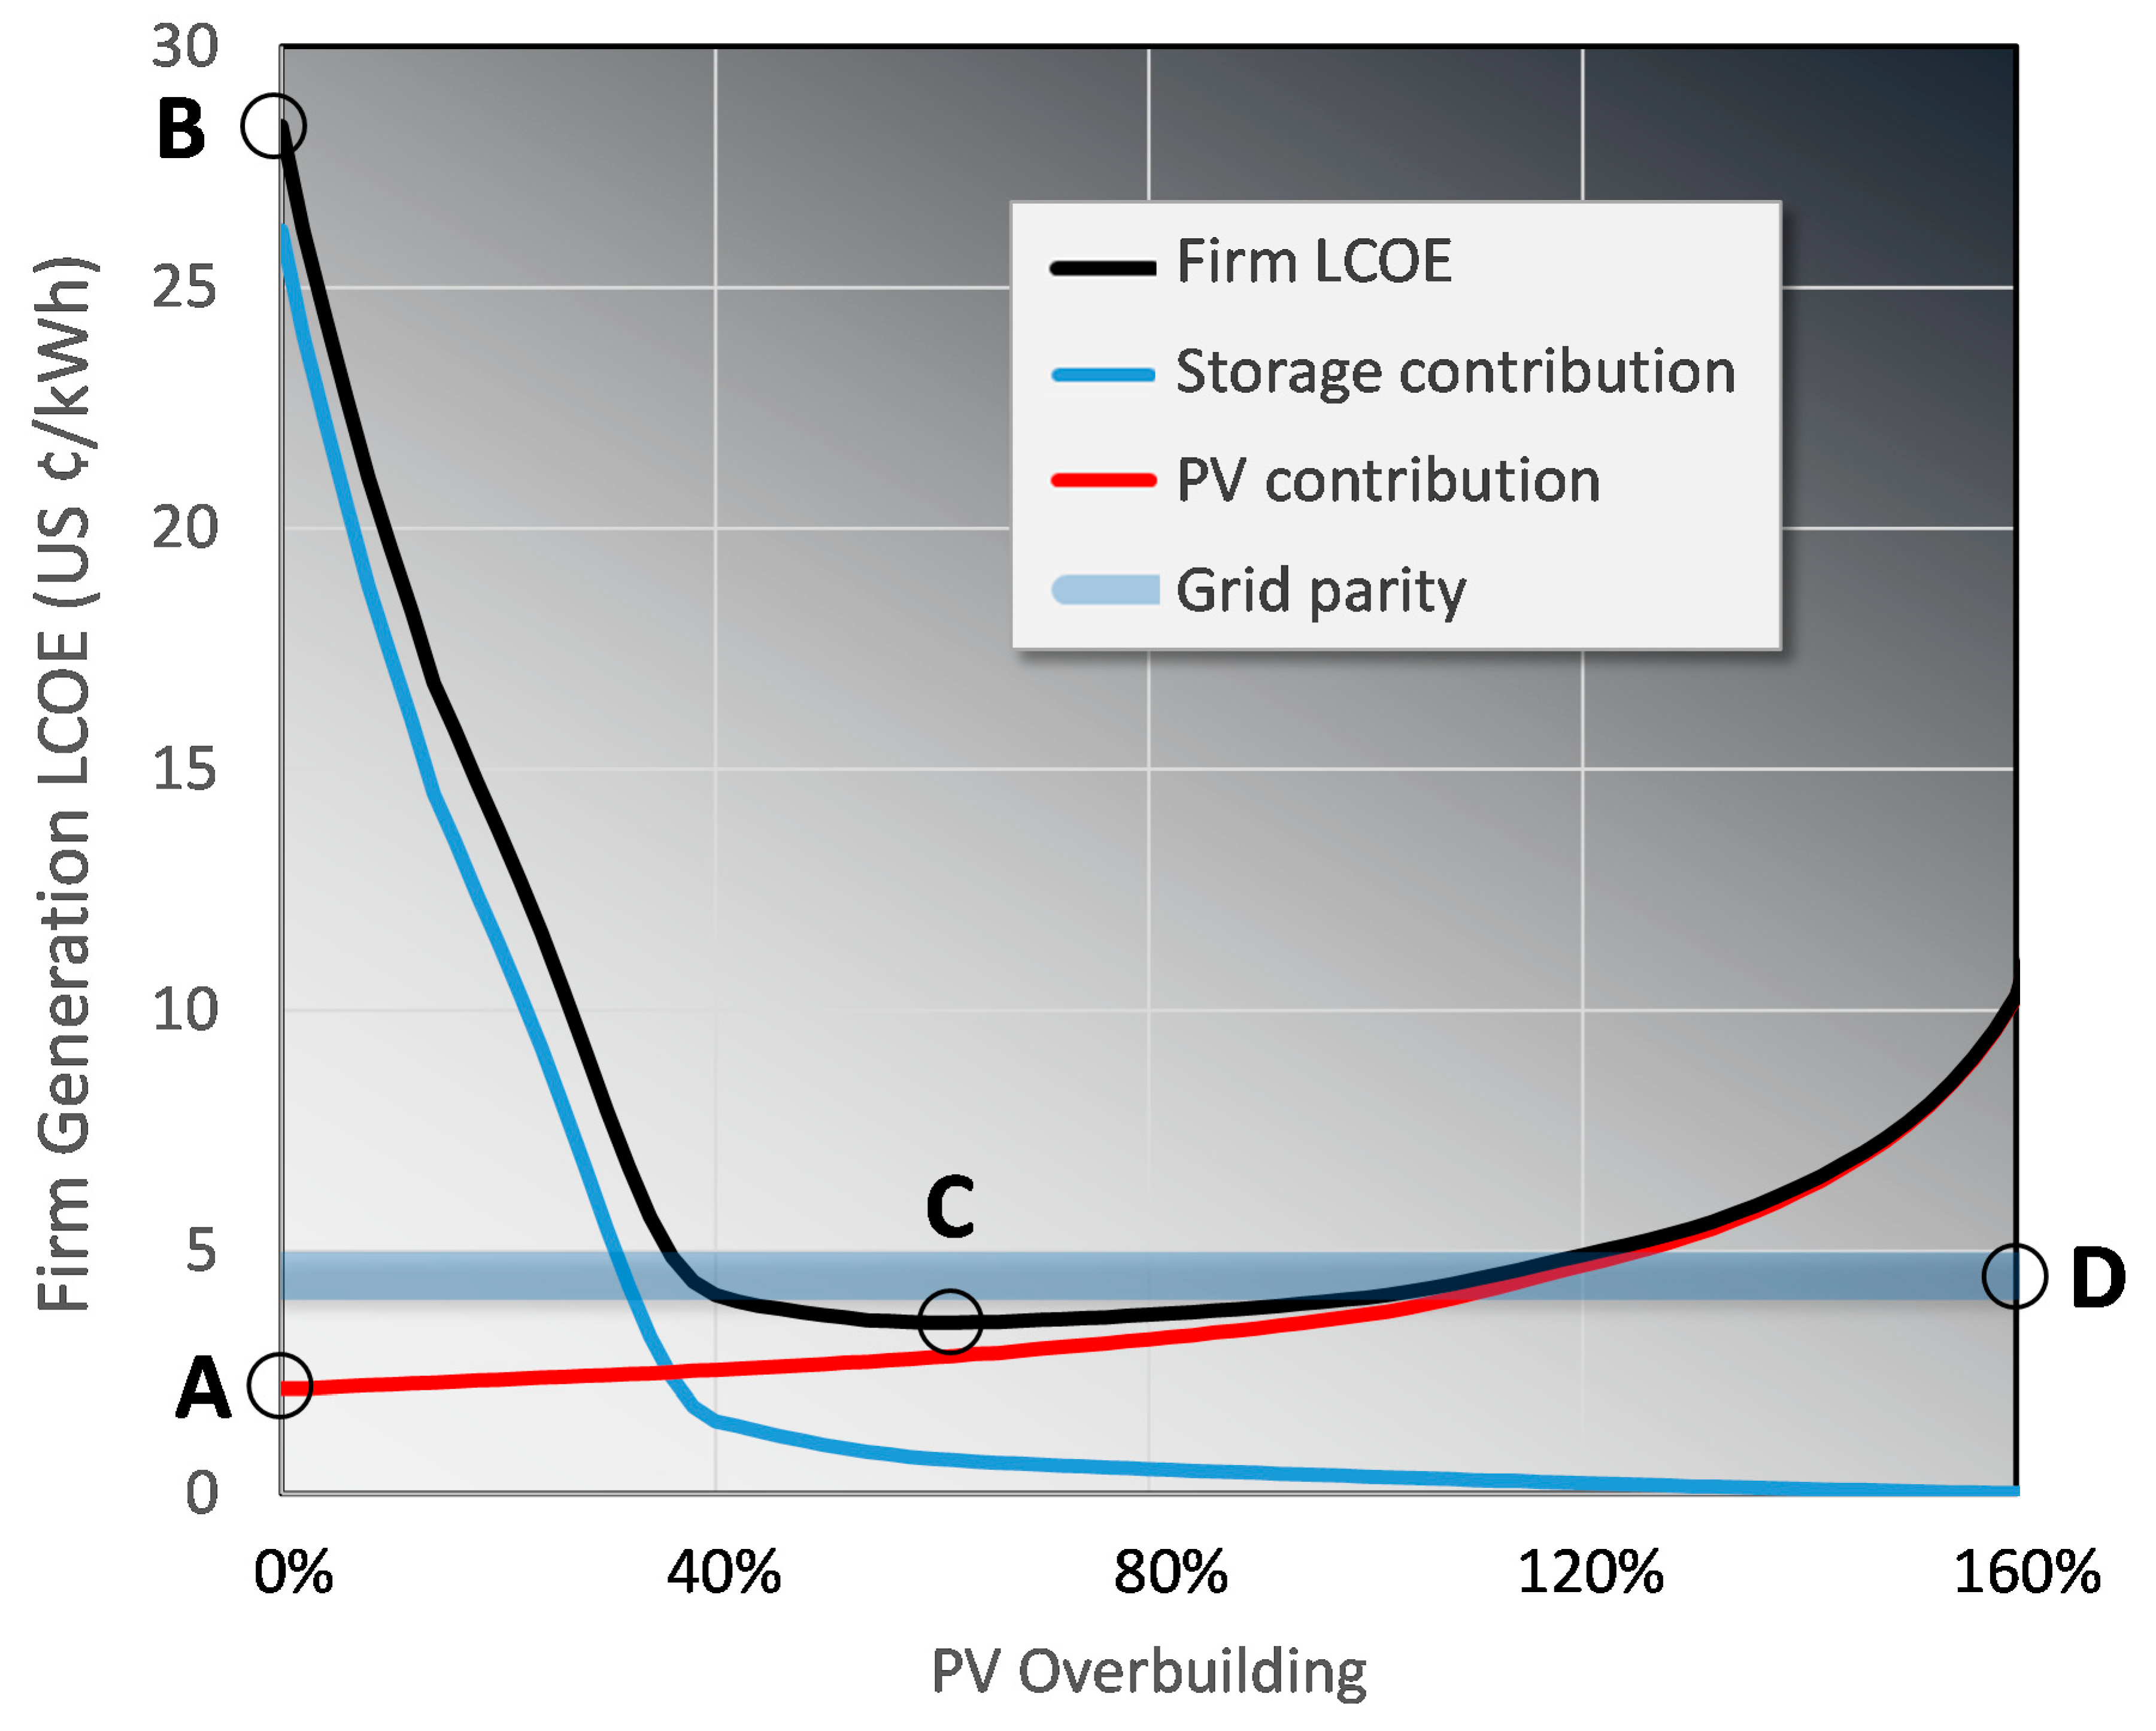
- Optimum overbuilding—quantified as a percentage above unconstrained PV capacity needed to meet energy requirements without curtailment.
- Additional CapEx from storage and overbuild requirements—quantified in $/kW.
- “Bottom line” LCOE of optimally configured PV—quantified in cents per [firm] kWh.
3. Results
3.1. Firm Forecasts
3.2. Firm Power Generation
3.3. Evolving Penetration
3.4. Regional and Fleet Configuration Trends
4. Conclusions
Author Contributions
Funding
Conflicts of Interest
Appendix A

| 1 h Forecasts | Current Technology Cost: PV @ $1000/kW, Storage @ $200/kWh | Future Technology Cost: PV @ $400/kW, Storage @ $50/kWh | |||||||||||||||||||||||
|---|---|---|---|---|---|---|---|---|---|---|---|---|---|---|---|---|---|---|---|---|---|---|---|---|---|
| No Flexibility | 2.5% Flexibility | 5% Flexibility | No Flexibility | 2.5% Flexibility | 5% Flexibility | ||||||||||||||||||||
| Electrical Region | Add’l $ per PVkW | Storage PV h | Over-Sizing | LCOE ¢/kWh | Add’l $ per PVkW | Storage PV h | Over-Sizing | LCOE ¢/kWh | Add’l $ per PVkW | Storage PV h | Over-Sizing | LCOE ¢/kWh | Add’l $ per PVkW | Storage PV h | Over-Sizing | LCOE ¢/kWh | Add’l $ per PVkW | Storage PV h | Over-Sizing | LCOE ¢/kWh | Add’l $ per PVkW | Storage PV h | Over-Sizing | LCOE ¢/kWh | |
| homogeneously dispersed fleets | Entire NYISO | 201 | 0.61 | 4% | 5.22 | 140 | 0.41 | 4% | 4.96 | 92 | 0.38 | 0% | 4.75 | 75 | 0.92 | 1% | 2.07 | 53 | 0.47 | 3% | 1.97 | 35 | 0.31 | 2% | 1.89 |
| Region A | 226 | 0.73 | 4% | 5.33 | 188 | 0.60 | 4% | 5.17 | 134 | 0.56 | −2% | 4.93 | 94 | 0.73 | 4% | 2.15 | 71 | 0.64 | 4% | 2.05 | 60 | 0.64 | 3% | 2.00 | |
| Region B | 236 | 0.84 | 3% | 5.37 | 194 | 0.71 | 3% | 5.20 | 161 | 0.67 | −2% | 5.05 | 91 | 0.84 | 3% | 2.14 | 70 | 0.71 | 3% | 2.05 | 60 | 0.78 | 1% | 2.00 | |
| Region C | 259 | 0.75 | 6% | 5.48 | 194 | 0.61 | 5% | 5.20 | 154 | 0.59 | 0% | 5.02 | 93 | 1.09 | 2% | 2.14 | 70 | 0.83 | 2% | 2.04 | 56 | 0.64 | 2% | 1.98 | |
| Region D | 228 | 0.60 | 6% | 5.34 | 156 | 0.47 | 4% | 5.03 | 119 | 0.42 | 2% | 4.87 | 87 | 1.16 | 1% | 2.12 | 60 | 0.53 | 3% | 2.00 | 44 | 0.42 | 2% | 1.93 | |
| Region E | 224 | 0.65 | 5% | 5.32 | 165 | 0.42 | 6% | 5.07 | 117 | 0.38 | 2% | 4.86 | 81 | 1.03 | 1% | 2.09 | 62 | 0.68 | 2% | 2.01 | 47 | 0.38 | 2% | 1.94 | |
| Region F | 228 | 0.36 | 10% | 5.34 | 169 | 0.39 | 5% | 5.09 | 110 | 0.34 | 1% | 4.83 | 100 | 1.20 | 2% | 2.18 | 71 | 0.53 | 5% | 2.05 | 51 | 0.29 | 3% | 1.96 | |
| Region G | 208 | 0.42 | 7% | 5.26 | 155 | 0.39 | 5% | 5.03 | 113 | 0.36 | 0% | 4.84 | 86 | 0.71 | 3% | 2.11 | 67 | 0.39 | 5% | 2.03 | 56 | 0.56 | 2% | 1.98 | |
| Region H | 300 | 0.77 | 3% | 5.65 | 249 | 0.66 | 3% | 5.43 | 197 | 0.61 | 0% | 5.21 | 106 | 1.29 | 2% | 2.20 | 97 | 1.00 | 4% | 2.16 | 87 | 0.71 | 6% | 2.12 | |
| Region I | 261 | 0.87 | 4% | 5.49 | 225 | 0.76 | 3% | 5.33 | 200 | 0.72 | 2% | 5.22 | 107 | 0.87 | 4% | 2.20 | 91 | 0.71 | 5% | 2.13 | 80 | 0.74 | 4% | 2.09 | |
| Region J | 225 | 0.69 | 4% | 5.33 | 189 | 0.58 | 3% | 5.17 | 156 | 0.50 | 3% | 5.03 | 96 | 0.69 | 4% | 2.16 | 80 | 0.53 | 5% | 2.09 | 61 | 0.59 | 2% | 2.01 | |
| Region K | 229 | 0.66 | 5% | 5.35 | 194 | 0.46 | 4% | 5.19 | 148 | 0.44 | 0% | 4.99 | 97 | 0.77 | 4% | 2.16 | 84 | 0.72 | 5% | 2.11 | 66 | 0.77 | 2% | 2.03 | |
| Individual locations | Region A | 291 | 0.88 | 6% | 5.62 | 251 | 0.77 | 6% | 5.44 | 224 | 0.70 | 2% | 5.32 | 124 | 0.88 | 6% | 2.28 | 100 | 0.88 | 5% | 2.17 | 89 | 0.78 | 5% | 2.13 |
| Region B | 280 | 0.89 | 5% | 5.57 | 245 | 0.73 | 5% | 5.41 | 216 | 0.63 | 5% | 5.29 | 113 | 0.98 | 4% | 2.23 | 104 | 0.69 | 7% | 2.19 | 91 | 0.88 | 2% | 2.14 | |
| Region C | 279 | 0.76 | 7% | 5.56 | 252 | 0.72 | 7% | 5.45 | 235 | 0.62 | 8% | 5.37 | 117 | 0.97 | 5% | 2.25 | 98 | 1.16 | 3% | 2.17 | 87 | 0.89 | 4% | 2.12 | |
| Region D | 265 | 0.92 | 4% | 5.50 | 234 | 0.88 | 3% | 5.37 | 201 | 0.72 | 3% | 5.22 | 101 | 1.03 | 3% | 2.18 | 84 | 0.88 | 3% | 2.11 | 74 | 0.72 | 3% | 2.06 | |
| Region E | 305 | 0.75 | 9% | 5.68 | 276 | 0.83 | 7% | 5.55 | 246 | 0.84 | 0% | 5.42 | 114 | 1.39 | 2% | 2.24 | 104 | 1.05 | 4% | 2.19 | 97 | 0.75 | 7% | 2.16 | |
| Region F | 277 | 0.82 | 6% | 5.55 | 259 | 0.56 | 5% | 5.48 | 227 | 0.58 | 2% | 5.34 | 115 | 0.90 | 5% | 2.24 | 102 | 0.93 | 5% | 2.18 | 96 | 0.82 | 6% | 2.16 | |
| Region G | 291 | 0.95 | 5% | 5.62 | 272 | 0.68 | 4% | 5.53 | 226 | 0.64 | 0% | 5.33 | 116 | 1.26 | 3% | 2.24 | 104 | 1.09 | 4% | 2.19 | 104 | 0.86 | 7% | 2.19 | |
| Region H | 326 | 0.92 | 8% | 5.77 | 280 | 0.76 | 3% | 5.57 | 230 | 0.70 | 0% | 5.35 | 116 | 1.45 | 2% | 2.25 | 105 | 1.27 | 3% | 2.20 | 97 | 1.19 | 3% | 2.16 | |
| Region I | 291 | 1.02 | 4% | 5.62 | 254 | 0.78 | 6% | 5.45 | 230 | 0.70 | 5% | 5.35 | 114 | 1.22 | 3% | 2.24 | 100 | 0.87 | 5% | 2.18 | 89 | 0.87 | 4% | 2.13 | |
| Region J | 270 | 0.99 | 2% | 5.52 | 234 | 0.74 | 5% | 5.37 | 203 | 0.72 | 2% | 5.23 | 104 | 1.01 | 3% | 2.19 | 92 | 0.84 | 4% | 2.14 | 74 | 0.83 | 2% | 2.06 | |
| Region K | 289 | 0.70 | 9% | 5.61 | 248 | 0.83 | 5% | 5.43 | 229 | 0.67 | 4% | 5.34 | 108 | 1.19 | 3% | 2.21 | 94 | 0.83 | 5% | 2.15 | 87 | 0.82 | 5% | 2.12 | |
| 1 h Forecasts | Current Technology Cost: PV @ $1000/kW, Storage @ $200/kWh | Future Technology Cost: PV @ $400/kW, Storage @ $50/kWh | |||||||||||||||||||||||
|---|---|---|---|---|---|---|---|---|---|---|---|---|---|---|---|---|---|---|---|---|---|---|---|---|---|
| No Flexibility | 2.5% flexibIlity | 5% Flexibility | No Flexibility | 2.5% Flexibility | 5% Flexibility | ||||||||||||||||||||
| Electrical Region | Add’l $ per PVkW | Storage PV h | Over-Sizing | LCOE ¢/kWh | Add’l $ per PVkW | Storage PV h | Over-Sizing | LCOE ¢/kWh | Add’l $ per PVkW | Storage PV h | Over-Sizing | LCOE ¢/kWh | Add’l $ per PVkW | Storage PV h | Over-Sizing | LCOE ¢/kWh | Add’l $ per PVkW | Storage PV h | Over-Sizing | LCOE ¢/kWh | Add’l $ per PVkW | Storage PV h | Over-Sizing | LCOE ¢/kWh | |
| homogeneously dispersed fleets | Entire NYISO | 585 | 0.88 | 27% | 6.89 | 472 | 0.74 | 23% | 6.40 | 383 | 0.58 | 21% | 6.02 | 278 | 2.01 | 26% | 2.95 | 210 | 1.39 | 23% | 2.65 | 164 | 0.63 | 25% | 2.45 |
| Region A | 733 | 1.62 | 15% | 7.54 | 616 | 1.58 | 8% | 7.03 | 512 | 1.51 | 3% | 6.58 | 368 | 1.53 | 29% | 3.34 | 292 | 3.93 | 12% | 3.01 | 220 | 2.45 | 14% | 2.70 | |
| Region B | 737 | 1.54 | 16% | 7.55 | 616 | 1.55 | 6% | 7.03 | 511 | 1.50 | 1% | 6.57 | 383 | 1.38 | 29% | 3.41 | 308 | 2.12 | 29% | 3.08 | 246 | 2.22 | 20% | 2.81 | |
| Region C | 690 | 1.14 | 25% | 7.35 | 577 | 1.11 | 19% | 6.86 | 480 | 1.05 | 15% | 6.44 | 343 | 1.79 | 28% | 3.23 | 270 | 1.53 | 26% | 2.92 | 220 | 1.13 | 28% | 2.70 | |
| Region D | 1164 | 3.19 | 28% | 9.41 | 1016 | 3.01 | 21% | 8.77 | 883 | 2.87 | 13% | 8.19 | 472 | 6.27 | 23% | 3.79 | 417 | 5.60 | 22% | 3.55 | 356 | 2.48 | 28% | 3.29 | |
| Region E | 757 | 1.37 | 29% | 7.64 | 620 | 1.01 | 29% | 7.05 | 517 | 0.87 | 25% | 6.60 | 338 | 2.73 | 26% | 3.21 | 277 | 1.77 | 29% | 2.94 | 229 | 1.89 | 21% | 2.74 | |
| Region F | 808 | 1.62 | 29% | 7.86 | 692 | 1.62 | 17% | 7.36 | 584 | 1.54 | 11% | 6.89 | 388 | 4.04 | 29% | 3.43 | 317 | 1.43 | 29% | 3.12 | 265 | 1.28 | 29% | 2.89 | |
| Region G | 794 | 1.94 | 24% | 7.80 | 683 | 1.92 | 18% | 7.32 | 604 | 1.75 | 17% | 6.98 | 321 | 2.56 | 29% | 3.13 | 270 | 1.95 | 29% | 2.92 | 233 | 1.60 | 25% | 2.75 | |
| Region H | 681 | 2.16 | 17% | 7.31 | 612 | 1.85 | 17% | 7.01 | 558 | 1.57 | 19% | 6.78 | 252 | 2.20 | 18% | 2.84 | 228 | 1.76 | 21% | 2.73 | 207 | 1.48 | 22% | 2.64 | |
| Region I | 663 | 2.03 | 15% | 7.23 | 572 | 1.70 | 16% | 6.84 | 510 | 1.34 | 19% | 6.57 | 246 | 2.36 | 15% | 2.81 | 217 | 1.78 | 18% | 2.68 | 194 | 1.67 | 15% | 2.59 | |
| Region J | 720 | 1.61 | 19% | 7.48 | 631 | 1.47 | 17% | 7.09 | 551 | 1.43 | 12% | 6.75 | 242 | 3.19 | 10% | 2.79 | 214 | 2.74 | 11% | 2.67 | 207 | 2.41 | 14% | 2.64 | |
| Region K | 672 | 2.03 | 21% | 7.27 | 590 | 1.82 | 19% | 6.92 | 518 | 1.66 | 16% | 6.60 | 240 | 2.35 | 18% | 2.78 | 201 | 2.39 | 13% | 2.61 | 173 | 1.66 | 16% | 2.49 | |
| Individual locations | Region A | 1056 | 2.71 | 29% | 8.94 | 977 | 2.52 | 29% | 8.60 | 903 | 2.32 | 29% | 8.28 | 421 | 4.93 | 23% | 3.57 | 361 | 3.41 | 29% | 3.31 | 342 | 3.34 | 29% | 3.23 |
| Region B | 935 | 2.43 | 16% | 8.42 | 827 | 2.23 | 16% | 7.95 | 738 | 2.04 | 16% | 7.56 | 453 | 3.83 | 27% | 3.71 | 376 | 3.41 | 24% | 3.38 | 327 | 3.34 | 23% | 3.16 | |
| Region C | 972 | 2.41 | 18% | 8.58 | 838 | 2.34 | 7% | 8.00 | 712 | 2.24 | 0% | 7.45 | 426 | 3.69 | 29% | 3.59 | 350 | 3.72 | 20% | 3.26 | 305 | 3.18 | 20% | 3.07 | |
| Region D | 1425 | 3.82 | 29% | 10.55 | 1276 | 3.48 | 29% | 9.90 | 1145 | 3.29 | 24% | 9.33 | 594 | 8.43 | 29% | 4.32 | 543 | 7.86 | 29% | 4.10 | 486 | 7.03 | 27% | 3.85 | |
| Region E | 829 | 1.83 | 27% | 7.95 | 737 | 1.59 | 29% | 7.56 | 671 | 1.40 | 29% | 7.27 | 389 | 1.87 | 28% | 3.43 | 323 | 1.75 | 28% | 3.14 | 280 | 1.54 | 29% | 2.96 | |
| Region F | 1027 | 2.47 | 28% | 8.82 | 930 | 2.25 | 29% | 8.40 | 846 | 2.26 | 20% | 8.03 | 378 | 4.03 | 29% | 3.38 | 326 | 3.26 | 29% | 3.16 | 300 | 2.84 | 27% | 3.05 | |
| Region G | 983 | 3.14 | 10% | 8.63 | 887 | 2.96 | 15% | 8.21 | 827 | 2.75 | 19% | 7.95 | 381 | 3.85 | 26% | 3.40 | 330 | 3.12 | 27% | 3.18 | 290 | 2.76 | 25% | 3.00 | |
| Region H | 805 | 2.49 | 14% | 7.85 | 705 | 2.20 | 20% | 7.41 | 658 | 2.02 | 20% | 7.21 | 285 | 2.78 | 19% | 2.98 | 250 | 2.20 | 21% | 2.83 | 232 | 1.98 | 22% | 2.75 | |
| Region I | 705 | 2.15 | 15% | 7.42 | 635 | 1.87 | 16% | 7.11 | 580 | 1.59 | 18% | 6.87 | 268 | 2.90 | 15% | 2.91 | 242 | 2.47 | 17% | 2.79 | 223 | 2.08 | 19% | 2.71 | |
| Region J | 819 | 3.18 | 13% | 7.91 | 739 | 2.12 | 10% | 7.56 | 660 | 2.10 | 1% | 7.22 | 264 | 3.18 | 13% | 2.89 | 250 | 2.94 | 15% | 2.83 | 238 | 2.68 | 17% | 2.78 | |
| Region K | 1129 | 3.37 | 22% | 9.26 | 1024 | 3.14 | 19% | 8.80 | 925 | 3.03 | 11% | 8.37 | 476 | 3.20 | 29% | 3.81 | 425 | 2.89 | 29% | 3.59 | 381 | 2.59 | 29% | 3.40 | |
| 1 Hour Forecasts | Current Technology Cost: PV @ $1000/kW, Storage @ $200/kWh | Future Technology Cost: PV @ $400/kW, Storage @ $50/kWh | |||||||||||||||||||||||
|---|---|---|---|---|---|---|---|---|---|---|---|---|---|---|---|---|---|---|---|---|---|---|---|---|---|
| No Flexibility | 2.5% Flexibility | 5% Flexibility | No Flexibility | 2.5% Flexibility | 5% Flexibility | ||||||||||||||||||||
| Electrical Region | Add’l $ per PVkW | Storage PV h | Over-Sizing | LCOE ¢/kWh | Add’l $ per PVkW | Storage PV h | Over-Sizing | LCOE ¢/kWh | Add’l $ per PVkW | Storage PV h | Over-Sizing | LCOE ¢/kWh | Add’l $ per PVkW | Storage PV h | Over-Sizing | LCOE ¢/kWh | Add’l $ per PVkW | Storage PV h | Over-Sizing | LCOE ¢/kWh | Add’l $ per PVkW | Storage PV h | Over-Sizing | LCOE ¢/kWh | |
| homogeneously dispersed fleets | Entire NYISO | 522 | 1.22 | 7% | 6.62 | 382 | 1.12 | 1% | 6.01 | 274 | 1.00 | 0% | 5.54 | 275 | 1.00 | 21% | 2.93 | 193 | 0.95 | 12% | 2.58 | 132 | 0.93 | 3% | 2.31 |
| Region A | 640 | 1.61 | 4% | 7.13 | 492 | 1.44 | 0% | 6.49 | 368 | 1.22 | 0% | 5.95 | 339 | 1.38 | 24% | 3.22 | 257 | 1.25 | 15% | 2.86 | 189 | 1.13 | 6% | 2.56 | |
| Region B | 629 | 1.60 | 5% | 7.09 | 485 | 1.44 | 0% | 6.46 | 363 | 1.22 | 0% | 5.93 | 337 | 1.45 | 19% | 3.21 | 252 | 1.29 | 13% | 2.84 | 186 | 1.15 | 5% | 2.55 | |
| Region C | 612 | 1.44 | 6% | 7.01 | 472 | 1.34 | 0% | 6.40 | 356 | 1.17 | 0% | 5.90 | 330 | 1.16 | 27% | 3.18 | 250 | 1.12 | 15% | 2.83 | 185 | 1.06 | 6% | 2.55 | |
| Region D | 749 | 1.59 | 25% | 7.61 | 604 | 1.65 | 12% | 6.98 | 479 | 1.69 | 0% | 6.43 | 349 | 2.77 | 27% | 3.26 | 278 | 2.24 | 25% | 2.95 | 212 | 1.34 | 13% | 2.66 | |
| Region E | 609 | 1.45 | 6% | 7.00 | 464 | 1.36 | 0% | 6.37 | 350 | 1.21 | 0% | 5.87 | 325 | 1.24 | 21% | 3.16 | 239 | 1.15 | 14% | 2.78 | 173 | 1.11 | 5% | 2.49 | |
| Region F | 587 | 1.11 | 16% | 6.91 | 454 | 0.96 | 12% | 6.33 | 344 | 0.86 | 7% | 5.84 | 321 | 1.04 | 23% | 3.14 | 237 | 0.92 | 14% | 2.77 | 173 | 0.76 | 10% | 2.49 | |
| Region G | 624 | 1.61 | 12% | 7.06 | 502 | 1.44 | 7% | 6.53 | 393 | 1.37 | 0% | 6.06 | 304 | 1.46 | 21% | 3.06 | 237 | 1.31 | 15% | 2.77 | 185 | 1.27 | 4% | 2.54 | |
| Region H | 697 | 2.41 | 2% | 7.38 | 593 | 2.21 | 0% | 6.93 | 508 | 2.01 | 0% | 6.56 | 302 | 2.40 | 12% | 3.06 | 249 | 2.15 | 9% | 2.82 | 210 | 1.89 | 7% | 2.65 | |
| Region I | 693 | 2.20 | 10% | 7.37 | 594 | 2.17 | 0% | 6.93 | 506 | 1.94 | 0% | 6.55 | 298 | 2.30 | 13% | 3.04 | 245 | 1.92 | 15% | 2.81 | 214 | 1.69 | 16% | 2.67 | |
| Region J | 585 | 1.79 | 4% | 6.89 | 465 | 1.63 | 0% | 6.37 | 375 | 1.40 | 0% | 5.98 | 253 | 1.92 | 15% | 2.84 | 211 | 1.56 | 17% | 2.66 | 172 | 1.36 | 3% | 2.49 | |
| Region K | 579 | 1.51 | 19% | 6.87 | 479 | 1.62 | 2% | 6.44 | 382 | 1.48 | 0% | 6.01 | 233 | 2.36 | 10% | 2.75 | 186 | 1.83 | 12% | 2.55 | 156 | 1.24 | 10% | 2.42 | |
| Individual locations | Region A | 768 | 1.77 | 8% | 7.69 | 633 | 1.57 | 6% | 7.10 | 516 | 1.43 | 0% | 6.59 | 428 | 4.62 | 27% | 3.60 | 352 | 1.42 | 20% | 3.27 | 283 | 1.30 | 12% | 2.97 |
| Region B | 755 | 1.97 | 7% | 7.64 | 626 | 1.80 | 4% | 7.07 | 512 | 1.69 | 0% | 6.58 | 404 | 1.54 | 23% | 3.50 | 325 | 1.45 | 17% | 3.15 | 258 | 1.36 | 11% | 2.86 | |
| Region C | 786 | 1.87 | 10% | 7.77 | 653 | 1.65 | 8% | 7.19 | 532 | 1.64 | 0% | 6.66 | 418 | 1.97 | 25% | 3.56 | 339 | 1.93 | 14% | 3.21 | 273 | 1.77 | 10% | 2.93 | |
| Region D | 791 | 1.85 | 20% | 7.79 | 676 | 1.85 | 7% | 7.29 | 570 | 1.84 | 0% | 6.83 | 365 | 2.21 | 29% | 3.33 | 302 | 1.63 | 29% | 3.06 | 256 | 1.87 | 29% | 2.85 | |
| Region E | 671 | 1.46 | 7% | 7.27 | 554 | 1.42 | 1% | 6.76 | 450 | 1.31 | 0% | 6.31 | 400 | 1.32 | 18% | 3.48 | 317 | 1.39 | 12% | 3.12 | 254 | 1.26 | 12% | 2.84 | |
| Region F | 732 | 1.90 | 10% | 7.53 | 603 | 1.82 | 1% | 6.97 | 482 | 1.63 | 0% | 6.45 | 372 | 1.52 | 27% | 3.36 | 304 | 1.38 | 21% | 3.06 | 245 | 1.67 | 4% | 2.81 | |
| Region G | 684 | 1.71 | 7% | 7.33 | 565 | 1.51 | 4% | 6.81 | 454 | 1.40 | 0% | 6.33 | 330 | 3.33 | 13% | 3.18 | 274 | 2.64 | 14% | 2.93 | 228 | 1.92 | 16% | 2.73 | |
| Region H | 749 | 2.20 | 8% | 7.61 | 640 | 2.13 | −2% | 7.13 | 540 | 1.91 | 0% | 6.70 | 317 | 2.71 | 16% | 3.12 | 276 | 3.17 | 10% | 2.94 | 237 | 2.74 | 10% | 2.77 | |
| Region I | 700 | 2.38 | 9% | 7.39 | 627 | 2.31 | 0% | 7.08 | 542 | 2.09 | 0% | 6.71 | 283 | 2.54 | 11% | 2.97 | 237 | 2.12 | 12% | 2.77 | 209 | 2.19 | 10% | 2.65 | |
| Region J | 600 | 1.81 | 1% | 6.96 | 483 | 1.61 | 0% | 6.45 | 394 | 1.39 | 0% | 6.06 | 275 | 2.20 | 15% | 2.94 | 231 | 1.86 | 16% | 2.74 | 194 | 1.35 | 3% | 2.58 | |
| Region K | 686 | 2.17 | 9% | 7.33 | 604 | 1.94 | 9% | 6.98 | 532 | 1.91 | 0% | 6.66 | 303 | 2.53 | 15% | 3.06 | 255 | 1.87 | 14% | 2.85 | 219 | 1.70 | 10% | 2.69 | |
| 3 h Forecasts | Current Technology Cost: PV @ $1000/kW, Storage @ $200/kWh | Future Technology Cost: PV @ $400/kW, Storage @ $50/kWh | |||||||||||||||||||||||
|---|---|---|---|---|---|---|---|---|---|---|---|---|---|---|---|---|---|---|---|---|---|---|---|---|---|
| No Flexibility | 2.5% Flexibility | 5% Flexibility | No Flexibility | 2.5% Flexibility | 5% Flexibility | ||||||||||||||||||||
| Electrical Region | Add’l $ per PVkW | Storage PV h | Over-Sizing | LCOE ¢/kWh | Add’l $ per PVkW | Storage PV h | Over-Sizing | LCOE ¢/kWh | Add’l $ per PVkW | Storage PV h | Over-Sizing | LCOE ¢/kWh | Add’l $ per PVkW | Storage PV h | Over-Sizing | LCOE ¢/kWh | Add’l $ per PVkW | Storage PV h | Over-Sizing | LCOE ¢/kWh | Add’l $ per PVkW | Storage PV h | Over-Sizing | LCOE ¢/kWh | |
| homogeneously dispersed fleets | Entire NYISO | 486 | 1.90 | 3% | 6.46 | 435 | 1.73 | 3% | 6.24 | 386 | 1.56 | 3% | 6.03 | 182 | 2.09 | 2% | 2.53 | 156 | 1.73 | 3% | 2.42 | 134 | 1.56 | 3% | 1.90 |
| Region A | 584 | 2.30 | 4% | 6.89 | 566 | 2.13 | 7% | 6.81 | 538 | 2.11 | 0% | 6.69 | 209 | 2.39 | 3% | 2.65 | 184 | 2.61 | 1% | 2.54 | 169 | 2.64 | 0% | 1.71 | |
| Region B | 618 | 2.66 | 2% | 7.04 | 589 | 2.51 | 3% | 6.91 | 564 | 2.38 | 4% | 6.80 | 208 | 2.66 | 2% | 2.64 | 195 | 2.51 | 3% | 2.59 | 183 | 2.38 | 4% | 1.97 | |
| Region C | 676 | 2.78 | 4% | 7.29 | 632 | 2.27 | 10% | 7.10 | 597 | 2.09 | 12% | 6.95 | 230 | 2.89 | 3% | 2.74 | 213 | 2.70 | 4% | 2.67 | 198 | 2.67 | 4% | 1.99 | |
| Region D | 578 | 2.55 | 1% | 6.86 | 496 | 2.12 | 2% | 6.51 | 429 | 1.84 | 2% | 6.22 | 184 | 2.69 | 0% | 2.54 | 166 | 2.12 | 2% | 2.46 | 142 | 1.84 | 2% | 1.91 | |
| Region E | 581 | 2.64 | 0% | 6.88 | 490 | 2.08 | 2% | 6.48 | 429 | 1.83 | 2% | 6.21 | 184 | 2.87 | −1% | 2.54 | 163 | 2.77 | −2% | 2.45 | 142 | 1.83 | 2% | 1.92 | |
| Region F | 540 | 1.86 | 7% | 6.70 | 477 | 1.65 | 7% | 6.42 | 420 | 1.51 | 6% | 6.18 | 195 | 2.38 | 2% | 2.59 | 173 | 2.17 | 2% | 2.49 | 153 | 1.78 | 3% | 1.93 | |
| Region G | 496 | 1.52 | 8% | 6.51 | 434 | 1.33 | 8% | 6.24 | 381 | 1.16 | 7% | 6.01 | 211 | 2.81 | 1% | 2.66 | 182 | 2.42 | 1% | 2.53 | 152 | 2.17 | 0% | 1.71 | |
| Region H | 598 | 1.56 | 15% | 6.95 | 558 | 1.69 | 12% | 6.78 | 508 | 1.78 | 8% | 6.56 | 247 | 3.40 | 2% | 2.81 | 214 | 2.96 | 2% | 2.67 | 183 | 2.72 | 1% | 1.71 | |
| Region I | 595 | 2.25 | 5% | 6.94 | 560 | 2.10 | 6% | 6.79 | 523 | 1.99 | 6% | 6.62 | 227 | 2.25 | 5% | 2.73 | 196 | 2.61 | 2% | 2.59 | 173 | 2.35 | 2% | 1.71 | |
| Region J | 511 | 1.66 | 7% | 6.57 | 469 | 1.56 | 7% | 6.39 | 444 | 1.52 | 7% | 6.28 | 215 | 1.76 | 6% | 2.68 | 190 | 2.03 | 4% | 2.57 | 171 | 1.91 | 4% | 1.71 | |
| Region K | 555 | 2.08 | 5% | 6.77 | 486 | 1.63 | 8% | 6.46 | 417 | 1.50 | 6% | 6.16 | 205 | 2.39 | 3% | 2.63 | 181 | 2.03 | 4% | 2.53 | 153 | 1.58 | 5% | 1.71 | |
| Individual locations | Region A | 708 | 2.93 | 4% | 7.43 | 666 | 2.67 | 6% | 7.25 | 640 | 2.24 | 12% | 7.14 | 240 | 3.05 | 3% | 2.78 | 228 | 2.92 | 4% | 2.73 | 218 | 2.60 | 7% | 1.71 |
| Region B | 649 | 2.54 | 5% | 7.17 | 602 | 2.31 | 6% | 6.97 | 563 | 2.19 | 6% | 6.80 | 238 | 3.64 | 0% | 2.78 | 219 | 2.47 | 5% | 2.69 | 197 | 2.30 | 5% | 1.71 | |
| Region C | 669 | 2.75 | 4% | 7.26 | 642 | 2.55 | 6% | 7.14 | 625 | 2.47 | 7% | 7.07 | 233 | 2.75 | 4% | 2.75 | 223 | 2.55 | 6% | 2.71 | 212 | 2.47 | 7% | 1.71 | |
| Region D | 623 | 2.45 | 5% | 7.06 | 575 | 2.28 | 5% | 6.85 | 521 | 2.12 | 4% | 6.62 | 224 | 2.60 | 4% | 2.72 | 200 | 2.38 | 4% | 2.61 | 179 | 2.12 | 4% | 1.71 | |
| Region E | 666 | 2.96 | 1% | 7.25 | 614 | 2.67 | 2% | 7.02 | 563 | 2.33 | 4% | 6.80 | 214 | 3.18 | 0% | 2.67 | 201 | 2.67 | 2% | 2.61 | 187 | 2.43 | 3% | 1.71 | |
| Region F | 532 | 1.84 | 6% | 6.66 | 482 | 1.74 | 5% | 6.45 | 430 | 1.61 | 4% | 6.22 | 204 | 2.36 | 2% | 2.63 | 182 | 2.10 | 2% | 2.53 | 158 | 1.77 | 2% | 1.94 | |
| Region G | 594 | 1.86 | 10% | 6.94 | 539 | 1.69 | 10% | 6.69 | 506 | 1.56 | 11% | 6.55 | 251 | 2.08 | 8% | 2.83 | 225 | 1.69 | 10% | 2.72 | 205 | 3.28 | −1% | 2.00 | |
| Region H | 779 | 1.92 | 7% | 7.74 | 693 | 1.85 | 3% | 7.36 | 611 | 1.75 | 2% | 7.01 | 293 | 5.14 | −1% | 3.02 | 269 | 4.74 | −1% | 2.91 | 238 | 4.05 | 0% | 2.05 | |
| Region I | 624 | 2.24 | 7% | 7.06 | 575 | 2.18 | 6% | 6.85 | 548 | 1.99 | 8% | 6.73 | 246 | 2.24 | 7% | 2.81 | 212 | 2.18 | 6% | 2.66 | 201 | 2.11 | 7% | 2.00 | |
| Region J | 576 | 2.06 | 6% | 6.85 | 538 | 1.96 | 5% | 6.69 | 499 | 1.85 | 5% | 6.52 | 231 | 2.06 | 6% | 2.75 | 210 | 2.04 | 6% | 2.65 | 189 | 1.82 | 7% | 1.71 | |
| Region K | 768 | 1.68 | 28% | 7.69 | 748 | 2.64 | 13% | 7.60 | 668 | 1.91 | −2% | 7.26 | 268 | 3.13 | 6% | 2.90 | 254 | 3.08 | 7% | 2.84 | 242 | 2.85 | 9% | 2.06 | |
| 3 h Forecasts | Current Technology Cost: PV @ $1000/kW, Storage @ $200/kWh | Future Technology Cost: PV @ $400/kW, Storage @ $50/kWh | |||||||||||||||||||||||
|---|---|---|---|---|---|---|---|---|---|---|---|---|---|---|---|---|---|---|---|---|---|---|---|---|---|
| No Flexibility | 2.5% Flexibility | 5% Flexibility | No Flexibility | 2.5% Flexibility | 5% Flexibility | ||||||||||||||||||||
| Electrical Region | Add’l $ per PVkW | Storage PV h | Over-Sizing | LCOE ¢/kWh | Add’l $ per PVkW | Storage PV h | Over-Sizing | LCOE ¢/kWh | Add’l $ per PVkW | Storage PV h | Over-Sizing | LCOE ¢/kWh | Add’l $ per PVkW | Storage PV h | Over-Sizing | LCOE ¢/kWh | Add’l $ per PVkW | Storage PV h | Over-Sizing | LCOE ¢/kWh | Add’l $ per PVkW | Storage PV h | Over-Sizing | LCOE ¢/kWh | |
| homogeneously dispersed fleets | Entire NYISO | 564 | 0.73 | 29% | 6.81 | 462 | 0.56 | 27% | 6.36 | 379 | 0.45 | 24% | 6.00 | 271 | 1.74 | 28% | 2.92 | 204 | 1.17 | 25% | 2.63 | 160 | 0.50 | 26% | 1.94 |
| Region A | 787 | 1.83 | 20% | 7.77 | 665 | 1.70 | 15% | 7.24 | 557 | 1.64 | 7% | 6.77 | 379 | 1.67 | 28% | 3.39 | 302 | 1.53 | 24% | 3.06 | 230 | 2.55 | 15% | 1.71 | |
| Region B | 819 | 1.92 | 19% | 7.91 | 700 | 1.80 | 15% | 7.40 | 593 | 1.83 | 4% | 6.93 | 391 | 2.32 | 29% | 3.44 | 311 | 2.10 | 29% | 3.09 | 248 | 2.18 | 21% | 2.07 | |
| Region C | 751 | 1.60 | 22% | 7.62 | 644 | 1.53 | 18% | 7.15 | 545 | 1.64 | 3% | 6.72 | 344 | 1.89 | 29% | 3.24 | 271 | 1.43 | 29% | 2.92 | 224 | 1.26 | 28% | 2.03 | |
| Region D | 1150 | 3.09 | 29% | 9.35 | 1005 | 2.92 | 22% | 8.72 | 870 | 2.80 | 13% | 8.13 | 467 | 6.12 | 24% | 3.77 | 411 | 5.52 | 22% | 3.53 | 354 | 2.43 | 27% | 2.22 | |
| Region E | 751 | 1.36 | 29% | 7.62 | 615 | 1.00 | 29% | 7.03 | 512 | 0.82 | 26% | 6.58 | 329 | 2.68 | 26% | 3.17 | 272 | 1.83 | 28% | 2.92 | 226 | 1.69 | 23% | 2.03 | |
| Region F | 802 | 1.59 | 29% | 7.84 | 690 | 1.53 | 21% | 7.35 | 586 | 1.51 | 12% | 6.90 | 389 | 1.61 | 29% | 3.43 | 315 | 1.38 | 29% | 3.11 | 262 | 1.21 | 29% | 2.09 | |
| Region G | 818 | 1.97 | 26% | 7.91 | 705 | 2.00 | 18% | 7.42 | 627 | 1.74 | 20% | 7.08 | 336 | 2.71 | 29% | 3.20 | 286 | 1.99 | 29% | 2.98 | 244 | 1.57 | 26% | 1.71 | |
| Region H | 828 | 2.37 | 15% | 7.95 | 722 | 2.09 | 15% | 7.49 | 636 | 1.93 | 11% | 7.12 | 291 | 3.05 | 19% | 3.01 | 261 | 2.50 | 21% | 2.87 | 234 | 2.00 | 23% | 1.71 | |
| Region I | 735 | 2.46 | 15% | 7.55 | 650 | 2.10 | 12% | 7.18 | 576 | 1.80 | 11% | 6.86 | 265 | 2.65 | 17% | 2.89 | 238 | 2.11 | 20% | 2.77 | 216 | 1.78 | 21% | 1.71 | |
| Region J | 758 | 1.88 | 14% | 7.65 | 667 | 1.81 | 9% | 7.25 | 582 | 1.78 | 2% | 6.88 | 258 | 3.24 | 13% | 2.86 | 231 | 2.92 | 13% | 2.74 | 220 | 2.53 | 16% | 1.71 | |
| Region K | 693 | 2.27 | 19% | 7.36 | 613 | 2.05 | 17% | 7.02 | 559 | 1.77 | 18% | 6.78 | 239 | 2.27 | 19% | 2.78 | 200 | 2.22 | 15% | 2.61 | 184 | 1.86 | 17% | 1.71 | |
| Individual locations | Region A | 1063 | 2.71 | 29% | 8.97 | 982 | 2.52 | 29% | 8.62 | 910 | 2.32 | 29% | 8.31 | 418 | 4.32 | 28% | 3.56 | 371 | 3.68 | 29% | 3.35 | 347 | 3.47 | 29% | 1.71 |
| Region B | 977 | 2.66 | 15% | 8.60 | 871 | 2.42 | 17% | 8.14 | 785 | 2.17 | 20% | 7.76 | 464 | 3.90 | 29% | 3.76 | 383 | 3.41 | 26% | 3.40 | 328 | 3.33 | 26% | 1.71 | |
| Region C | 996 | 2.61 | 12% | 8.68 | 863 | 2.40 | 8% | 8.10 | 738 | 2.30 | 0% | 7.56 | 447 | 4.59 | 26% | 3.69 | 382 | 4.42 | 20% | 3.40 | 338 | 3.90 | 20% | 1.71 | |
| Region D | 1440 | 3.86 | 29% | 10.61 | 1296 | 3.53 | 29% | 9.99 | 1164 | 3.19 | 29% | 9.41 | 592 | 8.19 | 29% | 4.31 | 531 | 7.38 | 29% | 4.05 | 478 | 6.70 | 29% | 1.71 | |
| Region E | 826 | 1.83 | 28% | 7.94 | 738 | 1.62 | 29% | 7.56 | 673 | 1.40 | 29% | 7.28 | 376 | 2.01 | 29% | 3.38 | 316 | 1.86 | 29% | 3.11 | 285 | 1.66 | 29% | 1.71 | |
| Region F | 1021 | 2.52 | 29% | 8.79 | 932 | 2.38 | 29% | 8.40 | 872 | 2.24 | 29% | 8.14 | 388 | 3.43 | 29% | 3.43 | 345 | 3.01 | 29% | 3.24 | 317 | 3.00 | 29% | 2.16 | |
| Region G | 988 | 3.08 | 14% | 8.65 | 893 | 2.90 | 15% | 8.23 | 832 | 2.72 | 17% | 7.97 | 398 | 3.93 | 29% | 3.47 | 350 | 3.35 | 29% | 3.26 | 308 | 2.80 | 29% | 2.15 | |
| Region H | 831 | 2.50 | 15% | 7.97 | 727 | 2.22 | 20% | 7.51 | 684 | 1.95 | 25% | 7.33 | 299 | 2.89 | 22% | 3.04 | 261 | 2.14 | 25% | 2.87 | 242 | 1.95 | 25% | 2.06 | |
| Region I | 772 | 2.06 | 15% | 7.71 | 681 | 1.78 | 16% | 7.31 | 608 | 1.60 | 14% | 6.99 | 286 | 3.13 | 17% | 2.98 | 263 | 2.65 | 20% | 2.88 | 251 | 2.51 | 21% | 2.07 | |
| Region J | 842 | 2.25 | 13% | 8.01 | 758 | 2.08 | 12% | 7.65 | 675 | 2.06 | 0% | 7.28 | 276 | 3.44 | 14% | 2.94 | 260 | 3.00 | 17% | 2.87 | 247 | 2.70 | 19% | 1.71 | |
| Region K | 1153 | 3.30 | 28% | 9.36 | 1049 | 3.14 | 22% | 8.91 | 946 | 3.04 | 14% | 8.47 | 488 | 3.28 | 29% | 3.86 | 434 | 2.97 | 29% | 3.63 | 389 | 2.67 | 29% | 2.27 | |
| 3 h Forecasts | Current Technology Cost: PV @ $1000/kW, Storage @ $200/kWh | Future Technology Cost: PV @ $400/kW, Storage @ $50/kWh | |||||||||||||||||||||||
|---|---|---|---|---|---|---|---|---|---|---|---|---|---|---|---|---|---|---|---|---|---|---|---|---|---|
| No Flexibility | 2.5% Flexibility | 5% Flexibility | No Flexibility | 2.5% Flexibility | 5% Flexibility | ||||||||||||||||||||
| Electrical Region | Add’l $ per PVkW | Storage PV h | Over-Sizing | LCOE ¢/kWh | Add’l $ per PVkW | Storage PV h | Over-Sizing | LCOE ¢/kWh | Add’l $ per PVkW | Storage PV h | Over-Sizing | LCOE ¢/kWh | Add’l $ per PVkW | Storage PV h | Over-Sizing | LCOE ¢/kWh | Add’l $ per PVkW | Storage PV h | Over-Sizing | LCOE ¢/kWh | Add’l $ per PVkW | Storage PV h | Over-Sizing | LCOE ¢/kWh | |
| homogeneously dispersed fleets | Entire NYISO | 501 | 0.96 | 15% | 6.53 | 367 | 0.83 | 10% | 5.95 | 257 | 0.89 | 0% | 5.47 | 265 | 0.85 | 21% | 2.89 | 182 | 0.75 | 13% | 2.53 | 122 | 0.70 | 6% | 1.89 |
| Region A | 641 | 1.62 | 3% | 7.14 | 493 | 1.44 | 0% | 6.49 | 370 | 1.22 | 0% | 5.96 | 340 | 1.37 | 25% | 3.22 | 259 | 1.24 | 16% | 2.87 | 191 | 1.12 | 7% | 1.71 | |
| Region B | 631 | 1.61 | 4% | 7.09 | 487 | 1.44 | 0% | 6.47 | 366 | 1.22 | 0% | 5.94 | 339 | 1.43 | 21% | 3.21 | 255 | 1.30 | 12% | 2.85 | 188 | 1.14 | 6% | 1.98 | |
| Region C | 593 | 1.43 | 3% | 6.93 | 447 | 1.25 | 0% | 6.29 | 326 | 1.01 | 0% | 5.77 | 325 | 1.16 | 24% | 3.16 | 243 | 1.04 | 14% | 2.80 | 178 | 0.92 | 6% | 1.97 | |
| Region D | 759 | 1.78 | 20% | 7.65 | 615 | 1.76 | 10% | 7.03 | 490 | 1.74 | 0% | 6.48 | 334 | 2.55 | 26% | 3.19 | 265 | 2.25 | 22% | 2.89 | 212 | 1.97 | 16% | 2.01 | |
| Region E | 563 | 0.86 | 21% | 6.80 | 423 | 0.90 | 10% | 6.19 | 306 | 0.90 | 1% | 5.68 | 307 | 0.83 | 22% | 3.07 | 222 | 0.75 | 15% | 2.71 | 157 | 0.70 | 8% | 1.94 | |
| Region F | 577 | 0.94 | 21% | 6.86 | 450 | 0.89 | 14% | 6.31 | 342 | 0.88 | 6% | 5.84 | 310 | 0.91 | 22% | 3.09 | 230 | 0.73 | 19% | 2.74 | 168 | 0.69 | 12% | 1.95 | |
| Region G | 620 | 1.65 | 11% | 7.05 | 498 | 1.46 | 6% | 6.52 | 389 | 1.37 | 0% | 6.04 | 303 | 1.57 | 16% | 3.06 | 234 | 1.33 | 14% | 2.76 | 183 | 1.24 | 6% | 1.71 | |
| Region H | 705 | 2.38 | 4% | 7.42 | 602 | 2.23 | −2% | 6.97 | 512 | 2.01 | 0% | 6.58 | 304 | 2.76 | 14% | 3.06 | 252 | 2.21 | 14% | 2.84 | 217 | 1.78 | 14% | 1.71 | |
| Region I | 693 | 2.13 | 14% | 7.37 | 588 | 2.16 | 0% | 6.91 | 497 | 1.94 | 0% | 6.51 | 286 | 2.20 | 14% | 2.99 | 239 | 2.10 | 13% | 2.78 | 210 | 1.87 | 14% | 1.71 | |
| Region J | 575 | 1.76 | 4% | 6.85 | 464 | 1.60 | 0% | 6.37 | 373 | 1.38 | 0% | 5.97 | 252 | 2.12 | 14% | 2.83 | 211 | 1.47 | 10% | 2.66 | 172 | 1.32 | 6% | 1.71 | |
| Region K | 584 | 1.49 | 20% | 6.89 | 480 | 1.62 | 2% | 6.44 | 383 | 1.48 | 0% | 6.02 | 231 | 2.49 | 9% | 2.74 | 181 | 1.94 | 10% | 2.53 | 155 | 1.56 | 12% | 1.71 | |
| Individual locations | Region A | 762 | 1.83 | 3% | 7.66 | 621 | 1.61 | 1% | 7.05 | 503 | 1.40 | 0% | 6.54 | 423 | 4.65 | 26% | 3.58 | 353 | 1.40 | 23% | 3.27 | 285 | 1.29 | 13% | 1.71 |
| Region B | 733 | 1.86 | 8% | 7.54 | 608 | 1.71 | 4% | 7.00 | 495 | 1.55 | 1% | 6.51 | 397 | 1.51 | 21% | 3.47 | 319 | 1.42 | 15% | 3.13 | 254 | 1.31 | 10% | 1.71 | |
| Region C | 782 | 1.71 | 19% | 7.75 | 666 | 1.64 | 11% | 7.25 | 549 | 1.66 | 0% | 6.74 | 410 | 1.52 | 26% | 3.53 | 333 | 1.51 | 21% | 3.19 | 272 | 1.69 | 11% | 1.71 | |
| Region D | 785 | 1.81 | 22% | 7.76 | 672 | 1.85 | 7% | 7.27 | 562 | 1.77 | 0% | 6.79 | 367 | 2.52 | 29% | 3.34 | 295 | 1.97 | 29% | 3.02 | 250 | 1.76 | 29% | 1.71 | |
| Region E | 672 | 1.57 | 3% | 7.27 | 545 | 1.43 | 0% | 6.72 | 440 | 1.29 | 0% | 6.27 | 398 | 1.33 | 22% | 3.47 | 314 | 1.22 | 14% | 3.11 | 246 | 1.12 | 8% | 1.71 | |
| Region F | 672 | 1.63 | 6% | 7.27 | 544 | 1.52 | −2% | 6.72 | 430 | 1.31 | 0% | 6.22 | 358 | 1.77 | 29% | 3.30 | 291 | 1.39 | 26% | 3.01 | 229 | 1.24 | 6% | 2.04 | |
| Region G | 664 | 1.67 | 6% | 7.24 | 546 | 1.61 | 0% | 6.73 | 449 | 1.42 | 0% | 6.30 | 329 | 3.37 | 13% | 3.17 | 271 | 2.63 | 14% | 2.92 | 227 | 2.02 | 15% | 2.04 | |
| Region H | 741 | 2.16 | 10% | 7.58 | 636 | 2.10 | 0% | 7.11 | 536 | 1.91 | 0% | 6.68 | 310 | 2.80 | 15% | 3.09 | 272 | 2.73 | 14% | 2.93 | 245 | 2.43 | 15% | 2.06 | |
| Region I | 701 | 2.35 | 10% | 7.40 | 624 | 2.31 | 0% | 7.06 | 536 | 2.09 | 0% | 6.68 | 274 | 2.57 | 10% | 2.93 | 236 | 2.41 | 10% | 2.77 | 209 | 2.14 | 11% | 2.01 | |
| Region J | 590 | 1.78 | 1% | 6.92 | 477 | 1.60 | 0% | 6.42 | 387 | 1.37 | 0% | 6.03 | 271 | 2.22 | 15% | 2.92 | 230 | 1.91 | 16% | 2.74 | 189 | 1.33 | 3% | 1.71 | |
| Region K | 695 | 2.13 | 11% | 7.37 | 613 | 1.90 | 12% | 7.02 | 533 | 1.91 | 0% | 6.67 | 307 | 2.82 | 17% | 3.08 | 256 | 1.90 | 12% | 2.85 | 220 | 1.69 | 13% | 2.03 | |
| 24 h Forecasts | Current Technology Cost: PV @ $1000/kW, Storage @ $200/kWh | Future Technology Cost: PV @ $400/kW, Storage @ $50/kWh | |||||||||||||||||||||||
|---|---|---|---|---|---|---|---|---|---|---|---|---|---|---|---|---|---|---|---|---|---|---|---|---|---|
| No Flexibility | 2.5% Flexibility | 5% Flexibility | No Flexibility | 2.5% Flexibility | 5% Flexibility | ||||||||||||||||||||
| Electrical Region | Add’l $ per PVkW | Storage PV h | Over-Sizing | LCOE ¢/kWh | Add’l $ per PVkW | Storage PV h | Over-Sizing | LCOE ¢/kWh | Add’l $ per PVkW | Storage PV h | Over-Sizing | LCOE ¢/kWh | Add’l $ per PVkW | Storage PV h | Over-Sizing | LCOE ¢/kWh | Add’l $ per PVkW | Storage PV h | Over-Sizing | LCOE ¢/kWh | Add’l $ per PVkW | Storage PV h | Over-Sizing | LCOE ¢/kWh | |
| homogeneously dispersed fleets | Entire NYISO | 1190 | 2.76 | 29% | 9.53 | 1027 | 2.71 | 20% | 8.82 | 884 | 2.71 | 10% | 8.20 | 448 | 7.52 | 1% | 3.69 | 386 | 6.51 | 1% | 3.42 | 336 | 5.51 | 2% | 2.01 |
| Region A | 1483 | 4.35 | 13% | 10.80 | 1314 | 4.23 | 5% | 10.06 | 1155 | 4.09 | 0% | 4.35 | 516 | 8.72 | 1% | 3.98 | 473 | 7.90 | 2% | 3.80 | 432 | 7.30 | 2% | 1.72 | |
| Region B | 1494 | 4.48 | 9% | 10.85 | 1319 | 4.37 | 0% | 10.09 | 1159 | 4.11 | 0% | 9.39 | 494 | 8.42 | 1% | 3.89 | 462 | 7.77 | 2% | 3.75 | 435 | 7.06 | 4% | 2.09 | |
| Region C | 1448 | 4.13 | 16% | 10.65 | 1267 | 4.06 | 4% | 9.86 | 1106 | 3.88 | 0% | 9.16 | 482 | 8.26 | 1% | 3.84 | 445 | 7.46 | 2% | 3.67 | 409 | 6.72 | 3% | 2.07 | |
| Region D | 1390 | 3.62 | 24% | 10.40 | 1221 | 3.51 | 16% | 9.66 | 1066 | 3.41 | 8% | 8.99 | 475 | 6.15 | 10% | 3.81 | 396 | 5.50 | 7% | 3.46 | 330 | 4.93 | 4% | 2.00 | |
| Region E | 1350 | 3.67 | 27% | 10.22 | 1180 | 3.65 | 14% | 9.48 | 1028 | 3.54 | 6% | 8.82 | 458 | 7.50 | 2% | 3.73 | 391 | 6.40 | 2% | 3.44 | 338 | 5.50 | 2% | 2.01 | |
| Region F | 1269 | 2.93 | 29% | 9.87 | 1104 | 2.68 | 26% | 9.15 | 950 | 2.86 | 7% | 8.48 | 449 | 8.02 | −1% | 3.69 | 395 | 6.89 | 0% | 3.46 | 345 | 5.86 | 1% | 2.02 | |
| Region G | 1287 | 3.19 | 10% | 9.95 | 1109 | 2.98 | 6% | 9.17 | 948 | 2.73 | 4% | 4.35 | 445 | 7.40 | 1% | 3.68 | 396 | 6.08 | 4% | 3.46 | 346 | 4.84 | 7% | 1.72 | |
| Region H | 1400 | 4.82 | 24% | 10.44 | 1229 | 4.35 | 21% | 9.70 | 1068 | 4.01 | 16% | 4.35 | 461 | 7.20 | 3% | 3.74 | 400 | 6.20 | 4% | 3.48 | 353 | 5.00 | 7% | 1.72 | |
| Region I | 1381 | 4.66 | 25% | 10.36 | 1221 | 4.15 | 22% | 9.66 | 1064 | 3.86 | 18% | 4.35 | 486 | 8.50 | 0% | 3.85 | 414 | 6.90 | 2% | 3.54 | 355 | 5.05 | 7% | 1.72 | |
| Region J | 1412 | 3.59 | 1% | 10.49 | 1232 | 3.33 | 0% | 9.71 | 1064 | 3.02 | 0% | 4.35 | 501 | 9.16 | −1% | 3.92 | 451 | 7.46 | 3% | 3.70 | 401 | 5.65 | 9% | 1.72 | |
| Region K | 1527 | 3.99 | 14% | 10.99 | 1351 | 3.85 | 6% | 10.23 | 1190 | 3.67 | 0% | 4.35 | 532 | 9.31 | 1% | 4.05 | 455 | 8.15 | 1% | 3.72 | 392 | 6.91 | 2% | 1.72 | |
| Individual locations | Region A | 1555 | 4.58 | 10% | 11.11 | 1393 | 4.42 | 4% | 10.41 | 1238 | 4.26 | 0% | 4.35 | 570 | 9.78 | 1% | 4.22 | 525 | 8.87 | 2% | 4.02 | 482 | 8.03 | 3% | 1.72 |
| Region B | 1602 | 4.70 | 7% | 11.32 | 1430 | 4.59 | 0% | 10.57 | 1268 | 4.29 | 0% | 4.35 | 515 | 8.77 | 1% | 3.98 | 493 | 8.01 | 3% | 3.88 | 462 | 7.36 | 4% | 1.72 | |
| Region C | 1601 | 4.88 | 3% | 11.31 | 1429 | 4.67 | 0% | 10.56 | 1271 | 4.36 | 0% | 4.35 | 529 | 9.24 | 0% | 4.04 | 502 | 8.35 | 2% | 3.93 | 478 | 7.65 | 4% | 1.72 | |
| Region D | 1542 | 4.38 | 1% | 11.06 | 1377 | 4.10 | 3% | 10.34 | 1215 | 3.94 | 0% | 4.35 | 545 | 7.57 | 10% | 4.11 | 476 | 7.05 | 7% | 3.81 | 414 | 6.53 | 4% | 1.72 | |
| Region E | 1338 | 3.50 | 15% | 10.17 | 1177 | 3.54 | 2% | 9.47 | 1025 | 3.34 | 0% | 4.35 | 471 | 8.39 | −1% | 3.79 | 438 | 7.61 | 0% | 3.64 | 405 | 6.87 | 1% | 1.72 | |
| Region F | 1450 | 3.54 | 23% | 10.66 | 1284 | 3.39 | 15% | 9.94 | 1125 | 3.26 | 6% | 9.24 | 461 | 8.09 | −1% | 3.75 | 418 | 7.17 | 0% | 3.56 | 375 | 6.12 | 2% | 2.04 | |
| Region G | 1329 | 3.63 | 22% | 10.13 | 1183 | 3.38 | 20% | 9.49 | 1047 | 3.16 | 15% | 8.90 | 412 | 6.85 | 0% | 3.53 | 365 | 6.00 | 1% | 3.33 | 329 | 5.14 | 3% | 2.00 | |
| Region H | 1313 | 3.32 | 2% | 10.06 | 1154 | 3.03 | 3% | 9.37 | 1007 | 2.73 | 4% | 8.73 | 464 | 7.80 | 1% | 3.76 | 413 | 6.69 | 3% | 3.54 | 362 | 5.56 | 5% | 2.03 | |
| Region I | 1337 | 3.32 | 4% | 10.16 | 1172 | 3.13 | 0% | 9.45 | 1017 | 2.86 | 0% | 8.77 | 489 | 8.26 | 1% | 3.87 | 419 | 7.00 | 2% | 3.56 | 355 | 5.37 | 5% | 2.03 | |
| Region J | 1417 | 3.67 | 3% | 10.51 | 1244 | 3.44 | 0% | 9.76 | 1082 | 3.14 | 0% | 4.35 | 513 | 8.78 | 1% | 3.97 | 430 | 7.76 | 0% | 3.61 | 364 | 6.44 | 1% | 1.72 | |
| Region K | 1433 | 3.65 | 2% | 10.59 | 1270 | 3.43 | 0% | 9.87 | 1114 | 3.15 | 0% | 9.20 | 515 | 9.33 | 0% | 3.98 | 449 | 7.84 | 2% | 3.69 | 392 | 6.69 | 3% | 2.06 | |
| 24 h Forecasts | Current Technology Cost: PV @ $1000/kW, Storage @ $200/kWh | Future Technology Cost: PV @ $400/kW, Storage @ $50/kWh | |||||||||||||||||||||||
|---|---|---|---|---|---|---|---|---|---|---|---|---|---|---|---|---|---|---|---|---|---|---|---|---|---|
| No Flexibility | 2.5% Flexibility | 5% Flexibility | NO Flexibility | 2.5% flexibility | 5% Flexibility | ||||||||||||||||||||
| Electrical Region | Add’l $ per PVkW | Storage PV h | Over-Sizing | LCOE ¢/kWh | Add’l $ per PVkW | Storage PV h | Over-Sizing | LCOE ¢/kWh | Add’l $ per PVkW | Storage PV h | Over-Sizing | LCOE ¢/kWh | Add’l $ per PVkW | Storage PV h | Over-Sizing | LCOE ¢/kWh | Add’l $ per PVkW | Storage PV h | Over-Sizing | LCOE ¢/kWh | Add’l $ per PVkW | Storage PV h | Over-Sizing | LCOE ¢/kWh | |
| homogeneously dispersed fleets | Entire NYISO | 584 | 1.13 | 20% | 6.89 | 467 | 0.99 | 12% | 6.38 | 356 | 0.83 | 9% | 5.90 | 284 | 1.51 | 29% | 2.97 | 214 | 0.94 | 21% | 2.67 | 164 | 0.82 | 18% | 1.86 |
| Region A | 811 | 2.02 | 13% | 7.88 | 671 | 1.84 | 9% | 7.27 | 552 | 1.66 | 5% | 4.35 | 411 | 1.69 | 27% | 3.53 | 328 | 1.43 | 26% | 3.17 | 252 | 3.49 | 7% | 1.72 | |
| Region B | 758 | 1.66 | 17% | 7.65 | 625 | 1.63 | 8% | 7.07 | 510 | 1.40 | 8% | 6.57 | 395 | 1.41 | 29% | 3.46 | 315 | 1.34 | 22% | 3.11 | 248 | 1.29 | 15% | 1.93 | |
| Region C | 770 | 1.90 | 18% | 7.70 | 644 | 1.70 | 17% | 7.15 | 547 | 1.49 | 17% | 6.73 | 368 | 2.19 | 28% | 3.34 | 284 | 1.70 | 20% | 2.97 | 221 | 1.49 | 17% | 1.91 | |
| Region D | 825 | 1.56 | 28% | 7.94 | 723 | 1.64 | 18% | 7.50 | 615 | 1.61 | 10% | 7.02 | 384 | 2.23 | 29% | 3.41 | 319 | 2.09 | 29% | 3.13 | 263 | 2.07 | 25% | 1.95 | |
| Region E | 707 | 1.41 | 24% | 7.42 | 604 | 1.10 | 27% | 6.98 | 509 | 1.32 | 10% | 6.56 | 341 | 1.40 | 29% | 3.23 | 270 | 1.29 | 24% | 2.91 | 209 | 1.40 | 19% | 1.90 | |
| Region F | 731 | 1.22 | 29% | 7.53 | 622 | 1.10 | 26% | 7.06 | 526 | 1.12 | 15% | 6.64 | 363 | 2.22 | 29% | 3.32 | 291 | 1.74 | 29% | 3.01 | 237 | 1.36 | 26% | 1.92 | |
| Region G | 964 | 2.97 | 21% | 8.54 | 852 | 2.77 | 17% | 8.06 | 758 | 2.67 | 10% | 4.35 | 379 | 3.15 | 29% | 3.39 | 320 | 3.00 | 23% | 3.13 | 276 | 2.32 | 24% | 1.72 | |
| Region H | 961 | 3.56 | 16% | 8.53 | 883 | 3.26 | 14% | 8.19 | 815 | 2.92 | 15% | 4.35 | 332 | 3.56 | 16% | 3.18 | 303 | 3.24 | 17% | 3.06 | 280 | 2.84 | 19% | 1.72 | |
| Region I | 900 | 3.40 | 13% | 8.26 | 823 | 3.05 | 13% | 7.93 | 752 | 2.71 | 13% | 4.35 | 307 | 3.87 | 10% | 3.08 | 281 | 3.21 | 13% | 2.96 | 259 | 2.66 | 16% | 1.72 | |
| Region J | 889 | 2.98 | 21% | 8.22 | 785 | 2.17 | 15% | 7.77 | 692 | 2.01 | 12% | 4.35 | 314 | 3.03 | 20% | 3.10 | 279 | 2.63 | 21% | 2.95 | 248 | 2.36 | 20% | 1.72 | |
| Region K | 812 | 2.91 | 16% | 7.88 | 719 | 2.48 | 17% | 7.48 | 644 | 2.06 | 19% | 4.35 | 279 | 2.91 | 16% | 2.95 | 246 | 2.48 | 17% | 2.81 | 220 | 2.14 | 18% | 1.72 | |
| Individual locations | Region A | 1097 | 3.20 | 21% | 9.12 | 1002 | 2.92 | 24% | 8.71 | 919 | 2.62 | 26% | 4.35 | 448 | 5.38 | 19% | 3.69 | 371 | 3.58 | 25% | 3.35 | 331 | 2.82 | 28% | 1.72 |
| Region B | 904 | 2.32 | 7% | 8.28 | 786 | 2.11 | 9% | 7.77 | 693 | 1.87 | 14% | 4.35 | 485 | 1.92 | 29% | 3.85 | 400 | 2.26 | 21% | 3.48 | 322 | 3.37 | 11% | 1.72 | |
| Region C | 981 | 2.54 | 10% | 8.62 | 856 | 2.37 | 7% | 8.07 | 745 | 2.30 | −2% | 4.35 | 452 | 3.21 | 29% | 3.70 | 374 | 3.10 | 28% | 3.36 | 299 | 3.08 | 17% | 1.72 | |
| Region D | 1271 | 3.36 | 23% | 9.88 | 1152 | 3.29 | 14% | 9.36 | 1041 | 3.20 | 7% | 4.35 | 482 | 4.16 | 29% | 3.84 | 419 | 3.87 | 29% | 3.56 | 368 | 3.59 | 29% | 1.72 | |
| Region E | 887 | 1.75 | 29% | 8.21 | 790 | 1.56 | 29% | 7.79 | 707 | 1.37 | 29% | 4.35 | 398 | 2.51 | 29% | 3.47 | 346 | 2.07 | 29% | 3.25 | 306 | 1.72 | 29% | 1.72 | |
| Region F | 1091 | 2.76 | 27% | 9.09 | 975 | 2.56 | 21% | 8.59 | 876 | 2.40 | 14% | 8.16 | 437 | 3.75 | 29% | 3.64 | 391 | 3.53 | 29% | 3.44 | 352 | 3.17 | 29% | 2.02 | |
| Region G | 996 | 2.93 | 13% | 8.68 | 880 | 2.69 | 13% | 8.18 | 802 | 2.46 | 17% | 7.84 | 395 | 3.73 | 25% | 3.46 | 342 | 3.06 | 25% | 3.23 | 303 | 2.40 | 27% | 1.98 | |
| Region H | 995 | 3.68 | 15% | 8.68 | 909 | 3.38 | 13% | 8.30 | 847 | 3.06 | 13% | 8.03 | 343 | 3.72 | 17% | 3.23 | 310 | 3.28 | 18% | 3.09 | 290 | 2.94 | 20% | 1.97 | |
| Region I | 937 | 3.34 | 17% | 8.43 | 848 | 3.12 | 15% | 8.04 | 793 | 2.80 | 17% | 7.80 | 318 | 3.71 | 12% | 3.12 | 290 | 3.12 | 15% | 3.00 | 271 | 2.80 | 17% | 1.95 | |
| Region J | 959 | 2.22 | 28% | 8.52 | 858 | 1.97 | 28% | 8.08 | 773 | 1.77 | 27% | 4.35 | 356 | 3.27 | 25% | 3.29 | 313 | 2.84 | 25% | 3.10 | 279 | 2.53 | 24% | 1.72 | |
| Region K | 1167 | 3.39 | 22% | 9.43 | 1061 | 3.13 | 20% | 8.97 | 960 | 3.00 | 13% | 8.53 | 512 | 3.21 | 29% | 3.97 | 456 | 2.91 | 29% | 3.73 | 408 | 2.60 | 29% | 2.07 | |
| 24 h Forecasts | Current Technology Cost: PV @ $1000/kW, Storage @ $200/kWh | Future Technology Cost: PV @ $400/kW, Storage @ $50/kWh | |||||||||||||||||||||||
|---|---|---|---|---|---|---|---|---|---|---|---|---|---|---|---|---|---|---|---|---|---|---|---|---|---|
| No Flexibility | 2.5% Flexibility | 5% Flexibility | No Flexibility | 2.5% Flexibility | 5% Flexibility | ||||||||||||||||||||
| Electrical Region | Add’l $ per PVkW | Storage PV h | Over-Sizing | LCOE ¢/kWh | Add’l $ per PVkW | Storage PV h | Over-Sizing | LCOE ¢/kWh | Add’l $ per PVkW | Storage PV h | Over-Sizing | LCOE ¢/kWh | Add’l $ per PVkW | Storage PV h | Over-Sizing | LCOE ¢/kWh | Add’l $ per PVkW | Storage PV h | Over-Sizing | LCOE ¢/kWh | Add’l $ per PVkW | Storage PV h | Over-Sizing | LCOE ¢/kWh | |
| homogeneously dispersed fleets | Entire NYISO | 576 | 1.28 | 12% | 6.85 | 437 | 1.22 | 4% | 6.25 | 317 | 1.12 | 0% | 5.73 | 295 | 1.00 | 26% | 3.02 | 215 | 0.98 | 16% | 2.67 | 151 | 0.94 | 7% | 1.85 |
| Region A | 754 | 1.96 | 12% | 7.63 | 612 | 1.82 | 7% | 7.01 | 498 | 1.67 | 4% | 4.35 | 377 | 1.95 | 24% | 3.38 | 285 | 1.73 | 17% | 2.98 | 211 | 1.44 | 14% | 1.72 | |
| Region B | 725 | 1.86 | 14% | 7.50 | 589 | 1.79 | 7% | 6.91 | 488 | 1.59 | 6% | 6.47 | 353 | 1.56 | 26% | 3.27 | 266 | 1.46 | 20% | 2.90 | 203 | 1.39 | 14% | 1.89 | |
| Region C | 661 | 1.50 | 7% | 7.22 | 520 | 1.37 | 1% | 6.61 | 392 | 1.20 | 0% | 6.05 | 355 | 1.86 | 29% | 3.29 | 271 | 1.60 | 18% | 2.92 | 210 | 1.00 | 10% | 1.90 | |
| Region D | 720 | 1.76 | 9% | 7.48 | 577 | 1.66 | 2% | 6.86 | 451 | 1.50 | 0% | 6.31 | 366 | 3.54 | 21% | 3.33 | 292 | 1.38 | 18% | 3.01 | 225 | 1.30 | 10% | 1.91 | |
| Region E | 668 | 1.64 | 8% | 7.26 | 526 | 1.53 | 2% | 6.64 | 402 | 1.38 | 0% | 6.10 | 345 | 1.28 | 28% | 3.24 | 263 | 1.26 | 17% | 2.89 | 196 | 1.20 | 8% | 1.89 | |
| Region F | 633 | 1.35 | 7% | 7.10 | 484 | 1.17 | 3% | 6.46 | 361 | 1.00 | 0% | 5.92 | 348 | 1.16 | 29% | 3.26 | 269 | 1.03 | 20% | 2.91 | 203 | 0.92 | 10% | 1.89 | |
| Region G | 700 | 1.89 | 13% | 7.39 | 589 | 1.85 | 4% | 6.91 | 486 | 1.77 | 0% | 4.35 | 312 | 1.77 | 27% | 3.10 | 257 | 1.45 | 26% | 2.86 | 212 | 1.46 | 17% | 1.72 | |
| Region H | 715 | 2.19 | 15% | 7.46 | 640 | 2.14 | 3% | 7.14 | 545 | 1.98 | 0% | 4.35 | 293 | 2.21 | 17% | 3.02 | 253 | 1.88 | 19% | 2.84 | 223 | 1.71 | 19% | 1.72 | |
| Region I | 634 | 1.77 | 6% | 7.11 | 540 | 1.57 | 5% | 6.70 | 458 | 1.59 | 0% | 4.35 | 289 | 1.66 | 20% | 3.00 | 249 | 1.42 | 22% | 2.82 | 222 | 1.20 | 24% | 1.72 | |
| Region J | 663 | 2.04 | 6% | 7.23 | 570 | 1.96 | 0% | 6.83 | 489 | 1.80 | 0% | 4.35 | 265 | 2.04 | 17% | 2.89 | 224 | 1.66 | 19% | 2.72 | 196 | 1.47 | 19% | 1.72 | |
| Region K | 729 | 2.61 | 13% | 7.52 | 663 | 2.48 | 7% | 7.23 | 590 | 2.44 | 0% | 4.35 | 257 | 2.59 | 14% | 2.86 | 222 | 2.35 | 15% | 2.70 | 198 | 2.17 | 15% | 1.72 | |
| Individual locations | Region A | 916 | 2.48 | 10% | 8.33 | 786 | 2.18 | 11% | 7.77 | 672 | 2.04 | 7% | 4.35 | 457 | 4.12 | 26% | 3.73 | 375 | 3.03 | 27% | 3.37 | 310 | 2.09 | 18% | 1.72 |
| Region B | 819 | 2.17 | 3% | 7.91 | 690 | 2.00 | 0% | 7.35 | 575 | 1.85 | 0% | 4.35 | 408 | 3.40 | 29% | 3.51 | 346 | 2.20 | 17% | 3.25 | 289 | 1.98 | 14% | 1.72 | |
| Region C | 808 | 1.97 | 3% | 7.87 | 671 | 1.81 | 0% | 7.27 | 550 | 1.60 | 0% | 4.35 | 444 | 1.77 | 28% | 3.67 | 359 | 1.89 | 18% | 3.30 | 293 | 1.68 | 17% | 1.72 | |
| Region D | 795 | 1.92 | 14% | 7.81 | 672 | 1.84 | 4% | 7.27 | 565 | 1.78 | 0% | 4.35 | 380 | 2.52 | 29% | 3.39 | 304 | 1.90 | 28% | 3.06 | 248 | 1.50 | 29% | 1.72 | |
| Region E | 758 | 1.74 | 6% | 7.65 | 632 | 1.61 | 2% | 7.10 | 519 | 1.46 | 0% | 4.35 | 431 | 1.43 | 24% | 3.62 | 351 | 1.47 | 18% | 3.27 | 281 | 1.17 | 19% | 1.72 | |
| Region F | 737 | 1.72 | 9% | 7.56 | 617 | 1.66 | 3% | 7.03 | 503 | 1.48 | 0% | 6.54 | 408 | 2.53 | 29% | 3.51 | 338 | 1.48 | 12% | 3.21 | 274 | 1.30 | 10% | 1.96 | |
| Region G | 773 | 2.09 | 9% | 7.71 | 662 | 1.98 | 5% | 7.23 | 569 | 1.96 | 0% | 6.82 | 375 | 3.05 | 24% | 3.37 | 315 | 2.46 | 24% | 3.11 | 269 | 1.61 | 14% | 1.95 | |
| Region H | 766 | 2.38 | 5% | 7.68 | 664 | 2.25 | 0% | 7.24 | 568 | 2.00 | 0% | 6.82 | 314 | 2.82 | 16% | 3.10 | 272 | 2.13 | 20% | 2.92 | 245 | 1.64 | 24% | 1.93 | |
| Region I | 655 | 1.90 | 15% | 7.20 | 596 | 1.76 | 10% | 6.94 | 517 | 1.73 | 0% | 6.60 | 275 | 1.97 | 15% | 2.94 | 243 | 1.66 | 18% | 2.80 | 219 | 1.44 | 20% | 1.91 | |
| Region J | 709 | 2.00 | 20% | 7.43 | 610 | 1.94 | 0% | 7.00 | 522 | 1.69 | 3% | 4.35 | 286 | 2.06 | 19% | 2.99 | 244 | 1.86 | 19% | 2.80 | 213 | 1.45 | 21% | 1.72 | |
| Region K | 876 | 2.76 | 23% | 8.16 | 818 | 2.93 | 0% | 7.91 | 730 | 2.77 | 0% | 7.52 | 324 | 2.87 | 22% | 3.15 | 290 | 2.58 | 24% | 3.00 | 265 | 2.43 | 24% | 1.95 | |
References
- Blaga, R.; Sabadus, A.; Stefu, N.; Dughir, C.; Paulescu, M.; Badescu, V. A current perspective on the accuracy of incoming solar energy forecasting. Prog. Energy Combust. Sci. 2019, 70, 119–144. [Google Scholar] [CrossRef]
- Yang, D.; Kleissl, J.; Gueymard, C.A.; Pedro, H.T.; Coimbra, C.F. History and trends in solar irradiance and PV power forecasting: A preliminary assessment and review using text mining. Sol. Energy 2018, 168, 60–101. [Google Scholar] [CrossRef]
- Wang, P.; van Westrhenen, R.; Meirink, J.F.; van der Veen, S.; Knap, W. Knap Surface solar radiation forecasts by advecting cloud physical properties derived from Meteosat Second Generation observations. Sol. Energy 2019, 177, 47–58. [Google Scholar] [CrossRef]
- Van der Meer, D.; Yang, D.; Widén, J.; Munkhammar, J. Clear-sky index space-time trajectories from probabilistic solar forecasts: Comparing promising copulas featured. J. Renew. Sustain. Energy 2020, 12, 026102. [Google Scholar] [CrossRef]
- Remund, J.; Klauser, D.; Müller, S. Shortest Term Solar Energy Forecast. In Renewable Energy in the Service of Mankind Vol II; Sayigh, A., Ed.; Springer: Cham, Switzerland, 2016. [Google Scholar]
- Zhang, X.; Li, Y.; Lu, S.; Hamann, H.F.; Hodge, B.M.; Lehman, B. A Solar Time Based Analog Ensemble Method for Regional Solar Power Forecasting. IEEE Trans. Sustain. Energy 2019, 10, 268–279. [Google Scholar] [CrossRef]
- Perveen, G.; Rizwan, M.; Goel, N. An ANFIS? Based model for solar energy forecasting and its smart grid application. Eng. Rep. 2019, 1, e12070. [Google Scholar] [CrossRef]
- Yang, D. Reconciling solar forecasts: Probabilistic forecast reconciliation in a nonparametric framework. Sol. Energy 2020, in press. [Google Scholar] [CrossRef]
- Panamtash, H.; Zhou, Q.; Hong, T.; Qu, Z.; Davis, K.O. A copula-based Bayesian method for probabilistic solar power forecasting. Sol. Energy 2020, 196, 336–345. [Google Scholar] [CrossRef]
- Lauret, P.; David, M.; Pinson, P. Verification of solar irradiance probabilistic forecasts. Sol. Energy 2019, 94, 254–271. [Google Scholar] [CrossRef]
- Bakker, K.; Whan, K.; Knap, W.; Schmeits, M. Schmeits Comparison of statistical post-processing methods for probabilistic NWP forecasts of solar radiation. Sol. Energy 2019, 191, 138–150. [Google Scholar] [CrossRef]
- von Loeper, F.; Schaumann, P.; de Langlard, M.; Hess, R.; Bäsmann, R.; Schmidt, V. Probabilistic prediction of solar power supply to distribution networks, using forecasts of global horizontal irradiation. Sol. Energy 2020, 203, 145–156. [Google Scholar] [CrossRef]
- Verbois, H.; Rusydi, A.; Thiery, A. Probabilistic forecasting of day-ahead solar irradiance using quantile gradient boosting. Sol. Energy 2018, 173, 313–327. [Google Scholar] [CrossRef]
- Badosa, J.; Gobet, E.; Grangereau, M.; Kim, D. Day-Ahead Probabilistic Forecast of Solar Irradiance: A Stochastic Differential Equation Approach. In Renewable Energy: Forecasting and Risk Management; Springer: Cham, Switzerland, 2017. [Google Scholar]
- Antonanzas, J.; Perpinan-Lamigueiro, O.; Urraca, R.; Antonanzas-Torres, F. Influence of electricity market structures on deterministic solar forecasting verification. Sol. Energy 2020, in press. [Google Scholar] [CrossRef]
- Perez, R.; Perez, M.; Pierro, M.; Schlemmer, J.; Kivalov, S.; Dise, J.; Keelin, M.; Grammatico, A.; Swierc, J.; Foster, A.; et al. Operationally Perfect Solar Power Forecasts: A Scalable Strategy to Lowest-Cost Firm Solar Power Generation. In Proceedings of the 46th IEEE PV Specialists Conference (Oral), Chicago, IL, USA, 16–20 June 2019. [Google Scholar]
- Perez, R.; Perez, M.; Pierro, J.; Schlemmer, J.; Kivalov, S.; Dise, J.; Keelin, M.; Grammatico, A.; Swierc, J.; Foster, A.; et al. Perfect Operational Solar Forecasts—A Scalable Strategy toward Firm Power Generation; International Energy Agency Solar World Congress: Santiago, Chile, 2019. [Google Scholar]
- Yang, D. A guideline to solar forecasting research practice: Reproducible, operational, probabilistic or physically-based, ensemble, and skill (ROPES). J. Renew. Sustain. Energy 2019, 11, 022701. [Google Scholar] [CrossRef]
- Yang, D.; Alessandrini, S.; Antonanzas, J.; Antonanzas-Torres, F.; Badescu, V.; Beyer, H.G.; Blaga, R.; Boland, J.; Bright, J.M.; Coimbra, C.F.M.; et al. Verification of deterministic solar forecasts. Sol. Energy 2020, in press. [Google Scholar] [CrossRef]
- Huertas, J.; Centeno Brito, M. Using Smart Persistence and Random Forests to Predict Photovoltaic Energy Production. Energies 2019, 12, 100. [Google Scholar] [CrossRef]
- Hansen, C.W.; Holmgren, W.F.; Tuohy, A.; Sharp, J.; Lorenzo, A.T.; Boeman, L.J.; Golnas, A. The Solar Forecast Arbiter: An Open Source Evaluation Framework for Solar Forecasting. In Proceedings of the 2019 IEEE 46th Photovoltaic Specialists Conference (PVSC), Chicago, IL, USA, 16–21 June 2019; pp. 2452–2457. [Google Scholar] [CrossRef]
- International Energy Agency PVPS. Task 16—Solar Resource for High Penetration and Large Scale Applications. In Activity 3.5: Firm Power Generation; IEA PVPS: Paris, France, 2019. [Google Scholar]
- Perez, M.; Perez, R.; Rábago, K.R.; Putnam, M. Overbuilding & curtailment: The cost-effective enablers of firm PV generation. Sol. Energy 2019, 180, 412–422. [Google Scholar]
- Perez, M.; Perez, R.; Rabago, K.; Putnam, M. Achieving 100% Renewables: Supply-Shaping through Curtailment. PVTECH Power 2019, 19, 56–61. Available online: www.pv-tech.org (accessed on 15 March 2019).
- Perez, M. Report: MISO-Wide Solar Potential Analysis—How Do We Achieve 100% Renewables across the MISO Region while not Breaking the Bank? Available online: http://mnsolarpathways.org/miso-spa/ (accessed on 15 April 2020).
- Pierro, M.; Perez, R.; Perez, M.; Moser, D.; Cornaro, C. Italian protocol for massive solar integration: Imbalance mitigation strategies. Renew. Energy J. 2020, 153, 725–739. [Google Scholar] [CrossRef]
- Pierro, M.; Perez, R.; Perez, M.; Moser, D.; Cornaro, C. Italian Protocol for Massive Solar Integration (part 2): From Solar Imbalance Mitigation to 24/365 Solar Power Generation. Renew. Energy 2019. (under peer review). [Google Scholar]
- Perez, R.; Schlemmer, J.; Kivalov, S.; Dise, J.; Keelin, P.; Grammatico, M.; Hoff, T.; Tuhoy, A. A New Version of the SUNY Solar Forecast Model: A Scalable Approach to Site-Specific Model Training. In Proceedings of the IEEE PV Specialists Conference (invited) WCPEC-7, Waikoloa, HI, USA, 10–15 June 2018. [Google Scholar]
- SolarAnywhere URL. Available online: https://www.solaranywhere.com (accessed on 15 April 2020).
- ECMWF. European Centre for Medium-Range Weather Forecasts; ECMWF: Reading, UK, 2019. [Google Scholar]
- GFS. Global Forecast Syste—NOAA; National Oceanic and Atmospheric Administration: Washington, DC, USA, 2019. Available online: https://www.ncdc.noaa.gov/data-access/model-data/model-datasets/global-forcast-system-gfs (accessed on 15 April 2020).
- HRRR. High-Resolution Rapid Refresh—NOAA; National Oceanic and Atmospheric Administration: Washington, DC, USA, 2019. Available online: https://rapidrefresh.noaa.gov/hrrr/ (accessed on 15 February 2020).
- NDFD. National Digital Forecast Database—NOAA; National Oceanic and Atmospheric Administration: Washington, DC, USA, 2019. Available online: https://www.weather.gov/mdl/ndfd_home (accessed on 15 April 2020).
- SolarAnywhere Historical Data IEEE Paper with Latest Model. Available online: https://www.solaranywhere.com/validation/leadership-bankability/data-validation/ (accessed on 15 April 2020).
- Perez, R.; Schlemmer, J.; Hemker, K.; Kivalov, S.; Kankiewicz, A.; Dise, J. Solar Energy Forecast Validation for Extended Areas & Economic Impact of Forecast Accuracy. In Proceedings of the 43th IEEE PV Specialists Conference, Portland, OR, USA, 5–10 June 2016. [Google Scholar]
- Yang, D.; Perez, R. Can we gauge forecasts using satellite-derived solar irradiance. J. Renew. Sustain. Energy 2019, 11, 023704. [Google Scholar] [CrossRef]
- NREL (National Renewable Energy Laboratory). 2019 Annual Technology Baseline; National Renewable Energy Laboratory: Golden, CO, USA, 2019.
- Smart Persistence definition from IEA 2015. In International Energy Agency, Solar Heating & Cooling Program, Task 46, Subtask C-1: Short-term solar forecasting; IEA PVPS: Paris, France, 2015.
- The NYISO Website Is Temporarily Unavailable. Available online: https://www.nyiso.com/documents/20142/2223763/2018-State-of-the-Market-Report.pdf (accessed on 15 April 2020).
- New York State Offshore Wind Master Plan. Available online: File:///Users/rperez/Downloads/Offshore-Wind-Master-Plan.pdf (accessed on 15 April 2019).
- The Future Is Forming. Available online: https://formenergy.com/ (accessed on 15 April 2020).
- Perez, R.; David, M.; Hoff, T.E.; Jamaly, M.; Kivalov, S.; Kleissl, J.; Jamaly, M.; Lauret, P.; Perez, M. Spatial and Temporal Variability of Solar Energy. Found. Trends Renew. Energy 2016, 1, 1–44. [Google Scholar] [CrossRef]


| 1 h Forecasts | Current Technology Cost: PV @ $1000/kW, Storage @ $200/kWh | Future Technology Cost: PV @ $400/kW, Storage @ $50/kWh | |||||||||||||||||||||||
|---|---|---|---|---|---|---|---|---|---|---|---|---|---|---|---|---|---|---|---|---|---|---|---|---|---|
| No Flexibility | 2.5% Flexibility | 5% Flexibility | No Flexibility | 2.5% Flexibility | 5% Flexibility | ||||||||||||||||||||
| Electrical Region | Add’l $ per PVkW | Storage PV h | Over-Sizing | LCOE ¢/kWh | Add’l $ per PVkW | Storage PV h | Over-Sizing | LCOE ¢/kWh | Add’l $ per PVkW | Storage PV h | Over-Sizing | LCOE ¢/kWh | Add’l $ per PVkW | Storage PV h | Over-Sizing | LCOE ¢/kWh | Add’l $ per PVkW | Storage PV h | Over-Sizing | LCOE ¢/kWh | Add’l $ per PVkW | Storage PV h | Over-Sizing | LCOE ¢/kWh | |
| homogeneously dispersed fleets | Entire NYISO | 111 | 0.29 | 0% | 4.83 | 29 | 0.19 | 0% | 4.48 | 1 | 0.07 | 0% | 4.35 | 62 | 0.72 | 0% | 2.01 | 12 | 0.19 | 0% | 1.79 | 1 | 0.07 | 0% | 1.74 |
| Region A | 149 | 0.39 | 0% | 5.00 | 68 | 0.28 | 0% | 4.65 | 30 | 0.19 | 0% | 4.48 | 79 | 0.98 | 0% | 2.09 | 37 | 0.39 | 0% | 1.90 | 13 | 0.19 | 0% | 1.80 | |
| Region B | 167 | 0.47 | 1% | 5.08 | 88 | 0.40 | 0% | 4.73 | 40 | 0.23 | 0% | 4.52 | 75 | 0.72 | 1% | 2.06 | 34 | 0.40 | 0% | 1.89 | 17 | 0.23 | 0% | 1.81 | |
| Region C | 168 | 0.41 | 3% | 5.08 | 84 | 0.38 | 0% | 4.71 | 37 | 0.24 | 0% | 4.51 | 69 | 0.78 | 0% | 2.04 | 35 | 0.40 | 0% | 1.89 | 14 | 0.24 | 0% | 1.80 | |
| Region D | 148 | 0.36 | 0% | 5.00 | 72 | 0.29 | 0% | 4.66 | 32 | 0.21 | 0% | 4.49 | 68 | 0.81 | 0% | 2.04 | 35 | 0.29 | 1% | 1.89 | 13 | 0.21 | 0% | 1.80 | |
| Region E | 130 | 0.33 | 0% | 4.92 | 49 | 0.24 | 0% | 4.56 | 11 | 0.13 | 0% | 4.40 | 72 | 0.86 | 0% | 2.05 | 23 | 0.24 | 0% | 1.84 | 3 | 0.13 | 0% | 1.75 | |
| Region F | 152 | 0.37 | 1% | 5.01 | 68 | 0.29 | 0% | 4.65 | 23 | 0.17 | 0% | 4.45 | 78 | 0.86 | 1% | 2.08 | 33 | 0.50 | 0% | 1.88 | 9 | 0.17 | 0% | 1.78 | |
| Region G | 160 | 0.38 | 1% | 5.05 | 70 | 0.26 | 0% | 4.65 | 27 | 0.15 | 0% | 4.47 | 77 | 0.80 | 1% | 2.08 | 35 | 0.35 | 0% | 1.89 | 14 | 0.21 | 0% | 1.80 | |
| Region H | 214 | 0.51 | 6% | 5.28 | 169 | 0.42 | 0% | 5.09 | 118 | 0.45 | 0% | 4.86 | 98 | 0.97 | 2% | 2.17 | 73 | 0.81 | 2% | 2.06 | 60 | 0.71 | 2% | 2.00 | |
| Region I | 205 | 0.71 | 1% | 5.24 | 178 | 0.64 | 0% | 5.12 | 135 | 0.55 | 0% | 4.94 | 89 | 0.89 | 1% | 2.13 | 75 | 0.66 | 3% | 2.07 | 62 | 0.87 | 0% | 2.01 | |
| Region J | 218 | 0.54 | 1% | 5.30 | 156 | 0.55 | 0% | 5.03 | 116 | 0.51 | 0% | 4.85 | 100 | 0.83 | 3% | 2.18 | 67 | 0.65 | 2% | 2.03 | 50 | 0.64 | 0% | 1.96 | |
| Region K | 203 | 0.52 | 5% | 5.23 | 140 | 0.54 | 0% | 4.96 | 85 | 0.40 | 0% | 4.72 | 89 | 0.72 | 3% | 2.13 | 58 | 0.45 | 3% | 1.99 | 36 | 0.39 | 0% | 1.89 | |
| Individual locations | Region A | 403 | 1.34 | 7% | 6.11 | 364 | 1.15 | 9% | 5.93 | 306 | 1.25 | 0% | 5.68 | 156 | 1.70 | 4% | 2.42 | 135 | 1.54 | 5% | 2.33 | 118 | 1.06 | 9% | 2.25 |
| Region B | 293 | 0.81 | 6% | 5.62 | 233 | 0.78 | 4% | 5.36 | 187 | 0.68 | 0% | 5.16 | 130 | 0.96 | 4% | 2.31 | 91 | 0.78 | 4% | 2.14 | 84 | 0.82 | 4% | 2.11 | |
| Region C | 384 | 1.52 | 3% | 6.02 | 322 | 1.28 | 3% | 5.75 | 266 | 1.05 | 0% | 5.51 | 139 | 1.52 | 3% | 2.34 | 111 | 1.39 | 2% | 2.22 | 95 | 1.09 | 3% | 2.15 | |
| Region D | 344 | 1.09 | 4% | 5.85 | 276 | 0.98 | 5% | 5.55 | 241 | 0.94 | 0% | 5.40 | 140 | 1.24 | 7% | 2.35 | 100 | 0.98 | 5% | 2.17 | 98 | 0.85 | 8% | 2.16 | |
| Region E | 283 | 0.80 | 4% | 5.58 | 231 | 0.71 | 5% | 5.35 | 174 | 0.64 | 0% | 5.11 | 136 | 0.76 | 8% | 2.33 | 92 | 0.78 | 4% | 2.14 | 80 | 0.68 | 5% | 2.09 | |
| Region F | 334 | 0.82 | 3% | 5.80 | 267 | 0.84 | 0% | 5.51 | 211 | 0.77 | 0% | 5.27 | 130 | 1.43 | 3% | 2.31 | 114 | 1.13 | 5% | 2.23 | 98 | 0.89 | 6% | 2.17 | |
| Region G | 358 | 0.91 | 3% | 5.91 | 282 | 0.85 | 0% | 5.58 | 216 | 0.76 | 0% | 5.29 | 147 | 1.53 | 4% | 2.38 | 127 | 1.36 | 5% | 2.29 | 114 | 1.10 | 7% | 2.24 | |
| Region H | 480 | 1.71 | 2% | 6.44 | 400 | 1.59 | 0% | 6.09 | 343 | 1.46 | 0% | 5.84 | 188 | 2.26 | 5% | 2.56 | 165 | 2.09 | 6% | 2.46 | 137 | 1.44 | 0% | 2.34 | |
| Region I | 338 | 0.87 | 6% | 5.82 | 262 | 0.94 | 3% | 5.49 | 209 | 0.74 | 0% | 5.26 | 127 | 1.59 | 1% | 2.29 | 98 | 1.03 | 3% | 2.17 | 85 | 0.76 | 5% | 2.11 | |
| Region J | 353 | 1.17 | 2% | 5.88 | 293 | 1.08 | 2% | 5.63 | 256 | 1.01 | 0% | 5.46 | 143 | 1.16 | 6% | 2.36 | 110 | 1.05 | 5% | 2.22 | 87 | 1.01 | 3% | 2.12 | |
| Region K | 460 | 1.56 | −1% | 6.35 | 388 | 1.48 | 0% | 6.04 | 341 | 1.39 | 0% | 5.83 | 224 | 1.45 | 5% | 2.71 | 174 | 1.36 | 4% | 2.50 | 143 | 1.33 | 1% | 2.36 | |
| 3 h Forecasts | Current Technology Cost: PV @ $1000/kW, Storage @ $200/kWh | Future Technology Cost: PV @ $400/kW, Storage @ $50/kWh | |||||||||||||||||||||||
|---|---|---|---|---|---|---|---|---|---|---|---|---|---|---|---|---|---|---|---|---|---|---|---|---|---|
| No Flexibility | 2.5% Flexibility | 5% Flexibility | No Flexibility | 2.5% Flexibility | 5% Flexibility | ||||||||||||||||||||
| Electrical Region | Add’l $ per PVkW | Storage PV h | Over-Sizing | LCOE ¢/kWh | Add’l $ per PVkW | Storage PV h | Over-Sizing | LCOE ¢/kWh | Add’l $ per PVkW | Storage PV h | Over-Sizing | LCOE ¢/kWh | Add’l $ per PVkW | Storage PV h | Over-Sizing | LCOE ¢/kWh | Add’l $ per PVkW | Storage PV h | Over-Sizing | LCOE ¢/kWh | Add’l $ per PVkW | Storage PV h | Over-Sizing | LCOE ¢/kWh | |
| homogeneously dispersed fleets | Entire NYISO | 259 | 0.50 | 5% | 5.48 | 152 | 0.46 | 1% | 5.01 | 84 | 0.40 | 0% | 4.71 | 153 | 0.47 | 6% | 2.41 | 77 | 0.47 | 1% | 2.08 | 35 | 0.40 | 0% | 1.76 |
| Region A | 367 | 1.01 | 0% | 5.95 | 253 | 0.89 | 0% | 5.45 | 186 | 0.78 | 0% | 5.16 | 199 | 3.08 | 0% | 2.61 | 120 | 1.87 | 0% | 2.26 | 72 | 1.09 | 0% | 1.71 | |
| Region B | 398 | 1.26 | 0% | 6.08 | 290 | 1.12 | 0% | 5.61 | 231 | 0.98 | 0% | 5.36 | 193 | 2.04 | 5% | 2.58 | 128 | 1.24 | 3% | 2.30 | 90 | 1.02 | 0% | 1.84 | |
| Region C | 379 | 1.16 | 0% | 6.00 | 279 | 1.03 | 0% | 5.56 | 212 | 0.90 | 0% | 5.27 | 193 | 2.15 | 4% | 2.58 | 124 | 1.76 | 0% | 2.28 | 78 | 1.25 | 0% | 1.82 | |
| Region D | 375 | 0.98 | 0% | 5.98 | 248 | 0.78 | 0% | 5.43 | 155 | 0.58 | 0% | 5.02 | 171 | 1.74 | 4% | 2.48 | 115 | 1.32 | 0% | 2.24 | 74 | 0.83 | 0% | 1.82 | |
| Region E | 310 | 0.71 | 1% | 5.70 | 190 | 0.62 | 0% | 5.18 | 120 | 0.51 | 0% | 4.87 | 172 | 1.58 | 5% | 2.49 | 105 | 1.06 | 1% | 2.20 | 56 | 0.81 | 0% | 1.79 | |
| Region F | 333 | 0.76 | 0% | 5.80 | 209 | 0.60 | 0% | 5.26 | 133 | 0.49 | 0% | 4.93 | 189 | 1.39 | 10% | 2.56 | 125 | 1.06 | 3% | 2.29 | 70 | 0.60 | 0% | 1.81 | |
| Region G | 392 | 0.97 | 3% | 6.05 | 266 | 0.83 | 0% | 5.51 | 169 | 0.63 | 0% | 5.08 | 194 | 1.96 | 6% | 2.59 | 133 | 1.16 | 5% | 2.32 | 86 | 0.64 | 0% | 1.71 | |
| Region H | 442 | 1.37 | 6% | 6.27 | 362 | 1.27 | 0% | 5.93 | 280 | 1.05 | 0% | 5.57 | 179 | 1.67 | 5% | 2.52 | 151 | 1.48 | 6% | 2.40 | 123 | 1.48 | 1% | 1.71 | |
| Region I | 478 | 1.44 | 6% | 6.43 | 387 | 1.35 | 0% | 6.03 | 303 | 1.13 | 0% | 5.67 | 196 | 2.52 | 2% | 2.59 | 160 | 2.04 | 3% | 2.43 | 132 | 1.72 | 3% | 1.71 | |
| Region J | 454 | 1.31 | 3% | 6.33 | 355 | 1.17 | 0% | 5.89 | 272 | 0.97 | 0% | 5.53 | 196 | 2.14 | 5% | 2.59 | 161 | 1.65 | 7% | 2.44 | 132 | 1.27 | 8% | 1.71 | |
| Region K | 407 | 1.28 | 3% | 6.12 | 322 | 1.08 | 0% | 5.75 | 247 | 0.96 | 0% | 5.42 | 173 | 1.58 | 7% | 2.49 | 129 | 0.98 | 10% | 2.30 | 109 | 0.92 | 1% | 1.71 | |
| Individual locations | Region A | 498 | 1.37 | 4% | 6.52 | 424 | 1.33 | 0% | 6.19 | 346 | 1.19 | 0% | 5.85 | 260 | 2.22 | 13% | 2.87 | 173 | 2.06 | 0% | 2.49 | 126 | 1.64 | 2% | 1.71 |
| Region B | 474 | 1.11 | 5% | 6.41 | 377 | 1.10 | 0% | 5.99 | 298 | 1.03 | 0% | 5.65 | 221 | 1.78 | 9% | 2.70 | 163 | 1.51 | 5% | 2.45 | 120 | 1.28 | 4% | 1.71 | |
| Region C | 536 | 1.41 | 0% | 6.68 | 429 | 1.30 | 0% | 6.22 | 349 | 1.20 | 0% | 5.87 | 240 | 2.49 | 1% | 2.79 | 179 | 2.07 | 2% | 2.52 | 151 | 1.11 | 10% | 1.71 | |
| Region D | 512 | 1.35 | 0% | 6.58 | 392 | 1.15 | 0% | 6.05 | 301 | 0.97 | 0% | 5.66 | 230 | 1.89 | 12% | 2.74 | 182 | 1.65 | 10% | 2.53 | 137 | 1.28 | 8% | 1.71 | |
| Region E | 465 | 1.36 | 4% | 6.37 | 383 | 1.08 | 8% | 6.02 | 321 | 1.07 | 0% | 5.75 | 234 | 1.25 | 15% | 2.76 | 172 | 1.39 | 3% | 2.49 | 120 | 1.67 | 0% | 1.71 | |
| Region F | 491 | 1.18 | 3% | 6.49 | 385 | 1.12 | 0% | 6.02 | 300 | 0.96 | 0% | 5.66 | 269 | 1.42 | 15% | 2.91 | 211 | 1.15 | 3% | 2.66 | 157 | 1.07 | 4% | 1.94 | |
| Region G | 538 | 1.43 | 1% | 6.69 | 426 | 1.31 | 0% | 6.20 | 345 | 1.14 | 0% | 5.85 | 251 | 3.23 | 5% | 2.83 | 200 | 2.48 | 6% | 2.61 | 168 | 1.77 | 9% | 1.95 | |
| Region H | 579 | 1.82 | 0% | 6.87 | 484 | 1.68 | 0% | 6.45 | 412 | 1.54 | 0% | 6.14 | 232 | 2.75 | 5% | 2.75 | 202 | 1.99 | 10% | 2.62 | 179 | 1.58 | 13% | 1.97 | |
| Region I | 493 | 1.47 | 3% | 6.49 | 401 | 1.28 | 2% | 6.09 | 321 | 1.08 | 0% | 5.75 | 228 | 3.12 | 2% | 2.73 | 183 | 2.17 | 5% | 2.54 | 153 | 1.28 | 0% | 1.93 | |
| Region J | 498 | 1.39 | 2% | 6.52 | 428 | 1.31 | 2% | 6.21 | 366 | 1.26 | 0% | 5.94 | 226 | 1.89 | 11% | 2.72 | 183 | 1.57 | 11% | 2.54 | 157 | 1.19 | 11% | 1.71 | |
| Region K | 594 | 1.64 | 5% | 6.93 | 509 | 1.70 | 0% | 6.56 | 435 | 1.56 | 0% | 6.24 | 304 | 1.71 | 27% | 3.06 | 255 | 1.52 | 7% | 2.85 | 210 | 1.50 | 2% | 2.01 | |
| 24 h Forecasts | Current Technology Cost: PV @ $1000/kW, Storage @ $200/kWh | Future Technology Cost: PV @ $400/kW, Storage @ $50/kWh | |||||||||||||||||||||||
|---|---|---|---|---|---|---|---|---|---|---|---|---|---|---|---|---|---|---|---|---|---|---|---|---|---|
| No Flexibility | 2.5% Flexibility | 5% Flexibility | No Flexibility | 2.5% Flexibility | 5% Flexibility | ||||||||||||||||||||
| Electrical Region | Add’l $ per PVkW | Storage PV h | Over-Sizing | LCOE ¢/kWh | Add’l $ per PVkW | Storage PV h | Over-Sizing | LCOE ¢/kWh | Add’l $ per PVkW | Storage PV h | Over-Sizing | LCOE ¢/kWh | Add’l $ per PVkW | Storage PV h | Over-Sizing | LCOE ¢/kWh | Add’l $ per PVkW | Storage PV h | Over-Sizing | LCOE ¢/kWh | Add’l $ per PVkW | Storage PV h | Over-Sizing | LCOE ¢/kWh | |
| homogeneously dispersed fleets | Entire NYISO | 412 | 0.99 | 2% | 6.14 | 261 | 0.82 | 0% | 5.49 | 161 | 0.62 | 0% | 5.05 | 216 | 1.87 | 9% | 2.68 | 136 | 1.07 | 5% | 2.33 | 77 | 0.71 | 1% | 1.79 |
| Region A | 602 | 1.36 | 16% | 6.97 | 462 | 1.31 | 10% | 6.36 | 369 | 1.39 | 0% | 4.35 | 251 | 3.49 | 2% | 2.83 | 184 | 2.38 | 3% | 2.54 | 141 | 1.82 | 3% | 1.72 | |
| Region B | 602 | 1.44 | 12% | 6.97 | 467 | 1.46 | 3% | 6.38 | 355 | 1.36 | 0% | 5.89 | 269 | 3.04 | 5% | 2.91 | 189 | 2.34 | 4% | 2.56 | 140 | 1.67 | 4% | 1.84 | |
| Region C | 582 | 1.54 | 5% | 6.88 | 431 | 1.41 | 0% | 6.23 | 312 | 1.17 | 0% | 5.71 | 255 | 2.77 | 6% | 2.85 | 175 | 2.04 | 4% | 2.50 | 134 | 1.66 | 3% | 1.84 | |
| Region D | 535 | 1.27 | 3% | 6.68 | 387 | 1.08 | 0% | 6.03 | 274 | 0.93 | 0% | 5.54 | 246 | 2.72 | 6% | 2.81 | 186 | 1.91 | 7% | 2.55 | 134 | 1.59 | 2% | 1.84 | |
| Region E | 470 | 1.01 | 8% | 6.40 | 326 | 0.87 | 3% | 5.77 | 214 | 0.76 | 0% | 5.28 | 226 | 1.99 | 8% | 2.73 | 157 | 1.33 | 6% | 2.42 | 100 | 1.03 | 0% | 1.81 | |
| Region F | 567 | 1.53 | 8% | 6.82 | 416 | 1.39 | 1% | 6.16 | 300 | 1.20 | 0% | 5.66 | 262 | 2.22 | 12% | 2.88 | 195 | 1.37 | 6% | 2.59 | 130 | 1.26 | −2% | 1.83 | |
| Region G | 577 | 1.70 | 12% | 6.86 | 484 | 1.37 | 13% | 6.46 | 385 | 1.39 | 1% | 4.35 | 249 | 1.65 | 14% | 2.82 | 190 | 1.62 | 10% | 2.57 | 151 | 1.36 | 9% | 1.72 | |
| Region H | 734 | 2.47 | 13% | 7.54 | 649 | 2.17 | 14% | 7.17 | 580 | 2.01 | 9% | 4.35 | 278 | 2.83 | 9% | 2.95 | 234 | 2.47 | 10% | 2.76 | 203 | 2.18 | 11% | 1.72 | |
| Region I | 664 | 2.36 | 9% | 7.24 | 592 | 2.04 | 11% | 6.93 | 532 | 1.80 | 12% | 4.35 | 257 | 2.51 | 8% | 2.86 | 220 | 2.04 | 11% | 2.70 | 190 | 1.80 | 12% | 1.72 | |
| Region J | 735 | 2.76 | 9% | 7.55 | 632 | 2.34 | 10% | 7.10 | 548 | 2.01 | 10% | 4.35 | 267 | 2.76 | 9% | 2.90 | 219 | 2.41 | 9% | 2.69 | 186 | 2.01 | 10% | 1.72 | |
| Region K | 699 | 2.66 | 9% | 7.39 | 590 | 2.21 | 10% | 6.92 | 533 | 1.95 | 11% | 4.35 | 247 | 2.66 | 9% | 2.81 | 198 | 2.21 | 10% | 2.60 | 174 | 2.02 | 10% | 1.72 | |
| Individual locations | Region A | 696 | 1.43 | 22% | 7.38 | 584 | 1.50 | 12% | 6.89 | 480 | 1.42 | 0% | 4.35 | 285 | 3.97 | 3% | 2.98 | 237 | 2.85 | 6% | 2.77 | 192 | 1.89 | 9% | 1.72 |
| Region B | 706 | 1.79 | 4% | 7.42 | 566 | 1.61 | 0% | 6.81 | 442 | 1.40 | 0% | 4.35 | 324 | 3.28 | 12% | 3.15 | 245 | 2.99 | 4% | 2.80 | 174 | 2.11 | 2% | 1.72 | |
| Region C | 761 | 2.14 | 1% | 7.66 | 641 | 2.03 | 0% | 7.14 | 536 | 1.85 | 0% | 4.35 | 310 | 3.50 | 7% | 3.09 | 238 | 2.82 | 5% | 2.77 | 191 | 2.48 | 3% | 1.72 | |
| Region D | 616 | 1.51 | 3% | 7.03 | 492 | 1.33 | 2% | 6.49 | 388 | 1.19 | 0% | 4.35 | 265 | 2.40 | 12% | 2.89 | 213 | 1.83 | 12% | 2.67 | 167 | 1.29 | 12% | 1.72 | |
| Region E | 626 | 1.41 | 6% | 7.07 | 500 | 1.41 | −2% | 6.52 | 392 | 1.23 | 0% | 4.35 | 306 | 3.39 | 7% | 3.07 | 233 | 2.20 | 9% | 2.75 | 174 | 1.60 | 8% | 1.72 | |
| Region F | 797 | 2.43 | 8% | 7.82 | 651 | 2.30 | 0% | 7.18 | 533 | 2.00 | 0% | 6.67 | 350 | 2.83 | 20% | 3.26 | 283 | 2.39 | 18% | 2.97 | 238 | 2.45 | 1% | 1.92 | |
| Region G | 733 | 2.43 | 2% | 7.54 | 605 | 2.00 | 6% | 6.98 | 512 | 1.57 | 12% | 6.58 | 298 | 2.93 | 11% | 3.04 | 247 | 2.26 | 13% | 2.81 | 199 | 1.52 | 15% | 1.89 | |
| Region H | 770 | 2.47 | 16% | 7.70 | 676 | 2.17 | 16% | 7.29 | 602 | 2.08 | 8% | 6.97 | 283 | 3.31 | 7% | 2.97 | 239 | 2.69 | 9% | 2.78 | 206 | 2.30 | 10% | 1.90 | |
| Region I | 743 | 2.19 | 18% | 7.58 | 646 | 2.01 | 16% | 7.16 | 556 | 1.84 | 13% | 6.77 | 270 | 3.07 | 6% | 2.91 | 233 | 2.48 | 9% | 2.75 | 197 | 1.96 | 11% | 1.89 | |
| Region J | 788 | 2.95 | 10% | 7.78 | 671 | 2.45 | 11% | 7.27 | 562 | 1.97 | 0% | 4.35 | 285 | 2.95 | 10% | 2.98 | 237 | 2.45 | 11% | 2.77 | 199 | 1.97 | 12% | 1.72 | |
| Region K | 882 | 2.74 | 5% | 8.19 | 758 | 2.64 | −2% | 7.65 | 650 | 2.40 | 0% | 7.18 | 369 | 2.60 | 29% | 3.35 | 322 | 2.53 | 29% | 3.14 | 292 | 2.46 | 29% | 1.97 | |
| Firm Power Gen | Current Cost: PV @ 1000/kW, Storage @ $200/kWh | Future Cost: PV @ 400/kW, Storage @ $50/kWh | |||||||||||||||||||||||
|---|---|---|---|---|---|---|---|---|---|---|---|---|---|---|---|---|---|---|---|---|---|---|---|---|---|
| No Flexibility | 2.5% Flexibility | 5% Flexibility | no Flexibility | 2.5% Flexibility | 5% Flexibility | ||||||||||||||||||||
| Electrical Region | Add’l $ per PVkW | Storage PV h | Over-Sizing | LCOE ¢/kWh | Add’l $ per PVkW | Storage PV h | Over-Sizing | LCOE ¢/kWh | Add’l $ per PVkW | Storage PV h | Over-Sizing | LCOE ¢/kWh | Add’l $ per PVkW | Storage PV h | Over-Sizing | LCOE ¢/kWh | Add’l $ per PVkW | Storage PV h | Over-Sizing | LCOE ¢/kWh | Add’l $ per PVkW | Storage PV h | Over-Sizing | LCOE ¢/kWh | |
| homogeneously dispersed fleets | Entire NYISO | 3299 | 6.7 | 197% | 19.33 | 2062 | 4.4 | 118% | 14.17 | 1654 | 3.7 | 92% | 12.17 | 1107 | 6.8 | 192% | 6.68 | 683 | 4.8 | 111% | 5.47 | 541 | 4.2 | 83% | 4.85 |
| Region A | 4390 | 5.6 | 328% | 24.32 | 2630 | 4.5 | 174% | 16.89 | 2143 | 3.5 | 145% | 14.40 | 1581 | 6.6 | 313% | 8.87 | 900 | 5.2 | 161% | 6.52 | 734 | 4.1 | 132% | 5.74 | |
| Region B | 4313 | 7.3 | 285% | 24.26 | 2634 | 4.6 | 171% | 16.94 | 2141 | 3.6 | 142% | 14.46 | 1505 | 7.3 | 285% | 8.57 | 898 | 5.1 | 160% | 6.52 | 731 | 4.1 | 132% | 5.76 | |
| Region C | 4541 | 10.4 | 245% | 25.97 | 2626 | 4.9 | 164% | 17.12 | 2153 | 4.0 | 136% | 14.67 | 1503 | 10.4 | 245% | 8.76 | 877 | 5.6 | 149% | 6.54 | 719 | 4.8 | 120% | 5.78 | |
| Region D | 4088 | 8.2 | 245% | 23.25 | 2881 | 5.5 | 179% | 18.06 | 2411 | 4.7 | 148% | 15.65 | 1376 | 8.3 | 241% | 7.99 | 975 | 6.0 | 169% | 6.90 | 810 | 5.1 | 139% | 6.12 | |
| Region E | 4209 | 7.7 | 267% | 23.76 | 2630 | 5.1 | 161% | 16.99 | 2181 | 4.3 | 132% | 14.72 | 1434 | 9.0 | 245% | 8.29 | 886 | 5.8 | 149% | 6.54 | 732 | 4.7 | 125% | 5.83 | |
| Region F | 4001 | 10.8 | 184% | 22.75 | 2273 | 5.2 | 122% | 15.07 | 1863 | 4.5 | 96% | 13.03 | 1276 | 10.8 | 184% | 7.48 | 733 | 6.0 | 109% | 5.71 | 594 | 5.1 | 85% | 5.08 | |
| Region G | 3417 | 10.2 | 138% | 19.31 | 2031 | 6.3 | 78% | 13.65 | 1689 | 4.6 | 76% | 11.86 | 1049 | 10.9 | 126% | 6.24 | 624 | 6.3 | 77% | 5.08 | 519 | 5.3 | 64% | 4.62 | |
| Region H | 3541 | 11.8 | 118% | 19.55 | 2119 | 6.5 | 81% | 13.80 | 1759 | 5.1 | 75% | 12.02 | 1063 | 11.8 | 118% | 6.17 | 641 | 6.9 | 74% | 5.16 | 534 | 5.8 | 61% | 4.71 | |
| Region I | 3026 | 11.4 | 74% | 17.30 | 1984 | 6.1 | 75% | 12.98 | 1625 | 5.1 | 61% | 11.35 | 868 | 11.4 | 74% | 5.34 | 581 | 7.5 | 52% | 4.82 | 470 | 6.0 | 42% | 4.38 | |
| Region J | 3043 | 10.6 | 92% | 17.29 | 1964 | 6.4 | 68% | 12.93 | 1586 | 5.2 | 55% | 11.17 | 875 | 12.6 | 61% | 5.42 | 565 | 7.3 | 50% | 4.70 | 457 | 6.0 | 40% | 4.24 | |
| Region K | 2898 | 10.8 | 74% | 16.38 | 1823 | 6.1 | 61% | 12.16 | 1524 | 5.0 | 51% | 10.81 | 836 | 10.8 | 74% | 5.09 | 538 | 6.4 | 54% | 4.52 | 446 | 5.7 | 40% | 4.25 | |
| Individual locations | Entire NYISO | 4215 | 10.2 | 217% | 24.65 | 2352 | 5.2 | 132% | 16.02 | 1941 | 4.2 | 111% | 13.85 | 1385 | 12.0 | 197% | 8.35 | 773 | 5.6 | 124% | 6.06 | 640 | 4.6 | 102% | 5.42 |
| Region A | 4396 | 6.2 | 315% | 24.91 | 2768 | 4.5 | 186% | 17.80 | 2249 | 3.7 | 151% | 15.13 | 1570 | 6.4 | 313% | 8.98 | 951 | 5.2 | 173% | 6.85 | 772 | 4.3 | 139% | 5.99 | |
| Region B | 4081 | 7.8 | 253% | 23.57 | 2592 | 4.7 | 165% | 16.95 | 2137 | 3.8 | 137% | 14.61 | 1400 | 7.8 | 253% | 8.22 | 878 | 5.4 | 152% | 6.53 | 712 | 5.0 | 115% | 5.77 | |
| Region C | 4607 | 7.4 | 313% | 25.84 | 2691 | 5.4 | 160% | 17.50 | 2222 | 4.4 | 134% | 15.07 | 1589 | 7.5 | 304% | 9.04 | 889 | 6.2 | 145% | 6.59 | 742 | 5.0 | 123% | 5.90 | |
| Region D | 4210 | 8.8 | 245% | 24.41 | 2893 | 5.3 | 183% | 18.47 | 2451 | 4.2 | 160% | 16.08 | 1381 | 9.0 | 233% | 8.22 | 990 | 5.7 | 176% | 7.04 | 828 | 5.4 | 140% | 6.32 | |
| Region E | 6099 | 22.5 | 160% | 35.11 | 2725 | 5.6 | 160% | 17.86 | 2241 | 4.4 | 136% | 15.32 | 1765 | 22.5 | 160% | 10.50 | 897 | 6.6 | 142% | 6.75 | 737 | 5.7 | 113% | 6.01 | |
| Region F | 4171 | 11.6 | 185% | 23.04 | 2325 | 5.7 | 119% | 15.00 | 1906 | 4.8 | 94% | 12.96 | 1321 | 11.6 | 185% | 7.52 | 736 | 6.5 | 103% | 5.63 | 597 | 5.6 | 80% | 5.01 | |
| Region G | 3898 | 9.9 | 192% | 20.94 | 2140 | 6.2 | 90% | 13.90 | 1753 | 4.9 | 77% | 12.01 | 1160 | 13.5 | 121% | 6.70 | 652 | 6.7 | 79% | 5.15 | 534 | 5.8 | 61% | 4.65 | |
| Region H | 3420 | 11.0 | 121% | 19.00 | 2148 | 6.3 | 89% | 13.90 | 1788 | 5.1 | 77% | 12.15 | 1036 | 11.0 | 121% | 6.06 | 655 | 7.2 | 74% | 5.21 | 545 | 6.0 | 62% | 4.76 | |
| Region I | 2942 | 11.0 | 74% | 16.86 | 1982 | 6.2 | 74% | 12.92 | 1617 | 5.2 | 59% | 11.30 | 847 | 11.0 | 74% | 5.23 | 594 | 6.6 | 66% | 4.77 | 468 | 6.0 | 42% | 4.36 | |
| Region J | 3153 | 11.6 | 83% | 17.89 | 1944 | 6.6 | 62% | 12.91 | 1580 | 5.0 | 58% | 11.25 | 893 | 13.0 | 61% | 5.52 | 560 | 7.2 | 50% | 4.69 | 455 | 6.1 | 38% | 4.24 | |
| Region K | 3171 | 9.6 | 125% | 17.40 | 1887 | 6.3 | 63% | 12.51 | 1578 | 5.1 | 56% | 11.09 | 939 | 11.9 | 86% | 5.57 | 559 | 6.6 | 57% | 4.64 | 466 | 5.6 | 46% | 4.35 | |
| Firm Power Gen | Current Cost: PV @ 1000/kW, Storage @ $200/kWh | Future Cost: PV @ 400/kW, Storage @ $50/kWh | |||||||||||||||||||||||
|---|---|---|---|---|---|---|---|---|---|---|---|---|---|---|---|---|---|---|---|---|---|---|---|---|---|
| No Flexibility | 2.5% Flexibility | 5% Flexibility | No Flexibility | 2.5% Flexibility | 5% Flexibility | ||||||||||||||||||||
| Electrical Region | Add’l $ per PVkW | Storage PV h | Over-Sizing | LCOE ¢/kWh | Add’l $ per PVkW | Storage PV h | Over-Sizing | LCOE ¢/kWh | Add’l $ per PVkW | Storage PV h | Over-Sizing | LCOE ¢/kWh | Add’l $ per PVkW | Storage PV h | Over-Sizing | LCOE ¢/kWh | Add’l $ per PVkW | Storage PV h | Over-Sizing | LCOE ¢/kWh | Add’l $ per PVkW | Storage PV h | Over-Sizing | LCOE ¢/kWh | |
| homogeneously dispersed fleets | Entire NYISO | 42,757 | 213.8 | 0% | 220 | 37,535 | 187.7 | 0% | 189 | 32,037 | 160.2 | 0% | 158 | 10,689 | 213.8 | 0% | 56 | 9384 | 187.7 | 0% | 49 | 8009 | 160.2 | 0% | 41 |
| Region A | 52,591 | 263.0 | 0% | 275 | 48,166 | 240.8 | 0% | 247 | 43,508 | 217.5 | 0% | 218 | 13,148 | 263.0 | 0% | 70 | 12,042 | 240.8 | 0% | 63 | 10,877 | 217.5 | 0% | 56 | |
| Region B | 51,671 | 258.4 | 0% | 271 | 47,068 | 235.3 | 0% | 242 | 42,227 | 211.1 | 0% | 212 | 12,918 | 258.4 | 0% | 68 | 11,767 | 235.3 | 0% | 62 | 10,557 | 211.1 | 0% | 54 | |
| Region C | 52,172 | 260.9 | 0% | 275 | 47,712 | 238.6 | 0% | 247 | 43,017 | 215.1 | 0% | 217 | 13,043 | 260.9 | 0% | 70 | 11,928 | 238.6 | 0% | 63 | 10,754 | 215.1 | 0% | 56 | |
| Region D | 60,504 | 302.5 | 0% | 314 | 56,277 | 281.4 | 0% | 286 | 51,914 | 259.6 | 0% | 257 | 15,126 | 302.5 | 0% | 79 | 14,069 | 281.4 | 0% | 73 | 12,979 | 259.6 | 0% | 66 | |
| Region E | 55,382 | 276.9 | 0% | 288 | 50,794 | 254.0 | 0% | 259 | 46,033 | 230.2 | 0% | 229 | 13,845 | 276.9 | 0% | 73 | 12,699 | 254.0 | 0% | 66 | 11,508 | 230.2 | 0% | 59 | |
| Region F | 45,056 | 225.3 | 0% | 229 | 39,866 | 199.3 | 0% | 199 | 34,420 | 172.1 | 0% | 168 | 11,264 | 225.3 | 0% | 58 | 9966 | 199.3 | 0% | 51 | 8605 | 172.1 | 0% | 43 | |
| Region G | 35,207 | 176.0 | 0% | 172 | 29,625 | 148.1 | 0% | 143 | 25,758 | 128.8 | 0% | 122 | 8802 | 176.0 | 0% | 44 | 7406 | 148.1 | 0% | 37 | 6440 | 128.8 | 0% | 32 | |
| Region H | 37,090 | 185.4 | 0% | 177 | 31,515 | 157.6 | 0% | 148 | 26,945 | 134.7 | 0% | 124 | 9272 | 185.4 | 0% | 45 | 7879 | 157.6 | 0% | 38 | 6736 | 134.7 | 0% | 32 | |
| Region I | 31,524 | 157.6 | 0% | 149 | 28,667 | 143.3 | 0% | 133 | 27,941 | 139.7 | 0% | 127 | 7881 | 157.6 | 0% | 38 | 7167 | 143.3 | 0% | 35 | 6985 | 139.7 | 0% | 33 | |
| Region J | 29,700 | 148.5 | 0% | 141 | 26,802 | 134.0 | 0% | 125 | 26,952 | 134.8 | 0% | 123 | 7425 | 148.5 | 0% | 36 | 6700 | 134.0 | 0% | 32 | 6738 | 134.8 | 0% | 32 | |
| Region K | 32,438 | 162.2 | 0% | 150 | 29,746 | 148.7 | 0% | 136 | 30,915 | 154.6 | 0% | 137 | 8109 | 162.2 | 0% | 38 | 7436 | 148.7 | 0% | 35 | 7729 | 154.6 | 0% | 36 | |
| Individual locations | Entire NYISO | 45,194 | 226.0 | 0% | 240 | 40,565 | 202.8 | 0% | 212 | 35,693 | 178.5 | 0% | 182 | 11,298 | 226.0 | 0% | 61 | 10,141 | 202.8 | 0% | 54 | 8923 | 178.5 | 0% | 47 |
| Region A | 52,287 | 261.4 | 0% | 279 | 47,942 | 239.7 | 0% | 251 | 43,522 | 217.6 | 0% | 222 | 13,072 | 261.4 | 0% | 70 | 11,985 | 239.7 | 0% | 64 | 10,881 | 217.6 | 0% | 57 | |
| Region B | 49,154 | 245.8 | 0% | 260 | 44,589 | 222.9 | 0% | 232 | 39,783 | 198.9 | 0% | 202 | 12,288 | 245.8 | 0% | 66 | 11,147 | 222.9 | 0% | 59 | 9946 | 198.9 | 0% | 52 | |
| Region C | 53,964 | 269.8 | 0% | 286 | 49,517 | 247.6 | 0% | 257 | 44,835 | 224.2 | 0% | 227 | 13,491 | 269.8 | 0% | 72 | 12,379 | 247.6 | 0% | 65 | 11,209 | 224.2 | 0% | 58 | |
| Region D | 59,102 | 295.5 | 0% | 314 | 55,050 | 275.2 | 0% | 286 | 50,784 | 253.9 | 0% | 257 | 14,776 | 295.5 | 0% | 79 | 13,762 | 275.2 | 0% | 73 | 12,696 | 253.9 | 0% | 66 | |
| Region E | 52,808 | 264.0 | 0% | 282 | 48,348 | 241.7 | 0% | 253 | 43,697 | 218.5 | 0% | 223 | 13,202 | 264.0 | 0% | 71 | 12,087 | 241.7 | 0% | 64 | 10,924 | 218.5 | 0% | 57 | |
| Region F | 43,974 | 219.9 | 0% | 219 | 38,660 | 193.3 | 0% | 189 | 33,372 | 166.9 | 0% | 159 | 10,994 | 219.9 | 0% | 55 | 9665 | 193.3 | 0% | 48 | 8343 | 166.9 | 0% | 41 | |
| Region G | 33,974 | 169.9 | 0% | 164 | 28,323 | 141.6 | 0% | 135 | 26,046 | 130.2 | 0% | 121 | 8493 | 169.9 | 0% | 42 | 7081 | 141.6 | 0% | 35 | 6511 | 130.2 | 0% | 32 | |
| Region H | 37,211 | 186.1 | 0% | 178 | 31,648 | 158.2 | 0% | 149 | 26,951 | 134.8 | 0% | 124 | 9303 | 186.1 | 0% | 45 | 7912 | 158.2 | 0% | 39 | 6738 | 134.8 | 0% | 32 | |
| Region I | 31,266 | 156.3 | 0% | 148 | 28,495 | 142.5 | 0% | 132 | 27,956 | 139.8 | 0% | 127 | 7817 | 156.3 | 0% | 37 | 7124 | 142.5 | 0% | 34 | 6989 | 139.8 | 0% | 33 | |
| Region J | 30,548 | 152.7 | 0% | 145 | 27,833 | 139.2 | 0% | 130 | 27,441 | 137.2 | 0% | 125 | 7637 | 152.7 | 0% | 37 | 6958 | 139.2 | 0% | 34 | 6860 | 137.2 | 0% | 33 | |
| Region K | 32,991 | 165.0 | 0% | 154 | 30,325 | 151.6 | 0% | 139 | 30,896 | 154.5 | 0% | 138 | 8248 | 165.0 | 0% | 39 | 7581 | 151.6 | 0% | 36 | 7724 | 154.5 | 0% | 36 | |
| Firm Power Gen | Current Cost: PV @ 1000/kW, Storage @ $200/kWh | Future Cost: PV @ 400/kW, Storage @ $50/kWh | |||||||||||||||||||||||
|---|---|---|---|---|---|---|---|---|---|---|---|---|---|---|---|---|---|---|---|---|---|---|---|---|---|
| No Flexibility | 2.5% Flexibility | 5% Flexibility | No Flexibility | 2.5% Flexibility | 5% Flexibility | ||||||||||||||||||||
| Electrical Region | Add’l $ per PVkW | Storage PV h | Over-Sizing | LCOE ¢/kWh | Add’l $ per PVkW | Storage PV h | Over-Sizing | LCOE ¢/kWh | Add’l $ per PVkW | Storage PV h | Over-Sizing | LCOE ¢/kWh | Add’l $ per PVkW | Storage PV h | Over-Sizing | LCOE ¢/kWh | Add’l $ per PVkW | Storage PV h | Over-Sizing | LCOE ¢/kWh | Add’l $ per PVkW | Storage PV h | Over-Sizing | LCOE ¢/kWh | |
| homogeneously dispersed fleets | Entire NYISO | 936 | 4.4 | 5% | 8.93 | 541 | 1.6 | 23% | 7.00 | 428 | 0.8 | 26% | 6.28 | 242 | 4.4 | 5% | 2.90 | 151 | 2.0 | 13% | 2.74 | 135 | 1.0 | 21% | 2.59 |
| Region A | 1074 | 4.5 | 17% | 9.75 | 594 | 1.6 | 28% | 7.44 | 455 | 1.1 | 24% | 6.64 | 293 | 4.5 | 17% | 3.20 | 167 | 2.0 | 17% | 2.93 | 143 | 1.2 | 21% | 2.75 | |
| Region B | 1064 | 4.8 | 10% | 9.74 | 618 | 1.7 | 29% | 7.49 | 477 | 1.1 | 25% | 6.71 | 282 | 4.8 | 10% | 3.16 | 203 | 1.6 | 31% | 2.99 | 140 | 1.6 | 15% | 2.72 | |
| Region C | 1081 | 4.9 | 10% | 9.91 | 623 | 2.0 | 22% | 7.67 | 500 | 1.2 | 26% | 6.87 | 286 | 4.9 | 10% | 3.20 | 178 | 2.2 | 17% | 2.98 | 156 | 1.3 | 22% | 2.81 | |
| Region D | 1261 | 5.8 | 10% | 10.68 | 661 | 2.4 | 19% | 7.81 | 541 | 1.4 | 27% | 7.00 | 331 | 5.8 | 10% | 3.38 | 192 | 2.4 | 18% | 3.04 | 168 | 1.5 | 23% | 2.87 | |
| Region E | 1146 | 4.6 | 23% | 10.02 | 613 | 2.1 | 20% | 7.54 | 488 | 1.2 | 24% | 6.76 | 310 | 5.4 | 10% | 3.28 | 170 | 2.8 | 8% | 2.92 | 138 | 1.9 | 10% | 2.75 | |
| Region F | 1173 | 5.6 | 5% | 10.03 | 658 | 2.5 | 17% | 7.66 | 526 | 1.6 | 20% | 6.84 | 301 | 5.6 | 5% | 3.17 | 183 | 2.6 | 14% | 2.97 | 155 | 1.8 | 17% | 2.79 | |
| Region G | 1244 | 5.7 | 10% | 9.89 | 645 | 2.1 | 23% | 7.23 | 506 | 1.6 | 18% | 6.48 | 318 | 5.7 | 8% | 3.10 | 184 | 2.3 | 17% | 2.85 | 147 | 1.8 | 15% | 2.65 | |
| Region H | 1214 | 5.5 | 11% | 9.50 | 674 | 2.1 | 25% | 7.15 | 523 | 1.5 | 22% | 6.36 | 319 | 5.5 | 11% | 3.03 | 189 | 2.5 | 17% | 2.80 | 157 | 1.6 | 19% | 2.61 | |
| Region I | 1226 | 5.4 | 14% | 9.44 | 691 | 2.2 | 25% | 7.17 | 539 | 1.4 | 26% | 6.35 | 327 | 5.4 | 14% | 3.02 | 186 | 2.9 | 10% | 2.77 | 158 | 1.7 | 18% | 2.60 | |
| Region J | 1244 | 5.3 | 18% | 9.51 | 691 | 2.3 | 23% | 7.20 | 545 | 1.4 | 26% | 6.38 | 340 | 5.5 | 17% | 3.08 | 186 | 2.9 | 10% | 2.77 | 159 | 1.7 | 19% | 2.61 | |
| Region K | 1196 | 4.8 | 23% | 9.05 | 716 | 2.3 | 26% | 7.07 | 535 | 1.6 | 21% | 6.19 | 331 | 4.9 | 21% | 2.96 | 199 | 2.7 | 17% | 2.69 | 157 | 1.8 | 17% | 2.49 | |
| Individual locations | Entire NYISO | 1202 | 4.7 | 26% | 10.47 | 717 | 2.8 | 17% | 8.24 | 576 | 1.9 | 20% | 7.40 | 327 | 5.4 | 14% | 3.42 | 199 | 2.9 | 14% | 3.12 | 160 | 2.4 | 10% | 2.91 |
| Region A | 1113 | 4.7 | 17% | 10.14 | 630 | 2.2 | 19% | 7.85 | 510 | 1.3 | 25% | 7.07 | 303 | 4.7 | 17% | 3.31 | 183 | 2.3 | 17% | 3.08 | 156 | 1.5 | 20% | 2.91 | |
| Region B | 1068 | 4.3 | 21% | 9.78 | 642 | 2.2 | 21% | 7.79 | 512 | 1.5 | 22% | 6.99 | 296 | 4.6 | 17% | 3.25 | 176 | 2.9 | 8% | 2.95 | 152 | 1.7 | 17% | 2.84 | |
| Region C | 1089 | 4.9 | 10% | 9.98 | 673 | 2.6 | 15% | 8.01 | 573 | 1.5 | 28% | 7.26 | 288 | 4.9 | 10% | 3.22 | 186 | 2.9 | 10% | 3.06 | 174 | 1.7 | 23% | 2.94 | |
| Region D | 1253 | 5.7 | 10% | 10.88 | 721 | 2.5 | 22% | 8.28 | 594 | 1.7 | 26% | 7.46 | 329 | 5.7 | 10% | 3.45 | 202 | 2.7 | 17% | 3.18 | 168 | 2.5 | 10% | 2.99 | |
| Region E | 1424 | 5.2 | 38% | 11.58 | 744 | 2.7 | 21% | 8.45 | 602 | 2.0 | 21% | 7.56 | 374 | 6.6 | 10% | 3.70 | 207 | 2.9 | 15% | 3.24 | 175 | 2.1 | 17% | 3.03 | |
| Region F | 1230 | 5.7 | 8% | 10.05 | 722 | 2.8 | 17% | 7.79 | 578 | 1.8 | 22% | 6.94 | 320 | 5.7 | 8% | 3.18 | 194 | 3.0 | 10% | 2.95 | 167 | 2.0 | 17% | 2.81 | |
| Region G | 1228 | 5.9 | 5% | 9.73 | 692 | 2.5 | 19% | 7.40 | 544 | 1.8 | 18% | 6.60 | 315 | 5.9 | 5% | 3.06 | 185 | 2.9 | 10% | 2.86 | 154 | 2.0 | 13% | 2.67 | |
| Region H | 1223 | 5.6 | 11% | 9.56 | 673 | 2.2 | 23% | 7.18 | 530 | 1.6 | 21% | 6.42 | 322 | 5.6 | 11% | 3.04 | 190 | 2.5 | 17% | 2.81 | 155 | 1.8 | 17% | 2.62 | |
| Region I | 1233 | 5.3 | 17% | 9.42 | 689 | 2.3 | 23% | 7.16 | 537 | 1.5 | 23% | 6.34 | 333 | 5.3 | 16% | 3.03 | 187 | 2.9 | 10% | 2.77 | 160 | 1.7 | 19% | 2.60 | |
| Region J | 1241 | 5.3 | 18% | 9.52 | 701 | 2.7 | 17% | 7.30 | 551 | 1.7 | 22% | 6.46 | 337 | 5.4 | 17% | 3.07 | 195 | 2.8 | 14% | 2.81 | 160 | 1.9 | 17% | 2.63 | |
| Region K | 1242 | 4.9 | 27% | 9.31 | 741 | 2.4 | 26% | 7.25 | 560 | 1.7 | 22% | 6.38 | 351 | 4.9 | 27% | 3.06 | 206 | 2.8 | 17% | 2.77 | 156 | 2.3 | 10% | 2.53 | |
| Firm Power Gen | Current Cost: PV @ 1000/kW, Storage @ $200/kWh | Future Cost: PV @ 400/kW, Storage @ $50/kWh | |||||||||||||||||||||||
|---|---|---|---|---|---|---|---|---|---|---|---|---|---|---|---|---|---|---|---|---|---|---|---|---|---|
| No Flexibility | 2.5% Flexibility | 5% Flexibility | No Flexibility | 2.5% Flexibility | 5% Flexibility | ||||||||||||||||||||
| Electrical Region | Add’l $ per PVkW | Storage PV h | Over-Sizing | LCOE ¢/kWh | Add’l $ per PVkW | Storage PV h | Over-Sizing | LCOE ¢/kWh | Add’l $ per PVkW | Storage PV h | Over-Sizing | LCOE ¢/kWh | Add’l $ per PVkW | Storage PV h | Over-Sizing | LCOE ¢/kWh | Add’l $ per PVkW | Storage PV h | Over-Sizing | LCOE ¢/kWh | Add’l $ per PVkW | Storage PV h | Over-Sizing | LCOE ¢/kWh | |
| homogeneously dispersed fleets | Entire NYISO | 1813 | 3.6 | 109% | 12.53 | 1014 | 2.6 | 50% | 9.21 | 810 | 2.1 | 40% | 8.56 | 596 | 3.8 | 101% | 4.39 | 316 | 3.0 | 42% | 3.55 | 249 | 3.1 | 23% | 3.40 |
| Region A | 2345 | 3.7 | 160% | 15.14 | 1234 | 2.5 | 74% | 10.31 | 983 | 2.6 | 46% | 9.37 | 817 | 3.7 | 158% | 5.44 | 408 | 3.1 | 63% | 4.00 | 312 | 3.1 | 40% | 3.60 | |
| Region B | 2385 | 3.9 | 160% | 15.34 | 1279 | 2.6 | 76% | 10.56 | 1032 | 2.2 | 59% | 9.31 | 823 | 4.0 | 156% | 5.47 | 416 | 3.3 | 63% | 4.08 | 321 | 3.0 | 42% | 3.67 | |
| Region C | 2479 | 5.8 | 132% | 16.19 | 1251 | 2.8 | 69% | 10.55 | 1006 | 2.6 | 49% | 9.31 | 787 | 6.3 | 118% | 5.46 | 405 | 3.2 | 61% | 4.05 | 314 | 3.2 | 39% | 3.66 | |
| Region D | 2221 | 5.1 | 120% | 14.71 | 1319 | 3.2 | 68% | 10.73 | 1095 | 3.0 | 49% | 9.69 | 735 | 5.1 | 120% | 5.10 | 425 | 3.5 | 63% | 4.09 | 340 | 3.6 | 40% | 3.75 | |
| Region E | 2559 | 4.8 | 160% | 16.15 | 1421 | 3.1 | 79% | 11.27 | 1147 | 2.7 | 61% | 9.89 | 865 | 5.0 | 154% | 5.67 | 467 | 3.4 | 74% | 4.36 | 364 | 3.3 | 50% | 3.93 | |
| Region F | 2263 | 5.9 | 109% | 14.66 | 1177 | 3.3 | 51% | 9.93 | 979 | 2.9 | 39% | 9.20 | 709 | 6.0 | 102% | 4.90 | 358 | 4.0 | 40% | 3.74 | 293 | 3.5 | 30% | 3.50 | |
| Region G | 1915 | 6.1 | 70% | 12.65 | 1079 | 3.5 | 37% | 9.15 | 902 | 3.4 | 23% | 8.70 | 564 | 7.3 | 50% | 4.15 | 320 | 3.9 | 31% | 3.45 | 260 | 3.4 | 23% | 3.59 | |
| Region H | 2302 | 7.6 | 77% | 14.08 | 1311 | 4.1 | 50% | 10.04 | 1081 | 3.3 | 42% | 8.99 | 690 | 7.9 | 74% | 4.57 | 391 | 4.5 | 41% | 3.80 | 318 | 3.8 | 33% | 3.60 | |
| Region I | 1748 | 7.2 | 31% | 11.72 | 1047 | 3.8 | 29% | 8.80 | 861 | 3.7 | 13% | 8.28 | 484 | 7.2 | 31% | 3.69 | 294 | 4.1 | 22% | 3.30 | 234 | 3.7 | 13% | 3.37 | |
| Region J | 1721 | 6.3 | 46% | 11.51 | 1006 | 3.6 | 29% | 8.67 | 818 | 3.4 | 14% | 8.32 | 482 | 7.8 | 23% | 3.72 | 279 | 3.9 | 21% | 3.30 | 225 | 3.8 | 9% | 3.47 | |
| Region K | 1731 | 6.2 | 50% | 11.28 | 1055 | 3.6 | 33% | 8.75 | 866 | 3.3 | 21% | 8.12 | 507 | 6.2 | 49% | 3.67 | 309 | 3.7 | 31% | 3.39 | 243 | 3.6 | 15% | 3.39 | |
| Individual locations | Entire NYISO | 2347 | 5.8 | 119% | 15.69 | 1257 | 3.1 | 63% | 10.67 | 1057 | 3.1 | 45% | 9.71 | 765 | 5.8 | 119% | 5.37 | 392 | 3.6 | 53% | 4.01 | 318 | 3.6 | 34% | 3.74 |
| Region A | 2417 | 4.1 | 160% | 15.79 | 1355 | 2.6 | 84% | 11.05 | 1062 | 3.1 | 44% | 9.75 | 845 | 4.1 | 160% | 5.68 | 445 | 3.3 | 70% | 4.27 | 329 | 3.4 | 40% | 3.78 | |
| Region B | 2336 | 5.1 | 132% | 15.48 | 1301 | 2.6 | 78% | 10.76 | 1031 | 2.8 | 47% | 9.49 | 769 | 5.2 | 128% | 5.34 | 418 | 3.5 | 61% | 4.14 | 319 | 3.2 | 40% | 3.71 | |
| Region C | 2457 | 4.3 | 160% | 15.88 | 1301 | 3.2 | 67% | 10.85 | 1074 | 3.0 | 48% | 9.69 | 835 | 4.3 | 155% | 5.60 | 417 | 3.4 | 61% | 4.12 | 333 | 3.5 | 40% | 3.79 | |
| Region D | 2280 | 4.8 | 132% | 15.26 | 1390 | 3.2 | 75% | 11.28 | 1157 | 3.4 | 47% | 10.17 | 752 | 4.9 | 127% | 5.28 | 450 | 3.6 | 67% | 4.29 | 359 | 3.5 | 46% | 3.91 | |
| Region E | 3703 | 14.0 | 90% | 23.11 | 1535 | 3.4 | 85% | 12.08 | 1261 | 3.4 | 58% | 10.71 | 1061 | 14.0 | 90% | 7.04 | 499 | 3.9 | 76% | 4.62 | 390 | 3.8 | 50% | 4.15 | |
| Region F | 2258 | 6.5 | 96% | 14.39 | 1218 | 3.7 | 48% | 9.92 | 1038 | 3.2 | 39% | 9.13 | 706 | 6.9 | 90% | 4.81 | 362 | 4.1 | 40% | 3.69 | 305 | 3.9 | 28% | 3.48 | |
| Region G | 2108 | 6.3 | 84% | 13.30 | 1118 | 3.8 | 36% | 9.22 | 936 | 3.5 | 23% | 8.77 | 603 | 8.1 | 50% | 4.29 | 327 | 4.1 | 30% | 3.43 | 264 | 3.9 | 17% | 3.53 | |
| Region H | 2207 | 7.7 | 66% | 13.75 | 1293 | 3.9 | 51% | 9.96 | 1071 | 3.2 | 43% | 8.96 | 651 | 7.7 | 66% | 4.42 | 387 | 4.4 | 42% | 3.78 | 314 | 3.8 | 31% | 3.60 | |
| Region I | 1676 | 6.8 | 32% | 11.35 | 1055 | 3.5 | 36% | 8.81 | 853 | 3.6 | 14% | 8.22 | 467 | 6.8 | 32% | 3.60 | 304 | 3.8 | 28% | 3.35 | 234 | 3.6 | 14% | 3.37 | |
| Region J | 1769 | 6.8 | 40% | 11.80 | 994 | 4.0 | 19% | 8.78 | 809 | 2.8 | 24% | 8.60 | 488 | 7.9 | 23% | 3.75 | 273 | 4.2 | 16% | 3.25 | 230 | 4.0 | 8% | 3.67 | |
| Region K | 1872 | 5.6 | 74% | 11.84 | 1112 | 3.5 | 41% | 8.99 | 926 | 2.7 | 38% | 8.48 | 576 | 5.7 | 73% | 3.95 | 315 | 4.0 | 29% | 3.58 | 268 | 3.2 | 27% | 3.68 | |
| Firm Power Gen | Current Cost: PV @ 1000/kW, Storage @ $200/kWh | Future Cost: PV @ 400/kW, Storage @ $50/kWh | |||||||||||||||||||||||
|---|---|---|---|---|---|---|---|---|---|---|---|---|---|---|---|---|---|---|---|---|---|---|---|---|---|
| No Flexibility | 2.5% Flexibility | 5% Flexibility | No Flexibility | 2.5% Flexibility | 5% Flexibility | ||||||||||||||||||||
| Electrical Region | Add’l $ per PVkW | Storage PV h | Over-Sizing | LCOE ¢/kWh | Add’l $ per PVkW | Storage PV h | Over-Sizing | LCOE ¢/kWh | Add’l $ per PVkW | Storage PV h | Over-Sizing | LCOE ¢/kWh | Add’l $ per PVkW | Storage PV h | Over-Sizing | LCOE ¢/kWh | Add’l $ per PVkW | Storage PV h | Over-Sizing | LCOE ¢/kWh | Add’l $ per PVkW | Storage PV h | Over-Sizing | LCOE ¢/kWh | |
| homogeneously dispersed fleets | Entire NYISO | 2778 | 5.8 | 162% | 16.98 | 1681 | 3.6 | 97% | 12.35 | 1326 | 3.1 | 71% | 10.65 | 939 | 6.0 | 160% | 5.93 | 554 | 3.9 | 90% | 4.79 | 425 | 3.5 | 62% | 4.25 |
| Region A | 3687 | 4.7 | 275% | 21.12 | 2124 | 3.6 | 141% | 14.50 | 1709 | 2.8 | 114% | 12.40 | 1332 | 4.8 | 274% | 7.72 | 730 | 4.1 | 132% | 5.63 | 578 | 3.6 | 100% | 4.95 | |
| Region B | 3686 | 6.2 | 245% | 21.35 | 2149 | 3.7 | 141% | 14.63 | 1736 | 3.0 | 114% | 12.56 | 1279 | 6.2 | 242% | 7.55 | 720 | 4.9 | 119% | 5.65 | 576 | 4.1 | 93% | 5.00 | |
| Region C | 3826 | 9.3 | 197% | 22.66 | 2130 | 4.1 | 132% | 14.75 | 1723 | 3.3 | 107% | 12.65 | 1252 | 9.3 | 197% | 7.61 | 711 | 4.5 | 121% | 5.66 | 575 | 3.9 | 95% | 5.02 | |
| Region D | 3440 | 7.2 | 199% | 20.31 | 2323 | 4.5 | 142% | 15.43 | 1897 | 3.8 | 114% | 13.28 | 1163 | 7.5 | 197% | 7.04 | 784 | 4.9 | 135% | 5.92 | 631 | 4.2 | 105% | 5.22 | |
| Region E | 3652 | 6.8 | 229% | 21.21 | 2210 | 4.4 | 133% | 15.00 | 1798 | 3.6 | 109% | 12.93 | 1244 | 7.1 | 222% | 7.39 | 743 | 4.7 | 126% | 5.78 | 599 | 3.9 | 101% | 5.14 | |
| Region F | 3423 | 9.1 | 160% | 20.04 | 1872 | 4.5 | 97% | 13.19 | 1508 | 3.8 | 74% | 11.39 | 1086 | 9.2 | 156% | 6.62 | 596 | 5.2 | 84% | 5.00 | 474 | 4.2 | 66% | 4.45 | |
| Region G | 2911 | 8.5 | 120% | 17.02 | 1684 | 5.2 | 64% | 12.02 | 1375 | 4.0 | 57% | 10.47 | 889 | 9.7 | 101% | 5.55 | 514 | 5.3 | 62% | 4.50 | 420 | 4.4 | 50% | 4.10 | |
| Region H | 3129 | 10.4 | 105% | 17.73 | 1836 | 5.7 | 69% | 12.50 | 1512 | 4.3 | 65% | 10.88 | 939 | 10.4 | 105% | 5.64 | 554 | 6.2 | 62% | 4.70 | 454 | 5.0 | 51% | 4.28 | |
| Region I | 2609 | 10.0 | 61% | 15.47 | 1640 | 5.1 | 62% | 11.40 | 1325 | 4.3 | 47% | 10.00 | 717 | 10.3 | 51% | 4.71 | 473 | 6.2 | 41% | 4.23 | 381 | 5.0 | 33% | 3.88 | |
| Region J | 2603 | 9.2 | 77% | 15.37 | 1597 | 5.2 | 57% | 11.23 | 1279 | 4.4 | 41% | 9.87 | 745 | 10.9 | 50% | 4.86 | 455 | 6.3 | 36% | 4.12 | 363 | 4.9 | 30% | 3.83 | |
| Region K | 2493 | 9.4 | 61% | 14.64 | 1545 | 5.2 | 50% | 10.90 | 1285 | 4.1 | 47% | 9.80 | 716 | 9.4 | 61% | 4.58 | 452 | 5.5 | 44% | 4.08 | 369 | 5.1 | 29% | 3.83 | |
| Individual locations | Entire NYISO | 3654 | 8.4 | 197% | 21.88 | 1947 | 4.1 | 112% | 14.00 | 1606 | 3.7 | 86% | 12.27 | 1175 | 8.8 | 184% | 7.29 | 642 | 4.5 | 105% | 5.34 | 517 | 4.2 | 76% | 4.78 |
| Region A | 3726 | 5.3 | 266% | 21.79 | 2248 | 3.6 | 153% | 15.30 | 1813 | 3.1 | 119% | 13.11 | 1320 | 6.8 | 245% | 7.89 | 771 | 4.6 | 135% | 5.94 | 612 | 3.8 | 105% | 5.19 | |
| Region B | 3491 | 6.9 | 211% | 20.84 | 2120 | 3.8 | 136% | 14.68 | 1746 | 3.3 | 109% | 12.78 | 1190 | 6.9 | 211% | 7.26 | 708 | 4.9 | 116% | 5.67 | 572 | 4.2 | 90% | 5.03 | |
| Region C | 3828 | 6.4 | 255% | 22.25 | 2186 | 4.3 | 132% | 15.07 | 1804 | 3.6 | 109% | 13.08 | 1348 | 7.3 | 245% | 7.98 | 722 | 5.1 | 116% | 5.71 | 593 | 4.3 | 95% | 5.13 | |
| Region D | 3502 | 7.6 | 198% | 21.10 | 2371 | 4.4 | 150% | 15.94 | 1970 | 3.4 | 128% | 13.81 | 1173 | 7.7 | 197% | 7.25 | 803 | 5.0 | 139% | 6.12 | 659 | 4.5 | 109% | 5.44 | |
| Region E | 5295 | 19.9 | 132% | 31.12 | 2303 | 4.7 | 136% | 15.79 | 1887 | 3.8 | 114% | 13.62 | 1521 | 19.9 | 132% | 9.32 | 762 | 5.4 | 123% | 6.02 | 609 | 4.9 | 91% | 5.33 | |
| Region F | 3555 | 9.8 | 160% | 20.22 | 1896 | 5.0 | 90% | 13.07 | 1554 | 4.3 | 70% | 11.39 | 1117 | 9.9 | 156% | 6.62 | 597 | 5.5 | 81% | 4.91 | 479 | 4.7 | 61% | 4.40 | |
| Region G | 3307 | 8.5 | 160% | 18.39 | 1752 | 5.4 | 67% | 12.17 | 1438 | 4.3 | 58% | 10.62 | 974 | 11.8 | 96% | 5.90 | 534 | 5.6 | 63% | 4.54 | 425 | 5.0 | 44% | 4.10 | |
| Region H | 3005 | 9.8 | 106% | 17.18 | 1851 | 5.5 | 74% | 12.55 | 1520 | 4.4 | 65% | 10.94 | 910 | 9.8 | 106% | 5.51 | 563 | 6.2 | 63% | 4.74 | 458 | 5.2 | 50% | 4.30 | |
| Region I | 2525 | 9.6 | 61% | 15.04 | 1630 | 5.2 | 59% | 11.34 | 1321 | 4.3 | 46% | 9.96 | 723 | 9.6 | 61% | 4.70 | 472 | 6.1 | 41% | 4.22 | 381 | 4.8 | 35% | 3.86 | |
| Region J | 2693 | 10.0 | 69% | 15.87 | 1575 | 5.4 | 50% | 11.21 | 1276 | 4.3 | 42% | 9.86 | 759 | 11.2 | 50% | 4.93 | 451 | 6.1 | 36% | 4.10 | 361 | 5.0 | 27% | 3.83 | |
| Region K | 2704 | 8.4 | 102% | 15.43 | 1607 | 5.3 | 55% | 11.22 | 1321 | 4.4 | 44% | 9.94 | 817 | 9.1 | 90% | 5.00 | 470 | 5.8 | 45% | 4.16 | 386 | 4.9 | 35% | 3.91 | |
© 2020 by the authors. Licensee MDPI, Basel, Switzerland. This article is an open access article distributed under the terms and conditions of the Creative Commons Attribution (CC BY) license (http://creativecommons.org/licenses/by/4.0/).
Share and Cite
Perez, R.; Perez, M.; Schlemmer, J.; Dise, J.; Hoff, T.E.; Swierc, A.; Keelin, P.; Pierro, M.; Cornaro, C. From Firm Solar Power Forecasts to Firm Solar Power Generation an Effective Path to Ultra-High Renewable Penetration a New York Case Study. Energies 2020, 13, 4489. https://doi.org/10.3390/en13174489
Perez R, Perez M, Schlemmer J, Dise J, Hoff TE, Swierc A, Keelin P, Pierro M, Cornaro C. From Firm Solar Power Forecasts to Firm Solar Power Generation an Effective Path to Ultra-High Renewable Penetration a New York Case Study. Energies. 2020; 13(17):4489. https://doi.org/10.3390/en13174489
Chicago/Turabian StylePerez, Richard, Marc Perez, James Schlemmer, John Dise, Thomas E. Hoff, Agata Swierc, Patrick Keelin, Marco Pierro, and Cristina Cornaro. 2020. "From Firm Solar Power Forecasts to Firm Solar Power Generation an Effective Path to Ultra-High Renewable Penetration a New York Case Study" Energies 13, no. 17: 4489. https://doi.org/10.3390/en13174489
APA StylePerez, R., Perez, M., Schlemmer, J., Dise, J., Hoff, T. E., Swierc, A., Keelin, P., Pierro, M., & Cornaro, C. (2020). From Firm Solar Power Forecasts to Firm Solar Power Generation an Effective Path to Ultra-High Renewable Penetration a New York Case Study. Energies, 13(17), 4489. https://doi.org/10.3390/en13174489