Abstract
We introduce firm solar forecasts as a strategy to operate optimally overbuilt solar power plants in conjunction with optimally sized storage systems so as to make up for any power prediction errors, and hence entirely remove load balancing uncertainty emanating from grid-connected solar fleets. A central part of this strategy is the plant overbuilding that we term implicit storage. We show that strategy, while economically justifiable on its own account, is an effective entry step to achieving least-cost ultra-high solar penetration where firm power generation will be a prerequisite. We demonstrate that in the absence of an implicit storage strategy, ultra-high solar penetration would be vastly more expensive. Using the New York Independent System Operator (NYISO) as a case study, we determine current and future costs of firm forecasts for a comprehensive set of scenarios in each ISO electrical region, comparing centralized vs. decentralized production and assessing load flexibility’s impact. We simulate the growth of the strategy from firm forecast to firm power generation. We conclude that ultra-high solar penetration enabled by the present strategy, whereby solar would firmly supply the entire NYISO load, could be achieved locally at electricity production costs comparable to current NYISO wholesale market prices.
1. Introduction
Solar Forecasts: From minutes-ahead to days ahead, solar forecasts have become integral to utility operations as solar power generation–chiefly photovoltaics (PV)–penetrates power grids. The models underlying these forecasts are becoming more refined [1,2,3,4,5,6,7]. Probabilistic forecasts in particular that complement deterministic forecasts with expected condition-specific probability ranges are increasingly applied operationally as these integrate effectively with current grid management practices [8,9,10,11,12,13,14]. The underlying reason for solar forecasts is the intermittent nature of the non-dispatchable solar resource. Accurately anticipating future solar production can minimize load imbalances, hence the size of reserve margins and spot-market electricity price spikes. Penalties that are often levied on large solar producers are intended to reflect the cost of these solar-induced load imbalances. These penalties represent an economic measure of forecast accuracy. However, this measure can vary substantially from one service area to the next and often reflects regulatory decisions that may change over time and that are not always directly traceable to tangible operational costs. A recent publication by Antonanzas et al. attests to the influence of market structures on the apparent economic accuracy of solar forecasts [15].
Introducing Firm Power forecasts: The aim of firm power forecasts is to bypass the standard [probabilistic] forecast paradigm and to remove grid operator uncertainty. Of course, the forecast models themselves are not error-free, but the production of a PV plant or a fleet of plants can be guaranteed operationally by adding physical hardware and controls to these plants, namely energy storage to make up for over-forecasts, and plant overbuilding to safely curtail the output in cases of under-forecasts. Operational controls take real-time action on storage dispatch or curtailment to reconcile actual and predicted production so that the output seen by the grid exactly amounts to the predicted output. The cost of achieving firm forecasts is the cost of the optimally minimized hardware (storage and additional PV) needed for the task.
We recently showed that this cost also constituted a new, robust and repeatable forecast model error metric [16,17] that may be more reflective of operational grid imbalance costs than prevailing error metrics such as MAE, RMSE, or forecast skill, even as efforts to refine/standardize these prevailing metrics are actively pursued [18,19,20,21]. We showed, in particular, that simple persistence models scored considerably better relative to other models when gauged with the new operational cost metric than when gauged with traditional metrics [17].
From firm forecasts to least-cost ultra-high penetration: While the firm forecast overbuild/curtail/storage strategy may be economically justifiable for eliminating PV supply-side uncertainty, its most important value, as we will show in this article, lies in opening a logistical door to massive PV penetration at the lowest possible cost. As outlined in a new IEA-PVPS Task 16 activity [22], grid-connected PV, either dispersed or centralized, has developed and grown at the margin of a core of dispatchable and baseload conventional generation. The challenge ahead is to move PV beyond this marginal position and the reliance on conventional generation. The transformation of intermittent variable solar power generation into firm, effectively dispatchable power generation is a prerequisite to the gradual displacement of the underlying conventional generation core.
In a recent series of publications and reports [23,24,25,26], we have demonstrated that the least costly way to transform PV from intermittent to effectively dispatchable was to apply a strategy analogous to that described above for firm forecasting but on a larger scale. PV plant overbuilding and proactive curtailment can sufficiently reduce storage requirements to reach economically acceptable firm renewable power generation. Applying storage alone without overbuilding and proactively spilling excess PV would be prohibitively expensive. Figure 1 from Reference [24] illustrates the relationship between overbuilding and the LCOE of firm power generation.
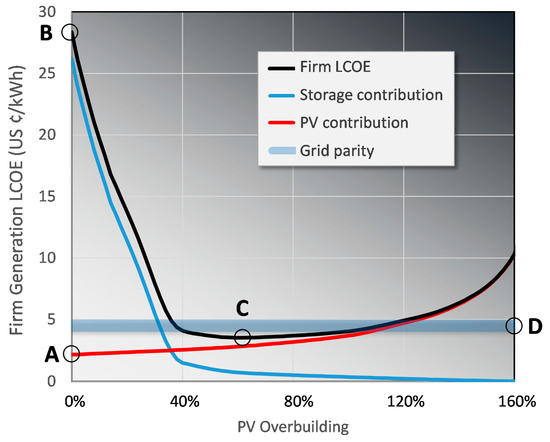
Figure 1.
The influence of PV overbuilding on firm power generation LCOE. While unconstrained PV (A) is inexpensive (apparently below grid parity), firming PV to meet demand 24/365 with storage alone (B) is unrealistically expensive. Overbuilding of PV fleets reduces storage requirements to the point (C) where firm PV power generation can achieve true grid parity (D). Source: Reference [24].
As presented by Pierro et al. [26,27] for the Italian power grid, the entry-level firm forecast strategy based on storage and optimized overbuilding/curtailment can be gradually expanded over time, following the enabling of technology cost decreases and TSO’s learning curves, to meet more stringent requirements, until meeting demand 24/365 becomes realistically achievable economical without reliance on conventional resources.
Implicit storage: We introduce the term “implicit storage” to designate the overbuilt/curtailable part of PV applied to cost-minimize both firm power forecasts and firm power generation. This overbuilt part enables operational curtailment without the loss of planned production. It acts as a catalyst to storage, allowing storage to achieve its objective, i.e., transforming intermittent PV into a firm, effectively dispatchable resource, but at a considerably reduced cost. In the following sections, we will use this implicit storage term interchangeably with overbuild/curtail.
Paper objective and innovation: Our main objective is to chart the least-cost transitional pathways to ultra-high PV penetration enabled by implicit storage logistics and using a large Transmission System Operator (TSO) as a case study. This pathway originates at (current) low penetration levels with economically justifiable firm power forecasts. It evolves to ultra-high PV penetration that we will demonstrate to be a cost-realistic objective, even in the considered TSO region that is not particularly known for its abundant solar resources. While the concepts of firm power forecasts and firm power generation have already been independently introduced by the authors [16,17,23,24], this is one of the first peer-reviewed exercises that aims to demonstrate how their common logistical strategy can optimally evolve and transform PV from a marginal to a grid-dominant resource.
Paper structure: In Section 2, we first introduce the TSO used as experimental support for the present investigation. We then describe the specifics of firm forecasts at the onset of the grid penetration pathway (Section 2.1), and the specifics of firm power generation at the ultra-high penetration conclusion of this pathway (Section 2.2). The last part of the methods section describes the transitional pathway and evolving firmness requirements as a function of PV penetration (Section 2.3). The results section follows a similar structure, first presenting results pertaining to firm forecasts (Section 3.1), then firm power generation (Section 3.2), and finally the low-to-high penetration transition between the two (Section 3.3). The final result (Section 3.4) analyzes and discusses the above results in the context of regional PV fleet deployment and management, from centralized to homogeneously dispersed PV fleets, and from regionally localized to fully dispersed strategies.
2. Methods
2.1. New York Independent System Operator (NYISO) Case Study
NYISO manages the State of New York’s transmission power grid. We use load data from this transmission system operator (TSO) as experimental support to present and contrast the costs of initially achieving firm forecasts, and of ultimately achieving firm power generation capable of entirely displacing existing conventional generation.
NYISO includes eleven electrical regions labeled A through K (Figure 2). For each electrical region, we analyze firm forecasts and firm power generation from the standpoint of either single PV plants at the region’s center or homogeneously distributed PV fleets. We also consider the case of a distributed fleet for the entire NYISO territory.

Figure 2.
NYISO electrical regions map.
The case study spans the year 2016, for which we acquired NYISO’s regional historical hourly load data.
The solar resource for the considered period across NYISO territory is illustrated in Figure 3. This is quantified in terms of the capacity factor for south-facing 30 ° fixed-tilt PV. Capacity factors range from less than 18% in the southwestern, central, and northern orographic parts of the state (zones A, C, and E) to almost 20% in the New York City metro and Long Island areas (zone H, I, J and K). Capacity factors are extracted from high-resolution SolarAnywhere data [28,29].
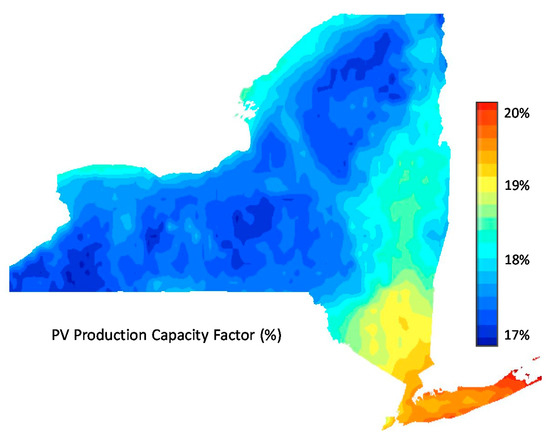
Figure 3.
New York State solar resource for 2016—annual PV production capacity factor.
2.2. Firm Power Forecasts
The underlying forecast model we apply for this investigation is the SUNY model [28] that is served operationally by Clean Power Research under the trade name SolarAnywhere [29]. This model is an optimized blend of satellite-derived cloud motion forecasts and several global and regional numerical weather prediction (NWP) models [30,31,32,33].
The actual irradiances used to benchmark forecasts consist SolarAnywhere satellite-derived historical irradiances [34]. We have shown that using satellite-derived irradiances was acceptable, if not in some cases preferable, to evaluate forecast model performance, yielding error metrics comparable to ground measurements [35]. In a recent article [36] we reported on a detailed analysis of the appropriateness of satellite data for forecast validations. We showed that, while satellite data may be a suboptimal reference for single points’ short-term dynamics, they are appropriate for the type of transmission grid-integration issues addressed in this article, especially as the footprint evolves from individual plants to regionally distributed PV fleets.
We calculate the real and implicit storage requirements, as well as the corresponding capital cost premiums, and levelized energy production costs (LCOE). In addition to the capital cost (CAPEX) of PV and storage, LCOEs are also a function of the considered life cycle—we assume 30 years—the operation and maintenance costs (OPEX) of PV and storage—we assume, respectively, 1% per year for PV and 0.1% per full cycle for storage—as well as the Weighted Average Cost of Capital (WACC). For the latter, we selected 4% as representative of the utility industry [25]) for one-, three-, and 24-h-ahead forecasts. Real and implicit storage requirements are a function of:
- The capital costs of PV and storage. We consider two scenarios: (1) a present/near-future scenario with PV at $1000/kWptc and storage at $200/kWh and, (2) a future scenario at the 20 years horizon with PV at $400/kWptc and storage at $50/kWh [37].
- The round-trip efficiency of storage. We assume 90%.
- Whether storage can be recharged at night during off-hours. We make this assumption here, whereby storage can be recharged at night at a conservatively ‘generic’ cost of $0.15/kWh.
- The amount of flexibility allowed by the TSOs to deem forecasts firm. We consider two scenarios: (1) 0% flexibility, i.e., the output seen by the grid must be equal to the forecast; (2) 2.5% flexibility, i.e., the output seen by the grid may differ from the forecast by an amount exceeding at most 25 Watts per installed kW; (3) 5% flexibility, where differences between actual and predicted generation must be below 50 Watts per installed PV kW.
The financial specifics of LCOE calculations are identical to those applied in our previous article introducing oversizing and curtailment as keys to least-cost firm power generation [23] and applied in the USDOE’s Midcontinent ISO study [25]. These financial specifics assume:
- A 30-year life cycle;
- Operation and maintenance costs of 1% of CapEx per year for PV [25];
- Operation and maintenance costs of 0.1% per full cycle for battery storage [25];
- A 4% Weighted Average Cost of Capital, representative of the US utility industry.
For a given time horizon, location, and PV fleet configuration, the cost of firm forecasts is obtained by extracting the lowest life-cycle cost combination of storage, overbuilding, and nighttime recharge expenses sufficient to meet the firm forecast requirements.
2.3. Firm Power Generation
At the other end of the spectrum, we calculate storage and implicit storage requirements to firmly supply the demand of each individual NYISO region or the state in its entirety. We apply the Clean Power Research Clean Power Transformation (CPT) model to derive the optimum combination of real and implicit storage leading to the lowest possible firm generation cost [24,25].
Operational inputs are analogous to firm power forecasts, with some key differences:
- The target output is not the forecast, but the [regional] NYISO load.
- Since the objective is to supply the demand 24/7 at high-penetration, there is no external battery recharge possibility at night or in off-hours. Storage can only be recharged when renewable production exceeds demand.
- We also consider flexibility defined not in terms of forecast guaranties, but in terms of the fraction of energy allowed from external, non-renewable sources. This external source could be supply-side, e.g., from legacy or new natural gas units, and/or demand-side from load management. We consider flexibility levels of 0%, 2.5% and 5%.
- Unlike for forecasts where the target load (i.e., the forecast production) is largely independent of PV configuration, meeting a target load shape depends on PV configuration. We selected a fixed 30° tilt south-facing array geometry.
2.4. Evolving Penetration Strategy
Between the “light-duty” requirements of firm forecasts and the “heavy-duty” requirements of 100%-ready firm power generation, we evaluate intermediate steps at 10%, 25%, and 50% levels of PV grid energy penetration. The corresponding target load profiles evolve from day-ahead forecast production to grid demand commensurately with the degree of penetration. These evolving load shape targets on a yearly and daily basis are illustrated in Figure 4.
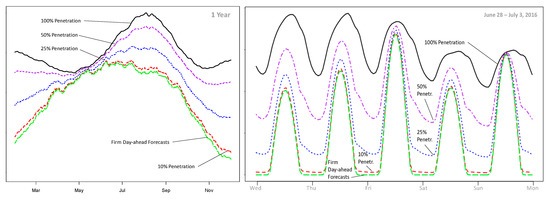
Figure 4.
The evolution of the yearly (left) and daily (right) target load shape from firm forecasts to firm power generation. Notes: (1) for visual clarity, the yearly load shape presented in this figure was smoothed using a 60-day running mean to remove day-to-day variability; (2) the y-axis scales are nominal and were selected for visual clarity to better distinguish between load shapes.
2.5. Key Performance Indicators
For all considered scenarios, optimal solutions are assessed in terms of:
- Optimum storage requirements—quantified in terms of installed PV capacity-hours.
- Optimum overbuilding—quantified as a percentage above unconstrained PV capacity needed to meet energy requirements without curtailment.
- Additional CapEx from storage and overbuild requirements—quantified in $/kW.
- “Bottom line” LCOE of optimally configured PV—quantified in cents per [firm] kWh.
3. Results
3.1. Firm Forecasts
Table 1, Table 2 and Table 3 report the nominal amount of storage, PV overbuilding, incremental capital costs, and plant/fleet LCOEs to achieve firm forecasts for all investigated scenarios: NYISO-wide, region-specific, 0% and 2.5% flexibility, current and future technology costs, centralized PV plants, and distributed fleets. Table 1 pertains to one hour-ahead forecast, Table 2 to three-hours-ahead forecasts, and Table 3 to 24-h-ahead forecasts.

Table 1.
One-hour-ahead forecasts.
Table 2.
Three-hours-ahead forecasts.
Table 3.
Twenty-four-hours-ahead forecasts.
Optimum storage requirements range from several minutes for one-hour-ahead to 1–2 h for firm 24-h-ahead forecasts. Optimum overbuilding is less than 10% for most fleet configurations. As will be discussed in Section 3.4, homogenous fleets require less storage and overbuild than centralized configuration. Likewise, TSO-wide strategies are slightly more economical than strategies confined to individual electrical regions.
In the most favorable future scenario, with 5% flexibility, firm 24-h forecasts could be achieved at CapEx premium of ~$70/kW.
The results presented in Table 1, Table 2 and Table 3 are, of course, dependent on the accuracy of the underlying forecast model. Figure 5 provides a measure of how these results would be affected if, instead of the state-of-the-art SUNY (SolarAnywhere) forecast model, we had applied less performant models, namely smart persistence [38], GFS [31], and ECMWF [30]—note that the last two models are internal components of the SUNY model. The quantity plotted in Figure 5 is the mean firm forecast cost premium per nominal PV kW across all scenarios analyzed. Full detailed results for these other forecast models are provided in Appendix A.
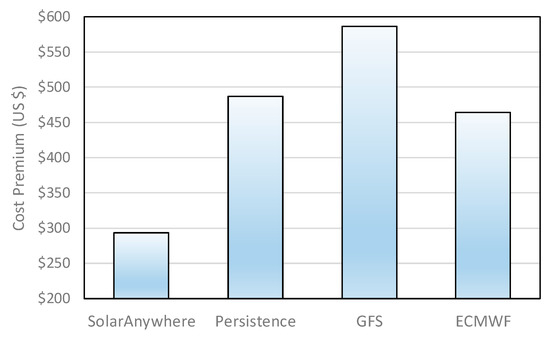
Figure 5.
Comparing firm forecast cost premium per nominal KW as a function of the forecast model. Displayed costs represent a mean for all scenarios and time horizons analyzed.
3.2. Firm Power Generation
Table 4 is analogous to Table 1, Table 2 and Table 3, but with a firm load target equal to NYISO load shapes instead of forecast PV production. Table 5 reports the same results but achieved without implicit storage—i.e., no overbuilding and no PV output curtailment. These two tables correspond respectively to point C and point B in Figure 1.
Table 4.
Firm power generation with implicit storage.
Table 5.
Firm power generation w/o implicit storage.
Supplying firm power 24/365 optimally requires from 3.5 to 10 h of storage and from 50% to 250% overbuilding depending on flexibility. The impact of fleet configuration (centralized vs. homogeneous dispersion) and regional vs. TSO strategies is considerably less marked than for forecasts (see discussion in Section 3.4).
In the most favorable future case, $400/kW PV, $50/kWh storage & 5% energy flexibility, the firm 24/365 PV generation LCOE for all NYISO regions would range from 4.2 to 6.3 ¢/kWh. These power generation numbers are comparable to current wholesale NYISO Location-Based Market Prices (LBMPs) [39]. Furthermore, as was shown in our investigation of the MISO power grid [24,25], these pure PV numbers could probably be reduced by 25% to 30% when optimally blending wind generation. While the analysis of this renewables blending is out of the scope of the current paper, it will nevertheless constitute a pertinent follow-up, given New York’s unique offshore wind resource potential [40].
A significant observation, when comparing Table 4 and Table 5, is the nearly tenfold difference between scenarios applying implicit storage and scenarios avoiding curtailment. Required storage quantities and bottom-line electricity production costs would be one order of magnitude larger without provisioning PV overbuilding and operational curtailment. Of course, this difference depends on the assumed relative costs of PV and storage. Here we have assumed $400/kW for PV and $50/kWh for storage for the future scenario. The PV estimate is likely a robust estimate since PV technology will increasingly represent a smaller part of a PV plant’s cost compared to structural outlays. Our storage estimate, however, while optimistically sourced from NREL predictions [37], could be considered too conservative by some, considering recent future flow battery ultra-low-cost claims [41]. Figure 6 illustrates the impact of storage cost on implicit storage levels and LCOE bottom lines. This shows that the tenfold difference observed under current assumptions would be moderately reduced if ultra-low-cost storage targets were to materialize, but that implicit storage would remain a crucial element to achieving the lowest possible firm production costs.
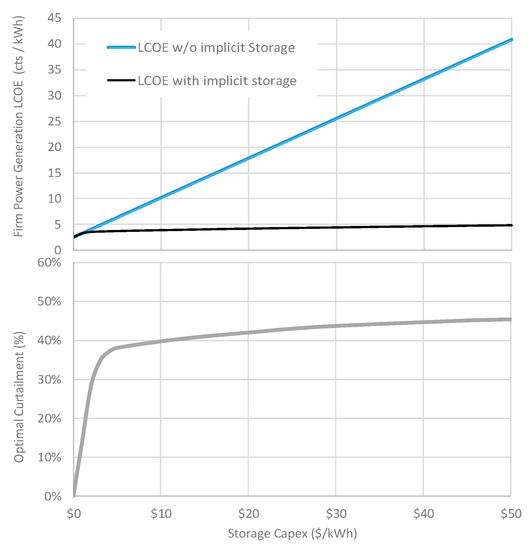
Figure 6.
Comparing LCOE with and without implicit storage (top), and the optimum level of proactive curtailment (bottom) as a function of future storage costs. Note: this illustrative example if for the future NYISO-wide scenario @ 5% flexibility.
3.3. Evolving Penetration
Table 6, Table 7 and Table 8 report results for firm power generation logistics at 10%, 25%, and 50% penetration. Target load shapes (see Figure 4) for these evolving penetration levels are defined as a blend between day-ahead forecasts and NYISO load shapes proportional to the degree of penetration.
Table 6.
Firm generation at 10% penetration.
Table 7.
Firm generation at 25% penetration.
Table 8.
Firm generation at 50% penetration.
These tables illustrate the gradual transition from a firm forecast strategy applicable and economically justifiable at [current] low PV penetration, to firmer and firmer implicit storage-enabled strategies leading to economically acceptable ultra-high PV penetration.
Figure 7 illustrates the impact of flexibility and grid penetration—hence of load shape requirements—on storage and overbuilding in the case of NYISO-wide distributed PV generation.
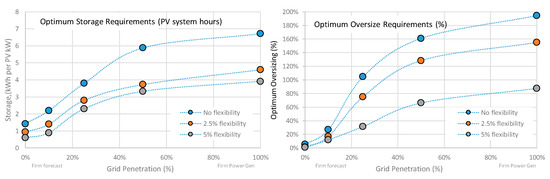
Figure 7.
Physical storage (left) and implicit storage (right) optimum requirements as a function of penetration and flexibility. These illustrative plots are for the entire NYISO and represent a mean of current and future cost scenarios. Note the mentions of “firm forecast” at low penetration and “firm power generation” at high penetration indicating the morphing of load shape requirements from [current] low penetration where PV operates at the margin to grid-dominant PV where firm power generation will be a requirement.
As we had observed for the MISO and Italy studies [25,27], a small amount of demand flexibility from, e.g., limited natural gas generation, goes a long way in reducing both true and implicit storage requirements. Most importantly for the present investigation, the trends show that the firm forecast real and implicit storage requirements represent only a small fraction of the firm power generation’s requirements. This signifies (1) that in a future high PV penetration context, there will be ample storage and implicit storage available on power grids to address any production forecast uncertainty; and (2) that firm forecasts constitute a smart logistical entry step to building a future firm PV generation resource.
Figure 8 translates Figure 7′s hardware requirements into operational electricity production LCOEs. The solid horizontal line represents the electricity production LCOE that would be unconstrained by any firmness requirements, i.e., the cost basis of present-day power purchase agreements (PPAs). Importantly, the small incremental cost to insure firm day-ahead forecasts—although this may be economically justifiable on the basis of current load balancing economics—makes it a sensible and effective entry step to a least-cost firm PV power generation strategy. The value of such a strategy becomes fully apparent in Figure 9, where we compare firm production LCOEs with and without implicit storage. While the difference remains small when looking at firm forecasts (at low PV penetration), this grows exponentially, up to tenfold, when very high penetration will demand firm power generation. This observation implies that the sooner implicit storage strategies are put in place, the easier it will be to evolve towards a lowest-cost final objective.
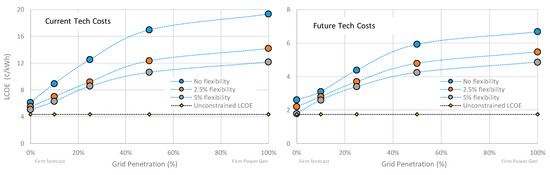
Figure 8.
The evolution of firm PV generation LCOE from low penetration firm forecast requirements to high penetration firm power generation requirements, compared to unconstrained PV generation LCOE, at current (left) and future (right) technology costs. Note: these illustrative plots are for the entire NYISO.
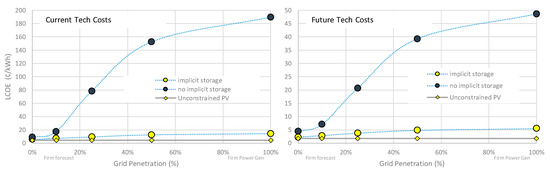
Figure 9.
Comparing firm power generation LCOE with and without an implicit storage strategy. Note: this illustrative example is for NYISO-wide at 2.5% flexibility.
3.4. Regional and Fleet Configuration Trends
The breadth of scenarios analyzed reveals interesting trends that will inform resource regional deployment and PV fleet configuration choices.
Influence of electrical region size: We define the firm LCOE premium as the difference between firm LCOE and unconstrained LCOE for a given scenario. In Figure 10, we plot this firm LCOE premium for homogenously distributed PV fleets as a function of the regional surface area. When the firmness requirement is for firm forecasts (i.e., low penetration in the context of this study), the trends indicate a decrease of the premium as a function of regional size (i.e., generating footprint size). The trend is most pronounced for the shortest-term forecasts. This finding is consistent with prior studies, including studies from the authors [35] showing that forecast accuracy improves as a function of the generating footprint. In other words, short-term weather-averaging is effective and results in smaller operational costs to firm-up large regional forecasts compared to small region forecasts.
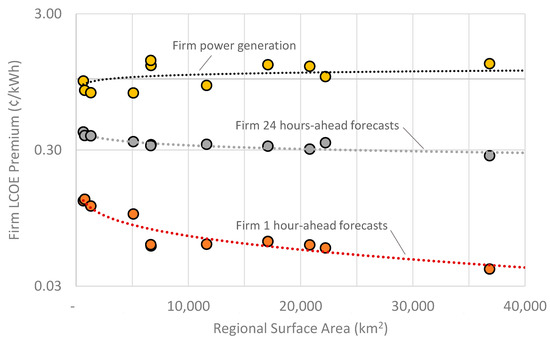
Figure 10.
Firm LCOE premium as a function of electrical region size and firm load target.
Importantly, this region-size trend disappears when the objective is firm power generation. This is because short-term weather averaging is less important than other factors in providing load shape firmness, namely seasonal resource trends and overall resource capacity factor.
Influence of the solar resource: Figure 11 is analogous to Figure 10, but replaces the X-axis by the solar resource’s capacity factor.
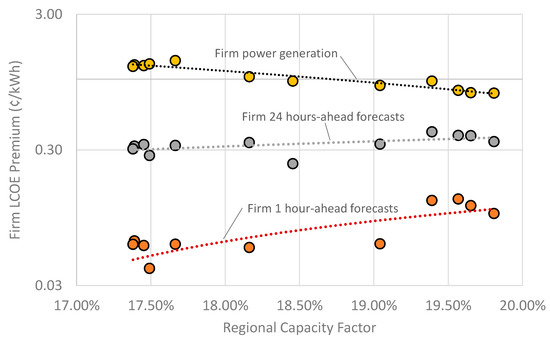
Figure 11.
Firm LCOE premium as a function of regional capacity factor and firm load target.
The most important observation in Figure 11 is that the high-penetration’s firm power generation costs, while not influenced by the generating footprint as noted above in Figure 10, are influenced by the solar resource. As would be expected, the higher the solar resource (quantified here by the PV capacity factor), the less costly the task of transforming unconstrained power generation into firm power generation. Delivering firm forecasts, on the other hand, is less influenced by the solar resource—note that the positive forecast trends apparent in Figure 11 are a reflection of region size. Indeed, the smaller regions (see Figure 2) are located in the southern part of the state and benefit from a higher capacity factors (see Figure 3).
NYISO-Wide vs. single electric region strategy: We defined the regional penalty as the ratio between the mean regional firm generation LCOE and the firm LCOE for the entire NYISO, minus one. In Figure 12, we plotted this regional penalty across all scenarios considering homogenously dispersed PV fleets.
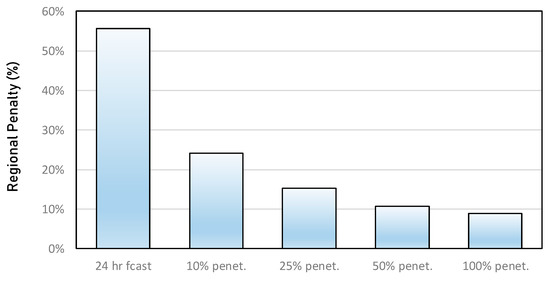
Figure 12.
Regional penalty as a function of penetration and firmness requirements from 24-h-ahead forecasts with firm power generation.
Consistently with the geographical trends observed in Figure 10, a statewide forecast balancing strategy would be considerably more cost-effective than region-specific strategies. However, this statewide advantage is reduced significantly when firmness requirements evolve from forecast production to demand load shape. Weather-averaging (and hence geographic dispersion) is important to reduce weather-induced forecast errors. At high penetration, however, the driving factor for cost is multi-day/seasonal variability [24] where weather (and hence the importance of weather averaging) has a comparatively lesser impact. This result is very important because it suggests that firm power generation could, if needed, be achieved within each electrical region at only a small premium compared to a NYISO-wide strategy that would have to rely on a strong transmission backbone.
Centralized power plants vs. distributed fleets’ strategy: Figure 13 is analogous to Figure 12, but compares the penalty of the centralized vs. homogeneously dispersed generation premium within each region. The trend is reminiscent of the above NYISO vs. region trend because the driving factors are essentially the same: weather-averaging is important to minimize forecast errors, and hence the cost of producing firm forecasts, but other factors, chiefly seasonal trends, become dominant as penetration increases. This result is logistically important because it suggests that a few strategically located large plants and/or clusters of urban/suburban-sited systems within each region could supply the bulk of firm power requirements, without having to ensure a perfectly homogeneous supply.
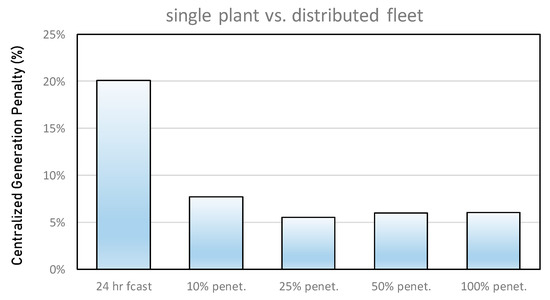
Figure 13.
The centralized generation LCOE premium as a function of firmness requirements from 24-h forecasts with firm power generation.
4. Conclusions
We presented a firm solar forecast strategy articulated around optimized physical and implicit storage (aka overbuilding solar resource) as an operational alternative to the standard practice of exploiting probabilistic forecast models to integrate solar resources into power grids. We showed that this strategy could entirely remove load-balancing uncertainty emanating from variable renewable resources such as solar at a modest operational cost premium. Most importantly, we showed that the firm forecast strategy was an effective entry step to achieving least-cost ultra-high solar penetration, where production firmness will be a prerequisite because achieving firmness in the absence of an implicit storage-enabled strategy could be unrealistically expensive.
Using the New York Independent System Operator as a case study, we showed that this ultra-high solar penetration future where solar would firmly supply the entire load shape could be achieved at electricity production costs commensurate current New York’s current wholesale market electricity prices. We also pointed out that applying an implicit storage strategy to an optimal mix of solar with wind would likely result in production cost targets below New York’s current wholesale prices.
Interestingly, we showed that while geographic dispersion had a significant impact on the cost of firm forecasts, its impact diminished considerably when the objective evolved from firm forecasts to firm power generation. This is because weather-driven short-term fluctuations driving forecast models’ uncertainty (and hence the cost of transforming these forecasts into firm forecasts) can be reduced with geographic dispersion by exploiting the well-documented smoothing effect [42]. These short-term fluctuations play less of a role compared to other factors such as seasonal variability when the objective evolves to meeting a given load shape. We noted that this observation had important implications. In particular, it suggests that large-scale geographic dispersion, implying strong transmission capabilities, would not be an absolute prerequisite to ultra-high penetration economics whereby locally resilient solutions contained in electrical sub-regions could be considered at a modest cost premium.
Author Contributions
Conceptualization, R.P. and M.P. (Marc Perez); Investigation, M.P. (Marc Perez), T.E.H. and M.P. (Marco Pierro); Methodology, R.P. and M.P. (Marc Perez); Software, J.S.; isualization, R.P. and M.P. (Marc Perez); Writing—review & editing, J.D., T.E.H., A.S., P.K., M.P. (Marco Pierro) and C.C. All authors have read and agreed to the published version of the manuscript.
Funding
This research was funded by Clean Power Research.
Conflicts of Interest
The authors declare no conflict of interest.
Appendix A
Table A1.
One-hour-ahead firm forecast results applying smart persistence.
Table A1.
One-hour-ahead firm forecast results applying smart persistence.
| 1 h Forecasts | Current Technology Cost: PV @ $1000/kW, Storage @ $200/kWh | Future Technology Cost: PV @ $400/kW, Storage @ $50/kWh | |||||||||||||||||||||||
|---|---|---|---|---|---|---|---|---|---|---|---|---|---|---|---|---|---|---|---|---|---|---|---|---|---|
| No Flexibility | 2.5% Flexibility | 5% Flexibility | No Flexibility | 2.5% Flexibility | 5% Flexibility | ||||||||||||||||||||
| Electrical Region | Add’l $ per PVkW | Storage PV h | Over-Sizing | LCOE ¢/kWh | Add’l $ per PVkW | Storage PV h | Over-Sizing | LCOE ¢/kWh | Add’l $ per PVkW | Storage PV h | Over-Sizing | LCOE ¢/kWh | Add’l $ per PVkW | Storage PV h | Over-Sizing | LCOE ¢/kWh | Add’l $ per PVkW | Storage PV h | Over-Sizing | LCOE ¢/kWh | Add’l $ per PVkW | Storage PV h | Over-Sizing | LCOE ¢/kWh | |
| homogeneously dispersed fleets | Entire NYISO | 201 | 0.61 | 4% | 5.22 | 140 | 0.41 | 4% | 4.96 | 92 | 0.38 | 0% | 4.75 | 75 | 0.92 | 1% | 2.07 | 53 | 0.47 | 3% | 1.97 | 35 | 0.31 | 2% | 1.89 |
| Region A | 226 | 0.73 | 4% | 5.33 | 188 | 0.60 | 4% | 5.17 | 134 | 0.56 | −2% | 4.93 | 94 | 0.73 | 4% | 2.15 | 71 | 0.64 | 4% | 2.05 | 60 | 0.64 | 3% | 2.00 | |
| Region B | 236 | 0.84 | 3% | 5.37 | 194 | 0.71 | 3% | 5.20 | 161 | 0.67 | −2% | 5.05 | 91 | 0.84 | 3% | 2.14 | 70 | 0.71 | 3% | 2.05 | 60 | 0.78 | 1% | 2.00 | |
| Region C | 259 | 0.75 | 6% | 5.48 | 194 | 0.61 | 5% | 5.20 | 154 | 0.59 | 0% | 5.02 | 93 | 1.09 | 2% | 2.14 | 70 | 0.83 | 2% | 2.04 | 56 | 0.64 | 2% | 1.98 | |
| Region D | 228 | 0.60 | 6% | 5.34 | 156 | 0.47 | 4% | 5.03 | 119 | 0.42 | 2% | 4.87 | 87 | 1.16 | 1% | 2.12 | 60 | 0.53 | 3% | 2.00 | 44 | 0.42 | 2% | 1.93 | |
| Region E | 224 | 0.65 | 5% | 5.32 | 165 | 0.42 | 6% | 5.07 | 117 | 0.38 | 2% | 4.86 | 81 | 1.03 | 1% | 2.09 | 62 | 0.68 | 2% | 2.01 | 47 | 0.38 | 2% | 1.94 | |
| Region F | 228 | 0.36 | 10% | 5.34 | 169 | 0.39 | 5% | 5.09 | 110 | 0.34 | 1% | 4.83 | 100 | 1.20 | 2% | 2.18 | 71 | 0.53 | 5% | 2.05 | 51 | 0.29 | 3% | 1.96 | |
| Region G | 208 | 0.42 | 7% | 5.26 | 155 | 0.39 | 5% | 5.03 | 113 | 0.36 | 0% | 4.84 | 86 | 0.71 | 3% | 2.11 | 67 | 0.39 | 5% | 2.03 | 56 | 0.56 | 2% | 1.98 | |
| Region H | 300 | 0.77 | 3% | 5.65 | 249 | 0.66 | 3% | 5.43 | 197 | 0.61 | 0% | 5.21 | 106 | 1.29 | 2% | 2.20 | 97 | 1.00 | 4% | 2.16 | 87 | 0.71 | 6% | 2.12 | |
| Region I | 261 | 0.87 | 4% | 5.49 | 225 | 0.76 | 3% | 5.33 | 200 | 0.72 | 2% | 5.22 | 107 | 0.87 | 4% | 2.20 | 91 | 0.71 | 5% | 2.13 | 80 | 0.74 | 4% | 2.09 | |
| Region J | 225 | 0.69 | 4% | 5.33 | 189 | 0.58 | 3% | 5.17 | 156 | 0.50 | 3% | 5.03 | 96 | 0.69 | 4% | 2.16 | 80 | 0.53 | 5% | 2.09 | 61 | 0.59 | 2% | 2.01 | |
| Region K | 229 | 0.66 | 5% | 5.35 | 194 | 0.46 | 4% | 5.19 | 148 | 0.44 | 0% | 4.99 | 97 | 0.77 | 4% | 2.16 | 84 | 0.72 | 5% | 2.11 | 66 | 0.77 | 2% | 2.03 | |
| Individual locations | Region A | 291 | 0.88 | 6% | 5.62 | 251 | 0.77 | 6% | 5.44 | 224 | 0.70 | 2% | 5.32 | 124 | 0.88 | 6% | 2.28 | 100 | 0.88 | 5% | 2.17 | 89 | 0.78 | 5% | 2.13 |
| Region B | 280 | 0.89 | 5% | 5.57 | 245 | 0.73 | 5% | 5.41 | 216 | 0.63 | 5% | 5.29 | 113 | 0.98 | 4% | 2.23 | 104 | 0.69 | 7% | 2.19 | 91 | 0.88 | 2% | 2.14 | |
| Region C | 279 | 0.76 | 7% | 5.56 | 252 | 0.72 | 7% | 5.45 | 235 | 0.62 | 8% | 5.37 | 117 | 0.97 | 5% | 2.25 | 98 | 1.16 | 3% | 2.17 | 87 | 0.89 | 4% | 2.12 | |
| Region D | 265 | 0.92 | 4% | 5.50 | 234 | 0.88 | 3% | 5.37 | 201 | 0.72 | 3% | 5.22 | 101 | 1.03 | 3% | 2.18 | 84 | 0.88 | 3% | 2.11 | 74 | 0.72 | 3% | 2.06 | |
| Region E | 305 | 0.75 | 9% | 5.68 | 276 | 0.83 | 7% | 5.55 | 246 | 0.84 | 0% | 5.42 | 114 | 1.39 | 2% | 2.24 | 104 | 1.05 | 4% | 2.19 | 97 | 0.75 | 7% | 2.16 | |
| Region F | 277 | 0.82 | 6% | 5.55 | 259 | 0.56 | 5% | 5.48 | 227 | 0.58 | 2% | 5.34 | 115 | 0.90 | 5% | 2.24 | 102 | 0.93 | 5% | 2.18 | 96 | 0.82 | 6% | 2.16 | |
| Region G | 291 | 0.95 | 5% | 5.62 | 272 | 0.68 | 4% | 5.53 | 226 | 0.64 | 0% | 5.33 | 116 | 1.26 | 3% | 2.24 | 104 | 1.09 | 4% | 2.19 | 104 | 0.86 | 7% | 2.19 | |
| Region H | 326 | 0.92 | 8% | 5.77 | 280 | 0.76 | 3% | 5.57 | 230 | 0.70 | 0% | 5.35 | 116 | 1.45 | 2% | 2.25 | 105 | 1.27 | 3% | 2.20 | 97 | 1.19 | 3% | 2.16 | |
| Region I | 291 | 1.02 | 4% | 5.62 | 254 | 0.78 | 6% | 5.45 | 230 | 0.70 | 5% | 5.35 | 114 | 1.22 | 3% | 2.24 | 100 | 0.87 | 5% | 2.18 | 89 | 0.87 | 4% | 2.13 | |
| Region J | 270 | 0.99 | 2% | 5.52 | 234 | 0.74 | 5% | 5.37 | 203 | 0.72 | 2% | 5.23 | 104 | 1.01 | 3% | 2.19 | 92 | 0.84 | 4% | 2.14 | 74 | 0.83 | 2% | 2.06 | |
| Region K | 289 | 0.70 | 9% | 5.61 | 248 | 0.83 | 5% | 5.43 | 229 | 0.67 | 4% | 5.34 | 108 | 1.19 | 3% | 2.21 | 94 | 0.83 | 5% | 2.15 | 87 | 0.82 | 5% | 2.12 | |
Table A2.
One-hour-ahead firm forecast results applying GFS.
Table A2.
One-hour-ahead firm forecast results applying GFS.
| 1 h Forecasts | Current Technology Cost: PV @ $1000/kW, Storage @ $200/kWh | Future Technology Cost: PV @ $400/kW, Storage @ $50/kWh | |||||||||||||||||||||||
|---|---|---|---|---|---|---|---|---|---|---|---|---|---|---|---|---|---|---|---|---|---|---|---|---|---|
| No Flexibility | 2.5% flexibIlity | 5% Flexibility | No Flexibility | 2.5% Flexibility | 5% Flexibility | ||||||||||||||||||||
| Electrical Region | Add’l $ per PVkW | Storage PV h | Over-Sizing | LCOE ¢/kWh | Add’l $ per PVkW | Storage PV h | Over-Sizing | LCOE ¢/kWh | Add’l $ per PVkW | Storage PV h | Over-Sizing | LCOE ¢/kWh | Add’l $ per PVkW | Storage PV h | Over-Sizing | LCOE ¢/kWh | Add’l $ per PVkW | Storage PV h | Over-Sizing | LCOE ¢/kWh | Add’l $ per PVkW | Storage PV h | Over-Sizing | LCOE ¢/kWh | |
| homogeneously dispersed fleets | Entire NYISO | 585 | 0.88 | 27% | 6.89 | 472 | 0.74 | 23% | 6.40 | 383 | 0.58 | 21% | 6.02 | 278 | 2.01 | 26% | 2.95 | 210 | 1.39 | 23% | 2.65 | 164 | 0.63 | 25% | 2.45 |
| Region A | 733 | 1.62 | 15% | 7.54 | 616 | 1.58 | 8% | 7.03 | 512 | 1.51 | 3% | 6.58 | 368 | 1.53 | 29% | 3.34 | 292 | 3.93 | 12% | 3.01 | 220 | 2.45 | 14% | 2.70 | |
| Region B | 737 | 1.54 | 16% | 7.55 | 616 | 1.55 | 6% | 7.03 | 511 | 1.50 | 1% | 6.57 | 383 | 1.38 | 29% | 3.41 | 308 | 2.12 | 29% | 3.08 | 246 | 2.22 | 20% | 2.81 | |
| Region C | 690 | 1.14 | 25% | 7.35 | 577 | 1.11 | 19% | 6.86 | 480 | 1.05 | 15% | 6.44 | 343 | 1.79 | 28% | 3.23 | 270 | 1.53 | 26% | 2.92 | 220 | 1.13 | 28% | 2.70 | |
| Region D | 1164 | 3.19 | 28% | 9.41 | 1016 | 3.01 | 21% | 8.77 | 883 | 2.87 | 13% | 8.19 | 472 | 6.27 | 23% | 3.79 | 417 | 5.60 | 22% | 3.55 | 356 | 2.48 | 28% | 3.29 | |
| Region E | 757 | 1.37 | 29% | 7.64 | 620 | 1.01 | 29% | 7.05 | 517 | 0.87 | 25% | 6.60 | 338 | 2.73 | 26% | 3.21 | 277 | 1.77 | 29% | 2.94 | 229 | 1.89 | 21% | 2.74 | |
| Region F | 808 | 1.62 | 29% | 7.86 | 692 | 1.62 | 17% | 7.36 | 584 | 1.54 | 11% | 6.89 | 388 | 4.04 | 29% | 3.43 | 317 | 1.43 | 29% | 3.12 | 265 | 1.28 | 29% | 2.89 | |
| Region G | 794 | 1.94 | 24% | 7.80 | 683 | 1.92 | 18% | 7.32 | 604 | 1.75 | 17% | 6.98 | 321 | 2.56 | 29% | 3.13 | 270 | 1.95 | 29% | 2.92 | 233 | 1.60 | 25% | 2.75 | |
| Region H | 681 | 2.16 | 17% | 7.31 | 612 | 1.85 | 17% | 7.01 | 558 | 1.57 | 19% | 6.78 | 252 | 2.20 | 18% | 2.84 | 228 | 1.76 | 21% | 2.73 | 207 | 1.48 | 22% | 2.64 | |
| Region I | 663 | 2.03 | 15% | 7.23 | 572 | 1.70 | 16% | 6.84 | 510 | 1.34 | 19% | 6.57 | 246 | 2.36 | 15% | 2.81 | 217 | 1.78 | 18% | 2.68 | 194 | 1.67 | 15% | 2.59 | |
| Region J | 720 | 1.61 | 19% | 7.48 | 631 | 1.47 | 17% | 7.09 | 551 | 1.43 | 12% | 6.75 | 242 | 3.19 | 10% | 2.79 | 214 | 2.74 | 11% | 2.67 | 207 | 2.41 | 14% | 2.64 | |
| Region K | 672 | 2.03 | 21% | 7.27 | 590 | 1.82 | 19% | 6.92 | 518 | 1.66 | 16% | 6.60 | 240 | 2.35 | 18% | 2.78 | 201 | 2.39 | 13% | 2.61 | 173 | 1.66 | 16% | 2.49 | |
| Individual locations | Region A | 1056 | 2.71 | 29% | 8.94 | 977 | 2.52 | 29% | 8.60 | 903 | 2.32 | 29% | 8.28 | 421 | 4.93 | 23% | 3.57 | 361 | 3.41 | 29% | 3.31 | 342 | 3.34 | 29% | 3.23 |
| Region B | 935 | 2.43 | 16% | 8.42 | 827 | 2.23 | 16% | 7.95 | 738 | 2.04 | 16% | 7.56 | 453 | 3.83 | 27% | 3.71 | 376 | 3.41 | 24% | 3.38 | 327 | 3.34 | 23% | 3.16 | |
| Region C | 972 | 2.41 | 18% | 8.58 | 838 | 2.34 | 7% | 8.00 | 712 | 2.24 | 0% | 7.45 | 426 | 3.69 | 29% | 3.59 | 350 | 3.72 | 20% | 3.26 | 305 | 3.18 | 20% | 3.07 | |
| Region D | 1425 | 3.82 | 29% | 10.55 | 1276 | 3.48 | 29% | 9.90 | 1145 | 3.29 | 24% | 9.33 | 594 | 8.43 | 29% | 4.32 | 543 | 7.86 | 29% | 4.10 | 486 | 7.03 | 27% | 3.85 | |
| Region E | 829 | 1.83 | 27% | 7.95 | 737 | 1.59 | 29% | 7.56 | 671 | 1.40 | 29% | 7.27 | 389 | 1.87 | 28% | 3.43 | 323 | 1.75 | 28% | 3.14 | 280 | 1.54 | 29% | 2.96 | |
| Region F | 1027 | 2.47 | 28% | 8.82 | 930 | 2.25 | 29% | 8.40 | 846 | 2.26 | 20% | 8.03 | 378 | 4.03 | 29% | 3.38 | 326 | 3.26 | 29% | 3.16 | 300 | 2.84 | 27% | 3.05 | |
| Region G | 983 | 3.14 | 10% | 8.63 | 887 | 2.96 | 15% | 8.21 | 827 | 2.75 | 19% | 7.95 | 381 | 3.85 | 26% | 3.40 | 330 | 3.12 | 27% | 3.18 | 290 | 2.76 | 25% | 3.00 | |
| Region H | 805 | 2.49 | 14% | 7.85 | 705 | 2.20 | 20% | 7.41 | 658 | 2.02 | 20% | 7.21 | 285 | 2.78 | 19% | 2.98 | 250 | 2.20 | 21% | 2.83 | 232 | 1.98 | 22% | 2.75 | |
| Region I | 705 | 2.15 | 15% | 7.42 | 635 | 1.87 | 16% | 7.11 | 580 | 1.59 | 18% | 6.87 | 268 | 2.90 | 15% | 2.91 | 242 | 2.47 | 17% | 2.79 | 223 | 2.08 | 19% | 2.71 | |
| Region J | 819 | 3.18 | 13% | 7.91 | 739 | 2.12 | 10% | 7.56 | 660 | 2.10 | 1% | 7.22 | 264 | 3.18 | 13% | 2.89 | 250 | 2.94 | 15% | 2.83 | 238 | 2.68 | 17% | 2.78 | |
| Region K | 1129 | 3.37 | 22% | 9.26 | 1024 | 3.14 | 19% | 8.80 | 925 | 3.03 | 11% | 8.37 | 476 | 3.20 | 29% | 3.81 | 425 | 2.89 | 29% | 3.59 | 381 | 2.59 | 29% | 3.40 | |
Table A3.
One-hour-ahead firm forecast results applying ECMF.
Table A3.
One-hour-ahead firm forecast results applying ECMF.
| 1 Hour Forecasts | Current Technology Cost: PV @ $1000/kW, Storage @ $200/kWh | Future Technology Cost: PV @ $400/kW, Storage @ $50/kWh | |||||||||||||||||||||||
|---|---|---|---|---|---|---|---|---|---|---|---|---|---|---|---|---|---|---|---|---|---|---|---|---|---|
| No Flexibility | 2.5% Flexibility | 5% Flexibility | No Flexibility | 2.5% Flexibility | 5% Flexibility | ||||||||||||||||||||
| Electrical Region | Add’l $ per PVkW | Storage PV h | Over-Sizing | LCOE ¢/kWh | Add’l $ per PVkW | Storage PV h | Over-Sizing | LCOE ¢/kWh | Add’l $ per PVkW | Storage PV h | Over-Sizing | LCOE ¢/kWh | Add’l $ per PVkW | Storage PV h | Over-Sizing | LCOE ¢/kWh | Add’l $ per PVkW | Storage PV h | Over-Sizing | LCOE ¢/kWh | Add’l $ per PVkW | Storage PV h | Over-Sizing | LCOE ¢/kWh | |
| homogeneously dispersed fleets | Entire NYISO | 522 | 1.22 | 7% | 6.62 | 382 | 1.12 | 1% | 6.01 | 274 | 1.00 | 0% | 5.54 | 275 | 1.00 | 21% | 2.93 | 193 | 0.95 | 12% | 2.58 | 132 | 0.93 | 3% | 2.31 |
| Region A | 640 | 1.61 | 4% | 7.13 | 492 | 1.44 | 0% | 6.49 | 368 | 1.22 | 0% | 5.95 | 339 | 1.38 | 24% | 3.22 | 257 | 1.25 | 15% | 2.86 | 189 | 1.13 | 6% | 2.56 | |
| Region B | 629 | 1.60 | 5% | 7.09 | 485 | 1.44 | 0% | 6.46 | 363 | 1.22 | 0% | 5.93 | 337 | 1.45 | 19% | 3.21 | 252 | 1.29 | 13% | 2.84 | 186 | 1.15 | 5% | 2.55 | |
| Region C | 612 | 1.44 | 6% | 7.01 | 472 | 1.34 | 0% | 6.40 | 356 | 1.17 | 0% | 5.90 | 330 | 1.16 | 27% | 3.18 | 250 | 1.12 | 15% | 2.83 | 185 | 1.06 | 6% | 2.55 | |
| Region D | 749 | 1.59 | 25% | 7.61 | 604 | 1.65 | 12% | 6.98 | 479 | 1.69 | 0% | 6.43 | 349 | 2.77 | 27% | 3.26 | 278 | 2.24 | 25% | 2.95 | 212 | 1.34 | 13% | 2.66 | |
| Region E | 609 | 1.45 | 6% | 7.00 | 464 | 1.36 | 0% | 6.37 | 350 | 1.21 | 0% | 5.87 | 325 | 1.24 | 21% | 3.16 | 239 | 1.15 | 14% | 2.78 | 173 | 1.11 | 5% | 2.49 | |
| Region F | 587 | 1.11 | 16% | 6.91 | 454 | 0.96 | 12% | 6.33 | 344 | 0.86 | 7% | 5.84 | 321 | 1.04 | 23% | 3.14 | 237 | 0.92 | 14% | 2.77 | 173 | 0.76 | 10% | 2.49 | |
| Region G | 624 | 1.61 | 12% | 7.06 | 502 | 1.44 | 7% | 6.53 | 393 | 1.37 | 0% | 6.06 | 304 | 1.46 | 21% | 3.06 | 237 | 1.31 | 15% | 2.77 | 185 | 1.27 | 4% | 2.54 | |
| Region H | 697 | 2.41 | 2% | 7.38 | 593 | 2.21 | 0% | 6.93 | 508 | 2.01 | 0% | 6.56 | 302 | 2.40 | 12% | 3.06 | 249 | 2.15 | 9% | 2.82 | 210 | 1.89 | 7% | 2.65 | |
| Region I | 693 | 2.20 | 10% | 7.37 | 594 | 2.17 | 0% | 6.93 | 506 | 1.94 | 0% | 6.55 | 298 | 2.30 | 13% | 3.04 | 245 | 1.92 | 15% | 2.81 | 214 | 1.69 | 16% | 2.67 | |
| Region J | 585 | 1.79 | 4% | 6.89 | 465 | 1.63 | 0% | 6.37 | 375 | 1.40 | 0% | 5.98 | 253 | 1.92 | 15% | 2.84 | 211 | 1.56 | 17% | 2.66 | 172 | 1.36 | 3% | 2.49 | |
| Region K | 579 | 1.51 | 19% | 6.87 | 479 | 1.62 | 2% | 6.44 | 382 | 1.48 | 0% | 6.01 | 233 | 2.36 | 10% | 2.75 | 186 | 1.83 | 12% | 2.55 | 156 | 1.24 | 10% | 2.42 | |
| Individual locations | Region A | 768 | 1.77 | 8% | 7.69 | 633 | 1.57 | 6% | 7.10 | 516 | 1.43 | 0% | 6.59 | 428 | 4.62 | 27% | 3.60 | 352 | 1.42 | 20% | 3.27 | 283 | 1.30 | 12% | 2.97 |
| Region B | 755 | 1.97 | 7% | 7.64 | 626 | 1.80 | 4% | 7.07 | 512 | 1.69 | 0% | 6.58 | 404 | 1.54 | 23% | 3.50 | 325 | 1.45 | 17% | 3.15 | 258 | 1.36 | 11% | 2.86 | |
| Region C | 786 | 1.87 | 10% | 7.77 | 653 | 1.65 | 8% | 7.19 | 532 | 1.64 | 0% | 6.66 | 418 | 1.97 | 25% | 3.56 | 339 | 1.93 | 14% | 3.21 | 273 | 1.77 | 10% | 2.93 | |
| Region D | 791 | 1.85 | 20% | 7.79 | 676 | 1.85 | 7% | 7.29 | 570 | 1.84 | 0% | 6.83 | 365 | 2.21 | 29% | 3.33 | 302 | 1.63 | 29% | 3.06 | 256 | 1.87 | 29% | 2.85 | |
| Region E | 671 | 1.46 | 7% | 7.27 | 554 | 1.42 | 1% | 6.76 | 450 | 1.31 | 0% | 6.31 | 400 | 1.32 | 18% | 3.48 | 317 | 1.39 | 12% | 3.12 | 254 | 1.26 | 12% | 2.84 | |
| Region F | 732 | 1.90 | 10% | 7.53 | 603 | 1.82 | 1% | 6.97 | 482 | 1.63 | 0% | 6.45 | 372 | 1.52 | 27% | 3.36 | 304 | 1.38 | 21% | 3.06 | 245 | 1.67 | 4% | 2.81 | |
| Region G | 684 | 1.71 | 7% | 7.33 | 565 | 1.51 | 4% | 6.81 | 454 | 1.40 | 0% | 6.33 | 330 | 3.33 | 13% | 3.18 | 274 | 2.64 | 14% | 2.93 | 228 | 1.92 | 16% | 2.73 | |
| Region H | 749 | 2.20 | 8% | 7.61 | 640 | 2.13 | −2% | 7.13 | 540 | 1.91 | 0% | 6.70 | 317 | 2.71 | 16% | 3.12 | 276 | 3.17 | 10% | 2.94 | 237 | 2.74 | 10% | 2.77 | |
| Region I | 700 | 2.38 | 9% | 7.39 | 627 | 2.31 | 0% | 7.08 | 542 | 2.09 | 0% | 6.71 | 283 | 2.54 | 11% | 2.97 | 237 | 2.12 | 12% | 2.77 | 209 | 2.19 | 10% | 2.65 | |
| Region J | 600 | 1.81 | 1% | 6.96 | 483 | 1.61 | 0% | 6.45 | 394 | 1.39 | 0% | 6.06 | 275 | 2.20 | 15% | 2.94 | 231 | 1.86 | 16% | 2.74 | 194 | 1.35 | 3% | 2.58 | |
| Region K | 686 | 2.17 | 9% | 7.33 | 604 | 1.94 | 9% | 6.98 | 532 | 1.91 | 0% | 6.66 | 303 | 2.53 | 15% | 3.06 | 255 | 1.87 | 14% | 2.85 | 219 | 1.70 | 10% | 2.69 | |
Table A4.
Three-hours-ahead firm forecast results applying smart persistence.
Table A4.
Three-hours-ahead firm forecast results applying smart persistence.
| 3 h Forecasts | Current Technology Cost: PV @ $1000/kW, Storage @ $200/kWh | Future Technology Cost: PV @ $400/kW, Storage @ $50/kWh | |||||||||||||||||||||||
|---|---|---|---|---|---|---|---|---|---|---|---|---|---|---|---|---|---|---|---|---|---|---|---|---|---|
| No Flexibility | 2.5% Flexibility | 5% Flexibility | No Flexibility | 2.5% Flexibility | 5% Flexibility | ||||||||||||||||||||
| Electrical Region | Add’l $ per PVkW | Storage PV h | Over-Sizing | LCOE ¢/kWh | Add’l $ per PVkW | Storage PV h | Over-Sizing | LCOE ¢/kWh | Add’l $ per PVkW | Storage PV h | Over-Sizing | LCOE ¢/kWh | Add’l $ per PVkW | Storage PV h | Over-Sizing | LCOE ¢/kWh | Add’l $ per PVkW | Storage PV h | Over-Sizing | LCOE ¢/kWh | Add’l $ per PVkW | Storage PV h | Over-Sizing | LCOE ¢/kWh | |
| homogeneously dispersed fleets | Entire NYISO | 486 | 1.90 | 3% | 6.46 | 435 | 1.73 | 3% | 6.24 | 386 | 1.56 | 3% | 6.03 | 182 | 2.09 | 2% | 2.53 | 156 | 1.73 | 3% | 2.42 | 134 | 1.56 | 3% | 1.90 |
| Region A | 584 | 2.30 | 4% | 6.89 | 566 | 2.13 | 7% | 6.81 | 538 | 2.11 | 0% | 6.69 | 209 | 2.39 | 3% | 2.65 | 184 | 2.61 | 1% | 2.54 | 169 | 2.64 | 0% | 1.71 | |
| Region B | 618 | 2.66 | 2% | 7.04 | 589 | 2.51 | 3% | 6.91 | 564 | 2.38 | 4% | 6.80 | 208 | 2.66 | 2% | 2.64 | 195 | 2.51 | 3% | 2.59 | 183 | 2.38 | 4% | 1.97 | |
| Region C | 676 | 2.78 | 4% | 7.29 | 632 | 2.27 | 10% | 7.10 | 597 | 2.09 | 12% | 6.95 | 230 | 2.89 | 3% | 2.74 | 213 | 2.70 | 4% | 2.67 | 198 | 2.67 | 4% | 1.99 | |
| Region D | 578 | 2.55 | 1% | 6.86 | 496 | 2.12 | 2% | 6.51 | 429 | 1.84 | 2% | 6.22 | 184 | 2.69 | 0% | 2.54 | 166 | 2.12 | 2% | 2.46 | 142 | 1.84 | 2% | 1.91 | |
| Region E | 581 | 2.64 | 0% | 6.88 | 490 | 2.08 | 2% | 6.48 | 429 | 1.83 | 2% | 6.21 | 184 | 2.87 | −1% | 2.54 | 163 | 2.77 | −2% | 2.45 | 142 | 1.83 | 2% | 1.92 | |
| Region F | 540 | 1.86 | 7% | 6.70 | 477 | 1.65 | 7% | 6.42 | 420 | 1.51 | 6% | 6.18 | 195 | 2.38 | 2% | 2.59 | 173 | 2.17 | 2% | 2.49 | 153 | 1.78 | 3% | 1.93 | |
| Region G | 496 | 1.52 | 8% | 6.51 | 434 | 1.33 | 8% | 6.24 | 381 | 1.16 | 7% | 6.01 | 211 | 2.81 | 1% | 2.66 | 182 | 2.42 | 1% | 2.53 | 152 | 2.17 | 0% | 1.71 | |
| Region H | 598 | 1.56 | 15% | 6.95 | 558 | 1.69 | 12% | 6.78 | 508 | 1.78 | 8% | 6.56 | 247 | 3.40 | 2% | 2.81 | 214 | 2.96 | 2% | 2.67 | 183 | 2.72 | 1% | 1.71 | |
| Region I | 595 | 2.25 | 5% | 6.94 | 560 | 2.10 | 6% | 6.79 | 523 | 1.99 | 6% | 6.62 | 227 | 2.25 | 5% | 2.73 | 196 | 2.61 | 2% | 2.59 | 173 | 2.35 | 2% | 1.71 | |
| Region J | 511 | 1.66 | 7% | 6.57 | 469 | 1.56 | 7% | 6.39 | 444 | 1.52 | 7% | 6.28 | 215 | 1.76 | 6% | 2.68 | 190 | 2.03 | 4% | 2.57 | 171 | 1.91 | 4% | 1.71 | |
| Region K | 555 | 2.08 | 5% | 6.77 | 486 | 1.63 | 8% | 6.46 | 417 | 1.50 | 6% | 6.16 | 205 | 2.39 | 3% | 2.63 | 181 | 2.03 | 4% | 2.53 | 153 | 1.58 | 5% | 1.71 | |
| Individual locations | Region A | 708 | 2.93 | 4% | 7.43 | 666 | 2.67 | 6% | 7.25 | 640 | 2.24 | 12% | 7.14 | 240 | 3.05 | 3% | 2.78 | 228 | 2.92 | 4% | 2.73 | 218 | 2.60 | 7% | 1.71 |
| Region B | 649 | 2.54 | 5% | 7.17 | 602 | 2.31 | 6% | 6.97 | 563 | 2.19 | 6% | 6.80 | 238 | 3.64 | 0% | 2.78 | 219 | 2.47 | 5% | 2.69 | 197 | 2.30 | 5% | 1.71 | |
| Region C | 669 | 2.75 | 4% | 7.26 | 642 | 2.55 | 6% | 7.14 | 625 | 2.47 | 7% | 7.07 | 233 | 2.75 | 4% | 2.75 | 223 | 2.55 | 6% | 2.71 | 212 | 2.47 | 7% | 1.71 | |
| Region D | 623 | 2.45 | 5% | 7.06 | 575 | 2.28 | 5% | 6.85 | 521 | 2.12 | 4% | 6.62 | 224 | 2.60 | 4% | 2.72 | 200 | 2.38 | 4% | 2.61 | 179 | 2.12 | 4% | 1.71 | |
| Region E | 666 | 2.96 | 1% | 7.25 | 614 | 2.67 | 2% | 7.02 | 563 | 2.33 | 4% | 6.80 | 214 | 3.18 | 0% | 2.67 | 201 | 2.67 | 2% | 2.61 | 187 | 2.43 | 3% | 1.71 | |
| Region F | 532 | 1.84 | 6% | 6.66 | 482 | 1.74 | 5% | 6.45 | 430 | 1.61 | 4% | 6.22 | 204 | 2.36 | 2% | 2.63 | 182 | 2.10 | 2% | 2.53 | 158 | 1.77 | 2% | 1.94 | |
| Region G | 594 | 1.86 | 10% | 6.94 | 539 | 1.69 | 10% | 6.69 | 506 | 1.56 | 11% | 6.55 | 251 | 2.08 | 8% | 2.83 | 225 | 1.69 | 10% | 2.72 | 205 | 3.28 | −1% | 2.00 | |
| Region H | 779 | 1.92 | 7% | 7.74 | 693 | 1.85 | 3% | 7.36 | 611 | 1.75 | 2% | 7.01 | 293 | 5.14 | −1% | 3.02 | 269 | 4.74 | −1% | 2.91 | 238 | 4.05 | 0% | 2.05 | |
| Region I | 624 | 2.24 | 7% | 7.06 | 575 | 2.18 | 6% | 6.85 | 548 | 1.99 | 8% | 6.73 | 246 | 2.24 | 7% | 2.81 | 212 | 2.18 | 6% | 2.66 | 201 | 2.11 | 7% | 2.00 | |
| Region J | 576 | 2.06 | 6% | 6.85 | 538 | 1.96 | 5% | 6.69 | 499 | 1.85 | 5% | 6.52 | 231 | 2.06 | 6% | 2.75 | 210 | 2.04 | 6% | 2.65 | 189 | 1.82 | 7% | 1.71 | |
| Region K | 768 | 1.68 | 28% | 7.69 | 748 | 2.64 | 13% | 7.60 | 668 | 1.91 | −2% | 7.26 | 268 | 3.13 | 6% | 2.90 | 254 | 3.08 | 7% | 2.84 | 242 | 2.85 | 9% | 2.06 | |
Table A5.
Three-hours-ahead firm forecast results applying GFS.
Table A5.
Three-hours-ahead firm forecast results applying GFS.
| 3 h Forecasts | Current Technology Cost: PV @ $1000/kW, Storage @ $200/kWh | Future Technology Cost: PV @ $400/kW, Storage @ $50/kWh | |||||||||||||||||||||||
|---|---|---|---|---|---|---|---|---|---|---|---|---|---|---|---|---|---|---|---|---|---|---|---|---|---|
| No Flexibility | 2.5% Flexibility | 5% Flexibility | No Flexibility | 2.5% Flexibility | 5% Flexibility | ||||||||||||||||||||
| Electrical Region | Add’l $ per PVkW | Storage PV h | Over-Sizing | LCOE ¢/kWh | Add’l $ per PVkW | Storage PV h | Over-Sizing | LCOE ¢/kWh | Add’l $ per PVkW | Storage PV h | Over-Sizing | LCOE ¢/kWh | Add’l $ per PVkW | Storage PV h | Over-Sizing | LCOE ¢/kWh | Add’l $ per PVkW | Storage PV h | Over-Sizing | LCOE ¢/kWh | Add’l $ per PVkW | Storage PV h | Over-Sizing | LCOE ¢/kWh | |
| homogeneously dispersed fleets | Entire NYISO | 564 | 0.73 | 29% | 6.81 | 462 | 0.56 | 27% | 6.36 | 379 | 0.45 | 24% | 6.00 | 271 | 1.74 | 28% | 2.92 | 204 | 1.17 | 25% | 2.63 | 160 | 0.50 | 26% | 1.94 |
| Region A | 787 | 1.83 | 20% | 7.77 | 665 | 1.70 | 15% | 7.24 | 557 | 1.64 | 7% | 6.77 | 379 | 1.67 | 28% | 3.39 | 302 | 1.53 | 24% | 3.06 | 230 | 2.55 | 15% | 1.71 | |
| Region B | 819 | 1.92 | 19% | 7.91 | 700 | 1.80 | 15% | 7.40 | 593 | 1.83 | 4% | 6.93 | 391 | 2.32 | 29% | 3.44 | 311 | 2.10 | 29% | 3.09 | 248 | 2.18 | 21% | 2.07 | |
| Region C | 751 | 1.60 | 22% | 7.62 | 644 | 1.53 | 18% | 7.15 | 545 | 1.64 | 3% | 6.72 | 344 | 1.89 | 29% | 3.24 | 271 | 1.43 | 29% | 2.92 | 224 | 1.26 | 28% | 2.03 | |
| Region D | 1150 | 3.09 | 29% | 9.35 | 1005 | 2.92 | 22% | 8.72 | 870 | 2.80 | 13% | 8.13 | 467 | 6.12 | 24% | 3.77 | 411 | 5.52 | 22% | 3.53 | 354 | 2.43 | 27% | 2.22 | |
| Region E | 751 | 1.36 | 29% | 7.62 | 615 | 1.00 | 29% | 7.03 | 512 | 0.82 | 26% | 6.58 | 329 | 2.68 | 26% | 3.17 | 272 | 1.83 | 28% | 2.92 | 226 | 1.69 | 23% | 2.03 | |
| Region F | 802 | 1.59 | 29% | 7.84 | 690 | 1.53 | 21% | 7.35 | 586 | 1.51 | 12% | 6.90 | 389 | 1.61 | 29% | 3.43 | 315 | 1.38 | 29% | 3.11 | 262 | 1.21 | 29% | 2.09 | |
| Region G | 818 | 1.97 | 26% | 7.91 | 705 | 2.00 | 18% | 7.42 | 627 | 1.74 | 20% | 7.08 | 336 | 2.71 | 29% | 3.20 | 286 | 1.99 | 29% | 2.98 | 244 | 1.57 | 26% | 1.71 | |
| Region H | 828 | 2.37 | 15% | 7.95 | 722 | 2.09 | 15% | 7.49 | 636 | 1.93 | 11% | 7.12 | 291 | 3.05 | 19% | 3.01 | 261 | 2.50 | 21% | 2.87 | 234 | 2.00 | 23% | 1.71 | |
| Region I | 735 | 2.46 | 15% | 7.55 | 650 | 2.10 | 12% | 7.18 | 576 | 1.80 | 11% | 6.86 | 265 | 2.65 | 17% | 2.89 | 238 | 2.11 | 20% | 2.77 | 216 | 1.78 | 21% | 1.71 | |
| Region J | 758 | 1.88 | 14% | 7.65 | 667 | 1.81 | 9% | 7.25 | 582 | 1.78 | 2% | 6.88 | 258 | 3.24 | 13% | 2.86 | 231 | 2.92 | 13% | 2.74 | 220 | 2.53 | 16% | 1.71 | |
| Region K | 693 | 2.27 | 19% | 7.36 | 613 | 2.05 | 17% | 7.02 | 559 | 1.77 | 18% | 6.78 | 239 | 2.27 | 19% | 2.78 | 200 | 2.22 | 15% | 2.61 | 184 | 1.86 | 17% | 1.71 | |
| Individual locations | Region A | 1063 | 2.71 | 29% | 8.97 | 982 | 2.52 | 29% | 8.62 | 910 | 2.32 | 29% | 8.31 | 418 | 4.32 | 28% | 3.56 | 371 | 3.68 | 29% | 3.35 | 347 | 3.47 | 29% | 1.71 |
| Region B | 977 | 2.66 | 15% | 8.60 | 871 | 2.42 | 17% | 8.14 | 785 | 2.17 | 20% | 7.76 | 464 | 3.90 | 29% | 3.76 | 383 | 3.41 | 26% | 3.40 | 328 | 3.33 | 26% | 1.71 | |
| Region C | 996 | 2.61 | 12% | 8.68 | 863 | 2.40 | 8% | 8.10 | 738 | 2.30 | 0% | 7.56 | 447 | 4.59 | 26% | 3.69 | 382 | 4.42 | 20% | 3.40 | 338 | 3.90 | 20% | 1.71 | |
| Region D | 1440 | 3.86 | 29% | 10.61 | 1296 | 3.53 | 29% | 9.99 | 1164 | 3.19 | 29% | 9.41 | 592 | 8.19 | 29% | 4.31 | 531 | 7.38 | 29% | 4.05 | 478 | 6.70 | 29% | 1.71 | |
| Region E | 826 | 1.83 | 28% | 7.94 | 738 | 1.62 | 29% | 7.56 | 673 | 1.40 | 29% | 7.28 | 376 | 2.01 | 29% | 3.38 | 316 | 1.86 | 29% | 3.11 | 285 | 1.66 | 29% | 1.71 | |
| Region F | 1021 | 2.52 | 29% | 8.79 | 932 | 2.38 | 29% | 8.40 | 872 | 2.24 | 29% | 8.14 | 388 | 3.43 | 29% | 3.43 | 345 | 3.01 | 29% | 3.24 | 317 | 3.00 | 29% | 2.16 | |
| Region G | 988 | 3.08 | 14% | 8.65 | 893 | 2.90 | 15% | 8.23 | 832 | 2.72 | 17% | 7.97 | 398 | 3.93 | 29% | 3.47 | 350 | 3.35 | 29% | 3.26 | 308 | 2.80 | 29% | 2.15 | |
| Region H | 831 | 2.50 | 15% | 7.97 | 727 | 2.22 | 20% | 7.51 | 684 | 1.95 | 25% | 7.33 | 299 | 2.89 | 22% | 3.04 | 261 | 2.14 | 25% | 2.87 | 242 | 1.95 | 25% | 2.06 | |
| Region I | 772 | 2.06 | 15% | 7.71 | 681 | 1.78 | 16% | 7.31 | 608 | 1.60 | 14% | 6.99 | 286 | 3.13 | 17% | 2.98 | 263 | 2.65 | 20% | 2.88 | 251 | 2.51 | 21% | 2.07 | |
| Region J | 842 | 2.25 | 13% | 8.01 | 758 | 2.08 | 12% | 7.65 | 675 | 2.06 | 0% | 7.28 | 276 | 3.44 | 14% | 2.94 | 260 | 3.00 | 17% | 2.87 | 247 | 2.70 | 19% | 1.71 | |
| Region K | 1153 | 3.30 | 28% | 9.36 | 1049 | 3.14 | 22% | 8.91 | 946 | 3.04 | 14% | 8.47 | 488 | 3.28 | 29% | 3.86 | 434 | 2.97 | 29% | 3.63 | 389 | 2.67 | 29% | 2.27 | |
Table A6.
Three-hours-ahead firm forecast results applying ECMF.
Table A6.
Three-hours-ahead firm forecast results applying ECMF.
| 3 h Forecasts | Current Technology Cost: PV @ $1000/kW, Storage @ $200/kWh | Future Technology Cost: PV @ $400/kW, Storage @ $50/kWh | |||||||||||||||||||||||
|---|---|---|---|---|---|---|---|---|---|---|---|---|---|---|---|---|---|---|---|---|---|---|---|---|---|
| No Flexibility | 2.5% Flexibility | 5% Flexibility | No Flexibility | 2.5% Flexibility | 5% Flexibility | ||||||||||||||||||||
| Electrical Region | Add’l $ per PVkW | Storage PV h | Over-Sizing | LCOE ¢/kWh | Add’l $ per PVkW | Storage PV h | Over-Sizing | LCOE ¢/kWh | Add’l $ per PVkW | Storage PV h | Over-Sizing | LCOE ¢/kWh | Add’l $ per PVkW | Storage PV h | Over-Sizing | LCOE ¢/kWh | Add’l $ per PVkW | Storage PV h | Over-Sizing | LCOE ¢/kWh | Add’l $ per PVkW | Storage PV h | Over-Sizing | LCOE ¢/kWh | |
| homogeneously dispersed fleets | Entire NYISO | 501 | 0.96 | 15% | 6.53 | 367 | 0.83 | 10% | 5.95 | 257 | 0.89 | 0% | 5.47 | 265 | 0.85 | 21% | 2.89 | 182 | 0.75 | 13% | 2.53 | 122 | 0.70 | 6% | 1.89 |
| Region A | 641 | 1.62 | 3% | 7.14 | 493 | 1.44 | 0% | 6.49 | 370 | 1.22 | 0% | 5.96 | 340 | 1.37 | 25% | 3.22 | 259 | 1.24 | 16% | 2.87 | 191 | 1.12 | 7% | 1.71 | |
| Region B | 631 | 1.61 | 4% | 7.09 | 487 | 1.44 | 0% | 6.47 | 366 | 1.22 | 0% | 5.94 | 339 | 1.43 | 21% | 3.21 | 255 | 1.30 | 12% | 2.85 | 188 | 1.14 | 6% | 1.98 | |
| Region C | 593 | 1.43 | 3% | 6.93 | 447 | 1.25 | 0% | 6.29 | 326 | 1.01 | 0% | 5.77 | 325 | 1.16 | 24% | 3.16 | 243 | 1.04 | 14% | 2.80 | 178 | 0.92 | 6% | 1.97 | |
| Region D | 759 | 1.78 | 20% | 7.65 | 615 | 1.76 | 10% | 7.03 | 490 | 1.74 | 0% | 6.48 | 334 | 2.55 | 26% | 3.19 | 265 | 2.25 | 22% | 2.89 | 212 | 1.97 | 16% | 2.01 | |
| Region E | 563 | 0.86 | 21% | 6.80 | 423 | 0.90 | 10% | 6.19 | 306 | 0.90 | 1% | 5.68 | 307 | 0.83 | 22% | 3.07 | 222 | 0.75 | 15% | 2.71 | 157 | 0.70 | 8% | 1.94 | |
| Region F | 577 | 0.94 | 21% | 6.86 | 450 | 0.89 | 14% | 6.31 | 342 | 0.88 | 6% | 5.84 | 310 | 0.91 | 22% | 3.09 | 230 | 0.73 | 19% | 2.74 | 168 | 0.69 | 12% | 1.95 | |
| Region G | 620 | 1.65 | 11% | 7.05 | 498 | 1.46 | 6% | 6.52 | 389 | 1.37 | 0% | 6.04 | 303 | 1.57 | 16% | 3.06 | 234 | 1.33 | 14% | 2.76 | 183 | 1.24 | 6% | 1.71 | |
| Region H | 705 | 2.38 | 4% | 7.42 | 602 | 2.23 | −2% | 6.97 | 512 | 2.01 | 0% | 6.58 | 304 | 2.76 | 14% | 3.06 | 252 | 2.21 | 14% | 2.84 | 217 | 1.78 | 14% | 1.71 | |
| Region I | 693 | 2.13 | 14% | 7.37 | 588 | 2.16 | 0% | 6.91 | 497 | 1.94 | 0% | 6.51 | 286 | 2.20 | 14% | 2.99 | 239 | 2.10 | 13% | 2.78 | 210 | 1.87 | 14% | 1.71 | |
| Region J | 575 | 1.76 | 4% | 6.85 | 464 | 1.60 | 0% | 6.37 | 373 | 1.38 | 0% | 5.97 | 252 | 2.12 | 14% | 2.83 | 211 | 1.47 | 10% | 2.66 | 172 | 1.32 | 6% | 1.71 | |
| Region K | 584 | 1.49 | 20% | 6.89 | 480 | 1.62 | 2% | 6.44 | 383 | 1.48 | 0% | 6.02 | 231 | 2.49 | 9% | 2.74 | 181 | 1.94 | 10% | 2.53 | 155 | 1.56 | 12% | 1.71 | |
| Individual locations | Region A | 762 | 1.83 | 3% | 7.66 | 621 | 1.61 | 1% | 7.05 | 503 | 1.40 | 0% | 6.54 | 423 | 4.65 | 26% | 3.58 | 353 | 1.40 | 23% | 3.27 | 285 | 1.29 | 13% | 1.71 |
| Region B | 733 | 1.86 | 8% | 7.54 | 608 | 1.71 | 4% | 7.00 | 495 | 1.55 | 1% | 6.51 | 397 | 1.51 | 21% | 3.47 | 319 | 1.42 | 15% | 3.13 | 254 | 1.31 | 10% | 1.71 | |
| Region C | 782 | 1.71 | 19% | 7.75 | 666 | 1.64 | 11% | 7.25 | 549 | 1.66 | 0% | 6.74 | 410 | 1.52 | 26% | 3.53 | 333 | 1.51 | 21% | 3.19 | 272 | 1.69 | 11% | 1.71 | |
| Region D | 785 | 1.81 | 22% | 7.76 | 672 | 1.85 | 7% | 7.27 | 562 | 1.77 | 0% | 6.79 | 367 | 2.52 | 29% | 3.34 | 295 | 1.97 | 29% | 3.02 | 250 | 1.76 | 29% | 1.71 | |
| Region E | 672 | 1.57 | 3% | 7.27 | 545 | 1.43 | 0% | 6.72 | 440 | 1.29 | 0% | 6.27 | 398 | 1.33 | 22% | 3.47 | 314 | 1.22 | 14% | 3.11 | 246 | 1.12 | 8% | 1.71 | |
| Region F | 672 | 1.63 | 6% | 7.27 | 544 | 1.52 | −2% | 6.72 | 430 | 1.31 | 0% | 6.22 | 358 | 1.77 | 29% | 3.30 | 291 | 1.39 | 26% | 3.01 | 229 | 1.24 | 6% | 2.04 | |
| Region G | 664 | 1.67 | 6% | 7.24 | 546 | 1.61 | 0% | 6.73 | 449 | 1.42 | 0% | 6.30 | 329 | 3.37 | 13% | 3.17 | 271 | 2.63 | 14% | 2.92 | 227 | 2.02 | 15% | 2.04 | |
| Region H | 741 | 2.16 | 10% | 7.58 | 636 | 2.10 | 0% | 7.11 | 536 | 1.91 | 0% | 6.68 | 310 | 2.80 | 15% | 3.09 | 272 | 2.73 | 14% | 2.93 | 245 | 2.43 | 15% | 2.06 | |
| Region I | 701 | 2.35 | 10% | 7.40 | 624 | 2.31 | 0% | 7.06 | 536 | 2.09 | 0% | 6.68 | 274 | 2.57 | 10% | 2.93 | 236 | 2.41 | 10% | 2.77 | 209 | 2.14 | 11% | 2.01 | |
| Region J | 590 | 1.78 | 1% | 6.92 | 477 | 1.60 | 0% | 6.42 | 387 | 1.37 | 0% | 6.03 | 271 | 2.22 | 15% | 2.92 | 230 | 1.91 | 16% | 2.74 | 189 | 1.33 | 3% | 1.71 | |
| Region K | 695 | 2.13 | 11% | 7.37 | 613 | 1.90 | 12% | 7.02 | 533 | 1.91 | 0% | 6.67 | 307 | 2.82 | 17% | 3.08 | 256 | 1.90 | 12% | 2.85 | 220 | 1.69 | 13% | 2.03 | |
Table A7.
Twenty-four-hours-ahead firm forecast results applying smart persistence.
Table A7.
Twenty-four-hours-ahead firm forecast results applying smart persistence.
| 24 h Forecasts | Current Technology Cost: PV @ $1000/kW, Storage @ $200/kWh | Future Technology Cost: PV @ $400/kW, Storage @ $50/kWh | |||||||||||||||||||||||
|---|---|---|---|---|---|---|---|---|---|---|---|---|---|---|---|---|---|---|---|---|---|---|---|---|---|
| No Flexibility | 2.5% Flexibility | 5% Flexibility | No Flexibility | 2.5% Flexibility | 5% Flexibility | ||||||||||||||||||||
| Electrical Region | Add’l $ per PVkW | Storage PV h | Over-Sizing | LCOE ¢/kWh | Add’l $ per PVkW | Storage PV h | Over-Sizing | LCOE ¢/kWh | Add’l $ per PVkW | Storage PV h | Over-Sizing | LCOE ¢/kWh | Add’l $ per PVkW | Storage PV h | Over-Sizing | LCOE ¢/kWh | Add’l $ per PVkW | Storage PV h | Over-Sizing | LCOE ¢/kWh | Add’l $ per PVkW | Storage PV h | Over-Sizing | LCOE ¢/kWh | |
| homogeneously dispersed fleets | Entire NYISO | 1190 | 2.76 | 29% | 9.53 | 1027 | 2.71 | 20% | 8.82 | 884 | 2.71 | 10% | 8.20 | 448 | 7.52 | 1% | 3.69 | 386 | 6.51 | 1% | 3.42 | 336 | 5.51 | 2% | 2.01 |
| Region A | 1483 | 4.35 | 13% | 10.80 | 1314 | 4.23 | 5% | 10.06 | 1155 | 4.09 | 0% | 4.35 | 516 | 8.72 | 1% | 3.98 | 473 | 7.90 | 2% | 3.80 | 432 | 7.30 | 2% | 1.72 | |
| Region B | 1494 | 4.48 | 9% | 10.85 | 1319 | 4.37 | 0% | 10.09 | 1159 | 4.11 | 0% | 9.39 | 494 | 8.42 | 1% | 3.89 | 462 | 7.77 | 2% | 3.75 | 435 | 7.06 | 4% | 2.09 | |
| Region C | 1448 | 4.13 | 16% | 10.65 | 1267 | 4.06 | 4% | 9.86 | 1106 | 3.88 | 0% | 9.16 | 482 | 8.26 | 1% | 3.84 | 445 | 7.46 | 2% | 3.67 | 409 | 6.72 | 3% | 2.07 | |
| Region D | 1390 | 3.62 | 24% | 10.40 | 1221 | 3.51 | 16% | 9.66 | 1066 | 3.41 | 8% | 8.99 | 475 | 6.15 | 10% | 3.81 | 396 | 5.50 | 7% | 3.46 | 330 | 4.93 | 4% | 2.00 | |
| Region E | 1350 | 3.67 | 27% | 10.22 | 1180 | 3.65 | 14% | 9.48 | 1028 | 3.54 | 6% | 8.82 | 458 | 7.50 | 2% | 3.73 | 391 | 6.40 | 2% | 3.44 | 338 | 5.50 | 2% | 2.01 | |
| Region F | 1269 | 2.93 | 29% | 9.87 | 1104 | 2.68 | 26% | 9.15 | 950 | 2.86 | 7% | 8.48 | 449 | 8.02 | −1% | 3.69 | 395 | 6.89 | 0% | 3.46 | 345 | 5.86 | 1% | 2.02 | |
| Region G | 1287 | 3.19 | 10% | 9.95 | 1109 | 2.98 | 6% | 9.17 | 948 | 2.73 | 4% | 4.35 | 445 | 7.40 | 1% | 3.68 | 396 | 6.08 | 4% | 3.46 | 346 | 4.84 | 7% | 1.72 | |
| Region H | 1400 | 4.82 | 24% | 10.44 | 1229 | 4.35 | 21% | 9.70 | 1068 | 4.01 | 16% | 4.35 | 461 | 7.20 | 3% | 3.74 | 400 | 6.20 | 4% | 3.48 | 353 | 5.00 | 7% | 1.72 | |
| Region I | 1381 | 4.66 | 25% | 10.36 | 1221 | 4.15 | 22% | 9.66 | 1064 | 3.86 | 18% | 4.35 | 486 | 8.50 | 0% | 3.85 | 414 | 6.90 | 2% | 3.54 | 355 | 5.05 | 7% | 1.72 | |
| Region J | 1412 | 3.59 | 1% | 10.49 | 1232 | 3.33 | 0% | 9.71 | 1064 | 3.02 | 0% | 4.35 | 501 | 9.16 | −1% | 3.92 | 451 | 7.46 | 3% | 3.70 | 401 | 5.65 | 9% | 1.72 | |
| Region K | 1527 | 3.99 | 14% | 10.99 | 1351 | 3.85 | 6% | 10.23 | 1190 | 3.67 | 0% | 4.35 | 532 | 9.31 | 1% | 4.05 | 455 | 8.15 | 1% | 3.72 | 392 | 6.91 | 2% | 1.72 | |
| Individual locations | Region A | 1555 | 4.58 | 10% | 11.11 | 1393 | 4.42 | 4% | 10.41 | 1238 | 4.26 | 0% | 4.35 | 570 | 9.78 | 1% | 4.22 | 525 | 8.87 | 2% | 4.02 | 482 | 8.03 | 3% | 1.72 |
| Region B | 1602 | 4.70 | 7% | 11.32 | 1430 | 4.59 | 0% | 10.57 | 1268 | 4.29 | 0% | 4.35 | 515 | 8.77 | 1% | 3.98 | 493 | 8.01 | 3% | 3.88 | 462 | 7.36 | 4% | 1.72 | |
| Region C | 1601 | 4.88 | 3% | 11.31 | 1429 | 4.67 | 0% | 10.56 | 1271 | 4.36 | 0% | 4.35 | 529 | 9.24 | 0% | 4.04 | 502 | 8.35 | 2% | 3.93 | 478 | 7.65 | 4% | 1.72 | |
| Region D | 1542 | 4.38 | 1% | 11.06 | 1377 | 4.10 | 3% | 10.34 | 1215 | 3.94 | 0% | 4.35 | 545 | 7.57 | 10% | 4.11 | 476 | 7.05 | 7% | 3.81 | 414 | 6.53 | 4% | 1.72 | |
| Region E | 1338 | 3.50 | 15% | 10.17 | 1177 | 3.54 | 2% | 9.47 | 1025 | 3.34 | 0% | 4.35 | 471 | 8.39 | −1% | 3.79 | 438 | 7.61 | 0% | 3.64 | 405 | 6.87 | 1% | 1.72 | |
| Region F | 1450 | 3.54 | 23% | 10.66 | 1284 | 3.39 | 15% | 9.94 | 1125 | 3.26 | 6% | 9.24 | 461 | 8.09 | −1% | 3.75 | 418 | 7.17 | 0% | 3.56 | 375 | 6.12 | 2% | 2.04 | |
| Region G | 1329 | 3.63 | 22% | 10.13 | 1183 | 3.38 | 20% | 9.49 | 1047 | 3.16 | 15% | 8.90 | 412 | 6.85 | 0% | 3.53 | 365 | 6.00 | 1% | 3.33 | 329 | 5.14 | 3% | 2.00 | |
| Region H | 1313 | 3.32 | 2% | 10.06 | 1154 | 3.03 | 3% | 9.37 | 1007 | 2.73 | 4% | 8.73 | 464 | 7.80 | 1% | 3.76 | 413 | 6.69 | 3% | 3.54 | 362 | 5.56 | 5% | 2.03 | |
| Region I | 1337 | 3.32 | 4% | 10.16 | 1172 | 3.13 | 0% | 9.45 | 1017 | 2.86 | 0% | 8.77 | 489 | 8.26 | 1% | 3.87 | 419 | 7.00 | 2% | 3.56 | 355 | 5.37 | 5% | 2.03 | |
| Region J | 1417 | 3.67 | 3% | 10.51 | 1244 | 3.44 | 0% | 9.76 | 1082 | 3.14 | 0% | 4.35 | 513 | 8.78 | 1% | 3.97 | 430 | 7.76 | 0% | 3.61 | 364 | 6.44 | 1% | 1.72 | |
| Region K | 1433 | 3.65 | 2% | 10.59 | 1270 | 3.43 | 0% | 9.87 | 1114 | 3.15 | 0% | 9.20 | 515 | 9.33 | 0% | 3.98 | 449 | 7.84 | 2% | 3.69 | 392 | 6.69 | 3% | 2.06 | |
Table A8.
Twenty-four-hours-ahead firm forecast results applying GFS.
Table A8.
Twenty-four-hours-ahead firm forecast results applying GFS.
| 24 h Forecasts | Current Technology Cost: PV @ $1000/kW, Storage @ $200/kWh | Future Technology Cost: PV @ $400/kW, Storage @ $50/kWh | |||||||||||||||||||||||
|---|---|---|---|---|---|---|---|---|---|---|---|---|---|---|---|---|---|---|---|---|---|---|---|---|---|
| No Flexibility | 2.5% Flexibility | 5% Flexibility | NO Flexibility | 2.5% flexibility | 5% Flexibility | ||||||||||||||||||||
| Electrical Region | Add’l $ per PVkW | Storage PV h | Over-Sizing | LCOE ¢/kWh | Add’l $ per PVkW | Storage PV h | Over-Sizing | LCOE ¢/kWh | Add’l $ per PVkW | Storage PV h | Over-Sizing | LCOE ¢/kWh | Add’l $ per PVkW | Storage PV h | Over-Sizing | LCOE ¢/kWh | Add’l $ per PVkW | Storage PV h | Over-Sizing | LCOE ¢/kWh | Add’l $ per PVkW | Storage PV h | Over-Sizing | LCOE ¢/kWh | |
| homogeneously dispersed fleets | Entire NYISO | 584 | 1.13 | 20% | 6.89 | 467 | 0.99 | 12% | 6.38 | 356 | 0.83 | 9% | 5.90 | 284 | 1.51 | 29% | 2.97 | 214 | 0.94 | 21% | 2.67 | 164 | 0.82 | 18% | 1.86 |
| Region A | 811 | 2.02 | 13% | 7.88 | 671 | 1.84 | 9% | 7.27 | 552 | 1.66 | 5% | 4.35 | 411 | 1.69 | 27% | 3.53 | 328 | 1.43 | 26% | 3.17 | 252 | 3.49 | 7% | 1.72 | |
| Region B | 758 | 1.66 | 17% | 7.65 | 625 | 1.63 | 8% | 7.07 | 510 | 1.40 | 8% | 6.57 | 395 | 1.41 | 29% | 3.46 | 315 | 1.34 | 22% | 3.11 | 248 | 1.29 | 15% | 1.93 | |
| Region C | 770 | 1.90 | 18% | 7.70 | 644 | 1.70 | 17% | 7.15 | 547 | 1.49 | 17% | 6.73 | 368 | 2.19 | 28% | 3.34 | 284 | 1.70 | 20% | 2.97 | 221 | 1.49 | 17% | 1.91 | |
| Region D | 825 | 1.56 | 28% | 7.94 | 723 | 1.64 | 18% | 7.50 | 615 | 1.61 | 10% | 7.02 | 384 | 2.23 | 29% | 3.41 | 319 | 2.09 | 29% | 3.13 | 263 | 2.07 | 25% | 1.95 | |
| Region E | 707 | 1.41 | 24% | 7.42 | 604 | 1.10 | 27% | 6.98 | 509 | 1.32 | 10% | 6.56 | 341 | 1.40 | 29% | 3.23 | 270 | 1.29 | 24% | 2.91 | 209 | 1.40 | 19% | 1.90 | |
| Region F | 731 | 1.22 | 29% | 7.53 | 622 | 1.10 | 26% | 7.06 | 526 | 1.12 | 15% | 6.64 | 363 | 2.22 | 29% | 3.32 | 291 | 1.74 | 29% | 3.01 | 237 | 1.36 | 26% | 1.92 | |
| Region G | 964 | 2.97 | 21% | 8.54 | 852 | 2.77 | 17% | 8.06 | 758 | 2.67 | 10% | 4.35 | 379 | 3.15 | 29% | 3.39 | 320 | 3.00 | 23% | 3.13 | 276 | 2.32 | 24% | 1.72 | |
| Region H | 961 | 3.56 | 16% | 8.53 | 883 | 3.26 | 14% | 8.19 | 815 | 2.92 | 15% | 4.35 | 332 | 3.56 | 16% | 3.18 | 303 | 3.24 | 17% | 3.06 | 280 | 2.84 | 19% | 1.72 | |
| Region I | 900 | 3.40 | 13% | 8.26 | 823 | 3.05 | 13% | 7.93 | 752 | 2.71 | 13% | 4.35 | 307 | 3.87 | 10% | 3.08 | 281 | 3.21 | 13% | 2.96 | 259 | 2.66 | 16% | 1.72 | |
| Region J | 889 | 2.98 | 21% | 8.22 | 785 | 2.17 | 15% | 7.77 | 692 | 2.01 | 12% | 4.35 | 314 | 3.03 | 20% | 3.10 | 279 | 2.63 | 21% | 2.95 | 248 | 2.36 | 20% | 1.72 | |
| Region K | 812 | 2.91 | 16% | 7.88 | 719 | 2.48 | 17% | 7.48 | 644 | 2.06 | 19% | 4.35 | 279 | 2.91 | 16% | 2.95 | 246 | 2.48 | 17% | 2.81 | 220 | 2.14 | 18% | 1.72 | |
| Individual locations | Region A | 1097 | 3.20 | 21% | 9.12 | 1002 | 2.92 | 24% | 8.71 | 919 | 2.62 | 26% | 4.35 | 448 | 5.38 | 19% | 3.69 | 371 | 3.58 | 25% | 3.35 | 331 | 2.82 | 28% | 1.72 |
| Region B | 904 | 2.32 | 7% | 8.28 | 786 | 2.11 | 9% | 7.77 | 693 | 1.87 | 14% | 4.35 | 485 | 1.92 | 29% | 3.85 | 400 | 2.26 | 21% | 3.48 | 322 | 3.37 | 11% | 1.72 | |
| Region C | 981 | 2.54 | 10% | 8.62 | 856 | 2.37 | 7% | 8.07 | 745 | 2.30 | −2% | 4.35 | 452 | 3.21 | 29% | 3.70 | 374 | 3.10 | 28% | 3.36 | 299 | 3.08 | 17% | 1.72 | |
| Region D | 1271 | 3.36 | 23% | 9.88 | 1152 | 3.29 | 14% | 9.36 | 1041 | 3.20 | 7% | 4.35 | 482 | 4.16 | 29% | 3.84 | 419 | 3.87 | 29% | 3.56 | 368 | 3.59 | 29% | 1.72 | |
| Region E | 887 | 1.75 | 29% | 8.21 | 790 | 1.56 | 29% | 7.79 | 707 | 1.37 | 29% | 4.35 | 398 | 2.51 | 29% | 3.47 | 346 | 2.07 | 29% | 3.25 | 306 | 1.72 | 29% | 1.72 | |
| Region F | 1091 | 2.76 | 27% | 9.09 | 975 | 2.56 | 21% | 8.59 | 876 | 2.40 | 14% | 8.16 | 437 | 3.75 | 29% | 3.64 | 391 | 3.53 | 29% | 3.44 | 352 | 3.17 | 29% | 2.02 | |
| Region G | 996 | 2.93 | 13% | 8.68 | 880 | 2.69 | 13% | 8.18 | 802 | 2.46 | 17% | 7.84 | 395 | 3.73 | 25% | 3.46 | 342 | 3.06 | 25% | 3.23 | 303 | 2.40 | 27% | 1.98 | |
| Region H | 995 | 3.68 | 15% | 8.68 | 909 | 3.38 | 13% | 8.30 | 847 | 3.06 | 13% | 8.03 | 343 | 3.72 | 17% | 3.23 | 310 | 3.28 | 18% | 3.09 | 290 | 2.94 | 20% | 1.97 | |
| Region I | 937 | 3.34 | 17% | 8.43 | 848 | 3.12 | 15% | 8.04 | 793 | 2.80 | 17% | 7.80 | 318 | 3.71 | 12% | 3.12 | 290 | 3.12 | 15% | 3.00 | 271 | 2.80 | 17% | 1.95 | |
| Region J | 959 | 2.22 | 28% | 8.52 | 858 | 1.97 | 28% | 8.08 | 773 | 1.77 | 27% | 4.35 | 356 | 3.27 | 25% | 3.29 | 313 | 2.84 | 25% | 3.10 | 279 | 2.53 | 24% | 1.72 | |
| Region K | 1167 | 3.39 | 22% | 9.43 | 1061 | 3.13 | 20% | 8.97 | 960 | 3.00 | 13% | 8.53 | 512 | 3.21 | 29% | 3.97 | 456 | 2.91 | 29% | 3.73 | 408 | 2.60 | 29% | 2.07 | |
Table A9.
Twenty-four-hours-ahead firm forecast results applying ECMF.
Table A9.
Twenty-four-hours-ahead firm forecast results applying ECMF.
| 24 h Forecasts | Current Technology Cost: PV @ $1000/kW, Storage @ $200/kWh | Future Technology Cost: PV @ $400/kW, Storage @ $50/kWh | |||||||||||||||||||||||
|---|---|---|---|---|---|---|---|---|---|---|---|---|---|---|---|---|---|---|---|---|---|---|---|---|---|
| No Flexibility | 2.5% Flexibility | 5% Flexibility | No Flexibility | 2.5% Flexibility | 5% Flexibility | ||||||||||||||||||||
| Electrical Region | Add’l $ per PVkW | Storage PV h | Over-Sizing | LCOE ¢/kWh | Add’l $ per PVkW | Storage PV h | Over-Sizing | LCOE ¢/kWh | Add’l $ per PVkW | Storage PV h | Over-Sizing | LCOE ¢/kWh | Add’l $ per PVkW | Storage PV h | Over-Sizing | LCOE ¢/kWh | Add’l $ per PVkW | Storage PV h | Over-Sizing | LCOE ¢/kWh | Add’l $ per PVkW | Storage PV h | Over-Sizing | LCOE ¢/kWh | |
| homogeneously dispersed fleets | Entire NYISO | 576 | 1.28 | 12% | 6.85 | 437 | 1.22 | 4% | 6.25 | 317 | 1.12 | 0% | 5.73 | 295 | 1.00 | 26% | 3.02 | 215 | 0.98 | 16% | 2.67 | 151 | 0.94 | 7% | 1.85 |
| Region A | 754 | 1.96 | 12% | 7.63 | 612 | 1.82 | 7% | 7.01 | 498 | 1.67 | 4% | 4.35 | 377 | 1.95 | 24% | 3.38 | 285 | 1.73 | 17% | 2.98 | 211 | 1.44 | 14% | 1.72 | |
| Region B | 725 | 1.86 | 14% | 7.50 | 589 | 1.79 | 7% | 6.91 | 488 | 1.59 | 6% | 6.47 | 353 | 1.56 | 26% | 3.27 | 266 | 1.46 | 20% | 2.90 | 203 | 1.39 | 14% | 1.89 | |
| Region C | 661 | 1.50 | 7% | 7.22 | 520 | 1.37 | 1% | 6.61 | 392 | 1.20 | 0% | 6.05 | 355 | 1.86 | 29% | 3.29 | 271 | 1.60 | 18% | 2.92 | 210 | 1.00 | 10% | 1.90 | |
| Region D | 720 | 1.76 | 9% | 7.48 | 577 | 1.66 | 2% | 6.86 | 451 | 1.50 | 0% | 6.31 | 366 | 3.54 | 21% | 3.33 | 292 | 1.38 | 18% | 3.01 | 225 | 1.30 | 10% | 1.91 | |
| Region E | 668 | 1.64 | 8% | 7.26 | 526 | 1.53 | 2% | 6.64 | 402 | 1.38 | 0% | 6.10 | 345 | 1.28 | 28% | 3.24 | 263 | 1.26 | 17% | 2.89 | 196 | 1.20 | 8% | 1.89 | |
| Region F | 633 | 1.35 | 7% | 7.10 | 484 | 1.17 | 3% | 6.46 | 361 | 1.00 | 0% | 5.92 | 348 | 1.16 | 29% | 3.26 | 269 | 1.03 | 20% | 2.91 | 203 | 0.92 | 10% | 1.89 | |
| Region G | 700 | 1.89 | 13% | 7.39 | 589 | 1.85 | 4% | 6.91 | 486 | 1.77 | 0% | 4.35 | 312 | 1.77 | 27% | 3.10 | 257 | 1.45 | 26% | 2.86 | 212 | 1.46 | 17% | 1.72 | |
| Region H | 715 | 2.19 | 15% | 7.46 | 640 | 2.14 | 3% | 7.14 | 545 | 1.98 | 0% | 4.35 | 293 | 2.21 | 17% | 3.02 | 253 | 1.88 | 19% | 2.84 | 223 | 1.71 | 19% | 1.72 | |
| Region I | 634 | 1.77 | 6% | 7.11 | 540 | 1.57 | 5% | 6.70 | 458 | 1.59 | 0% | 4.35 | 289 | 1.66 | 20% | 3.00 | 249 | 1.42 | 22% | 2.82 | 222 | 1.20 | 24% | 1.72 | |
| Region J | 663 | 2.04 | 6% | 7.23 | 570 | 1.96 | 0% | 6.83 | 489 | 1.80 | 0% | 4.35 | 265 | 2.04 | 17% | 2.89 | 224 | 1.66 | 19% | 2.72 | 196 | 1.47 | 19% | 1.72 | |
| Region K | 729 | 2.61 | 13% | 7.52 | 663 | 2.48 | 7% | 7.23 | 590 | 2.44 | 0% | 4.35 | 257 | 2.59 | 14% | 2.86 | 222 | 2.35 | 15% | 2.70 | 198 | 2.17 | 15% | 1.72 | |
| Individual locations | Region A | 916 | 2.48 | 10% | 8.33 | 786 | 2.18 | 11% | 7.77 | 672 | 2.04 | 7% | 4.35 | 457 | 4.12 | 26% | 3.73 | 375 | 3.03 | 27% | 3.37 | 310 | 2.09 | 18% | 1.72 |
| Region B | 819 | 2.17 | 3% | 7.91 | 690 | 2.00 | 0% | 7.35 | 575 | 1.85 | 0% | 4.35 | 408 | 3.40 | 29% | 3.51 | 346 | 2.20 | 17% | 3.25 | 289 | 1.98 | 14% | 1.72 | |
| Region C | 808 | 1.97 | 3% | 7.87 | 671 | 1.81 | 0% | 7.27 | 550 | 1.60 | 0% | 4.35 | 444 | 1.77 | 28% | 3.67 | 359 | 1.89 | 18% | 3.30 | 293 | 1.68 | 17% | 1.72 | |
| Region D | 795 | 1.92 | 14% | 7.81 | 672 | 1.84 | 4% | 7.27 | 565 | 1.78 | 0% | 4.35 | 380 | 2.52 | 29% | 3.39 | 304 | 1.90 | 28% | 3.06 | 248 | 1.50 | 29% | 1.72 | |
| Region E | 758 | 1.74 | 6% | 7.65 | 632 | 1.61 | 2% | 7.10 | 519 | 1.46 | 0% | 4.35 | 431 | 1.43 | 24% | 3.62 | 351 | 1.47 | 18% | 3.27 | 281 | 1.17 | 19% | 1.72 | |
| Region F | 737 | 1.72 | 9% | 7.56 | 617 | 1.66 | 3% | 7.03 | 503 | 1.48 | 0% | 6.54 | 408 | 2.53 | 29% | 3.51 | 338 | 1.48 | 12% | 3.21 | 274 | 1.30 | 10% | 1.96 | |
| Region G | 773 | 2.09 | 9% | 7.71 | 662 | 1.98 | 5% | 7.23 | 569 | 1.96 | 0% | 6.82 | 375 | 3.05 | 24% | 3.37 | 315 | 2.46 | 24% | 3.11 | 269 | 1.61 | 14% | 1.95 | |
| Region H | 766 | 2.38 | 5% | 7.68 | 664 | 2.25 | 0% | 7.24 | 568 | 2.00 | 0% | 6.82 | 314 | 2.82 | 16% | 3.10 | 272 | 2.13 | 20% | 2.92 | 245 | 1.64 | 24% | 1.93 | |
| Region I | 655 | 1.90 | 15% | 7.20 | 596 | 1.76 | 10% | 6.94 | 517 | 1.73 | 0% | 6.60 | 275 | 1.97 | 15% | 2.94 | 243 | 1.66 | 18% | 2.80 | 219 | 1.44 | 20% | 1.91 | |
| Region J | 709 | 2.00 | 20% | 7.43 | 610 | 1.94 | 0% | 7.00 | 522 | 1.69 | 3% | 4.35 | 286 | 2.06 | 19% | 2.99 | 244 | 1.86 | 19% | 2.80 | 213 | 1.45 | 21% | 1.72 | |
| Region K | 876 | 2.76 | 23% | 8.16 | 818 | 2.93 | 0% | 7.91 | 730 | 2.77 | 0% | 7.52 | 324 | 2.87 | 22% | 3.15 | 290 | 2.58 | 24% | 3.00 | 265 | 2.43 | 24% | 1.95 | |
References
- Blaga, R.; Sabadus, A.; Stefu, N.; Dughir, C.; Paulescu, M.; Badescu, V. A current perspective on the accuracy of incoming solar energy forecasting. Prog. Energy Combust. Sci. 2019, 70, 119–144. [Google Scholar] [CrossRef]
- Yang, D.; Kleissl, J.; Gueymard, C.A.; Pedro, H.T.; Coimbra, C.F. History and trends in solar irradiance and PV power forecasting: A preliminary assessment and review using text mining. Sol. Energy 2018, 168, 60–101. [Google Scholar] [CrossRef]
- Wang, P.; van Westrhenen, R.; Meirink, J.F.; van der Veen, S.; Knap, W. Knap Surface solar radiation forecasts by advecting cloud physical properties derived from Meteosat Second Generation observations. Sol. Energy 2019, 177, 47–58. [Google Scholar] [CrossRef]
- Van der Meer, D.; Yang, D.; Widén, J.; Munkhammar, J. Clear-sky index space-time trajectories from probabilistic solar forecasts: Comparing promising copulas featured. J. Renew. Sustain. Energy 2020, 12, 026102. [Google Scholar] [CrossRef]
- Remund, J.; Klauser, D.; Müller, S. Shortest Term Solar Energy Forecast. In Renewable Energy in the Service of Mankind Vol II; Sayigh, A., Ed.; Springer: Cham, Switzerland, 2016. [Google Scholar]
- Zhang, X.; Li, Y.; Lu, S.; Hamann, H.F.; Hodge, B.M.; Lehman, B. A Solar Time Based Analog Ensemble Method for Regional Solar Power Forecasting. IEEE Trans. Sustain. Energy 2019, 10, 268–279. [Google Scholar] [CrossRef]
- Perveen, G.; Rizwan, M.; Goel, N. An ANFIS? Based model for solar energy forecasting and its smart grid application. Eng. Rep. 2019, 1, e12070. [Google Scholar] [CrossRef]
- Yang, D. Reconciling solar forecasts: Probabilistic forecast reconciliation in a nonparametric framework. Sol. Energy 2020, in press. [Google Scholar] [CrossRef]
- Panamtash, H.; Zhou, Q.; Hong, T.; Qu, Z.; Davis, K.O. A copula-based Bayesian method for probabilistic solar power forecasting. Sol. Energy 2020, 196, 336–345. [Google Scholar] [CrossRef]
- Lauret, P.; David, M.; Pinson, P. Verification of solar irradiance probabilistic forecasts. Sol. Energy 2019, 94, 254–271. [Google Scholar] [CrossRef]
- Bakker, K.; Whan, K.; Knap, W.; Schmeits, M. Schmeits Comparison of statistical post-processing methods for probabilistic NWP forecasts of solar radiation. Sol. Energy 2019, 191, 138–150. [Google Scholar] [CrossRef]
- von Loeper, F.; Schaumann, P.; de Langlard, M.; Hess, R.; Bäsmann, R.; Schmidt, V. Probabilistic prediction of solar power supply to distribution networks, using forecasts of global horizontal irradiation. Sol. Energy 2020, 203, 145–156. [Google Scholar] [CrossRef]
- Verbois, H.; Rusydi, A.; Thiery, A. Probabilistic forecasting of day-ahead solar irradiance using quantile gradient boosting. Sol. Energy 2018, 173, 313–327. [Google Scholar] [CrossRef]
- Badosa, J.; Gobet, E.; Grangereau, M.; Kim, D. Day-Ahead Probabilistic Forecast of Solar Irradiance: A Stochastic Differential Equation Approach. In Renewable Energy: Forecasting and Risk Management; Springer: Cham, Switzerland, 2017. [Google Scholar]
- Antonanzas, J.; Perpinan-Lamigueiro, O.; Urraca, R.; Antonanzas-Torres, F. Influence of electricity market structures on deterministic solar forecasting verification. Sol. Energy 2020, in press. [Google Scholar] [CrossRef]
- Perez, R.; Perez, M.; Pierro, M.; Schlemmer, J.; Kivalov, S.; Dise, J.; Keelin, M.; Grammatico, A.; Swierc, J.; Foster, A.; et al. Operationally Perfect Solar Power Forecasts: A Scalable Strategy to Lowest-Cost Firm Solar Power Generation. In Proceedings of the 46th IEEE PV Specialists Conference (Oral), Chicago, IL, USA, 16–20 June 2019. [Google Scholar]
- Perez, R.; Perez, M.; Pierro, J.; Schlemmer, J.; Kivalov, S.; Dise, J.; Keelin, M.; Grammatico, A.; Swierc, J.; Foster, A.; et al. Perfect Operational Solar Forecasts—A Scalable Strategy toward Firm Power Generation; International Energy Agency Solar World Congress: Santiago, Chile, 2019. [Google Scholar]
- Yang, D. A guideline to solar forecasting research practice: Reproducible, operational, probabilistic or physically-based, ensemble, and skill (ROPES). J. Renew. Sustain. Energy 2019, 11, 022701. [Google Scholar] [CrossRef]
- Yang, D.; Alessandrini, S.; Antonanzas, J.; Antonanzas-Torres, F.; Badescu, V.; Beyer, H.G.; Blaga, R.; Boland, J.; Bright, J.M.; Coimbra, C.F.M.; et al. Verification of deterministic solar forecasts. Sol. Energy 2020, in press. [Google Scholar] [CrossRef]
- Huertas, J.; Centeno Brito, M. Using Smart Persistence and Random Forests to Predict Photovoltaic Energy Production. Energies 2019, 12, 100. [Google Scholar] [CrossRef]
- Hansen, C.W.; Holmgren, W.F.; Tuohy, A.; Sharp, J.; Lorenzo, A.T.; Boeman, L.J.; Golnas, A. The Solar Forecast Arbiter: An Open Source Evaluation Framework for Solar Forecasting. In Proceedings of the 2019 IEEE 46th Photovoltaic Specialists Conference (PVSC), Chicago, IL, USA, 16–21 June 2019; pp. 2452–2457. [Google Scholar] [CrossRef]
- International Energy Agency PVPS. Task 16—Solar Resource for High Penetration and Large Scale Applications. In Activity 3.5: Firm Power Generation; IEA PVPS: Paris, France, 2019. [Google Scholar]
- Perez, M.; Perez, R.; Rábago, K.R.; Putnam, M. Overbuilding & curtailment: The cost-effective enablers of firm PV generation. Sol. Energy 2019, 180, 412–422. [Google Scholar]
- Perez, M.; Perez, R.; Rabago, K.; Putnam, M. Achieving 100% Renewables: Supply-Shaping through Curtailment. PVTECH Power 2019, 19, 56–61. Available online: www.pv-tech.org (accessed on 15 March 2019).
- Perez, M. Report: MISO-Wide Solar Potential Analysis—How Do We Achieve 100% Renewables across the MISO Region while not Breaking the Bank? Available online: http://mnsolarpathways.org/miso-spa/ (accessed on 15 April 2020).
- Pierro, M.; Perez, R.; Perez, M.; Moser, D.; Cornaro, C. Italian protocol for massive solar integration: Imbalance mitigation strategies. Renew. Energy J. 2020, 153, 725–739. [Google Scholar] [CrossRef]
- Pierro, M.; Perez, R.; Perez, M.; Moser, D.; Cornaro, C. Italian Protocol for Massive Solar Integration (part 2): From Solar Imbalance Mitigation to 24/365 Solar Power Generation. Renew. Energy 2019. (under peer review). [Google Scholar]
- Perez, R.; Schlemmer, J.; Kivalov, S.; Dise, J.; Keelin, P.; Grammatico, M.; Hoff, T.; Tuhoy, A. A New Version of the SUNY Solar Forecast Model: A Scalable Approach to Site-Specific Model Training. In Proceedings of the IEEE PV Specialists Conference (invited) WCPEC-7, Waikoloa, HI, USA, 10–15 June 2018. [Google Scholar]
- SolarAnywhere URL. Available online: https://www.solaranywhere.com (accessed on 15 April 2020).
- ECMWF. European Centre for Medium-Range Weather Forecasts; ECMWF: Reading, UK, 2019. [Google Scholar]
- GFS. Global Forecast Syste—NOAA; National Oceanic and Atmospheric Administration: Washington, DC, USA, 2019. Available online: https://www.ncdc.noaa.gov/data-access/model-data/model-datasets/global-forcast-system-gfs (accessed on 15 April 2020).
- HRRR. High-Resolution Rapid Refresh—NOAA; National Oceanic and Atmospheric Administration: Washington, DC, USA, 2019. Available online: https://rapidrefresh.noaa.gov/hrrr/ (accessed on 15 February 2020).
- NDFD. National Digital Forecast Database—NOAA; National Oceanic and Atmospheric Administration: Washington, DC, USA, 2019. Available online: https://www.weather.gov/mdl/ndfd_home (accessed on 15 April 2020).
- SolarAnywhere Historical Data IEEE Paper with Latest Model. Available online: https://www.solaranywhere.com/validation/leadership-bankability/data-validation/ (accessed on 15 April 2020).
- Perez, R.; Schlemmer, J.; Hemker, K.; Kivalov, S.; Kankiewicz, A.; Dise, J. Solar Energy Forecast Validation for Extended Areas & Economic Impact of Forecast Accuracy. In Proceedings of the 43th IEEE PV Specialists Conference, Portland, OR, USA, 5–10 June 2016. [Google Scholar]
- Yang, D.; Perez, R. Can we gauge forecasts using satellite-derived solar irradiance. J. Renew. Sustain. Energy 2019, 11, 023704. [Google Scholar] [CrossRef]
- NREL (National Renewable Energy Laboratory). 2019 Annual Technology Baseline; National Renewable Energy Laboratory: Golden, CO, USA, 2019.
- Smart Persistence definition from IEA 2015. In International Energy Agency, Solar Heating & Cooling Program, Task 46, Subtask C-1: Short-term solar forecasting; IEA PVPS: Paris, France, 2015.
- The NYISO Website Is Temporarily Unavailable. Available online: https://www.nyiso.com/documents/20142/2223763/2018-State-of-the-Market-Report.pdf (accessed on 15 April 2020).
- New York State Offshore Wind Master Plan. Available online: File:///Users/rperez/Downloads/Offshore-Wind-Master-Plan.pdf (accessed on 15 April 2019).
- The Future Is Forming. Available online: https://formenergy.com/ (accessed on 15 April 2020).
- Perez, R.; David, M.; Hoff, T.E.; Jamaly, M.; Kivalov, S.; Kleissl, J.; Jamaly, M.; Lauret, P.; Perez, M. Spatial and Temporal Variability of Solar Energy. Found. Trends Renew. Energy 2016, 1, 1–44. [Google Scholar] [CrossRef]


© 2020 by the authors. Licensee MDPI, Basel, Switzerland. This article is an open access article distributed under the terms and conditions of the Creative Commons Attribution (CC BY) license (http://creativecommons.org/licenses/by/4.0/).