Article

Study on the Effects of Microstructural Surfaces on the Attachment of Moving Microbes

1
Department of Power Engineering, North China Electric Power University, Baoding 071003, China
2
College of Horticulture, Hebei Agricultural University, Baoding 071000, China
3
College of Life Sciences, Hebei Agricultural University, Baoding 071001, China
*
Author to whom correspondence should be addressed.
Energies 2020, 13(17), 4421; https://doi.org/10.3390/en13174421
Submission received: 13 July 2020 / Revised: 13 August 2020 / Accepted: 20 August 2020 / Published: 27 August 2020

Abstract

:
The research of marine antifouling is mainly conducted from the aspects of chemistry, physics, and biology. In the present work, the movement model of microorganisms along or against the flow direction on the microstructural surface was established. The model of globose algae with a diameter of 5 μm in the near-wall area was simulated by computational fluid dynamics (CFD), and the fluid kinematic characteristics and shear stress distribution over different-sized microstructures and in micropits were compared. Simulation results revealed that the increase of the β value (height to width ratio) was prone to cause vortexes in micropits. In addition, the closer the low-velocity region of the vortex center to the microstructural surface, the more easily the upper fluid of the microstructure slipped in the vortex flow and reduced the microbial attachment. Moreover, the shear stress in the micropit with a height and width of 2 μm was significantly higher than those in others; thus, microbes in this micropit easily fell off.

1. Introduction

Antifouling technology is beneficial for energy, marine, and other industries. The maintenance of power plant equipment, the development and utilization of new energies [1,2], and ship protection [3,4] are the main fields of antifouling research. Biofouling generally occurs on the surface of offshore power plant equipment, especially cooling system pipelines, and with a deep attachment, it causes energy loss and pipeline blockage. In the first stage of biofouling, seawater covers the surface of an object by forming a conditional membrane in one minute to one hour [5]. In the second stage, bacteria and other microorganisms approach, contact, and settle on the surface, and this process is reversible. Based on the formation process, the antifouling ability of the microstructural surface prevents these microorganisms from approaching and contacting the surface and promotes desorption to reduce the attachment [6]. Microstructure surface antifouling technology is beneficial for environmental protection.
In recent years, scholars around the world have conducted relevant research on microstructural antifouling. Brennan et al. [6] and Carman et al. [7] designed cylindrical and ridge-shaped sharklet adhesively backed film bionic surfaces by imitating the microstructure of sharkskin and found that these microstructures could reduce the adhesive rate of algae, barnacle, and other fouling organisms by about 85%. Schumacher et al. [8] proposed the concept of engineering roughness index (ERI) for the first time and studied four types of microstructural surfaces with 2-mm spacing and 3-mm height. Patterns designed included geometric features of 2-mm-wide ribs of various lengths (4, 8, 12, and 16 mm), 2-mm-diameter circular pillars, 2-mm-wide continuous ridges, and 10-mm equilateral triangles. The scanning electron micrographs of these microstructural surfaces are shown in Figure 1. The four types of surfaces have different roughness and microstructures, and that made Ulva spores that represented different settlement preferences. According to the concept of ERI, larger ERI values indicate more reduction of settlement. These surfaces were found to correspondingly reduce spore settlement by 77%, 58%, 36%, and 31%, respectively. Decker et al. [9] conducted experiments with Ulva spores and noticed that the microstructure under 5 μm could effectively inhibit spore attachment.
Bai et al. [10,11] studied the shell surface of Dosinia, which is common shellfish in the sea. They designed a ribbed shell surface with six types of cylindrical protrusions of different sizes and spacings on top of it. Experimental results revealed this surface exhibited antifouling effects and drag reduction. Among them, microstructures with 4-µm spacing reduced the adhesion by 53%, and that of 7-μm spacing was 63%, better than the other surfaces [12].
Wang et al. [13] and Zheng et al. [14] studied the surfaces of mussels and starfish and found that numerous protrusions with 10–25-μm diameter existed on the surface of common mussels, whereas the surfaces of Dosinia and Perna viridis had a grooved structure. Zheng et al. imitated the surface of starfish and designed a regular hexagon composed of 19 cylindrical protrusions with a diameter of 2.5 μm, as depicted in Figure 2. Experimental results revealed that when exposed to flow water, within a short time the patterned surface presented higher removal percentage of diatoms (59%) than the smooth one (36%), indicating that the former had a better antifouling performance than the latter.
Halder et al. [15] prepared evenly arranged circular micropores with a diameter of 10 μm on the surface of polydimethylsiloxane and tested the attachment characteristics of coli bacillus on the surface under static and flowing conditions. Microporous surfaces with a 2-µm spacing and a 10-µm diameter were found to significantly reduce the attachment of coli basillus. The surface roughness and wettability of bioactive glass can be increased by the femtosecond laser treatment [16].
Vucko et al. [17] constructed 18 morphologies with different size, ranging from 0.2 μm to 1000 μm on polydimethylsiloxane. The experimental results showed that the samples with 20–80 μm had higher adhesion rate (48–75%), and microorganisms tended to adhere to structures larger than their own size.
Computational fluid dynamics (CFD) was previously used to study the properties of surface materials with different shapes. Wonet et al. [18] conducted numerical simulations on different-sized prismatic stripe patterns and compared the deposition of particles on these structures under different Reynolds numbers (Re). Jung et al. [19] simulated the deposition of colloidal particles (of radius a) on a ridge-shaped membrane surface (of thickness h). With an increase of Re and a/h, an “inaccessible area” for suspended particles was formed near the surface of the microstructure membrane, thus reducing the deposition of particles. Fawzan et al. [20] compared the antifouling performance of hierarchical and non-hierarchical topographies. Simulation results expressed that the range for wall shear of hierarchical topography is between 0.00281 Pa and 0.00452 Pa while non-hierarchical topography is between 0.00165 Pa and 0.00301 Pa. CFD was also applied to study the heat transfer characteristics of microstructures [21].
In the present study, CFD was applied to simulate the movement of microorganisms in the near-wall area. Moreover, fluid characteristics near the microstructure were analyzed, and the antifouling effects of different microstructures were evaluated. Vucko’s research showed that when the size of microorganism is smaller than the microstructure, it is easy to adhere [17]. Many researchers have studied the groove and convex surface with different sizes. At the initial stage of biofilm formation, a large number of bacteria and microorganisms were in the range of 0.25–10 μm. Therefore, 2–10 μm, rectangular micropits were selected for simulation to further improve the research content of antifouling on microstructure surface. The obtained results provided a suitable antifouling design of seawater cooling systems for power plants.

2. Research Method

In a microchannel, fluid flows parallel to the surface. Assuming that microorganisms can move freely in the direction parallel to the surface, the following two-dimensional simulation was used for the analysis. The microbial model was simplified as a sphere with a diameter of 5 μm [9], and it could move in different directions at a distance of 5 μm from the surface. The microstructure was composed of rectangular micropits with a height and width of h and s, respectively. Protrusions between micropits are called microridges. To eliminate the influences of inlet and outlet sections on the fluid state, smooth surfaces with a certain length were arranged at each section of the channel.

2.1. Governing Equations and Calculation Method

The microscale flow state was simulated in the present analysis, and the fluid region was continuous and in the same velocity field. Therefore, the governing equations for a continuous medium are still applicable. The density and viscosity of water were constant, and the steady laminar flow was determined without considering the influence of gravity. Hence, the governing equations for the analysis are as follows:
Continuity equation:
u x + v y = 0 .
Momentum equation:
ρ ( u u x + υ u y ) = p x + μ ( 2 u x 2 + 2 u y 2 ) ρ ( u υ x + υ υ y ) = p y + μ ( 2 υ x 2 + 2 υ y 2 )
x and y denote coordinate of X axis and Y axis; u and v denote the components of fluid velocity along the x direction and the y direction, respectively. The p, ρ and μ denote pressure, density, and dynamic viscosity of the fluid, respectively.
To ensure the accuracy of the calculation, the two-dimensional double precision solver of FLUENT software was employed. Simple coupling was used for velocity and pressure, and the second-order upwind scheme discretization was used to solve momentum equations. The time step of the unsteady model was 0.01 s. When the residuals of velocity and other parameters in each direction were less than 10−6, calculated results started to converge.

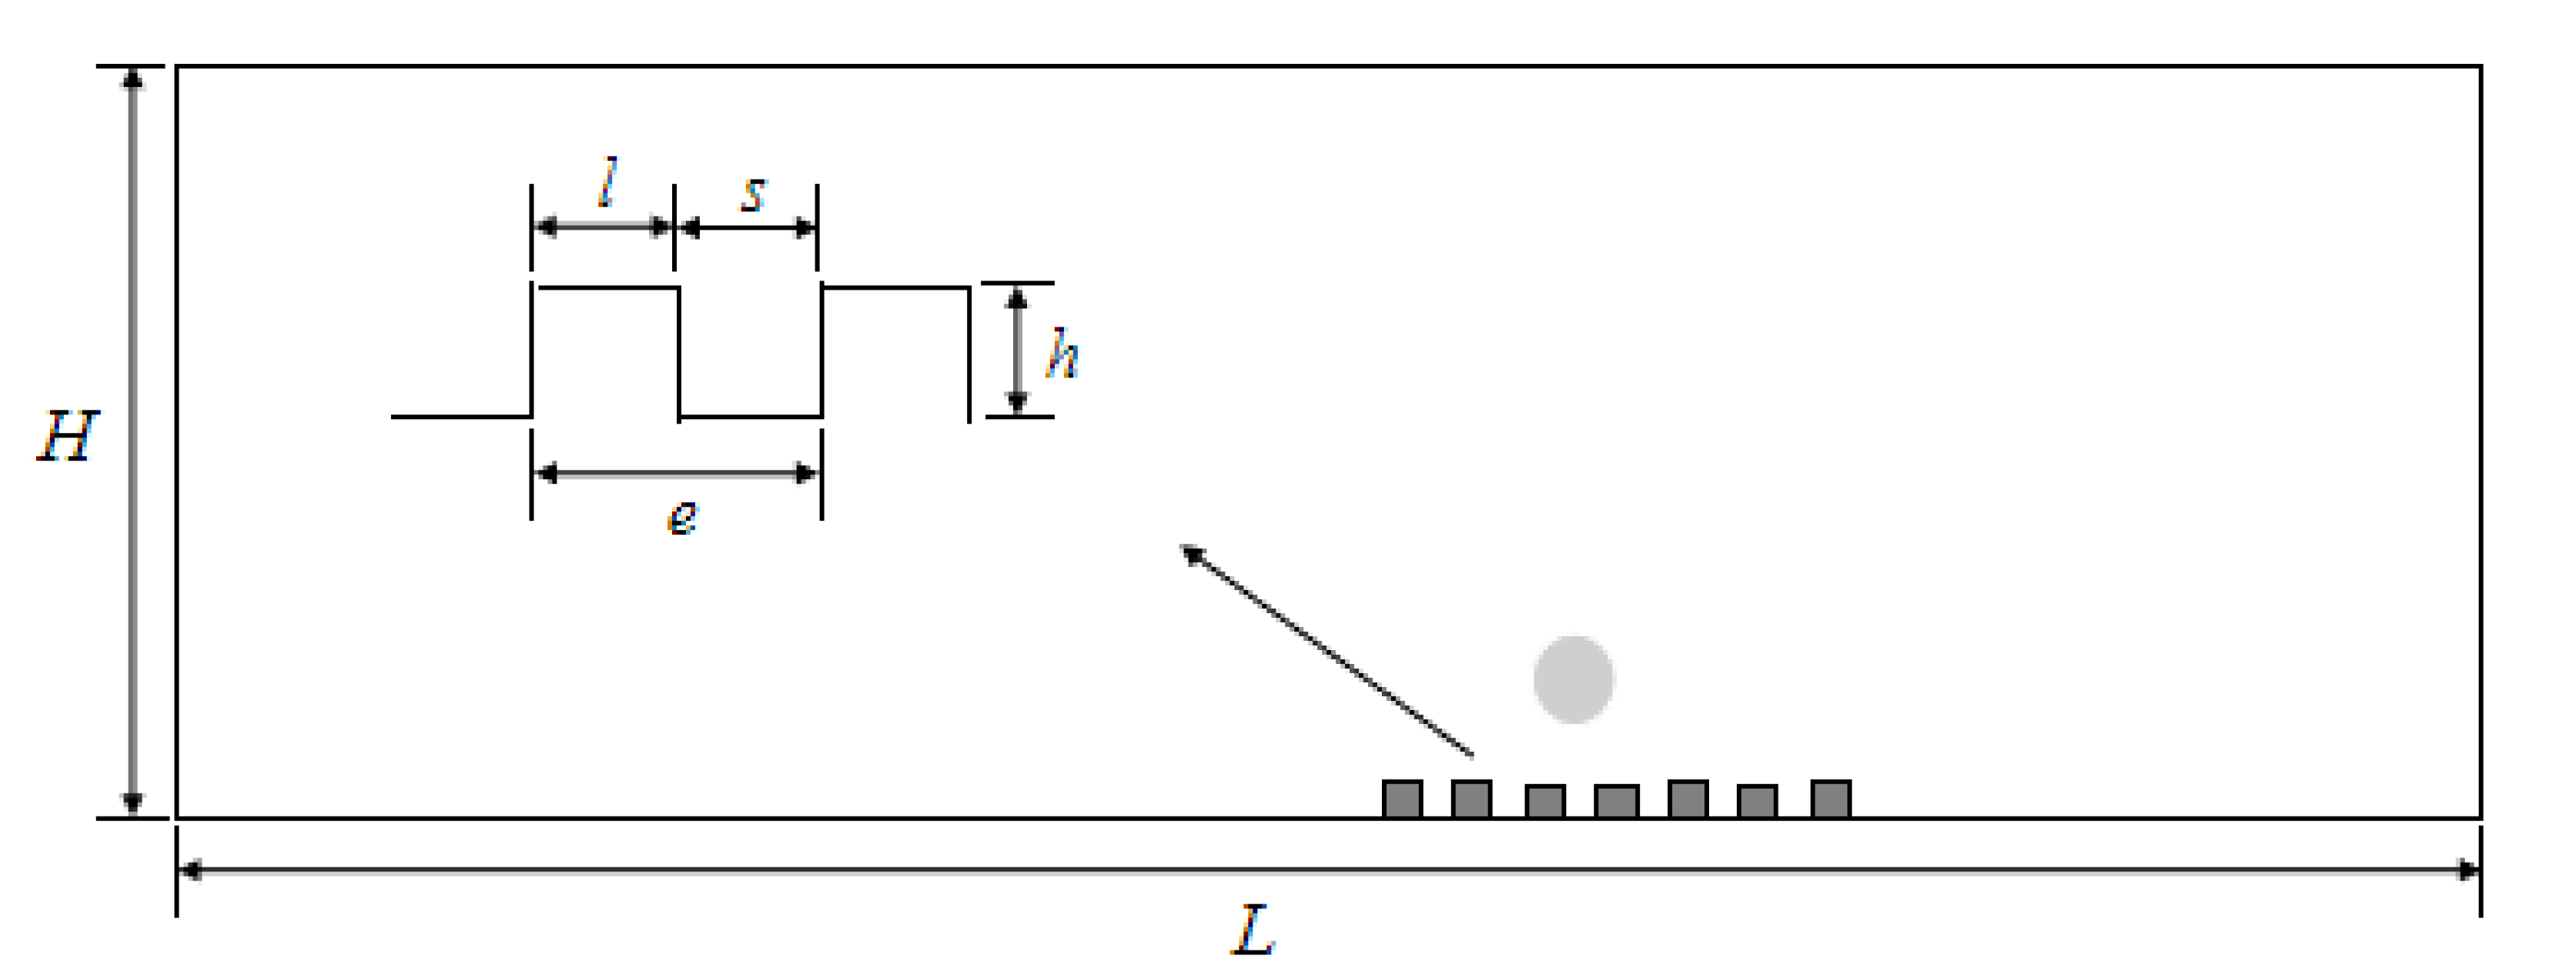
2.2. Model Parameters and Boundary Conditions

The microchannel consisted of rectangular blocks of 500-μm length (L), 300-μm height (H), as illustrated in Figure 3. There were 40 periodic units in the microchannel, and e represents the unit length. The s and h denote width and depth of the micropit, respectively. The l represents width of the microridge. The dc represents the height of the measurement position from the surface of the microstructure.
In the present analysis, the following dimensionless parameters were adopted: β is the height to width ratio of micropits (h/s), λe is a normalized parameter, and Π is the dimensionless pressure drop ratio and given by
= Δ p s Δ p Δ p s ,
where Δps and Δp are the inlet and outlet pressure drops in the as-designed channels, respectively.
The velocity gradient u can be expressed as
u = u i + 1 u i λ e .
The shear stress gradient τ can be expressed as
τ = τ i + 1 τ i λ e .
The inner surfaces of the channels were in no-slip condition for the wall–liquid boundary, and dynamic mesh was used to simulate the movement of microorganisms on the microstructural surface under a given inlet velocity. The average velocity of microorganisms is 3 × 10⁻⁵ m/s, as reported by Darnton [22]. The inlet flowed from left to right, and the outlet was under free-flow conditions. In the dynamic flow field, an inlet velocity of 0.002 m/s was evenly distributed in the calculation area, which was calculated according to the low-speed flow experiment designed by Halder [15]. Re was 0.436. The other boundaries were nonslip surfaces. In the present analysis, the effect of gravity was neglected.

2.3. Mesh Generation and Independence Test

Unstructured and structured meshes were used around microorganisms and microstructures, respectively. As microorganisms and microstructures were very small as compared to the entire channel, meshes were encrypted near microorganisms and microstructures. When the number of meshes was 390,000, 550,000, and 740,000, the pressure drops in the channel at different inlet velocities were calculated, and the corresponding results are presented in Figure 4. Considering the accuracy of numerical simulations and calculation time, the total grid number was considered as 550,000.

3. Effects of Microstructures on the Attachment of Moving Organisms

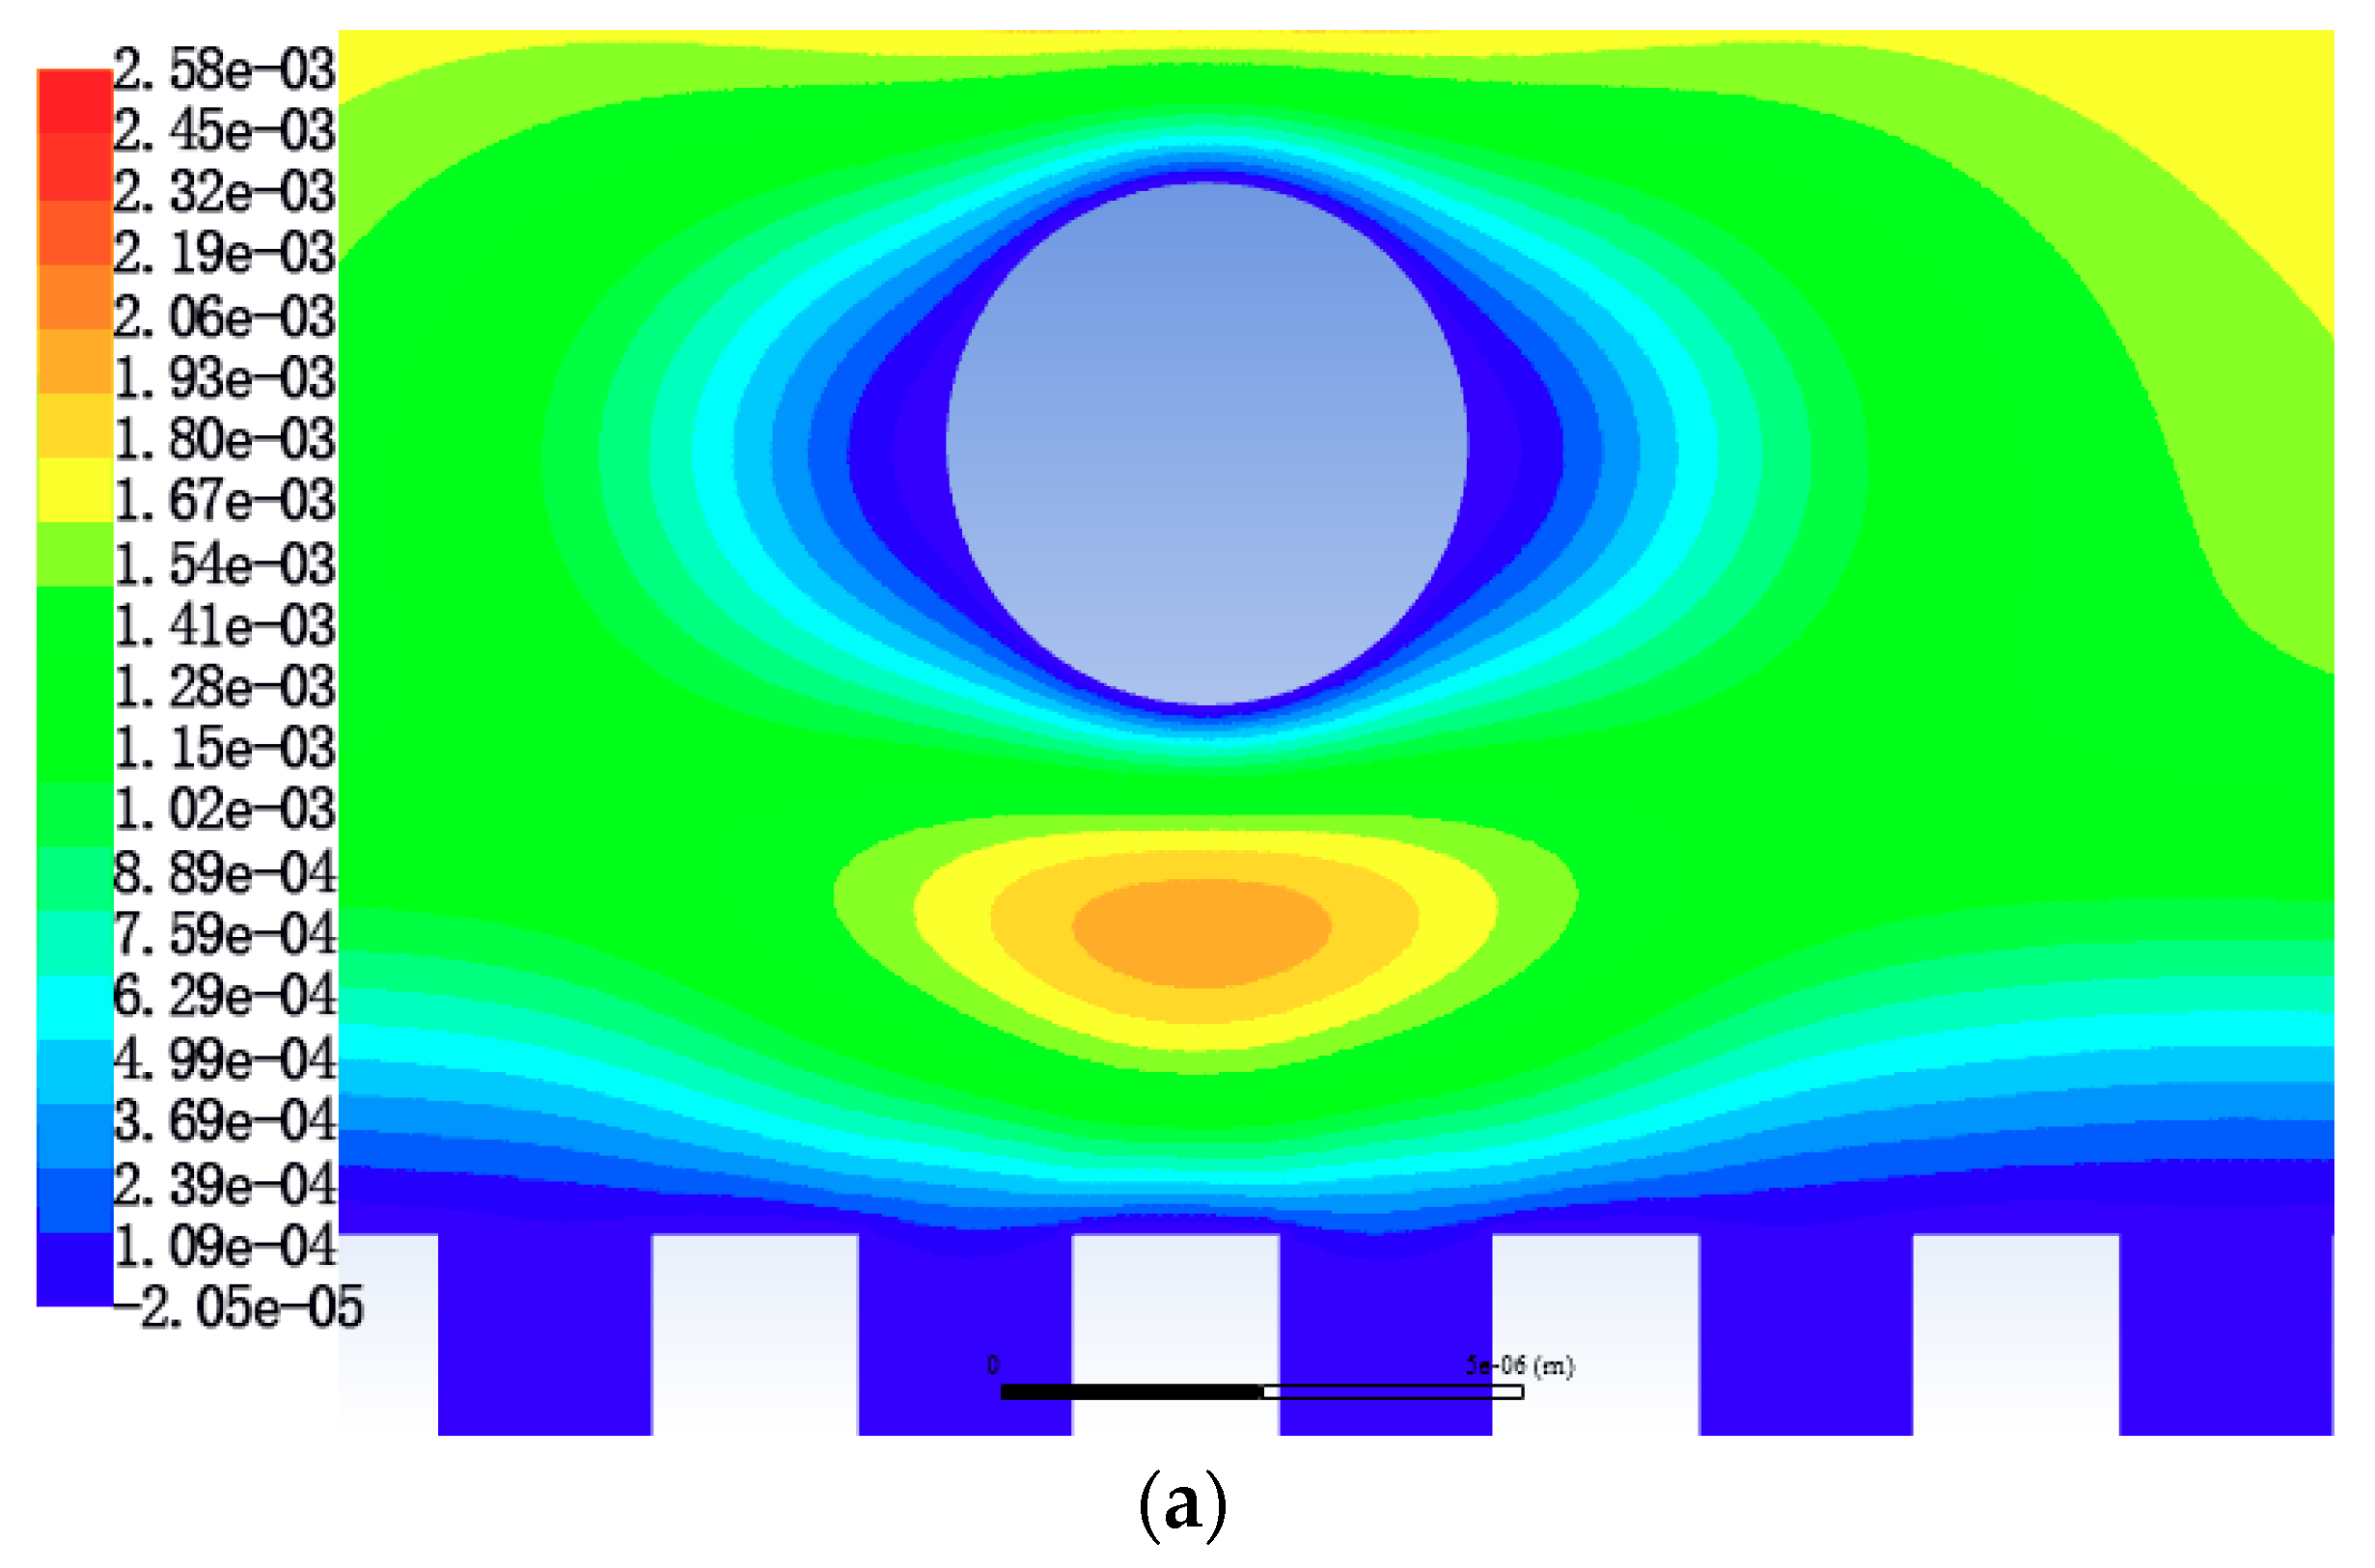
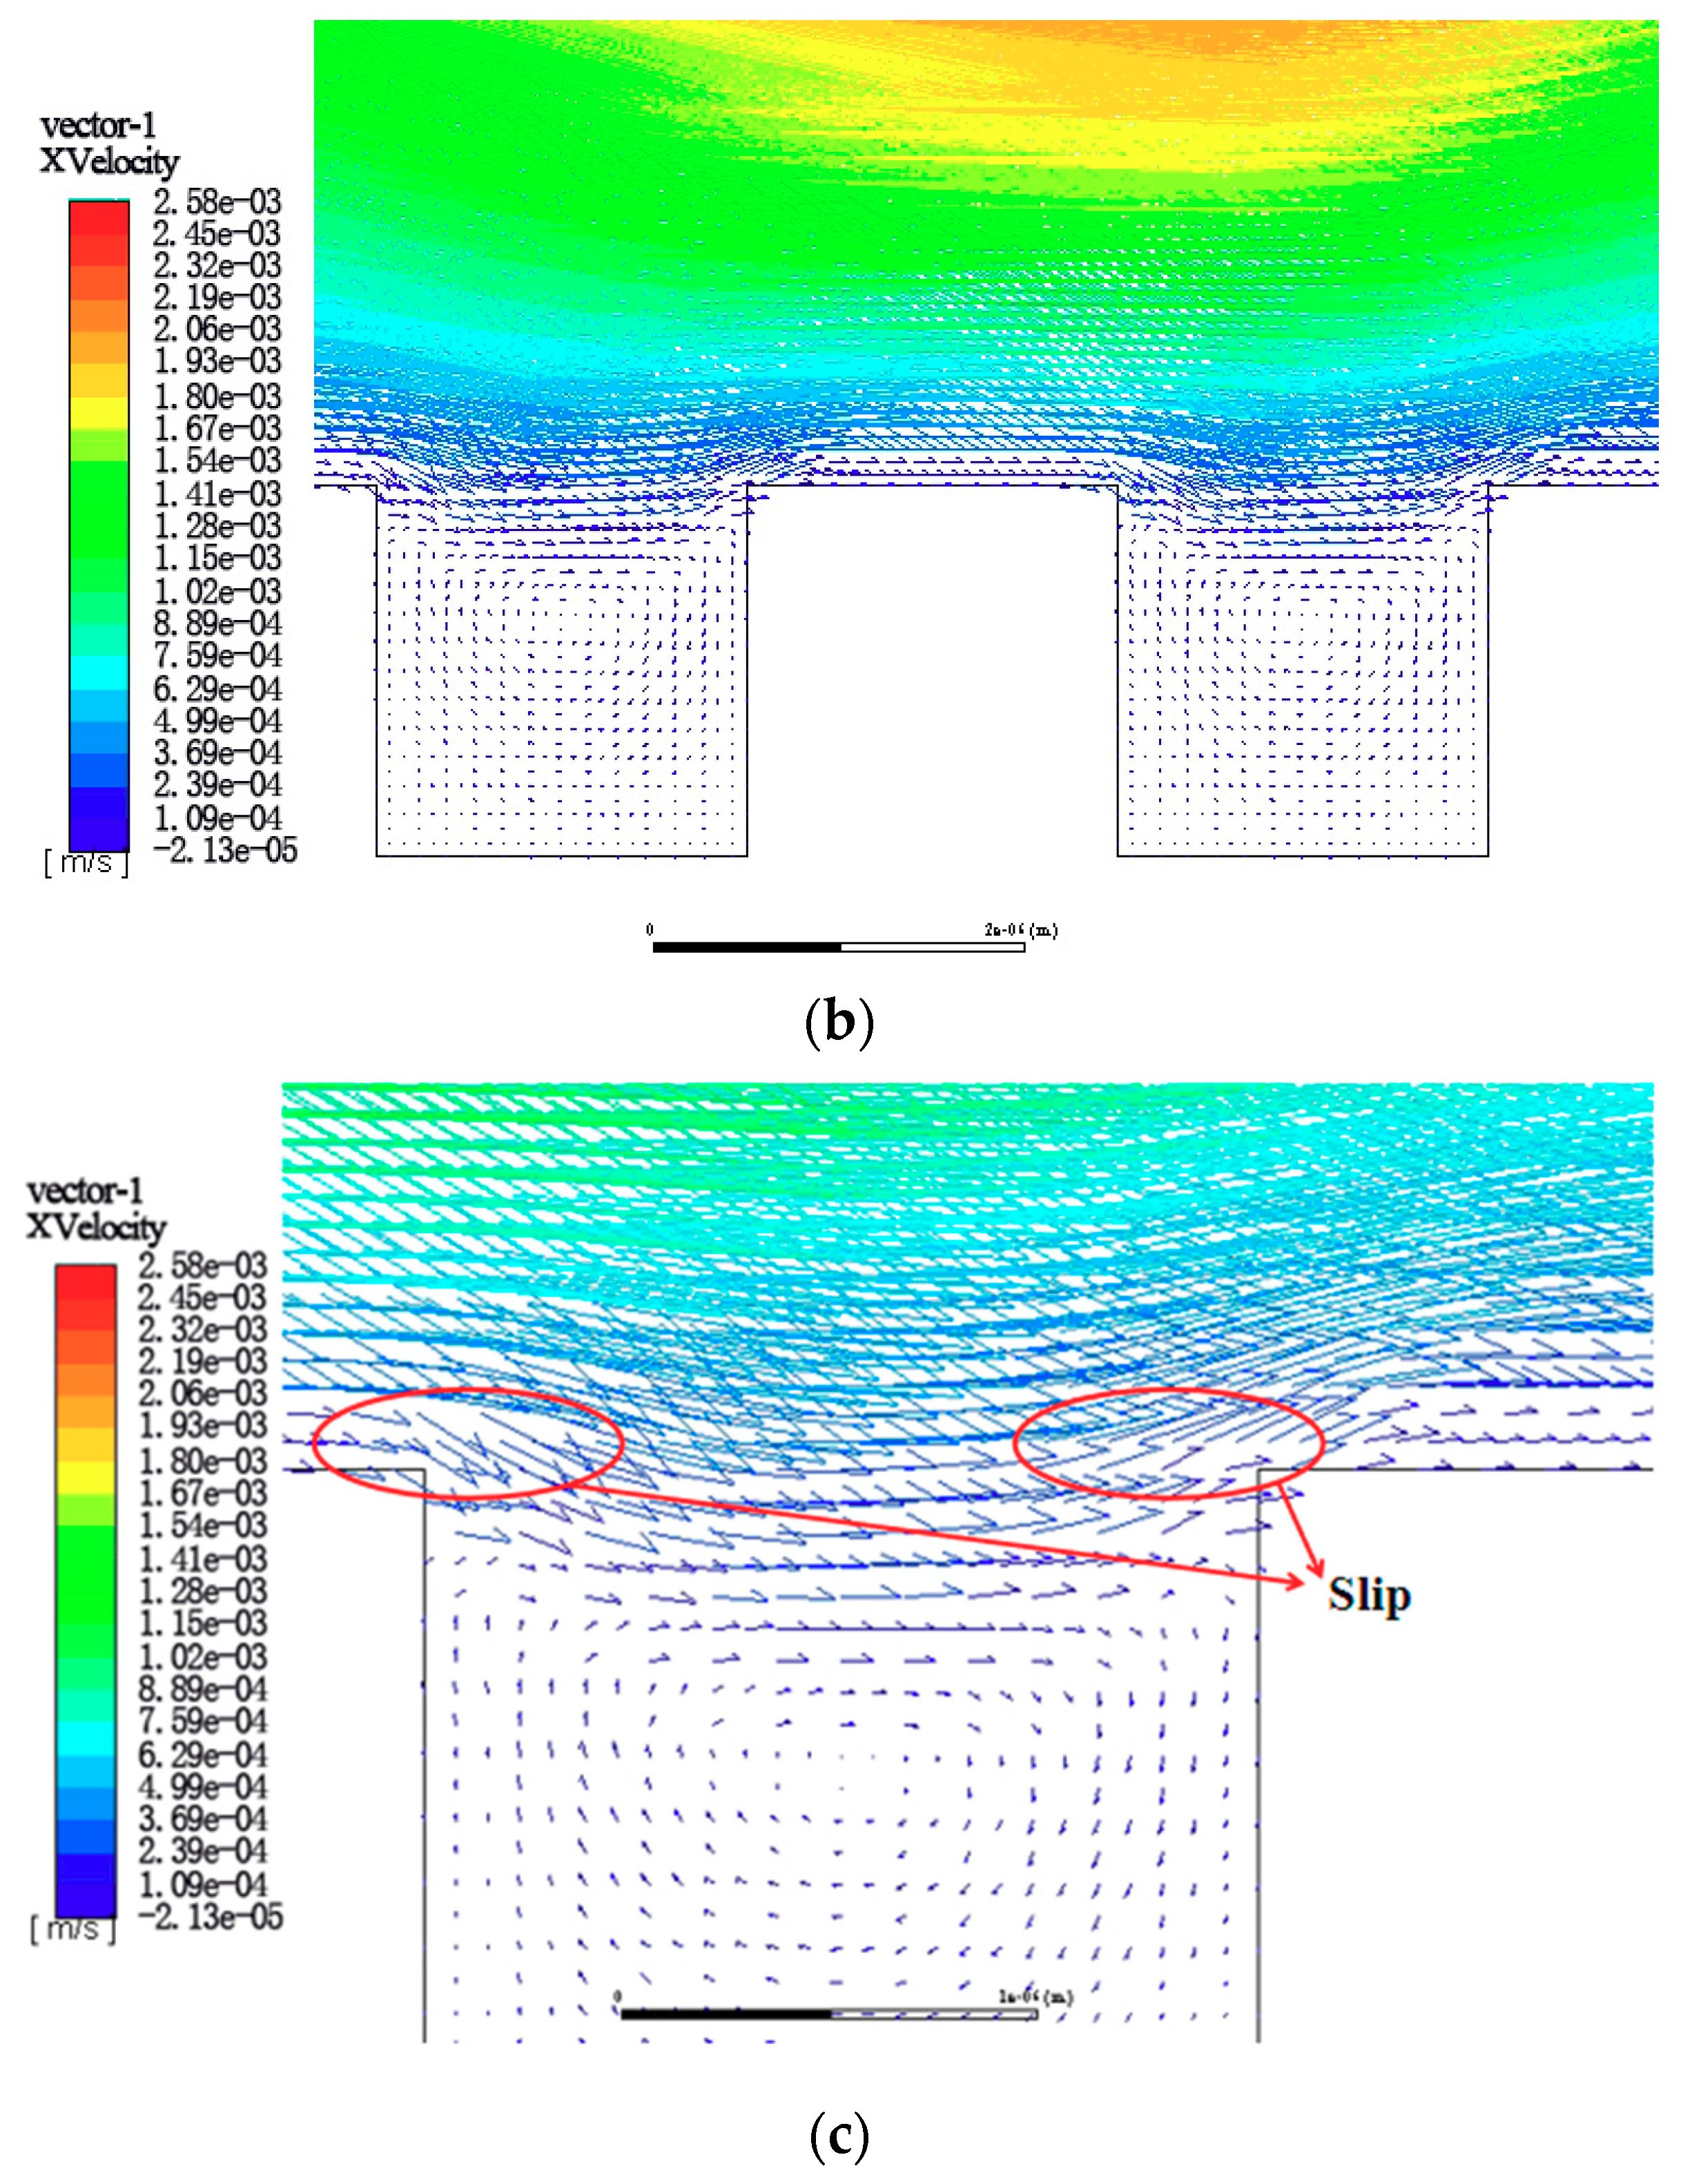
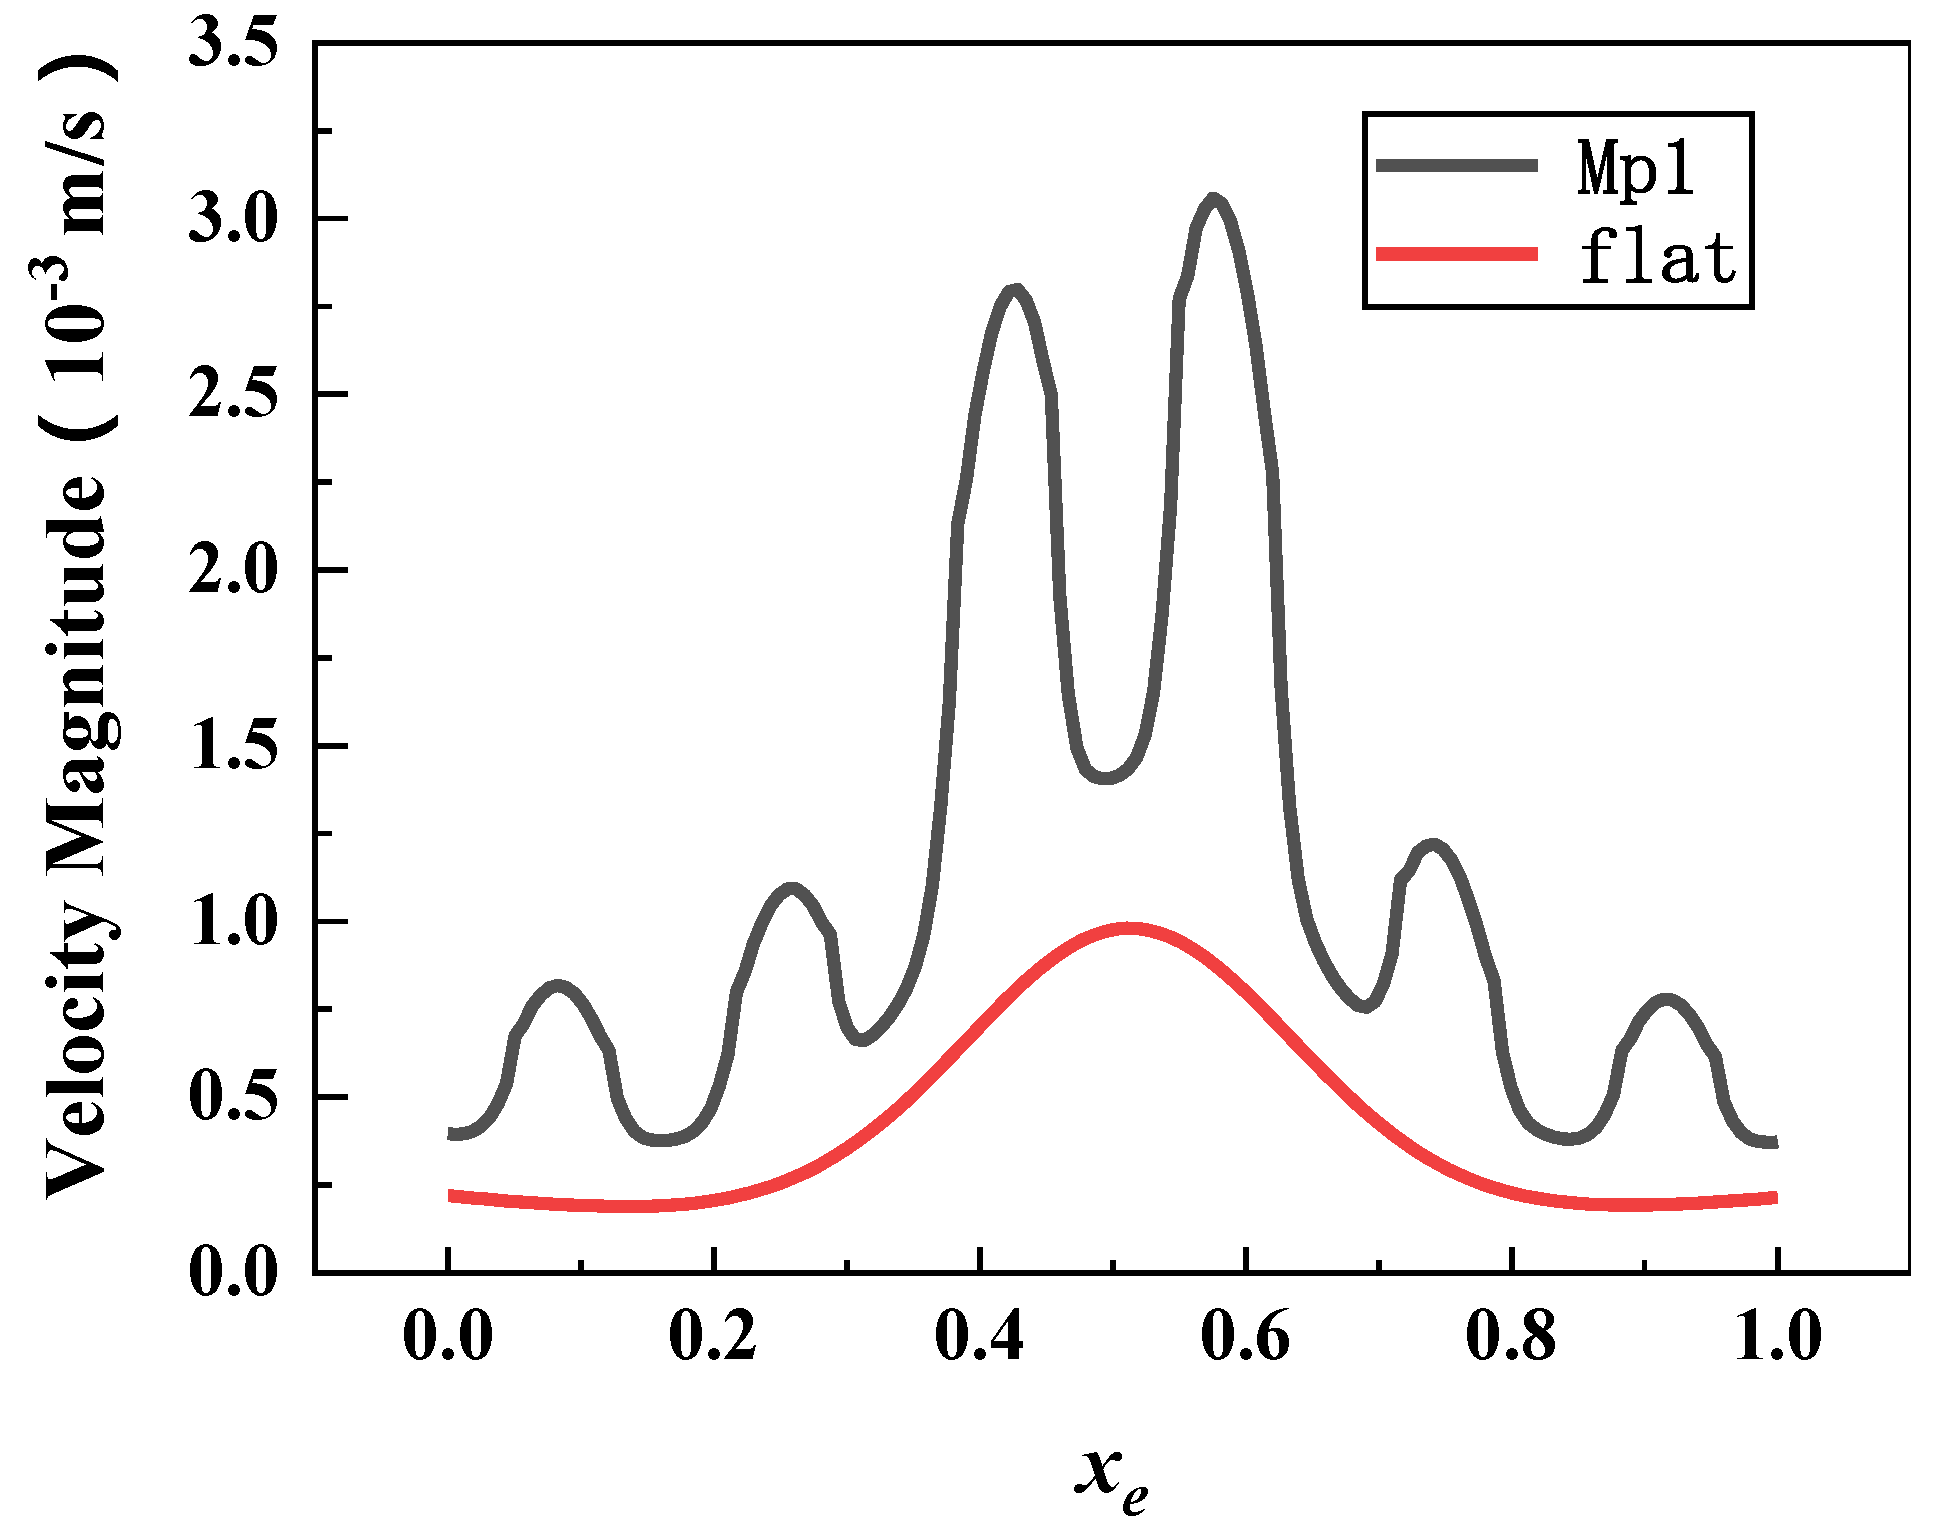
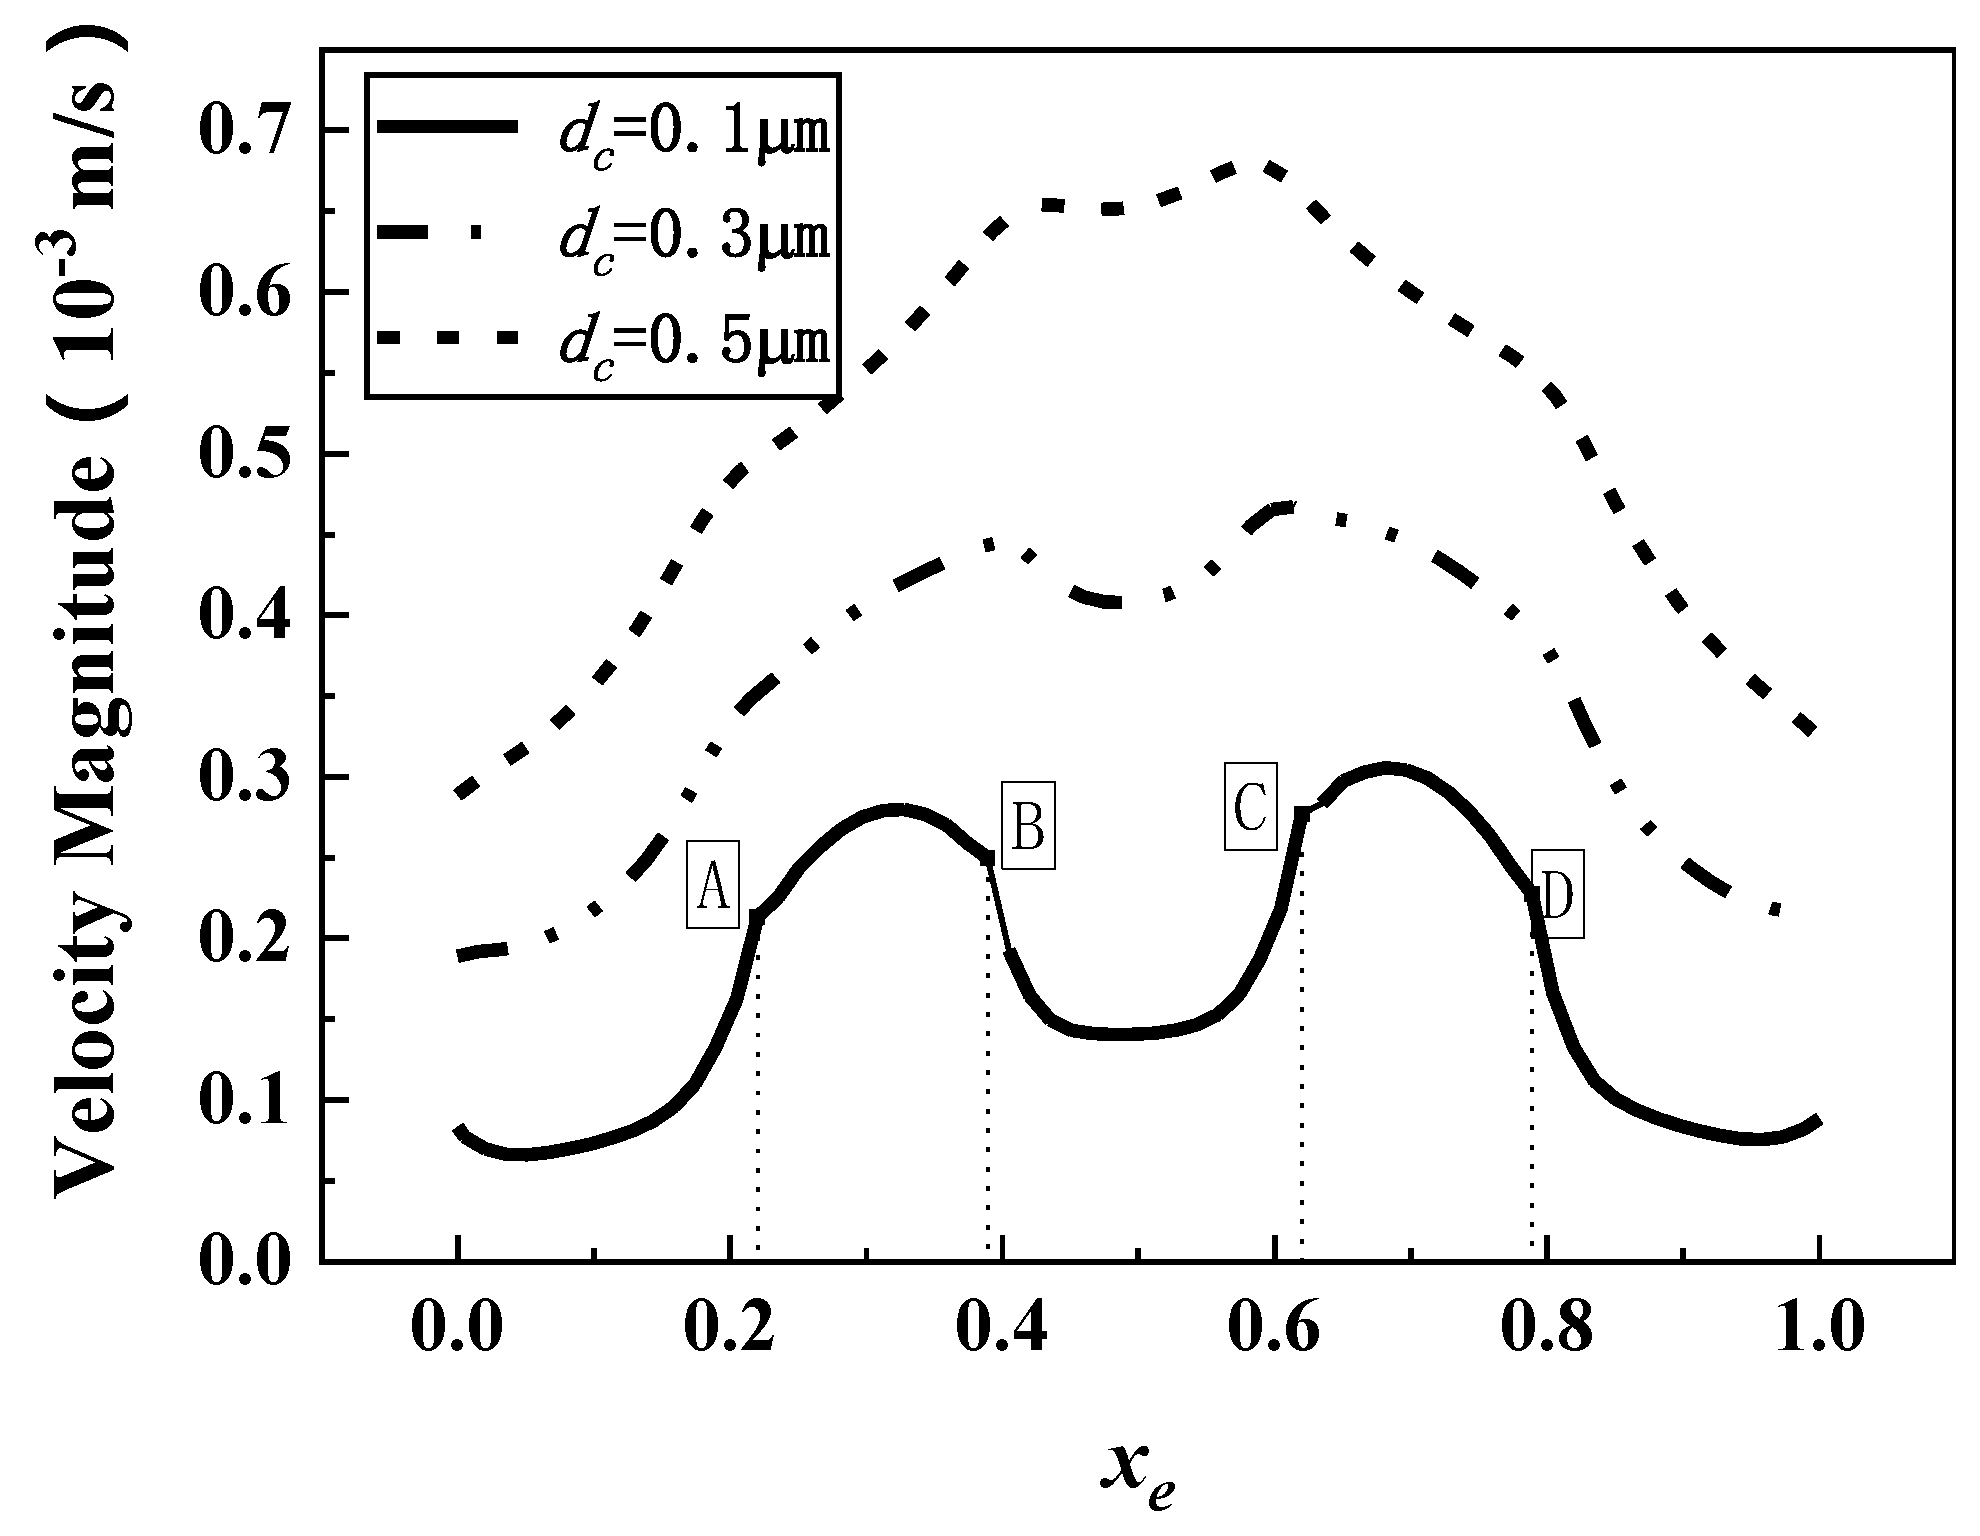
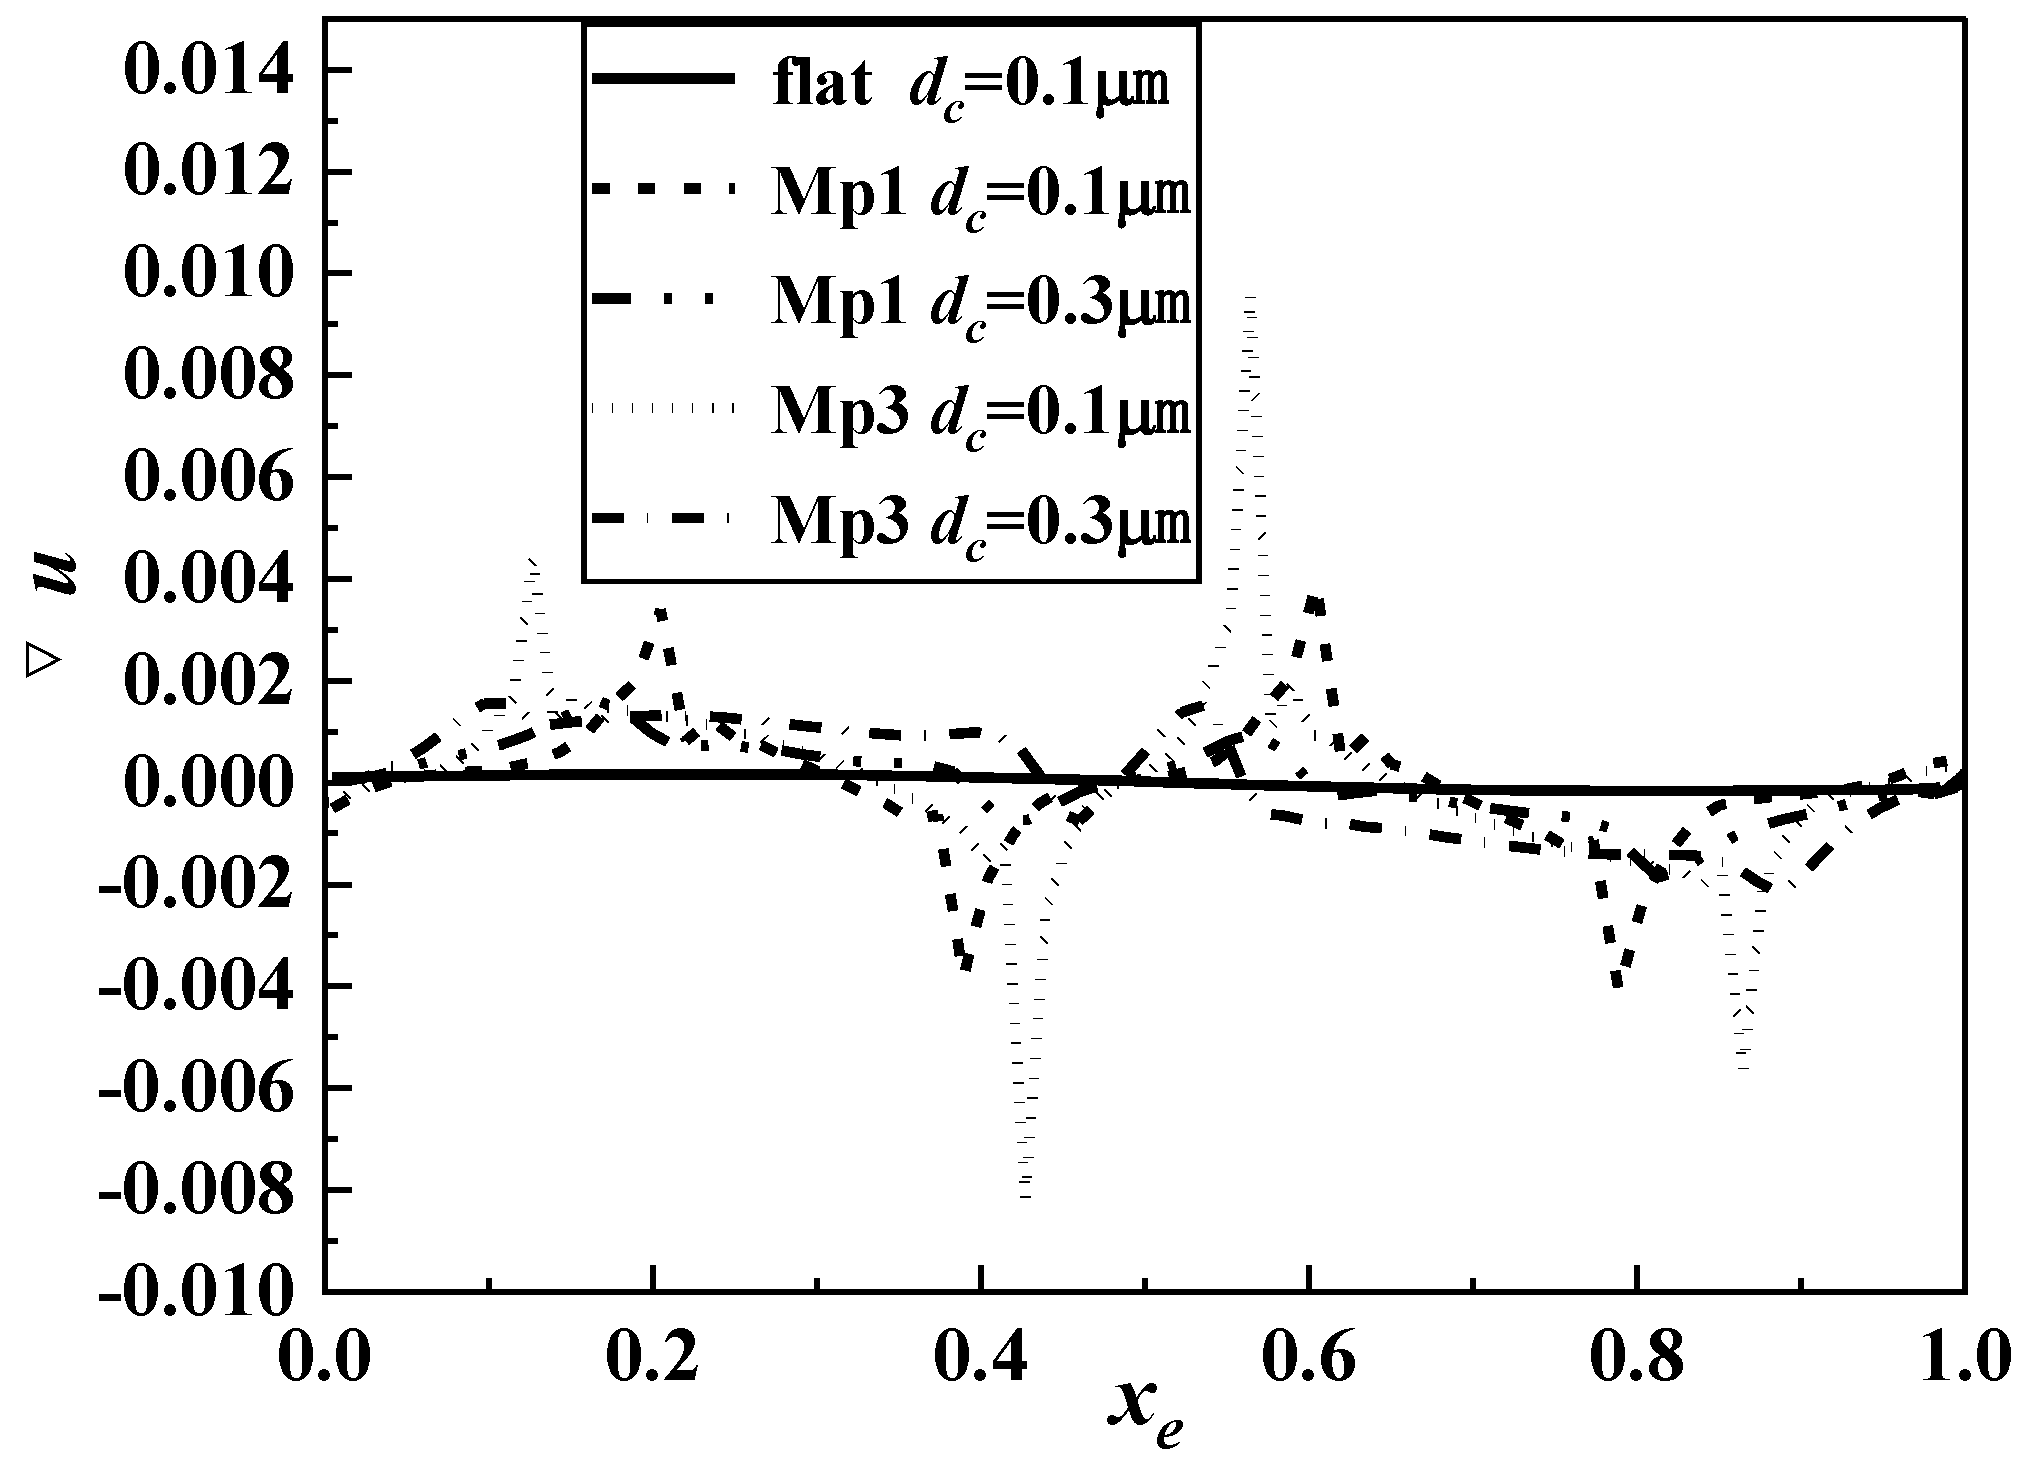
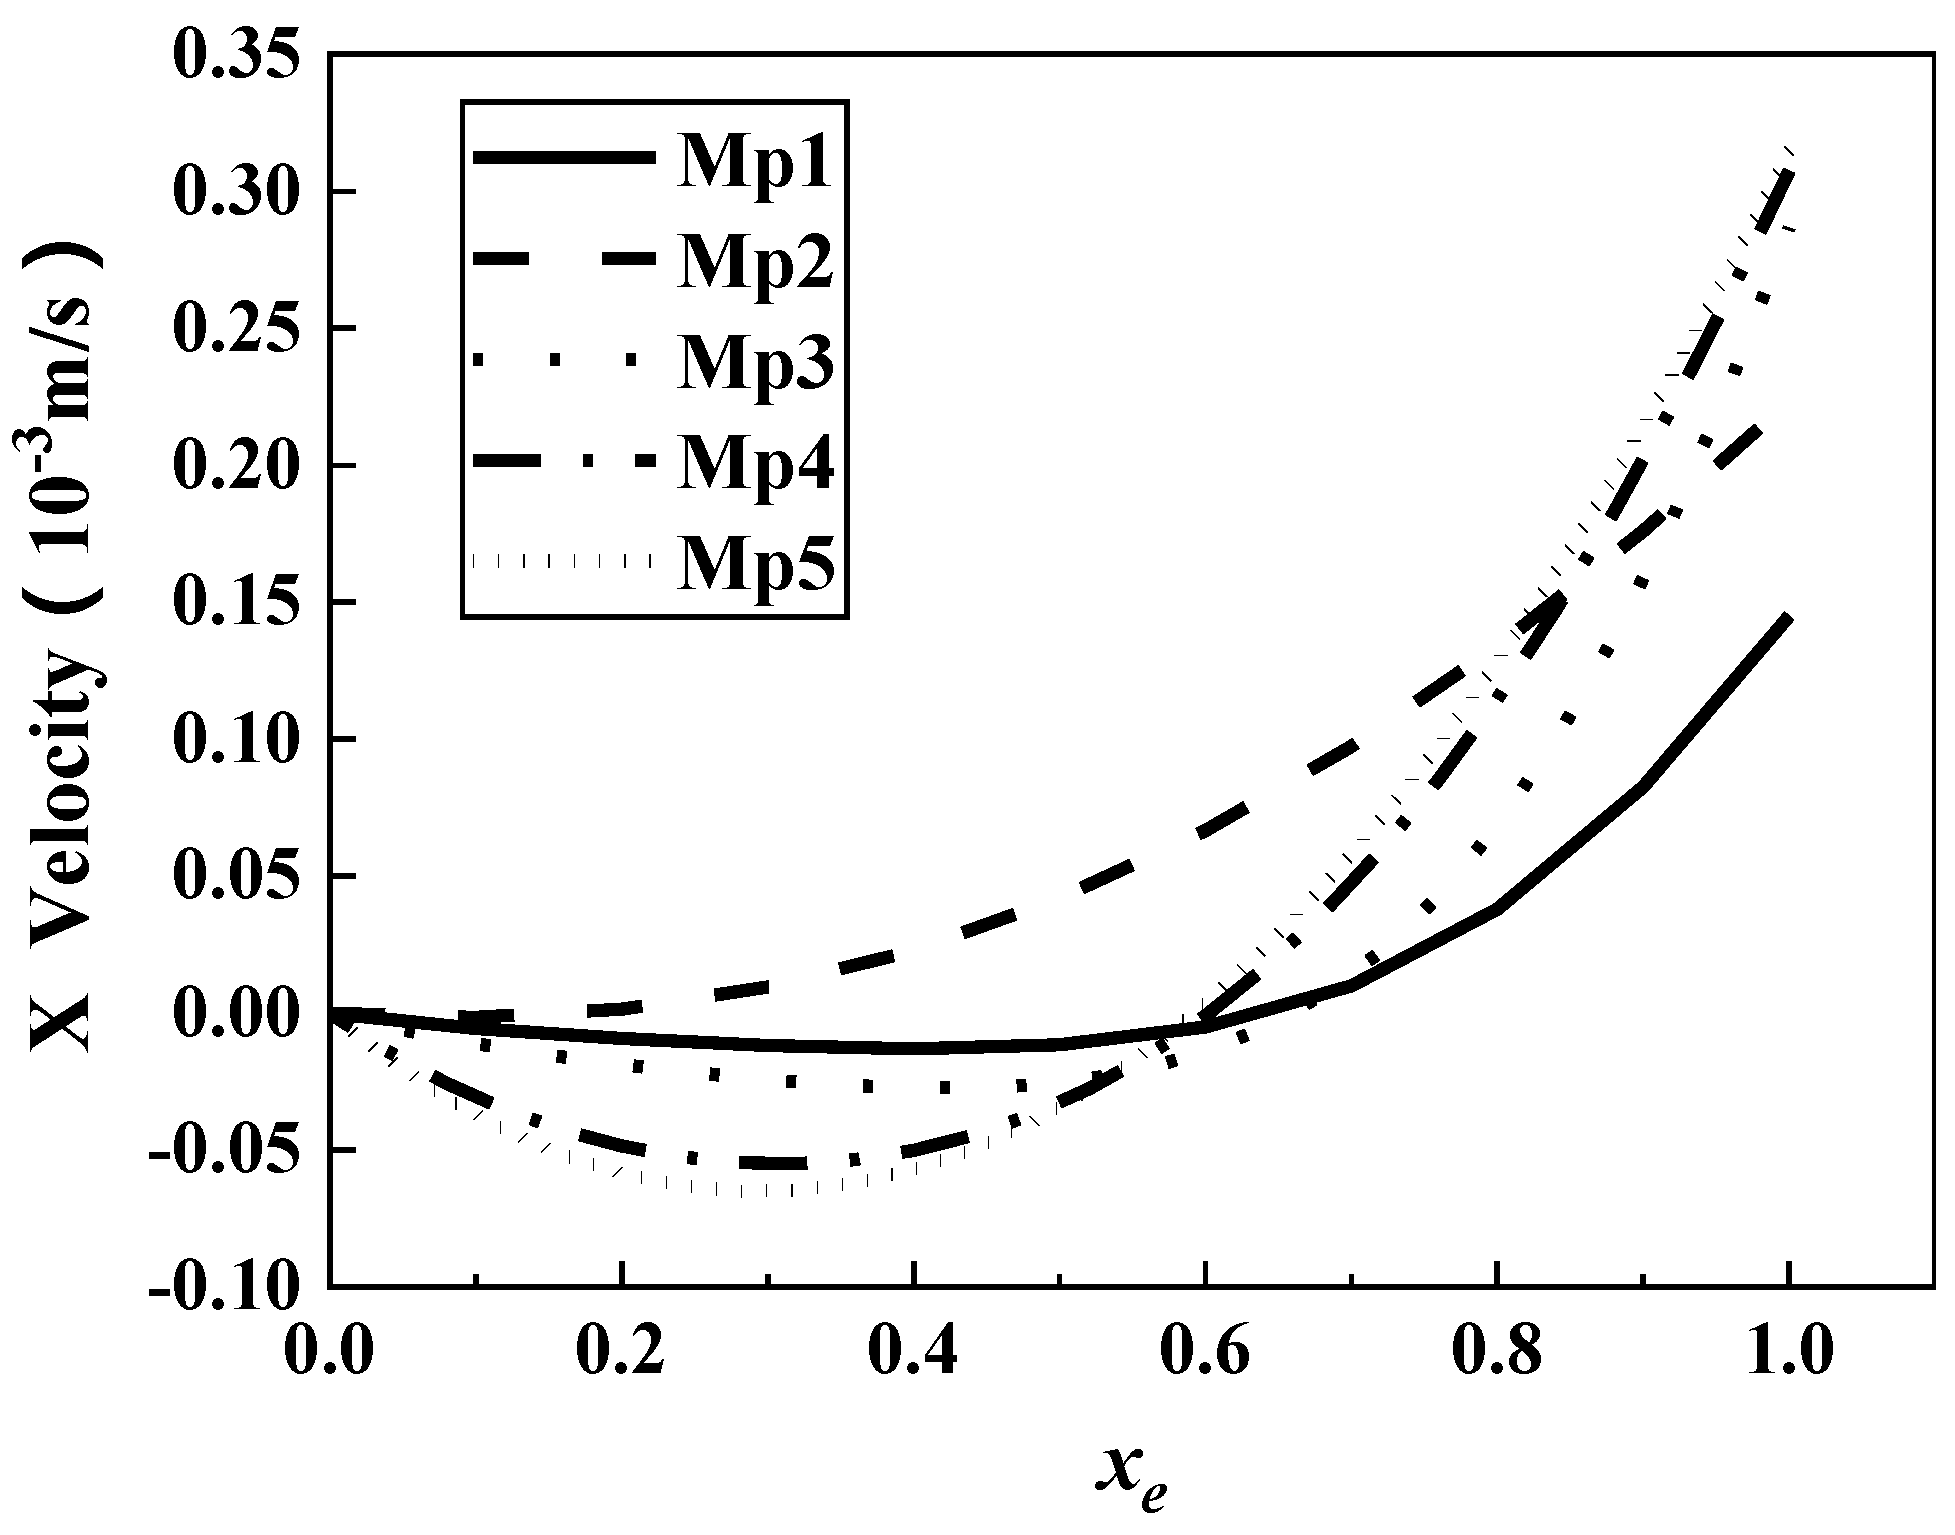
3.1. Characteristics of Fluid Kinematics in Microbial Motion

It was assumed that microorganisms moved along and against the flow direction at a speed of 3 × 10⁻⁵ m/s from microridges. Owing to surface viscosity and the boundary layer effect, a significant difference in the flow characteristics and surface shear stress near the microstructure and inside micropits was observed, thus affecting the attachment of microorganisms.
A smooth surface (flat) and five types of microstructures with uniformly arranged rectangular micropits (Mp) were established (Table 1).
In the process of flowing in and out of the microstructure, the original flow direction was reoriented. Owing to the surface viscous resistance between micropits, the flow velocity was significantly reduced. Figure 5a reveals that when the microorganism started to move above the 20th microridge on the surface of Mp1, the fluid flowed from left to right. After encountering the microorganism, the fluid flowed around it. In addition, the velocity fluctuated between the microorganism and the surface. Figure 5c is the partially enlarged figure of the velocity vector in the x-direction of the micropit. It is noticeable that the fluid flowed in at a higher speed and the movement direction changed because of the influences of the micropit and the fluid inside it. The velocity in the x-direction of the micropit appeared with a negative value, indicating that the fluid in the micropit turned into a vortex. The flow velocity at microridge steps was higher, and the slip between fluids drove the fluid in the micropit below to make a clockwise vortex; thus, the microorganism easily passed through the micropit surface. Therefore, it can be inferred that the fluid caused vortexes between microridges [23]. According to Halder [15], a closed mode with good microfluidic conditions is more effective for antifouling.
Figure 6 presents the average velocity on the microstructure at dc = 0.1 μm. When the microorganism started to move, the velocity changed sharply between two periods on the microstructural surface, and the velocity fluctuation in the next pit in the moving direction was slightly larger; thus, the microorganism had to overcome the velocity fluctuation when moving in the x-direction. The velocity under the smooth surface changed smoothly, and the maximum velocity was only 31.25% of that for the microstructural surface.
Figure 7 presents the average velocities at three different measuring heights on the microstructural surface: dc = 0.1 μm, 0.3 μm, and 0.5 μm. The velocity fluctuation increased with the decrease of the distance from the surface. Therefore, when the microorganism settled in the y-direction, it was difficult for it to approach the surface due to the increase of the velocity fluctuation. In the figure, A, B, C, and D observation points are at microridge steps where the velocity changed suddenly. The velocity greatly fluctuated above the micropit, and the velocity variation above the microridge was similar to that of the smooth surface. Therefore, objects close to the micropit were easily washed away by the water flow and hardly penetrated the micropit.
Figure 8 displays the velocity gradient distributions on different surfaces at different heights. The velocity changed rapidly at microridges. The velocity gradient of the smooth surface was almost zero due to the small change of the surface viscous resistance velocity in the middle of the microridge. When the microorganism was not attached in depth, the larger the velocity gradient, the more easily the microorganism fell off from the attachment point. Hence, the microorganism tended to attach in the central area of the microridge or settle over the micropit. In comparison to Mp1 surface (h = 2 μm, s = 2 μm), the change of the velocity gradient of Mp3 surface (h = 5 μm, s = 5 μm) was more rapid, indicating that the increase of the pit height and depth increased the influence of velocity gradient on water flow.
Figure 9 exhibits the downstream velocity distribution along the y-direction at the middle position xe = 0.5 in the micropit. The velocity distribution on the Mp2 surface (h = 2 μm, s = 5 μm) was similar to that of laminar flow, and no vortex flow was found in the velocity vector diagram. This may be because the height of the Mp2 was smaller than the width, and the value of β was smaller. When the fluid entered the microstructure at a low velocity, it was easy to penetrate into the bottom of the micropit, which made it difficult for Mp2 to form a relatively closed microflow region. The other structures had reversed flow in the x-direction at the bottom of the pit, indicating that a vortex was formed in the pit. The velocity distributions on Mp4 (h = 5 μm, s = 8 μm) and Mp5 (h = 5 μm, s = 10 μm) surfaces were similar. The velocity distribution of Mp3 (h = 5 μm, s = 5 μm) at the bottom of the micropit was similar to that of Mp1. The velocity in the upper half of the micropit increased rapidly. The velocities on Mp4 and Mp5 at the top of the micropit were the same. It expresses that height had a great influence on the velocity in the upper part of the micropit, and the vortex in the micropit was greatly affected by β.
Microstructures with different β values had certain influences on the vortex in the micropit. According to Rosenhahn et al. [24], the rotation of algal spores in a certain place determines the permanent attachment strength; hence, a mild vortex creates favorable conditions for microorganism attachment in a micropit. The flow velocity in the middle of the micropit with a vortex decreased to zero. Once the microbe moved toward the bottom of the micropit, the influence of the fluid flow decreased gradually. Therefore, the closer the low-velocity area of the vortex was to the bottom of the micropit, the easier the microorganism attachment on the microstructure was. The yd and yc in Table 2 represent the relative heights of the micropit in the downstream and countercurrent directions, respectively. The smaller the β value, the closer the position of ux = 0 was to the bottom of the micropit. Although microorganisms could be taken away by a vortex or laminar flow in the micropit, a small flow helped microorganisms to stay at the edge or corner of the bottom of the micropit. This kind of position is called a torsion node, which is easy to find and relatively stable.

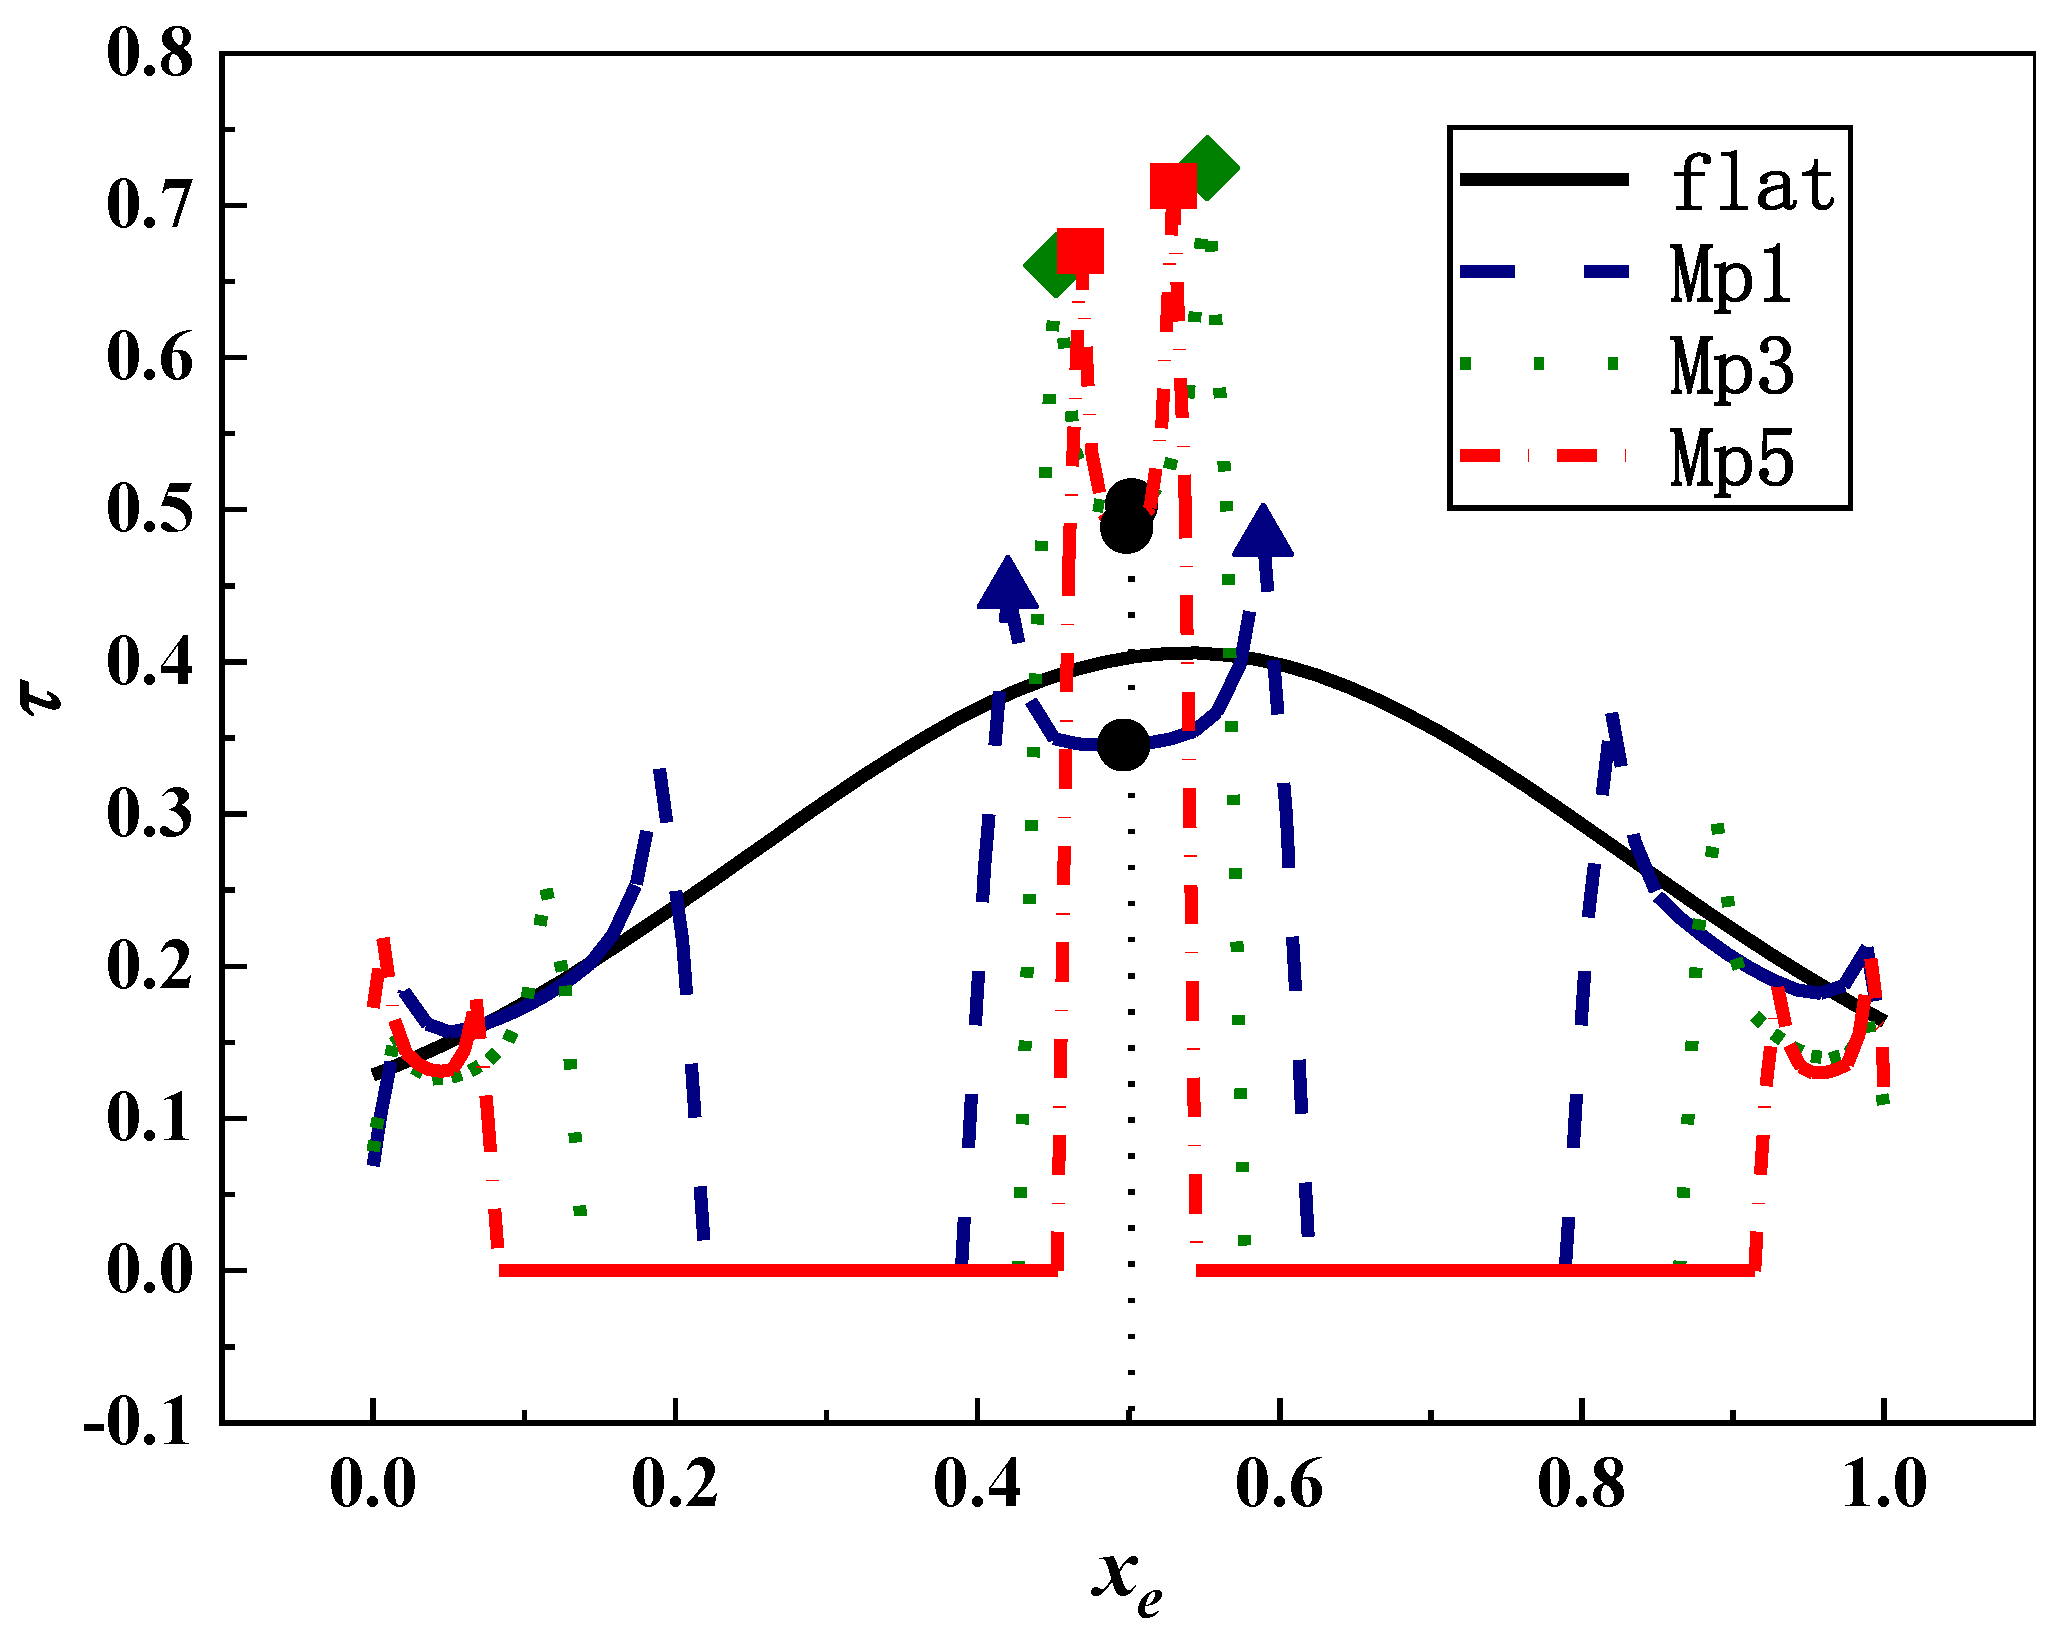
3.2. Shear Stress Distribution of Microorganism Movement

A high shear stress increases the possibility of microbial separation from a surface. By studying the antifouling performance of a prism surface through CFD simulations and experiments, Lee et al. [25] found that the prism structure generated high shear stress and less pollution. Therefore, high shear stress and shear stress fluctuation can be used as important parameters to study microbial attachment.
Figure 10 displays the distribution of shear stress at dc = 0.1 μm for different surfaces. The shear stress fluctuated sharply at the edge of the microridge with a high shear stress or no shear stress; however, it changed gently on the smooth surface. When the microorganism was not attached in depth, the sudden increase of the shear stress caused the microorganism to shake off from the attachment point. Hence, the microorganism tended to attach at the place with a low shear stress, indicating that the settlement occurred above the micropit (τ = 0).
Figure 11 illustrates the shear stress gradients ( τ ) in different flow directions. On the smooth surface, the stress gradient almost did not change in any direction. On the Mp1 surface, the shear stress changed rapidly around the microridge, especially at the step. The stress gradient and the flow velocity in the downstream direction were slightly greater than that in the countercurrent direction. The middle area of the microridge was close to the smooth surface; hence, with the increase of the microridge width, microbial attachment started to happen.
The sudden change of the shear stress is also an important index to investigate whether microorganisms attach successfully. Table 3 presents the downstream and countercurrent shear stress within three periods at dc = 0.1 μm. Table 4 presents the downstream and countercurrent shear stress gradients within three periods of five microstructures at the same position. It is noticeable that the average shear stress of the smooth surface was similar to that of the microstructural surface (difference rate was 0.03–2.67%).
Figure 12 exhibits the shear stress distributions in the y-direction of flowing in and out of the sidewall surface in the micropit. The shear stress of the outlet sidewall was lower than that of the inlet sidewall due to the frictional resistance in the pit. The maximum shear stress occurred in Mp1 (h = 2 μm, s = 2 μm) among all five micropits. The shear stress difference between the inlet and outlet sides of Mp1 was the smallest; hence, the microorganism was easily attached to the inner sidewall of Mp1. The shear stress of the outlet sidewall for other pits decreased significantly. When the microorganism collided with the wall along the vortex in the pit, it became attached to the wall due to the loss of momentum.

4. Conclusions

In the present article, five types of rectangular micropit surfaces with different sizes were established, and the downstream and countercurrent movements of globose algae with a diameter of 5 μm in the near-wall area were simulated by CFD. The velocity distribution, velocity gradient, shear stress distribution, and shear stress gradient above and in different microstructures were observed. By analyzing the attachment and detachment of microorganisms, the following inferences were pointed out.
  • The fluid velocity on the microstructural surface was greater than that on the smooth surface and fluctuated periodically, making the velocity gradient on the microstructural surface change frequently. The smooth surface had zero frequency. Simulation results of five models (0.4 ≤ β ≤ 1) revealed that the smaller the β value, the more difficult to form a vortex in micropits. The larger the β value was, the nearer the low-velocity area of the vortex in micropits to the microstructural surface and the closer the fluid slipping position to microridges. Therefore, the larger the β value, the more difficult it was for microorganisms to attach into micropits.
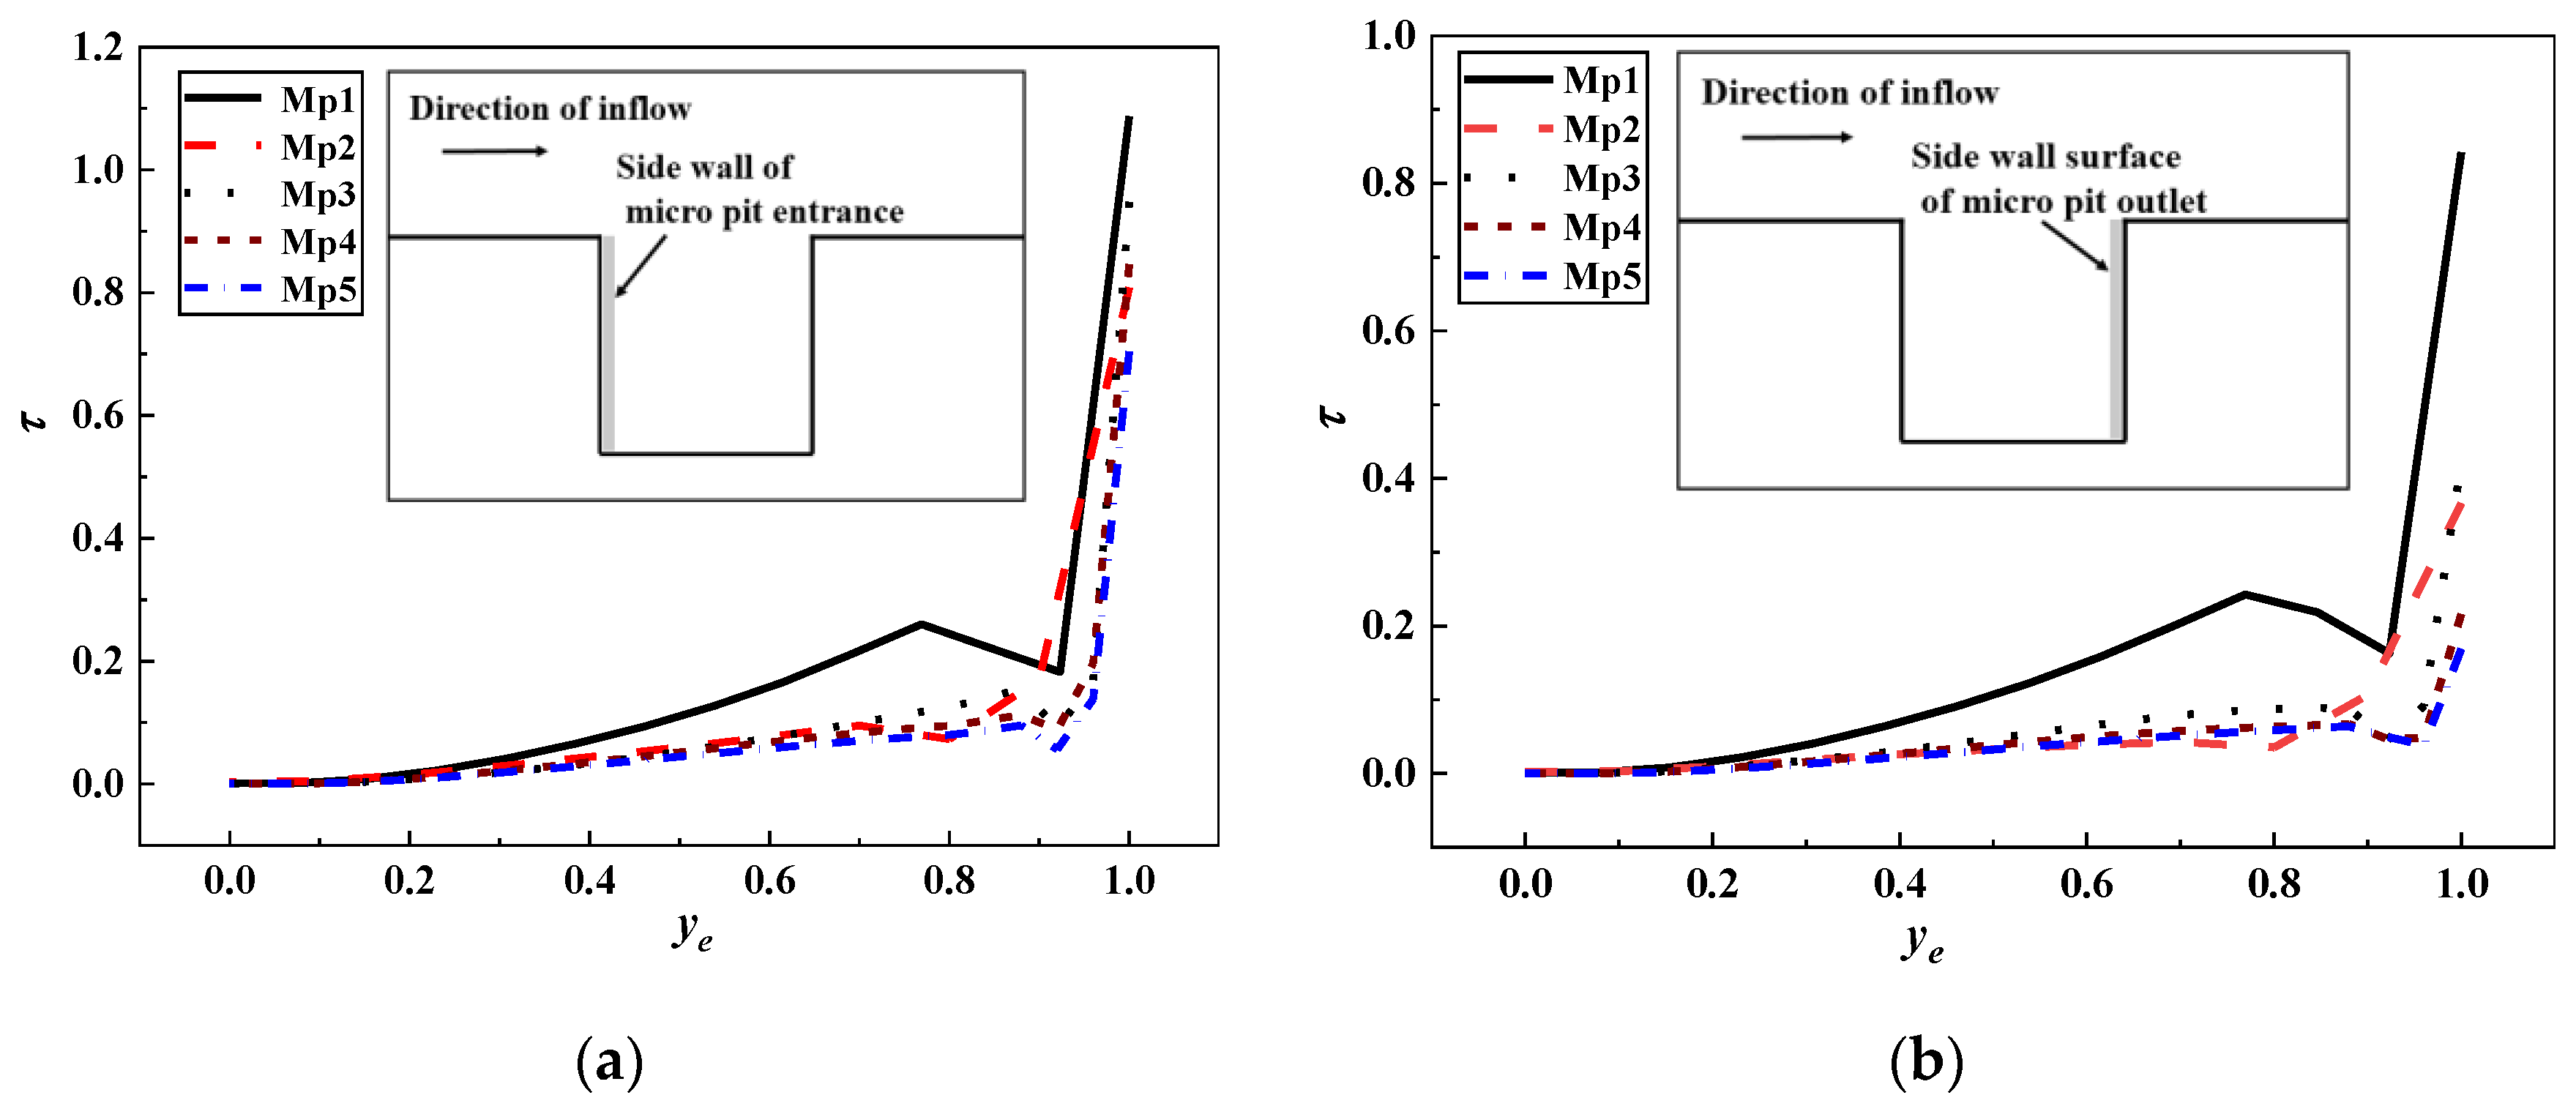
  • The shear stress and its gradient increased with the increase of the depth and width of micropits. When microbes were larger than the microstructure, they could only find the attachment point in microridges. Simulation results expressed that the velocity and shear stress at microridges changed greatly, thus making it hard for microorganisms to attach into micropits. When microorganisms were smaller than the microstructure, they collided with the vortex wall in micropits and then became attached to the torsion node. The shear stress values on the two sides of the micropit with s = 2 μm were significantly higher than those of others, making it difficult for microbes to attach in depth. For other microstructures, the shear stress on the outlet sidewall was significantly lower than that on the inlet sidewall; hence, microbes tended to accumulate on the outlet side of micropits with vortex sediment.
  • Microorganisms on five types of microstructures moved through the periodic fluctuation of microridges and micropits. Microridges had vortexes with low velocity and high shear stress, and the opposite phenomenon occurred in micropits. Although the increase of the width of microridges and micropits resulted in greater velocity and shear stress, the distribution of velocity and shear stress in the middle of them was similar to that of the smooth surface, and, thereby, the increase of the width of microridges and micropits was not useful to antifouling.

Author Contributions

H.Y. and C.L. proposed the research direction and methodology. M.Y. and J.Q. designed the 3D model of biological movement. H.Y. and H.L. completed numerical simulation with FLUENT, mapping with Origin, and data analysis. H.Y. wrote the paper. S.W. provided theoretical guidance and paper revision. All authors have read and agreed to the published version of the manuscript.

Funding

This paper was supported by the National Natural Science Foundation of China (51876065) and Fundamental Research Funds for the Central Universities of Ministry of Education of China (Grant No. 2015MS105).

Acknowledgments

We thank Songling Wang for his theoretical guidance. Special thanks go to the National Natural Science Foundation of China (51876065) and Fundamental Research Funds for the Central Universities of Ministry of Education of China (Grant No. 2015MS105) for support with the finance.

Conflicts of Interest

The authors declare no conflict of interest.

References

  1. Pedrazzi, S.; Allesina, G.; Muscio, A. Are Nano-Composite Coatings the Key for Photovoltaic Panel Self-Maintenance: An Experimental Evaluation. Energies 2018, 11, 3448. [Google Scholar] [CrossRef] [Green Version]
  2. Lv, Y.K.; Zhao, W.P.; Li, J.G.; Zhang, Y.Z. Simulation of Contamination Deposition on Typical Shed Porcelain Insulators. Energies 2017, 10, 1045. [Google Scholar] [CrossRef] [Green Version]
  3. Mukherjee, A.; Joshi, M.; Misra, S.C.; Ramesh, U.S. Antifouling paint schemes for green SHIPS. Ocean Eng. 2019, 173, 227–234. [Google Scholar] [CrossRef]
  4. Lou, T.; Bai, X.Q.; Yuan, C.Q.; Yang, Z.C. Advances in Surface Microstructure Antifouling Technology for Ship Hull. Surf. Technol. 2019, 1, 102–113. [Google Scholar]
  5. Callow, M.E.; Fletcher, R.L. The influence of low surface energy materials on bioadhesion—A review. Int. Biodeterior. Biodegrad. 1994, 34, 333–348. [Google Scholar] [CrossRef]
  6. Brennan, A.B.; Baney, R.H.; Carman, M.L.; Estes, T.G.; Feinberg, A.W.; Wilson, L.H.; Schumacher, J.F. Surface Topography for Non-Toxic Bioadhesion Control. U.S. Patent 7143709 B2, 5 December 2006. [Google Scholar]
  7. Carman, M.L.; Estes, T.G.; Feinberg, A.W.; Schumacher, J.F.; Wilkerson, W.; Wilson, L.H.; Callow, M.E.; Callow, J.A.; Brennan, A.B. Engineered antifouling microtopographies–correlating wettability with cell attachment. Biofouling 2006, 22, 11–21. [Google Scholar] [CrossRef]
  8. Schumacher, J.F.; Carman, M.L.; Estes, T.G.; Feinberg, A.W.; Wilson, L.H.; Callow, M.E.; Callow, J.A.; Finlay, J.A.; Brennan, A.B. Engineered antifouling microtopographies-effect of feature size, geometry, and roughness on settlement of zoospores of the green alga ulva. Biofouling 2007, 23, 55–62. [Google Scholar] [CrossRef]
  9. Decker, J.T.; Kirschner, C.M.; Long, C.J.; Finlay, J.A.; Callow, M.E.; Callow, J.A.; Brennan, A.B. Engineered Antifouling Microtopographies: An Energetic Model That Predicts Cell Attachment. Langmuir 2013, 29, 13023–13030. [Google Scholar] [CrossRef]
  10. Bai, X.Q.; Xie, G.T.; Fan, H.; Peng, Z.X.; Yuan, C.Q.; Yan, X.P. Study on biomimetic preparation of shell surface microstructure for ship antifouling. Wear 2013, 306, 285–295. [Google Scholar] [CrossRef]
  11. Fu, Y.F.; Yuan, C.Q.; Bai, X.Q.; Li, T. Study on Drag Reduction Performance of Antifouling Ribbed Surfaces. J. Ship Prod. Des. 2018, 34, 32–41. [Google Scholar]
  12. Yang, Z.C. Research on Biomimetic Preparation based on Crab Surface Microstructure and Analysis of Antifouling Performance. Master’s Thesis, Wuhan University of Technology, Wuhan, China, 2018. (In Chinese). [Google Scholar]
  13. Wang, X.; Bai, X.Q.; Yuan, C.Q. Analysis of present development on technologies of antifouling and drag reduction based on bionic non-smooth surface. Ship Eng. 2015, 37, 1–5. [Google Scholar]
  14. Zheng, J.Y.; Lin, C.G.; Zhang, J.W.; Wang, L.; Xu, F.L.; Zhou, J.; Duan, D.X.; Liu, H.H. Antifouling performance of surface microtopographies based on sea star luidia quinaria. Key Eng. Mater. 2013, 562–565, 1290–1295. [Google Scholar] [CrossRef]
  15. Halder, P.; Nasabi, M.; Jayasuriya, N.; Shimeta, J.; Deighton, M.; Bhattacharya, S.; Mitchell, A.; Bhuiyan, M.A. An assessment of the dynamic stability of microorganisms on patterned surfaces in relation to biofouling control. Biofouling 2014, 30, 695–707. [Google Scholar] [CrossRef] [PubMed]
  16. Shaikh, S.; Deepti, S.; Mahesh, S.; Sunita, K.; Anil, K.S.; Kulwant, S.; Nidhi, G.; Sucharita, S. Femtosecond laser induced surface modification for prevention of bacterial adhesion on 45S5 bioactive glass. J. Non-Cryst. Solids 2018, 482, 63–72. [Google Scholar] [CrossRef] [Green Version]
  17. Vucko, M.J.; Poole, A.J.; Carl, C.; Sexton, B.A.; Glenn, F.L.; Whalan, S.; Nys, R. Using textured PDMS to prevent settlement and enhance release of marine fouling organisms. Biofouling 2014, 30, 1–16. [Google Scholar] [CrossRef]
  18. Won, Y.J.; Jung, S.Y.; Jang, J.H.; Lee, J.W.; Chae, H.R.; Choi, D.C.; Hyun, A.K.; Lee, C.H.; Park, P.K. Correlation of membrane fouling with topography of patterned membranes for water treatment. J. Membr. Sci. 2016, 498, 14–19. [Google Scholar] [CrossRef]
  19. Jung, S.Y.; Hyun, A.K. Transport and deposition of colloidal particles on a patterned membrane surface: Effect of cross-flow velocity and the size ratio of particle to surface pattern. J. Membr. Sci. 2019, 572, 309–319. [Google Scholar] [CrossRef]
  20. Fawzan, M.R.B.A.; Myan, F.W.Y. Comparisons of Flow Patterns over a Hierarchical and a Non-hierarchical Surface in Relation to Biofouling Control. MATEC Web Conf. 2018, 152, 02014. [Google Scholar] [CrossRef] [Green Version]
  21. Zhe, Y.; Yan, L. A Comprehensive Study of Dynamic and Heat Transfer Characteristics of Droplet Impact on Micro-Scale Rectangular Grooved Surface. Energies 2018, 11, 1390. [Google Scholar]
  22. Darnton, N.C.; Turner, L.; Rojevsky, S.; Berg, H.C. Dynamics of bacterial swarming. Biophys. J. 2010, 98, 2082–2090. [Google Scholar] [CrossRef] [Green Version]
  23. Friedmann, E.; Portl, J.; Richter, T. A Study of Shark Skin and its drag reducing mechanism. Adv. Math. Fluid Mech. 2010, 271–285. [Google Scholar] [CrossRef]
  24. Rosenhahn, A.; Sendra, G.H. Surface Sensing and Settlement Strategies of Marine Biofouling Organisms. Biointerphases 2012, 7, 63. [Google Scholar] [CrossRef] [PubMed]
  25. Lee, Y.K.; Won, Y.J.; Yoo, J.H.; Ahn, K.H.; Lee, C.H. Flow analysis and fouling on the patterned membrane surface. J. Membr. Sci. 2013, 427, 320–325. [Google Scholar] [CrossRef]
Figure 1. Scanning electron micrographs (SEM) of engineered topographies on a polydimethylsiloxane surface: (A) Two-mm ribs of lengths 4 mm, 8 mm, 12 mm, and 16 mm are combined to create a sharklet adhesively backed film, ERI = 9.5; (B) 10-mm equilateral triangles combined with 2-mm-diameter circular pillars, ERI = 8.7; (C) hexagonally packed 2-mm-diameter circular pillars, ERI = 5.0; and (D) 2-mm-wide ridges separated by 2-mm-wide channels, ERI = 6.1. [8]
Energies 13 04421 g001
Figure 2. Microstructure imitating the starfish surface [14].
Energies 13 04421 g002
Figure 3. Schematic diagram of the microstructure model.
Energies 13 04421 g003
Figure 4. Dimensionless pressure drop ratio to inlet velocity.
Energies 13 04421 g004
Figure 5. Velocity distribution in the x-direction of the Mp1 microstructural surface. The grey area is the microbial model. The colored and white areas correspondingly represent fluid and microstructure surfaces: (a) Velocity nephogram in the x-direction, (b) velocity vector diagram of the microstructural surface, and (c) partially enlarged figure of the velocity vector in the x-direction.
Energies 13 04421 g005aEnergies 13 04421 g005b
Figure 6. Velocity distribution on the microstructural surface with dc = 0.1 μm. The xe is normalized coordinates.
Energies 13 04421 g006
Figure 7. Velocity distributions at different measuring heights under microbes.
Energies 13 04421 g007
Figure 8. Velocity gradient distribution.
Energies 13 04421 g008
Figure 9. Velocity distribution along the y-direction at the middle position. The xe = 0.5 in the micropit.
Energies 13 04421 g009
Figure 10. Shear stress downstream distribution. The triangle, diamond, and square correspondingly represent the maximum shear stress point of the Mp1, Mp3, and Mp5. The circle indicates the minimum value shear stress point of the micropit.
Energies 13 04421 g010
Figure 11. Shear stress gradients of the smooth surface and the microstructure in different directions: Flat (d) and flat (c) represent the shear stress gradients in the downstream and countercurrent directions of the smooth surface, respectively. Mp1 (d) and Mp1 (c) represent the shear stress gradients in the downstream and countercurrent directions of the microstructure with h = 2 μm and s = 2 μm, respectively.
Energies 13 04421 g011
Figure 12. Shear stress distribution on the inner surface of the micropit: (a) Shear stress of the fluid inlet sidewall and (b) shear stress of the fluid outlet sidewall
Energies 13 04421 g012
Table 1. Micropit size on the surface of microstructure.
StructuresMp1Mp2Mp3Mp4Mp5
h (μm)22555
s (μm)255810
Table 2. Vortex centers in the micropit with different β values.
β Values and Vortex CentersMp1Mp2Mp3Mp4Mp5
β10.410.6250.5
yd (ux = 0)0.6700.6450.5340.523
yc (ux = 0)0.640.1320.660.60.591
Table 3. Shear stresses under microbes for smooth and microstructural surfaces in three periods.
Shear StressFlatMp1Mp2Mp3Mp4Mp5
τ d m a x 0.4060.4820.5450.7250.7790.713
τ d m i n 0.12900000
τ d ¯ 0.2870.2540.2100.2830.2860.274
τ c m i n 0.4140.4820.5470.6830.7780.737
τ c m i n 0.13000000
τ c ¯ 0.2910.2370.2110.2840.2860.275
Table 4. Shear stresses gradient under microbes for microstructural surfaces in three periods.
Shear Stress GradientMp1Mp2Mp3Mp4Mp5
τ d m a x 17.18526.28933.99551.48060.540
τ d m i n −19.479−31.034−40.425−62.078−65.908
τ c m a x 13.21331.39239.13459.93370.178
τ c m i n −12.496−29.197−36.354−55.163−58.287

