Article

Benchmarks for Embodied and Operational Energy Assessment of Hellenic Single-Family Houses

by
Elena G. Dascalaki
*,
Poulia A. Argiropoulou
,
Constantinos A. Balaras
,
Kalliopi G. Droutsa
and
Simon Kontoyiannidis
Group Energy Conservation, Institute for Environmental Research and Sustainable Development, National Observatory of Athens, GR-15236 Athens, Greece
*
Author to whom correspondence should be addressed.
Energies 2020, 13(17), 4384; https://doi.org/10.3390/en13174384
Submission received: 24 July 2020 / Revised: 16 August 2020 / Accepted: 18 August 2020 / Published: 25 August 2020
(This article belongs to the Special Issue Building Energy Audits-Diagnosis and Retrofitting)

Abstract

:
Building energy performance benchmarking increases awareness and enables stakeholders to make better informed decisions for designing, operating, and renovating sustainable buildings. In the era of nearly zero energy buildings, the embodied energy along with operational energy use are essential for evaluating the environmental impacts and building performance throughout their lifecycle. Key metrics and baselines for the embodied energy intensity in representative Hellenic houses are presented in this paper. The method is set up to progressively cover all types of buildings. The lifecycle analysis was performed using the well-established SimaPro software package and the EcoInvent lifecycle inventory database, complemented with national data from short energy audits carried out in Greece. The operational energy intensity was estimated using the national calculation engine for assessing the building’s energy performance and the predictions were adapted to obtain more realistic estimates. The sensitivity analysis for different type of buildings considered 16 case studies, accounting for representative construction practices, locations (climate conditions), system efficiencies, renovation practices, and lifetime of buildings. The results were used to quantify the relative significance of operational and embodied energy, and to estimate the energy recovery time for popular energy conservation and energy efficiency measures. The derived indicators reaffirm the importance of embodied energy in construction materials and systems for new high performing buildings and for renovating existing buildings to nearly zero energy.

Graphical Abstract

1. Introduction

Residential buildings are responsible for 12.1 million terajoule (TJ) that corresponds to 27.2% of the total final energy used in the European Union Member States (EU-28), and 677 million tonnes of carbon dioxide (MtCO2) or 18.4% of total emissions, according to the latest available official statistics for 2017 [1]. According to the 2011 Census, there were about 241 million dwellings in the EU-28, averaging 96.4 m2 per dwelling [2] and are estimated to have reached 301 million dwellings [3]. Although only some of the EU Member States collect and report the number of buildings in their Census data, it is estimated that there are about 118 million residential buildings in the EU-28, of which 68% are single-family houses (SFH), i.e., low-rise buildings with one or two floors with a total floor area of 9.6 billion m2 (or 51% of the total), and the rest are multi-family houses (MFH) in apartment buildings [3].
More than half (54%) were built before 1980 and the wide adoption of energy efficiency regulations and codes. The long lifespan of buildings emphasizes the need to renovate aging and inefficient buildings by minimizing thermal losses through the envelope (e.g., add wall thermal insulation, replace windows in order to minimize thermal losses), decommission old and install new efficient equipment to improve performance (e.g., replace boilers), and/or add new systems that exploit renewables (e.g., solar thermal collectors).
In view of the significant role of buildings, European policies on climate and energy focus on energy efficiency and the exploitation of renewables for meeting the 2030 targets and towards a climate-neutral Europe by 2050 [4]. The main European legislative and policy tool has been the EU Directive on the energy performance of buildings (EPBD) since 2002 continuously evolves and motivates European countries to enhance their building regulations, mandating stricter requirements for new buildings and major renovations [5]. Among other requirements, the latest EPBD encourages energy efficiency and strives to accelerate the cost-effective renovation of existing buildings towards a decarbonized building stock by 2050 [6].
According to EPBD, as of January 2021, all new buildings must be nearly-zero-energy buildings (nZEB), while long-term national renovation strategies should support the renovation of existing buildings into nZEBs in the coming decades. Although there are significant differences in the way that EU Members States have defined nZEBs in their national context [6,7], the arching principle is that they have a very high energy performance, and the nearly zero or very low amount of energy required should be covered to a very significant extent from on-site or nearby renewable sources. Along these lines, nZEBs are expected to have a very low energy use intensity (EUI) that is defined as the annual energy use per unit floor area of the building (e.g., MJ/m2), while securing the appropriate indoor environmental quality. The primary EUI in nZEBs ranges between 70 and 270 MJ/m2, depending on the end-uses and services accounted for in the national definitions, different building sector, etc [8].
Given the long lifetime of buildings and low annual rates for new construction, the renovation of the millions of existing buildings constitutes the main driving mechanism for decarbonizing the national building stocks by 2050. Common energy conservation measures (ECM) include the addition of more thermal insulation, the replacement of low performance building elements (e.g., windows) or energy efficiency measures (EEM) that reduce energy use by replacing existing equipment with new and more energy efficient ones (e.g., boilers), and the installation of systems that exploit renewables (e.g., solar collectors), among others. However, while these measures will reduce the operational energy of the renovated buildings, from an environmental point of view, some of the resulting savings will actually be compensating for the energy used to produce the corresponding building products, e.g., thermal insulation, double-glazing windows, boiler, solar collector or other building components or systems that may be added to a building during its renovation. Accordingly, an energy recovery time will correspond to different time periods depending on the achieved building energy savings and the amount of energy used for the manufacturing of the building products used in a project.

1.1. Embodied Energy

Over the past 40 years, the concept of the embodied energy has gained a lot of attention for measuring the total energy required for the production of economic or environmental goods and services [9]. For buildings, it refers to the energy used for all direct and indirect processes associated with the production of materials, products, systems or other elements that go into the construction of a building, maintenance, and replacement or demolition at the end-of-life [10]. The indicator that is commonly used for the quantification of embodied impacts is the non-renewable primary energy use, accounted in megajoules (MJ) [11]. Using a similar indicator like the operational energy use intensity, one can calculate the embodied energy intensity (EEI) that accounts for all the energy used to manufacture building materials and produce building elements or systems per unit floor area (MJ/m2). These key indicators can be used in the early stages of the decision-making process to make the best renovation decisions and select among alternatives by accounting for the impacts of new materials and systems that will be added or the ones that will be removed during the lifetime of buildings. Ultimately, they can facilitate major building renovation activities and be used to best navigate future activities towards a decarbonized European building stock by 2050.
A Life Cycle Assessment (LCA) evaluates the environmental impact of buildings, with respect to the energy used (or the generated emissions) for the production or manufacturing of materials, products, and systems that go into the construction, maintenance, or renovation of a building, and the energy used (or emissions) for its operation to the end of their lifetime. Although LCA is slowly becoming part of the European building industry as it is encouraged by EPBD [5] and Level(s) [12], it is still not common practice in most European countries and available data is very limited.
A Life Cycle Inventory (LCI) is a process that quantifies the data from raw material extraction, transportation, manufacturing, and distribution. There are several methods used in the LCI phase of an LCA to assess lifecycle energy that are extensively reviewed in several publications [13,14]. The most popular ones include the process-based analysis that takes into account the various inputs and outputs for all the processes during the lifecycle of a building material or product; the input-output (I-O) analysis that estimates the materials, energy use, and emissions for a given economic sector based on national statistics; or the hybrid analysis that is a combination of both. Since practically all methods have some type of limitations in terms of completeness, reliability, and specificity there is still no consensus on a globally accepted method [10]. Depending on the selected method, the calculated EE from a hybrid analysis may be from 3.8 up to 4.9 times higher than the values derived using a process-based analysis [15].
In this work, the focus is on a process-based LCA based on [16,17]. The boundaries of the analysis capture the initial and recurrent embodied energy. The initial embodied energy accounts for the total energy used by the production stage and construction processes. The most significant amounts of energy are used for the raw material extraction (i.e., quarrying or mining) and manufacturing, assembling, or other fabrication processes for delivering building construction materials, equipment, or system components to the factory gate. This is usually referred as “cradle-to-gate”, which may represent up to 92% of the total lifecycle embodied energy [18]. The other basic boundary condition may include the additional energy for transportation from the factory gate to the building site and the energy used for the construction and installation. The transportation of materials and products may vary significantly depending on whether they are locally available (preferred) or imported and the mode of transport, while the construction and installation generally do not exceed 2% of the lifecycle impacts [18]. Accordingly, the initial EE that is also known as “cradle-to-site” embodied energy may account up to 99% of the total lifecycle embodied energy [18] depending on the materials and their function and use as different building elements.
The recurrent EE represents the energy consumed to maintain, repair, restore, refurbish, or replace materials and components (or systems) during the life of the building. Depending on the system boundary and analysis approach, the relative importance of the recurrent energy for residential buildings may range from 45% up to 60% over a 50-year building lifetime [10]. Sometimes, the recurrent EE may even exceed the initial EE depending on the lifetime of the building, service life of its elements and systems, and renovation practices [10,19]. The frequency of the various works and the amount of the recurrent EE depends on the lifetime of the building materials or systems, and on the need to replace some building elements or add new systems as part of energy conservation and efficiency measures during building renovations.

1.1.1. Databases and Tools

Databases are continually being developed and updated throughout the world, some of which are proprietary with a subscription fee, while others are open and have free access. Well-known and publicly available tools and data sources are annotated in [11,14]. Most of the data are available as LCI data format rather than embodied energy, which make them cumbersome to use. The most well-known commercial database is the EcoInvent, while the most commonly used public database is the inventory of carbon and energy (ICE) created by the University of Bath, while a popular LCA tool includes the SimaPro, among others [14,19].
Another potential source of information for construction product data is an Environmental Product Declaration—EPD that is elaborated in [16]. The number of companies that produce EPDs is growing with time, while some building sustainability assessment schemes also award credits for selecting materials or products that have EPDs available [20]. However, EPDs remain voluntary and their availability remains very limited. As a result, instead of full disclosure, some manufacturers still consider that EPDs include confidential and proprietary information and are reluctant to make them public.

1.1.2. Embodied and Operational Energy Intensity

As the operational energy used in high performing buildings continues to drop, accounting for the embodied energy of building construction materials and systems is gaining more importance [20]. However, published values for the embodied energy of residential buildings vary significantly as a result of different calculation approaches, system boundaries, and other uncertainties [13,19].
The embodied energy can range from 6% to 20% of the lifetime operational energy use in conventional buildings, from 11% to 33% in passive buildings, 26% to 57% in low energy buildings, and 74% to 100% in net zero energy buildings [15]. In the Netherlands, depending on the renovation rates of existing buildings, it is expected that the operational energy use of the building stock will decrease by 19% to 46% by 2050, while at over the same period, the share of embodied energy will increase by 26% with a renovation rate of 1.4% per year or by 35% with a renovation rate of 1.9% per year [14].
EU Member States are also encouraged to consider integrating the embodied energy of the materials and other sustainability benefits as part of the EPBD national cost-optimal calculations that must consider the buildings’ complete lifecycle [21]. Currently, embodied energy is clearly considered in cost-optimal studies only in Lithuania, while six other member states account only some of its aspects [22]. Apparently, this topic should gain more attention to assess the cost-optimal minimum energy performance requirements for major renovations of existing building elements and technical installations.
Embodied energy is also one of the key indicators in the reporting framework for the sustainable building design, construction, and operation currently under development by the European Commission [12]. Recognizing the emerging importance of the embodied energy, the EU building stock observatory includes it as a monitored indicator for new construction, and deep and major renovations, under the technical building systems thematic area [23].
The embodied energy intensities of residential buildings for different building lifecycles can range from 0.9 to 23.1 GJ/m2 for the initial EE, and from 1.22 to 20.4 GJ/m2 for the recurrent EE [14]. These large variations may be attributed to inconsistent system boundaries, the use of different methods and databases, etc. Other earlier studies have reported that the embodied energy intensities for residential buildings range from 3.6 to 8.8 GJ/m2 (averaging 5.5 GJ/m2), while more recent works have disclosed values from 1.7 to 7.3 GJ/m2 (averaging 4.0 GJ/m2) for conventional constructions and 4.3 to 7.7 GJ/m2 (averaging 6.2 GJ/m2) for high performance buildings [24], and drop to values from 105 to 243 MJ/m2 for low energy European residential buildings [25]. For European residential buildings, the initial EEI that have been reported in the literature for different constructions average 2.6 GJ/m2 for timber, 4.0 GJ/m2 for brick, 7.0 GJ/m2 for concrete, and 13.8 GJ/m2 for steel [19]. Compared to high-rise buildings, SFH have a higher EE intensity that ranges from 1.0 to 1.5 GJ/m2 [26].
In Greece, there is no official database related to the environmental impacts of common building construction materials, equipment, systems, etc. As a result, relevant studies have commonly used data on the embodied energy coefficients from international databases, like the very popular, open, and free-to-use ICE database [27]; and information readily available in bibliography.
Studies have mostly focused on residential buildings, using example buildings with publicly available data sources or other international LCI databases to estimate the embodied energy [15,28]. Considering four real residential buildings (i.e., three single- and one multi-family house) as examples with representative constructions and different vintages, the initial embodied energy intensities ranged from 2.18 GJ/m2 to 10.2 GJ/m2 as a result of using different public databases for the EE coefficients of major construction materials [29]. For an apartment building, the calculated embodied energy intensity for renovating the thermal envelope of old buildings to the new building thermal regulation standards in different climate zones ranged from 2.42 to 2.82 GJ/m2 using conventional materials and from 1.52 to 1.56 GJ/m2 using more ecological materials [28].
Similar efforts have also focused on quantifying the materials and benchmarking the embodied energy in major electromechanical (E/M) installations and equipment, by auditing two real residential buildings—one house and one apartment building [30]. The main installations included a single-pipe hydronic central space heating with oil-fired boiler connected to room space radiators, a hydraulic and DHW installation with solar collectors, hot water storage tank, local split-unit heat pumps, and electrical installations (e.g., main control panels, cables, wall plugs). Using the ICE data [27], the work estimated an intensity of 421.0 MJ/m2 for the house and 170.8 MJ/m2 for the apartment building [30].
Progressively over the years, some have also been collecting local and national data to enhance the knowledge base on the energy aspects of LCI databases for key construction materials and major mechanical equipment. These efforts are of particular interest for commonly used materials or equipment that are usually not imported but rather mostly produced in the country and used in the construction and operation of Hellenic buildings. For example, materials like thermal insulation [31], steel rebar [32], aluminium [33], bricks [34], and E/M system components like boilers [35], solar collectors [36], etc.
Initial work that exploited an adapted Hellenic dataset for commonly used construction materials in Greece considered only four typical SFH to estimate their EE intensities that ranged from 3.2 GJ/m2 to 7.1 GJ/m2 [37]. This is significant when compared with the annual primary EUIs that range for the most recent building construction under the stringent national energy code from 0.3 to 0.5 GJ/m2 in the different climate zones of Greece, or relatively less important if one considers the older pre-1980 dwellings that have high EUIs that range from 1.9 to 3.9 GJ/m2 [38]. The present work extends previous efforts by considering 16 case studies providing a comprehensive representation of the Hellenic residential typologies for single-family houses, for characteristic building construction periods and locations in the four climate zones in Greece.
In comparison with the operational energy use, the final EUIs of residential buildings for normal climate conditions average 624 MJ/m2 in EU-28 and 446 MJ/m2 in Greece [23]. New buildings in the nZEB era have a very low primary energy use that range from 72 MJ/m2 to 720 MJ/m2 according to the different national definitions [39]. In Greece, the upper limit of the calculated primary energy use for space heating, cooling, ventilation, and DHW in nZEBs is 288 MJ/m2 for new buildings and 342 MJ/m2 for major renovations of existing buildings.

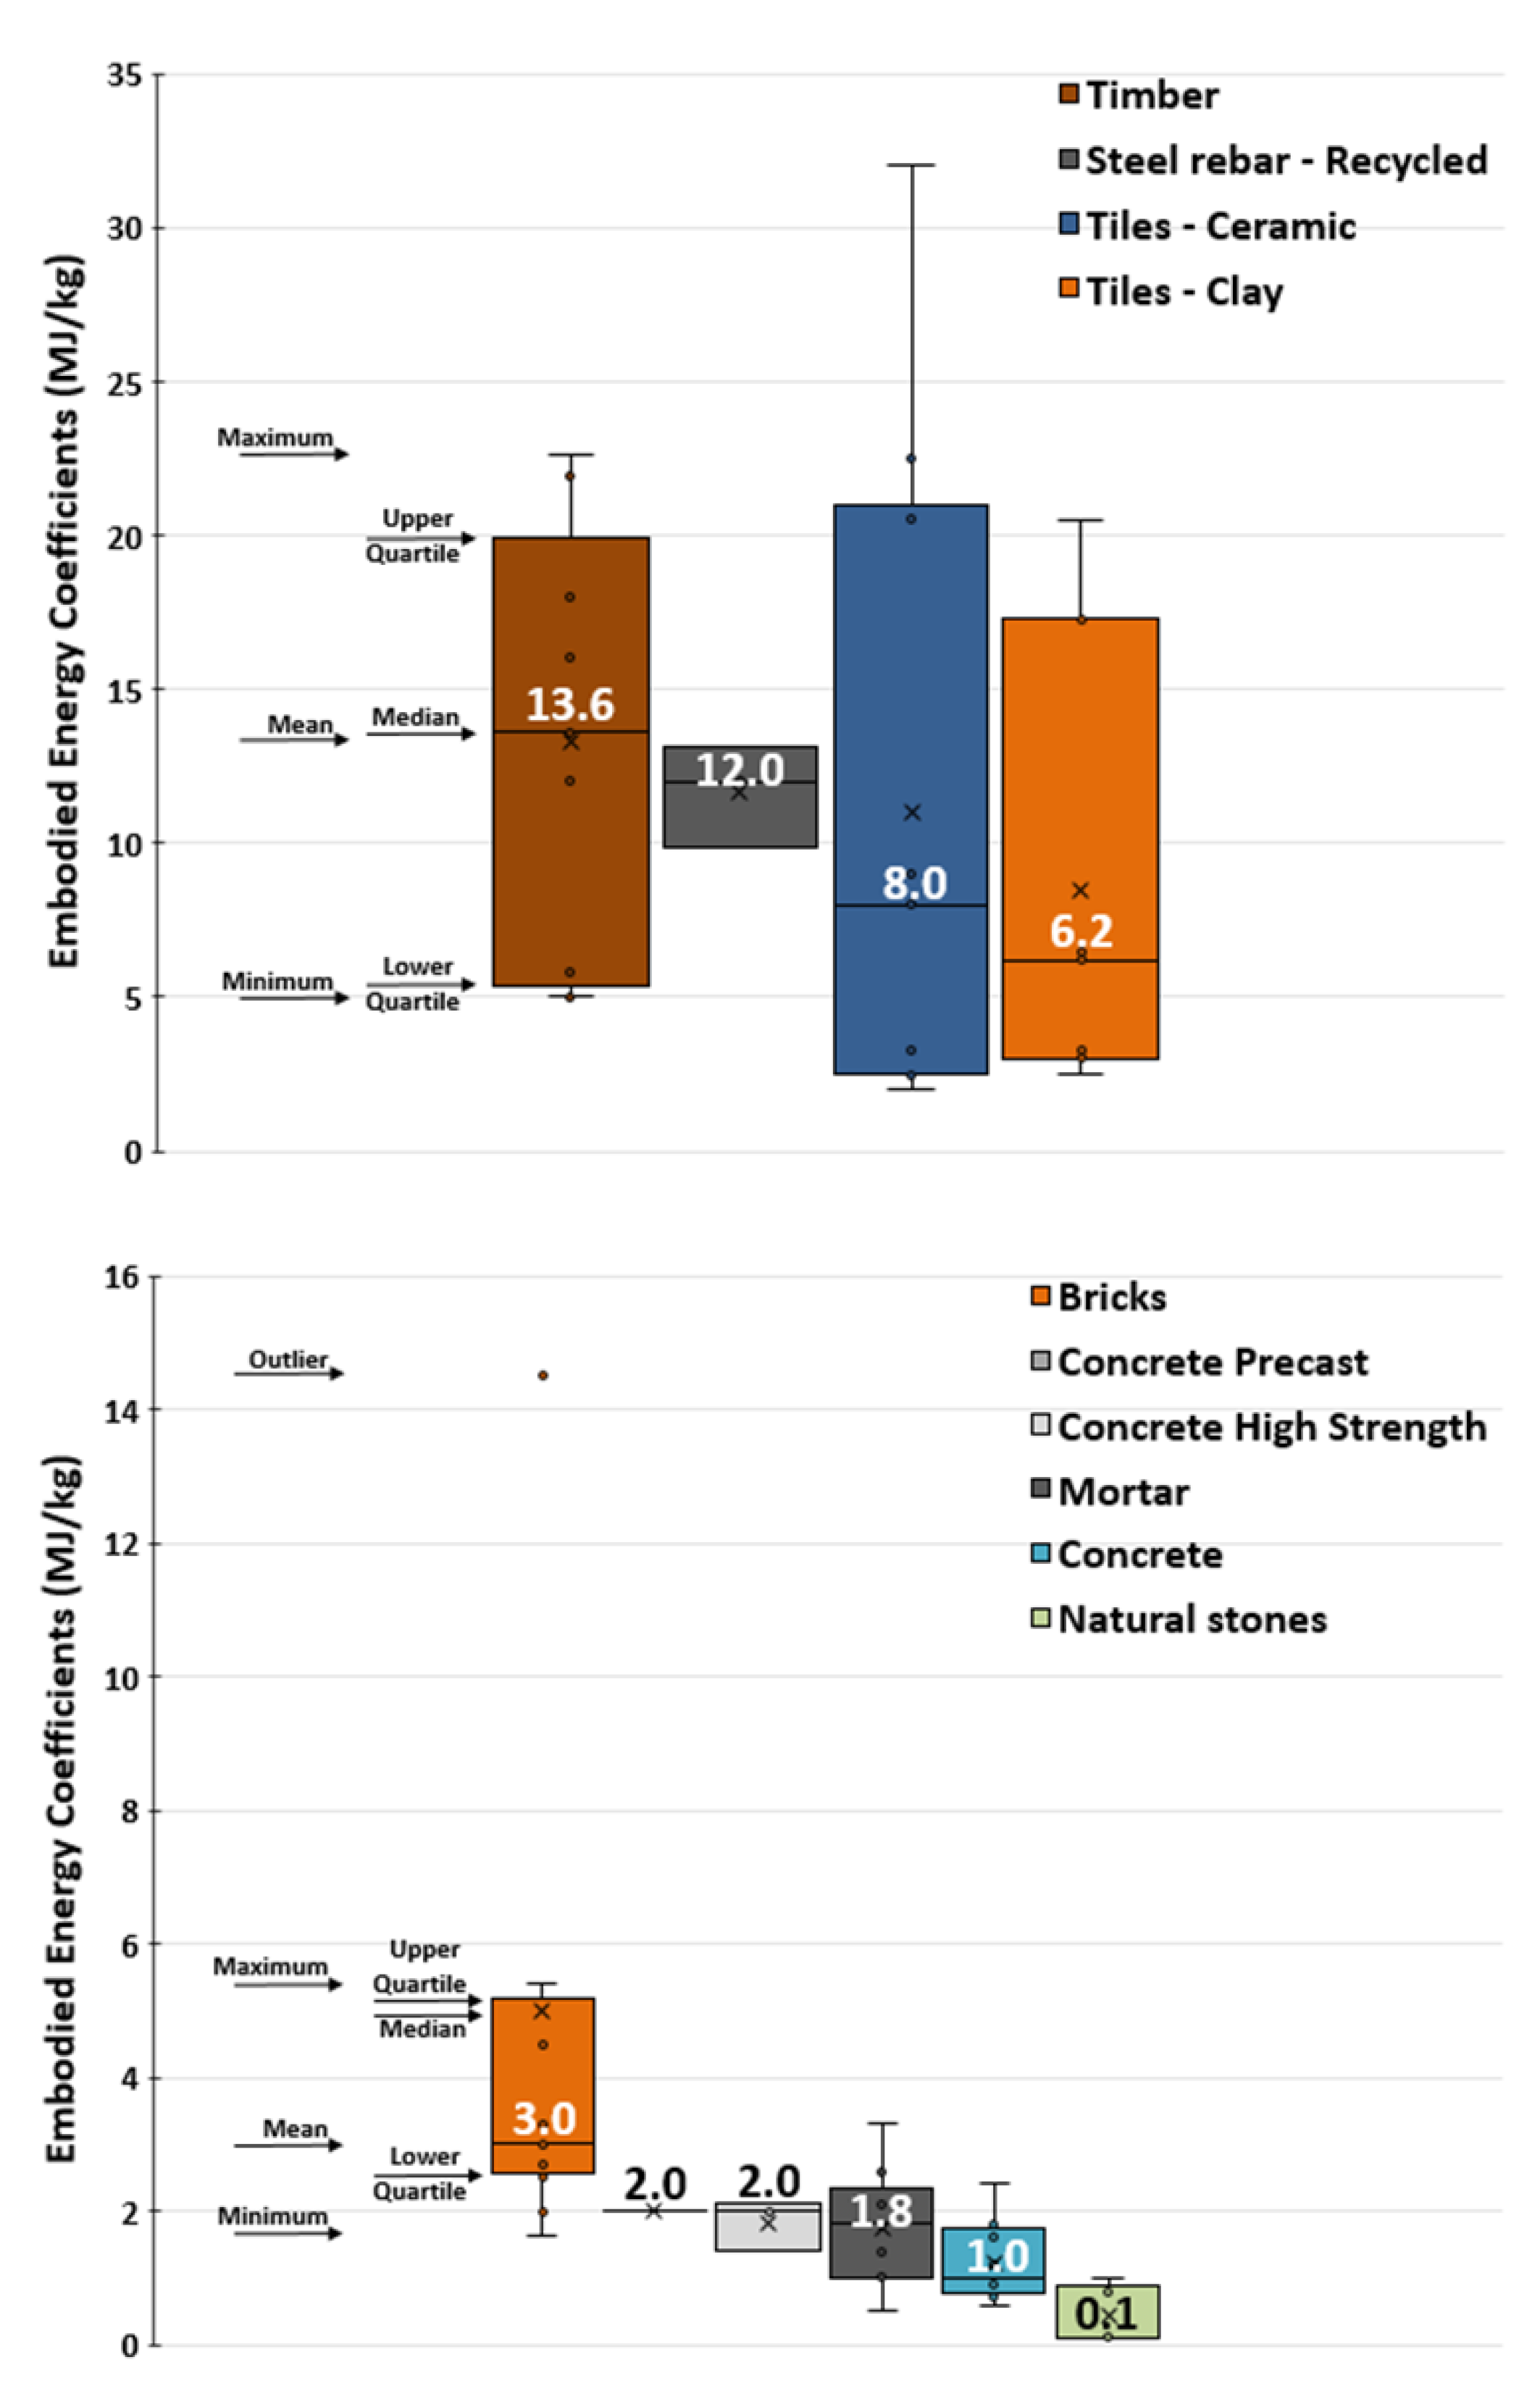
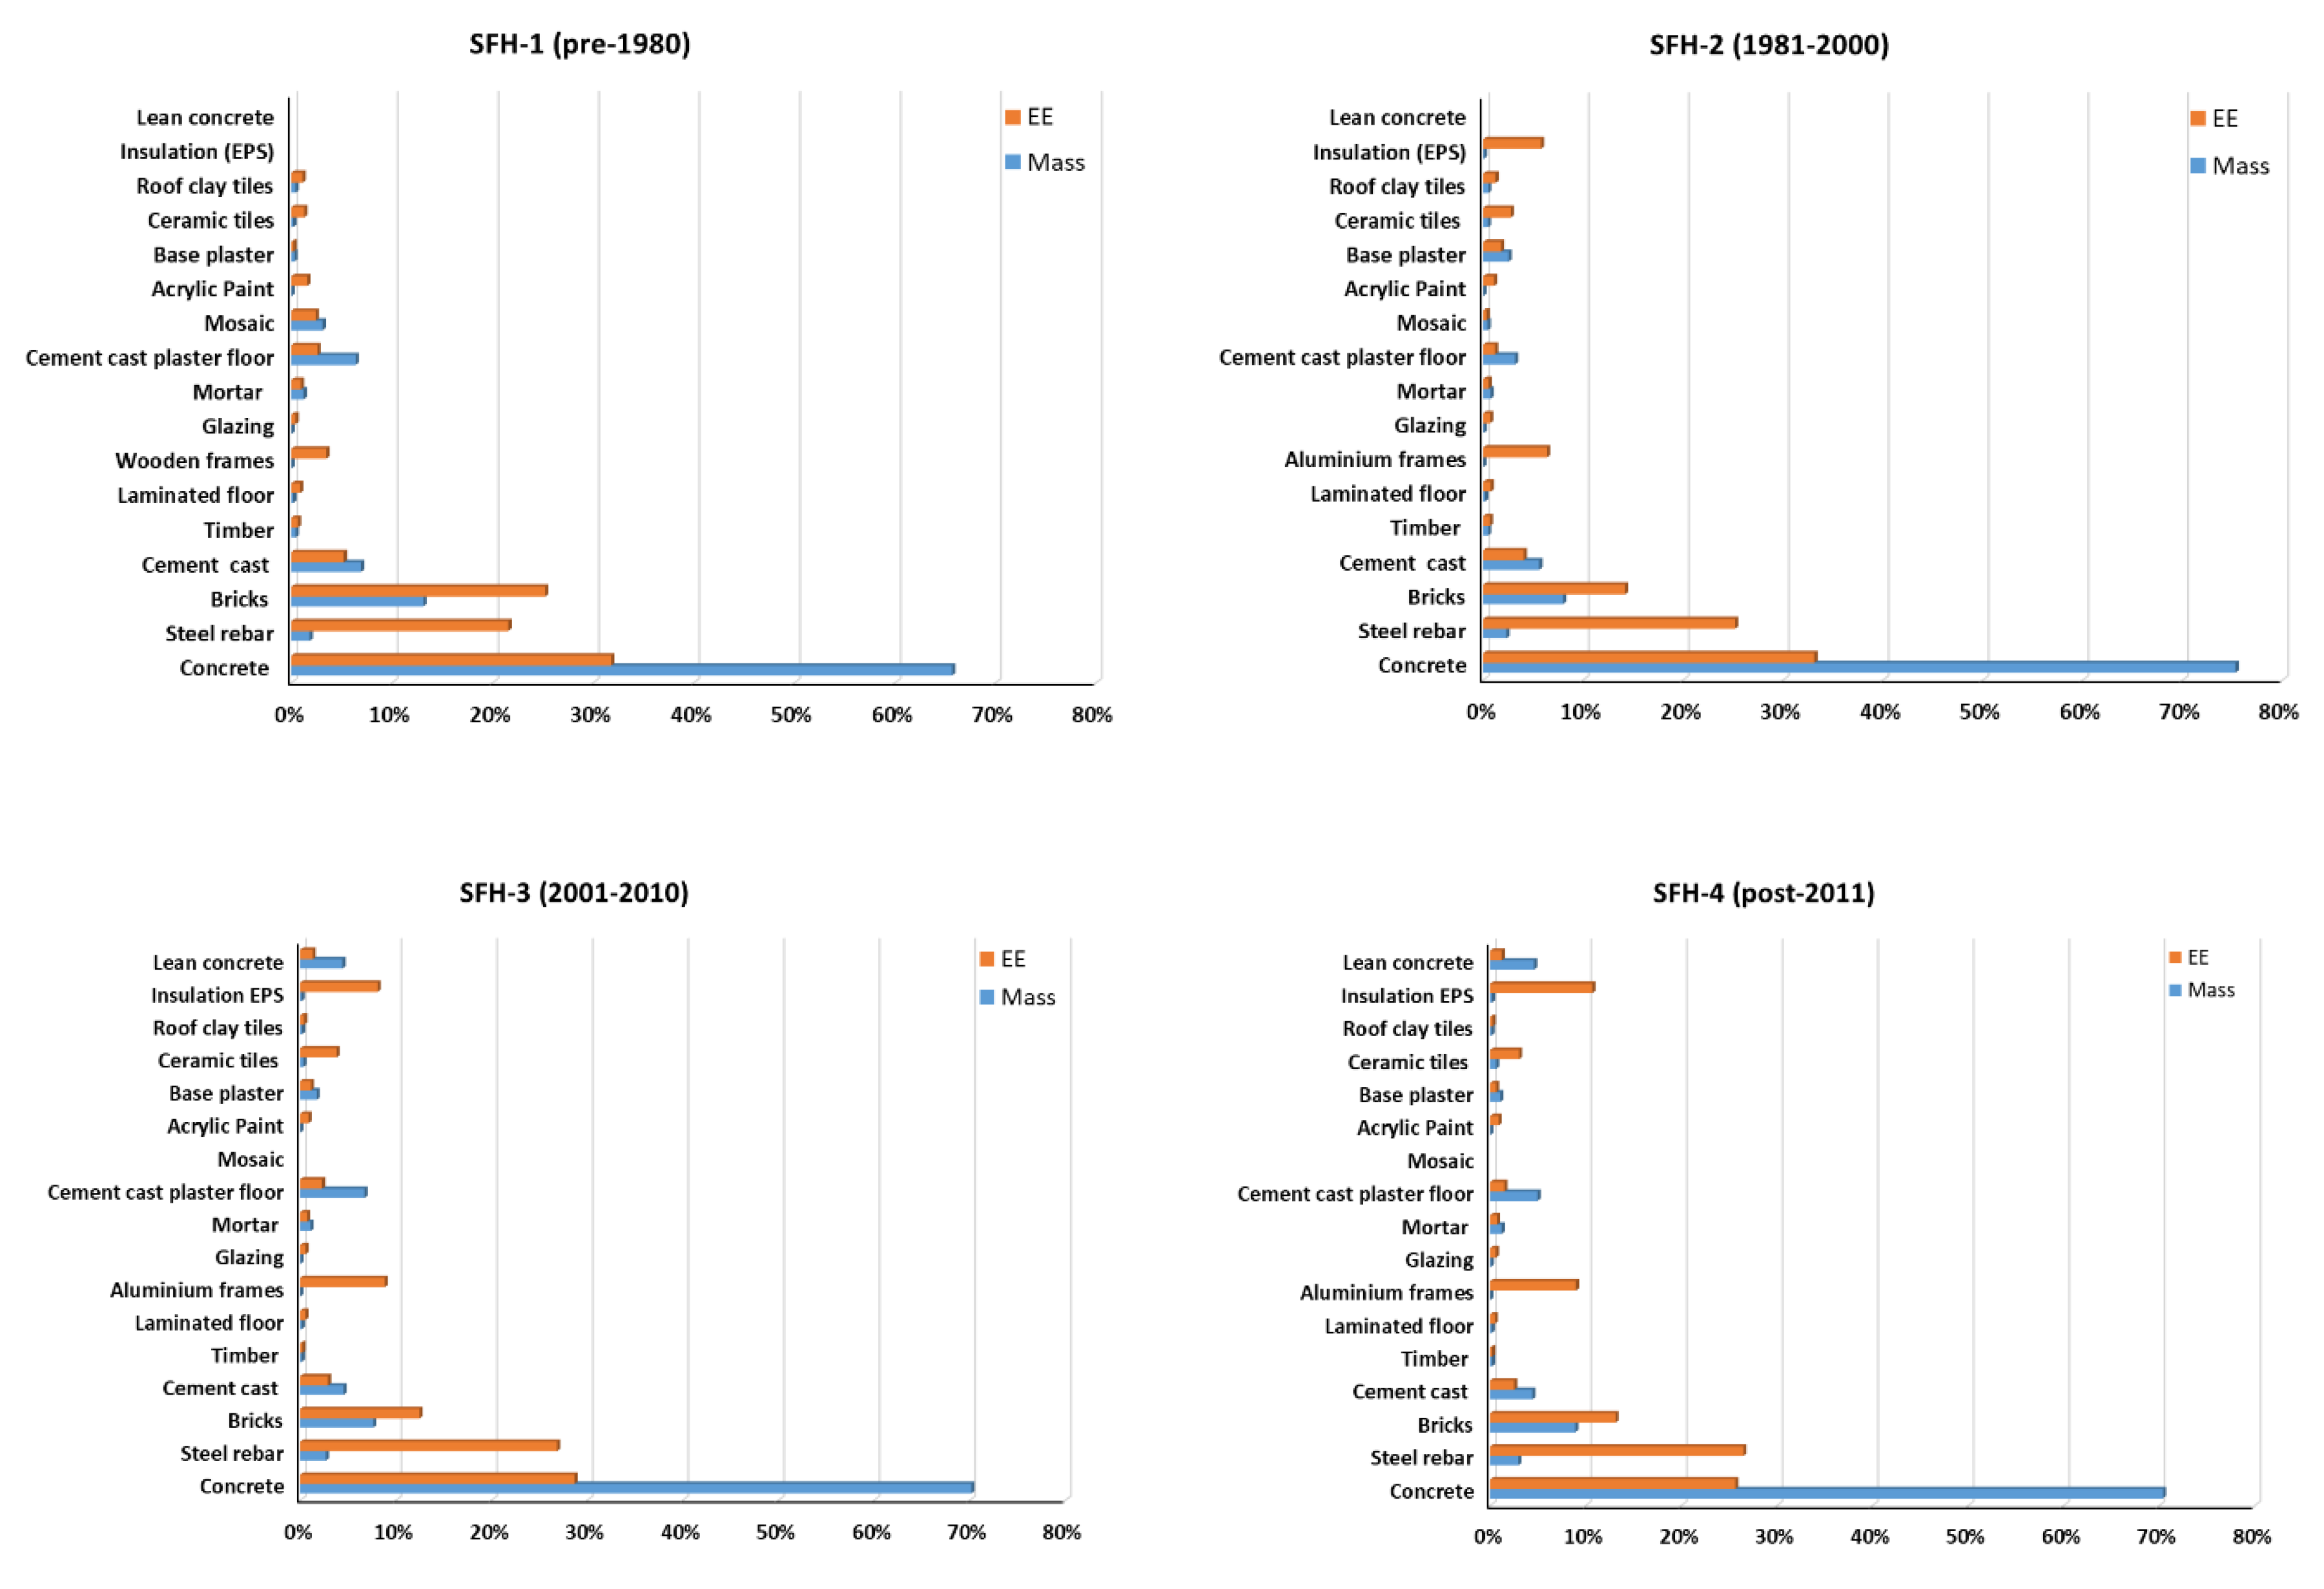
1.1.3. Building Materials

European residential buildings on an annual basis use about 12.1 million TJ for their operation [1], compared with an estimated embodied energy in new building materials of 2.0–2.8 million TJ [18]. Over half of the total embodied energy in building products is accounted for by steel (27.0%) and aluminium (23.9%), followed by concrete (16.5%), timber (11.6%), bricks (10.0%), glass (4.1%), copper (3.7%), aggregates (1.0%), insulation (0.9%), stone (0.6%), and clay (0.5%) [18].
The most common building materials are cementitious products, cement, wood, steel, asphalt, and brick that have different environmental footprints [40]. About 20–25% of cement is used in reinforced concrete (stone aggregates and cement as binder) and a comparable amount in mortar (sand particles and cement) that is prepared on site and used to fill the gaps between building blocks (e.g., bricks, concrete masonry units, stones) or plastering.
Among metals, the most energy intensive production processes per unit mass are for the production of aluminium [33] and steel [32]. Recycled metals have a significantly lower embodied energy, but even in this case, they have a higher EE compared to other materials [18]. On a positive note, about half of the European steel production is made from recycled scrap.
The production of thermal insulation materials is also energy-intensive, resulting in a high EE per unit [31,41]. On the other hand, thermal insulation materials play a key role in reducing heat losses through the building envelope (e.g., walls, roofs, load bearing structure) and reaching high energy performance in new and renovated buildings. As a result, considering the significant energy savings resulting over the buildings’ lifetime, they outweigh the materials’ cradle-to-grave impacts by 3.8 to 270 times [18]. In Greece, there are several manufacturing facilities for the production of various types of insulation materials, including polystyrene, stone wool, etc. Previous national studies have used values of 80.8 MJ/kg for expanded polystyrene, 87.1 MJ/kg for extruded polystyrene, 24.6 MJ/kg for mineral wool, and 92.1 MJ/kg for polyurethane foam [42].
The cement industry ranks in third place as an industrial energy user and in the second place as an industrial carbon dioxide emitter in the world [43]. Cement is the most energy intensive ingredient for the production of concrete and the component that has the highest contribution to its high embodied energy. The embodied energy coefficients for cement range up to 4.5 MJ/kg clinker, which is twice as much as the 2.171 MJ/kg for cement mortar (cement and sand) and about four times that of concrete (cement, gravel, and water) with 1.105 MJ/kg [44].
Clay bricks and tiles are very common building construction materials manufactured from clay or adobe soil. Bricks are commonly used for external envelope walls and internal separation walls, while tiles are used for roof or floor coverings. The brick production industry requires large amounts of raw materials and energy use for the clay extraction, crushing, screening, water mixing, shaping with machine moulding or extrusion, drying, and finally a baking process through a long furnace that is the most energy intensive stage [34]. For glazed bricks and tiles, an additional firing process is used to melt and then to adhere the glazed finish that usually contains glass on the finished surface. The embodied energy coefficient averages 3.6 MJ/kg for ordinary bricks, 4.6 MJ/kg for ceramic roof tile, and 15.6 MJ/kg for ceramic tiles [44]. An audit of a brick production plant in Greece and a follow-up LCA provided an embodied energy coefficient of 2.1 MJ/kg for cradle-to-grave, with pet-coke being the main energy source (86%), followed by diesel-oil (11%) and electricity (3%) [34].

1.2. Hellenic Residential Buildings

In Greece, residential buildings use on an annual basis 0.185 million TJ or 27.5% of the total final energy and are responsible for 17.4 MtCO2 or 18.4% of total emissions, according to the latest available official statistics for 2017 [1]. According to the 2011 Census, there are about 6.4 million dwellings, averaging 88.6 m2 per dwelling, of which more than half (52%) were built before 1980, the year that the first national thermal insulation regulation was introduced [2].
There are about 2.99 million exclusive use residential buildings [45], of which 73% are SFH and the rest MFH (Figure 1). The most common construction materials used in Hellenic buildings are reinforced concrete (58%) and brick masonry (21%), followed by natural stone (18%) that prevails in buildings constructed before 1960 and especially in historic buildings before 1920 [45]. More information on the Hellenic residential building stock characteristics are also available in [46].
EPBD transposition in Greece was initiated with a new national regulation (known as KENAK) that came into effect in 2010 [47] and was updated in 2017, following the national cost-optimal study [48], enforcing stricter requirements for the building’s thermal protection and minimum energy efficiency requirements. Analysis of the energy performance certificates (EPCs) that have been issued in Greece documents that the existing building stock is energy inefficient, ranking below the current energy performance standards. About 34% of the residential buildings are ranked at the lowest energy class, while only 3% are ranked at or above the KENAK minimum energy code requirements [49].

1.3. Work Overview

In general, performing an LCA is a time-consuming process that requires user expertise. Furthermore, differences in national production processes, system boundary considerations etc, may result in significant deviations for some materials or systems [19]. However, the challenge that many countries face is that there is no readily available locally or nationally derived data, creating a burden on building professionals to use (or misuse) complex tools that practically lack a sense of local or national context. Therefore, it is beneficial to simplify the process for the early decision-making process in building renovation or new construction. In addition, there is a need to prioritize what may be important in terms of typical materials and quantities commonly used in representative building constructions, combined with properly adapted national or local field data. This would also allow others to focus limited resources and target production processes, materials, and systems that have the most significant impacts. This knowledge can then be used to derive easy-to-use benchmarks to help stakeholders perform a first assessment and compare results against good practices or policy makers to develop regulations with realistic minimum requirements.
The vision of the present work is to:
  • Derive benchmarks for assessing the EE of Hellenic buildings in order to inform and facilitate professionals in the early stages of design, construction, and renovation projects; assess the energy return from common renovation measures; and link relevant information to a building stock model.
  • Enhance the knowledge base on EE of building materials in Greece and enrich the national data on EE for the production of common building materials and systems.
  • Compare against international data bases and tools; gain confidence on the derived EE indicators; or identify materials and systems with high discrepancies in order to prioritize future work.
In this direction, the present work considers single-family houses that represent the largest segment (58%) of the existing building stock in Greece. Section 2 outlines the overall structure of the methodological approach. The first step is to define the typical SFH in order to identify the common construction materials, along with the assumptions for performing the operational and embodied energy calculations. The bill of materials and quantities set the priorities for the field work and the short energy audits for collecting relevant data from local manufacturing facilities. The tools used for the calculations include the national calculation engine for estimating the operational energy of the buildings, while the EE is estimated with a commonly used international tool and database that is also adapted with national data, if available from the field studies. Section 3 summarizes the main findings from the audits of local manufacturing facilities, along with other available national data for the embodied energy of materials and systems. The embodied and operational energy indicators are quantified for the different building typologies in the four national climate zones. The analysis concludes with an assessment of the energy recovery time to account for the embodied energy by the operational energy savings resulting from the implementation of energy conservation and efficiency measures. Section 4 elaborates the main findings of the work reported herein and its limitations. Finally, Section 5 outlines future work and priorities.

2. Methodology

The work focuses on single-family houses (SFH) that constitute the majority of the Hellenic building stock, considering four representative residential buildings that are organized for different tiers in terms of construction periods and location. The first step is to quantify the types of construction materials for each case study and the specific material quantities. The calculations for the embodied energy are performed using a well-known LCA software, with input data from an international lifecycle inventory database. The assessment is complemented using data from field studies collected from short energy audits of manufacturing facilities in Greece for some common building construction materials and other publicly available national data, in an effort to populate a Hellenic dataset. The calculations for the annual operational energy use for each case study are performed using the national calculation engine for assessing the building’s energy performance in the four climate zones of Greece. The results are then expressed as embodied energy intensities (EEI) and energy use intensities (EUIs), i.e., energy per unit floor area (MJ/m2), calculated for different lifetimes of the buildings. Finally, the analysis considers some popular energy conservation and efficiency measures and quantifies the time for recovering the embodied energy from the resulting annual energy savings associated with the addition of new materials (e.g., thermal insulation) and the replacement of building elements (e.g., windows) or equipment (e.g., heating systems). The overall approach and the main calculation steps are illustrated in Figure 1, and elaborated in the following sections.

2.1. Representative SFH Buildings

The main building and technical installation characteristics and other assumptions of the standalone buildings considered in the present work are summarized in Table 1. The case studies have characteristics that are common for Hellenic SFH in the different construction periods and locations, within the concept of the Hellenic typology and the building stock model for Greece [46] that is based on the European TABULA and EPISCOPE typology [50]. The buildings are organized under four construction periods (SFH-1 to SFH-4) that relate to the implementation of the different national thermal insulation regulations and the four climate zones (A to D).
The representative SFHs used in the present work have different architectural features (e.g., single- and two-storey buildings, with slab-on grade, pilotis or a non-heated basement, and with flat or tilted roof), and combine characteristic geometries (e.g., floor areas, window to wall ratios), construction materials and practices (e.g., thermal insulation of load bearing structure, different envelope thermal protection and variable degree of compliance with energy regulations), and different technical systems for heating, cooling, and domestic hot water (DHW). Accordingly, under each construction period, there are four different case-studies that refer to buildings with different number of stories, type of roof or exposure of ground floor (Table 1). As a result, the building geometries and system performances for the case studies considered here resemble the ones used in the national EPBD cost-optimal study [48]. For example, the first construction period (pre-1980) identified with SFH-1 in Table 1 includes buildings that are considered without thermal insulation and have openings with single glazing. The second construction period (1981–2000) is an intermediate period for which the SFH-2 buildings are partly insulated according to the first national thermal insulation regulation, while the third one (2000–2010) refers to the SFH-3 buildings that have full compliance. Finally, the last construction period (post-2011) refers to the SFH-4 buildings constructed under the new EPBD national regulation, which started the KENAK-era. For each building, if necessary, the description and necessary numerical values of the parameters that refer to the different climate zones (A/B/C/D) are presented in sequence if they are not the same. For example, the external walls for SFH-1 are constructed with bricks and plaster and the corresponding areas for the four case studies are (68/77/77/68 m2) and have no thermal insulation. For SFH-4, the walls have the same construction and wall areas (114 m2), but the thermal insulation material is different for the four climate zones (A/B/C/D) to comply with the minimum code requirements with a thickness of (4/5/6/7 cm), respectively. The BoMs includes interior walls and doors, while all building surfaces are painted. At this stage of the work, the embodied energy calculations do not include internal kitchen or bathroom accessories. In relation to the E/M, installations include only the boiler in all case studies and the solar thermal collector for DHW production in SFH-4.
The assumed lifetime is an important parameter since it influences the operational energy of a building and the recurrent embodied energy as a result of the maintenance needs for some building elements and systems that depends on their respective lifetimes. Referenced values used in the literature vary significantly from 50 to 150 years [13].
The lifecycle analysis in the cost-optimal studies are performed with an estimated 30-year lifetime for residential buildings, in order to secure consistency in the comparative methodology. However, this may not be representative for Hellenic buildings and generally speaking for the European building stock. According to national and European statistics, a building lifetime of 50 years is more realistic, representing about 41% of the existing Hellenic buildings [45] and about half of the European buildings [23]. Furthermore, based on empirical data, the median lifetime of Hellenic dwellings is 70 years and for European dwellings is 125 years, with a renovation cycle of 30 years and 40 years, respectively [51]. Accordingly, a sensitivity analysis has been carried out to study the influence of building service lifespans over 30, 50, and 80 years on the relative significance of embodied energy and total lifecycle energy.

Bill of Materials

The construction period of the buildings facilitates the identification and quantification of the typical materials that reflect the common construction practices used in each case study and architectural features (e.g., one- or two-story buildings, slab on grade, or pilotis) of the buildings. To a certain extent, the construction period and location of the buildings in the four climate zones also relates to the more detailed requirements of the national seismic design code and its periodic revisions that define how structures are designed and constructed to limit seismic risk. This consideration mainly impacts the amount of steel bars used in the reinforcement of the load-bearing structure.
According to the national Building Census [45], the most common construction materials among the existing building stock are concrete (57.7%) and bricks (21.5%). Since the 1980s, concrete has dominated construction from 70% in the earlier decades to about 95% for new constructions. Stone (17.6%) is also popular for single-storey buildings constructed before the 1960s and is very limited in new traditional style constructions, especially in islands and rural areas.
This step serves an additional purpose. Relevant information can be used to identify the most common materials and define the priorities for progressively collecting national data, focusing on the most common construction materials with large mass quantities in representative buildings. However, the prioritization will also need to account for the embodied energy coefficients (i.e., energy per unit mass) since for the embodied energy assessment, it is necessary to consider the product of material mass with its EE coefficient. For example, the resulting embodied energy for large quantities of a given material multiplied with a low EE coefficient would result in a low embodied energy that may not be of importance. On the other hand, small quantities of another material with a high EE coefficient would result in a high embodied energy and rank higher on the need for collecting and using national data. The output of this step can also be used to establish general criteria to simplify the inventory analysis by focusing on the most significant building elements [52]. This approach is adapted by the Spanish LCA regulation for which the lifecycle inventory analysis focuses on representative building elements [53].
The main calculation steps are summarized by Equations (1) and (2). The bill of materials (BoM) and their respective quantities (kg) constitute a mass-based inventory of all the materials that compose the construction elements or other building products. The information can also be organized in the main building elements, for example, foundations, load bearing structure, facades, etc. The specific material quantities were estimated by multiplying the material density (kg/m3) with the volume of each building element (e.g., wall, roof, floor, pilotis) with the same construction (Equation (1)). Next, the value of the embodied energy for each constituent material was calculated by multiplying its specific mass with the material’s embodied energy coefficient (i.e., MJ/kg). As shown in Equation (2), the total embodied energy is the sum of all the construction materials used in the various building elements and products, divided by the floor area of the building to obtain a normalized value of energy per unit floor area (MJ/m2):
M i = ρ i · V i
E E I = i = 1 n E E C i   ·   M i A
where Mi = mass (kg) of the ith material, ρi = density (kg/m3) of ith material, Vj = volume (m3) of a building elements (j), e.g., walls, etc, EEI = embodied energy intensity that accounts for the energy used to manufacture building materials and produce products per unit floor area (MJ/m2), EECi = embodied energy coefficient (MJ/kg) of ith material, i = building construction material like bricks, concrete, glazing, mortar, steel etc, n = number of different building construction materials and products, A = heated floor area of the building(m2).
Embodied energy coefficients from eleven public sources with cradle-to-gate data are summarized in Figure 2. The specific numerical values and detailed references are presented in [29]. The scales of the y-axis in Figure 2 for the different group of materials are purposely different so that the whisker plots can display in detail the data distribution through their quartiles. The median value of the coefficients is included inside the box for each material. The width of the box shows the interquartile range between the lower 25th and the upper 75th quartile, which in most cases illustrates a large data spread out. The observed differences may originate from discrepancies in the boundary definition used in the calculation method, the national origin of the data used in the analysis, the differences in production processes that may be relevant for some materials or products, etc. As a result, some claim that since the reported embodied energy coefficients vary so much across among various studies, it may not be appropriate to simply adopt these values and use them for national calculations or comparative studies [10].
Apparently, it is always preferable to use, if available, local or national data. Furthermore, for some materials, the large variations (e.g., aluminium, insulation, tiles) or the outliers (e.g., glass, bricks) point to the ones that as a priority and progressively can initiate efforts and start collecting relevant data on a regional or national basis. For materials whose published values are rather consistent, one can use then with higher confidence in national studies, in the event that better quality data is not available.

2.2. Embodied Energy

In the present work, the system boundaries include the initial and recurrent embodied energy. The cradle-to-gate production stage is assessed using an LCA tool and is also calculated using data collected from field studies for several construction materials. For cradle-to-site, the calculations account for only the average transportation to the construction (building) site. For the recurrent EE, the use stages account for different lifetimes of the equipment that are replaced to a better condition (e.g., replace single- with double-glazing openings to reduce heat losses).

2.2.1. LCA Tool and LCI Database

The EE calculations were performed using the SimaPro life cycle assessment software package, which is one of the most popular and common LCA tools [54] with the EcoInvent v3.4 LCI database [55]. The inventory data was complemented with new information collected from field studies on the production processes of some commonly used materials that were performed during this work, to compile a Hellenic database.
In this work, embodied energy calculations were performed following the cumulative energy demand that is considered an impact category indicator under LCIA [56]. This approach investigates the primary energy use through the lifecycle of a material or a product. The energy content is quantified for non-renewable energy resources used directly or indirectly throughout the production stage, e.g., from the extraction and transfer of the raw materials to the production of the final product (cradle-to-gate). This is a standard approach implemented in EcoInvent [57] using the higher heating values for the various fuels.

2.2.2. Field Studies and Data Collection

In Greece, relevant studies that have collected and analysed field data on the embodied energy of locally and nationally manufactured construction materials or building products are limited, while environmental product declarations are practically not existing or not disclosed. Previous sporadic efforts have attempted to fill in this gap of knowledge by providing field data for thermal insulation materials [31], boilers for heat production [35], air-conditioning split units [30], etc.
In this work, short energy audits were performed at local facilities that produce some commonly used construction materials, for example, concrete, cement, bricks, plasters, etc. The data collection process followed a process-based analysis. The raw material quantities and energy carriers were recorded at each stage of the material’s or product’s manufacturing processes. The data were then processed and used to calculate the embodied energy coefficients for the respective material or product. The analysis is performed from the extraction of raw materials to the manufacturing of the final product (cradle to gate). Given that this is a time-consuming process, the campaigns were targeted to manufacturing facilities of common building materials, based on their ranking and use in Hellenic buildings. However, one needs to also take into account accessibility to these facilities and willingness of the owners to provide the necessary information.
Furthermore, a detailed national literature survey on technical papers or EPDs revealed limited information for some additional construction materials. For the materials that there was no published Hellenic data (11.in total), the SimaPro tool was used to complement the available information and generate cradle-to-gate embodied energy coefficients. The cumulative energy demand was calculated using the Hellenic fuel mix for generating electricity as follows: coal 33.16%, oil 10.83%, natural gas 26.6%, renewables 29.01%, and wastes (non-renewable) 0.40% [1]. All the results were then compiled in a Hellenic dataset that was used to investigate how they differentiate against the data from the EcoInvent database that reflect average European production processes and fuel breakdown for electricity generation. This comparison allows one to gain a better insight on how well the (default) values from the LCI database compare with the Hellenic dataset and quantify the potential differences that may be anticipated for estimating the initial and recurrent embodied energy.

2.3. Operational Energy

The annual operational energy use is calculated for the 16 building typologies. This offers the opportunity to consider different building construction materials, types and system performances that resemble the different groups of the existing building stock. The calculated values are then adapted using empirically derived factors in order to get more realistic estimates of the actual operational energy use.

2.3.1. Calculations

The building’s energy demand and use are estimated using the official national software (TEE-KENAK) that was developed by the National Observatory of Athens for the Technical Chamber of Greece (TEE) in Athens, Greece for EPBD compliance [47]. The calculation engine is in accordance to the European standards (e.g., EN 13790:2008) for estimating the building’s energy demand using the quasi-steady state monthly method. The software incorporates the relevant national technical libraries, weather data, and other technical specifications outlined in four supporting national technical guidelines. The calculation engine is used for issuing the energy performance certificates (EPC) and it is mandatory for assessing the energy performance of buildings of new and renovated buildings in Greece for obtaining a building permit.
The calculations are performed for standard conditions using specific assumptions and default values that are defined in the national EPDB regulation (KENAK) and the four technical guidelines. The main calculation assumptions are summarized in Table 1. The national regulation defines four climate zones [47]. Zone A in the south includes most of the Hellenic islands and part of the mainland and is characterized by mild conditions, with a median of 856 heating degree days (HDD) and 2579 cooling degree hours (CDH). Zone D in the north parts of the mainland has the coldest conditions, with a median of 2420 HDD and 929 CDH. Finally, the primary energy conversion factors are also defined in the national regulation at 2.9 for electricity, 1.05 for natural gas, and 1.1 for oil, and these values have been adopted in the calculations performed in this work.
The selection of the TEE-KENAK as a tool, instead of a simulation tool, is intentional in order to integrate the concept of embodied energy in the overall approach and the calculation commonly used in Greece. This is the tool utilized by engineers, architects, and energy auditors for the assessment of different ECMs or EEMs that support their specific recommendations during building renovations and issuing an energy performance certificate. The same tool is regularly utilized by professionals during a new building design to confirm that the building’s energy performance complies with the minimum code requirements and thus obtain a building permit.

2.3.2. Adaptation for Actual Energy Use

It is well recognized and documented in the literature that there is a gap of calculated vs. actual energy use [58] that hinders the realization of the anticipated energy savings as a result of various factors and different strategies [59]. In the present work, the calculations of the actual energy use are performed using the official calculation engine assessing the energy performance of buildings. Although the tool is well tailored for issuing EPCs, it is not suitable for predicting the actual energy use [58]. The gap of calculated and actual energy use is to be expected since the standardized calculations are performed for specific operating conditions [47]. For example, the daily use of space heating is for 18 h for the entire floor area of the dwelling, with an indoor set-point temperature at 20 °C (Table 1). On the other hand, the actual operating conditions are different. Based on information from a national survey [60], only 11% of SFH use their heating system continuously, while almost three-quarters operate their systems for less than 8 h during a typical day. Furthermore, only 7% of the houses heat their entire dwelling, since most are trying to isolate rooms that are not being used in order to reduce the operating cost.
To handle these deviations and adapt the calculated values to obtain more realistic estimates, the current work considers a simple and effective method that has been derived using data collected during the energy performance certification of buildings [58]. The EPCs in Greece are centrally issued and automatically stored in an electronic registry maintained by the Hellenic Ministry having jurisdiction. The EPCs may optionally include the actual energy use of the audited building. This is valuable information since it can provide a key for unlocking in a practical manner the relationship of the calculated with the actual energy use. Since the actual energy use from the utility bills is voluntary information, a very limited number of issued EPCs of about 3% of the total include the actual thermal and/or electrical energy use [49].
The adaptation factors are defined as the ratio of the actual to the calculated energy use from the available EPCs [58]. The analysis requires an elaborate data processing of large data sets, complemented with a comprehensive data quality control and screening, along with an elaborate manipulation for organizing the derived factors for different building typologies, e.g., building use, construction periods and location. The adaptation factors are used as multiplies for correcting the calculated energy use intensities (Equation (3)) to derive more realistic values that resemble actual energy use:
E U I a , k = E U I c , k · f k
where EUIa,k = adapted energy use intensity (MJ/m2) for the kth tier, EUIc,k = calculated energy use intensity (MJ/m2) for the kth tier, fk = adaptation factor (e.g., from Appendix A) of the kth tier of the buildings for the four locations (climate zones A-D) and the four construction periods (e.g., pre-1980).
The intent for this step in the present work is not to validate the calculation tool. This approach has been derived and implemented in order to easily adapt the tool calculations to more realistic estimates of the buildings’ actual operational energy. Over time, more certificates are being issued and the EPC database is enhanced. This allows to periodically update the derived adaptation factors, gain more confidence on the available data, and cover the Hellenic building typologies. The recently derived adaptation factors used in this work are summarized in Appendix A for the different building tiers, in terms of their location related to the four climate zones (A-D) and the four construction periods for the different construction periods.

2.4. Renovations

Beyond the initial embodied energy that remains the same throughout the lifetime of a building one needs to also account for the additional recurrent EE as a result of the new materials that will be added and systems that will be used to replace existing ones during building maintenance or energy renovation works [10]. Building renovations are necessary in order to maintain or even improve its performance with time. One can consider and select among different ECMs for the building envelope and EEMs for the technical installations and building services. Replacing obsolete windows or an old and inefficient boiler as a result of routine maintenance, installing wall or roof thermal insulation or a solar collector for DHW during an energy renovation, will reduce a building’s operational energy use. At the same time, though, the installation of these additional building materials or equipment will influence the energy use in other lifecycle phases of a renovated building [61] and increase its total embodied energy.
The number of cycles for the recurrent EE is determined as a function of the service lifetime for different building construction materials (e.g., roof tiles), elements (e.g., windows), equipment (e.g., boiler, radiators) etc, which in turn depends on maintenance needs (e.g., painting or plastering surfaces) and actual use [10,62]. Typical values are summarized in Table 2. These time periods are expressed in years after the initial installation during which their functions and properties are in accordance to the minimum acceptable values when routinely maintained.
Furthermore, these cycles for the recurrent EE will also depend on the building lifetime (e.g., 50 or 80 years). For example, a heat production system that has a service lifetime of 20 years, will be replaced twice if the building’s lifetime is 50 years. Likewise, there will be four cycles if the reference study period for the building extends to 80 years.
Beyond maintenance, there are several opportunities to significantly improve a building’s energy performance, including renovation works and upgrades of its envelope, equipment, technical installations, and other services. Common ECMs or EEMs include the replacement of single- with double-glazing windows, the replacement of the heat production system that may also be combined with a switch to other energy carriers (e.g., from heating oil to natural gas or the use of heat pumps, the installation of solar thermal collectors), the installation of roof thermal insulation and for non-thermally protected buildings to add wall thermal insulation, etc. More aggressive and combined measures can upgrade an existing building to higher energy standards towards nZEBs. For example, a typical Swedish residential building constructed in the 1970s with 716.4 MJ/m2 primary energy use can be renovated to the passive house standard with 169.2 MJ/m2 by adding thermal protection, external cladding, and replacing windows [61]. As a result, the share of the embodied energy to the total operational energy savings can range from 12% to 21% over a lifetime of 50 years.
The installation of new equipment increases the building’s embodied energy if one accounts for the energy used to manufacture the unit. Popular EEMs include the replacement of the heat production systems for central heating and the installation of flat solar collectors for DHW production. Small- and medium-sized boilers manufactured in Greece average an embodied energy per unit thermal capacity of 65.8 MJ/kWth for steel and 119.1 MJ/kWth for cast iron boilers, or per unit mass at about 26 MJ/kg [35].
Solar thermal collectors are among the most popular systems for exploiting solar energy and they are widely used for the production of DHW throughout the world, and in some countries for space heating with solar combi systems. The embodied energy of flat-plate solar thermal collectors based on information from several European studies averages 1.7 GJ/m2 of collector area [63].

3. Results

The elaboration of the results follows a similar structure with the presentation in Section 2. The first subsection summarizes the results for the BoM for the 16 case studies. The second section documents the findings from the field work and the short energy audits to derive the embodied energy coefficients used in the present work and the comparison of the Hellenic data with the EcoInvent database. The calculated EEIs are then summarized for the 16 representative buildings considered in this work. The specific EUIs are also calculated and the results adapted to estimate the actual operational energy use for the different case studies. A sensitivity analysis is performed for the 16 representative SFH located in the four national climate zones, considering a 30-, 50-, and 80-year building lifetime.

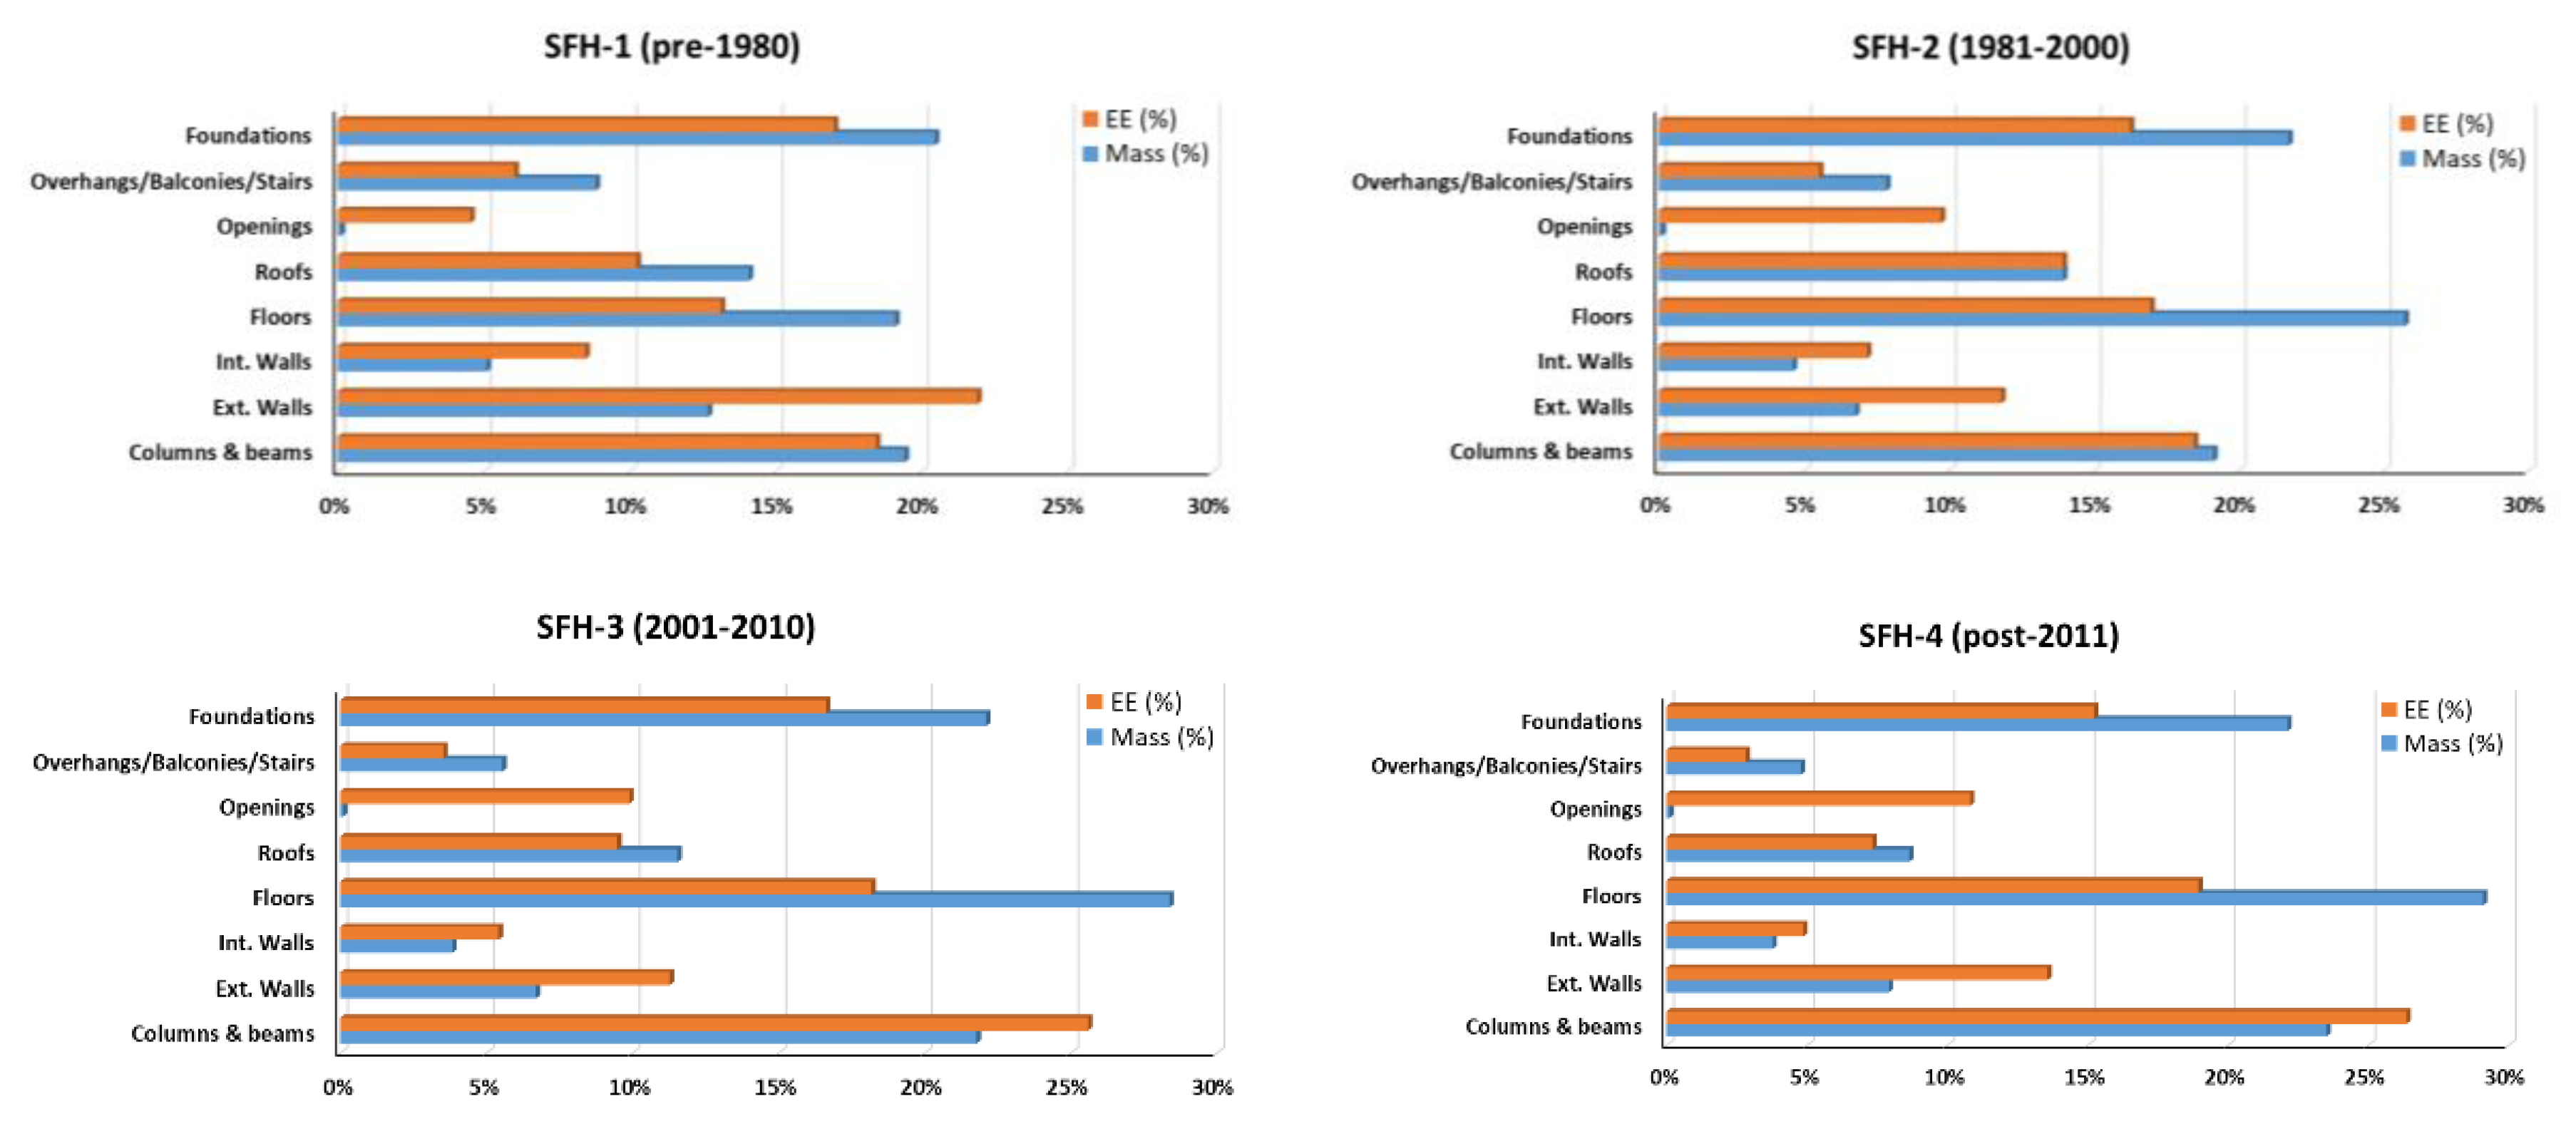
3.1. Bill of Materials

Figure 2 illustrated the deviations of available information for the embodied energy coefficients of various common construction materials from different data bases. This practical information can be used to visualize and prioritize the materials for which there is overall general agreement among different data bases. This way, one may have a first direction of where to focus and what materials to consider first, in order to start collecting relevant data, if possible. When the mean (marked with “x” inside the box plots in Figure 2) is very close to the median value (the 50th percentile horizontal line and numerical value inside the box plots in Figure 2), the available data are normally distributed. Otherwise, the numerical value of the median that is shown inside each box is more representative and may be used especially for materials that the available data are skewed or for the ones that they include outliers. For most materials (e.g., thermal insulation, tiles, bricks), the values above the median are more spread out or the upper whisker is longer than the lower, which means that the distribution is skewed toward higher coefficients. For others, e.g., aluminium, the data distribution is symmetric around the median, which is illustrated by the median value that is centered in the box between the upper and lower quartiles and the two whiskers have similar length. The outliers are identified when their values deviate by 50% from the interquartile range, e.g., aluminium-virgin, insulation, glass, bricks. Outliers may indicate materials with high data variability under special or local conditions that may also deserve special attention, if they are not in error.
The embodied energy intensity depends on the type and the quantities of the various construction materials. The detailed calculations were performed for all 16 case studies. The results are summarized in Figure 3 as average values for the four construction periods. The total mass quantities of all materials normalized per unit floor area of the representative buildings range from 2123 kg/m2 to 4643 kg/m2. In all construction periods, the prevailing materials are concrete and bricks that average 72.6% and 9.4% of the overall building mass, respectively. The share of plasters averages 13.1% of the building mass, and steel rebar about 2.4%. For some material, there are significant variations among the construction periods. For example, mosaic averages 3.1% in pre-1980 and drops below 0.5% in 1981–2000 buildings, while thermal insulation material start at a low 0.08% in 1981–2000 buildings and reach 0.19% in post-2011 constructions.
Another way to look at the results is by aggregating the various material quantities used for the main structural elements of the buildings. Figure 4 illustrates the average material quantities for all the case studies that correspond to the four construction periods. The load bearing structures (i.e., foundations, columns and beams, roofs, floors) dominate with about 73% to 84% of the material quantities, which is expected for complying with the national seismic design code.

3.2. Hellenic Dataset

The compiled Hellenic dataset with the derived material EE coefficients includes 28 entries that cover a representative range of building construction materials that are used in Hellenic buildings. Most of the information is based on the data collected from the field surveys during this work. In some cases, supplementary national data from the literature was used to compile the results derived using the SimaPro LCA software [54] and complemented by the EcoInvent LCI [64], where necessary. The main results for the derived embodied energy per unit mass (MJ/kg) of various materials for the cradle-to-gate processes are summarized in Table 3, along with an overview of the production processes at the facilities considered during the field work and the other available public resources.
The values derived and presented in Table 3 are mostly within the range of cradle-to-gate embodied energy coefficients published in various European databases [65]. Comparing these values against the ones from EcoInvent provide some insight on anticipated impacts and differences from using the different data. The differences range from +55% for stone wool insulation to −137% for cement base plaster. Part of these differences are due to the specific primary energy conversion factors that are used for electricity (e.g., 2.9 in Greece) and the fuel mix accounted for in EcoInvent LCI. In some cases, there are different manufacturing processes. For example, in Greece, the production of cement mortar and base plaster uses limestone sand, while the production process described in EcoInvent LCI considers the use of silica sand that is a more energy-intensive process. Similarly, in Greece, the production of steel rebar uses mainly scrap material, whereas the production process in EcoInvent LCI is mainly based on 84% raw steel that demands larger amounts of energy. On the other hand, considering the energy intensive production process of aluminium and the high electricity consumption, the derived EE coefficient is higher since the calculations in EcoInvent LCI are based on a fuel mix for electricity generation mainly from hydro.
The available national data or EPDs that refer to the production of insulation materials is limited. The value listed in Table 3 refers to stone wool. However, during the follow-up calculations for the case studies with insulated building elements, the material considered refers to extruded polystyrene since this is the most commonly used material in Hellenic buildings. The value used for the calculations was derived at 100.85 MJ/kg from EcoInvent for extruded polystyrene.

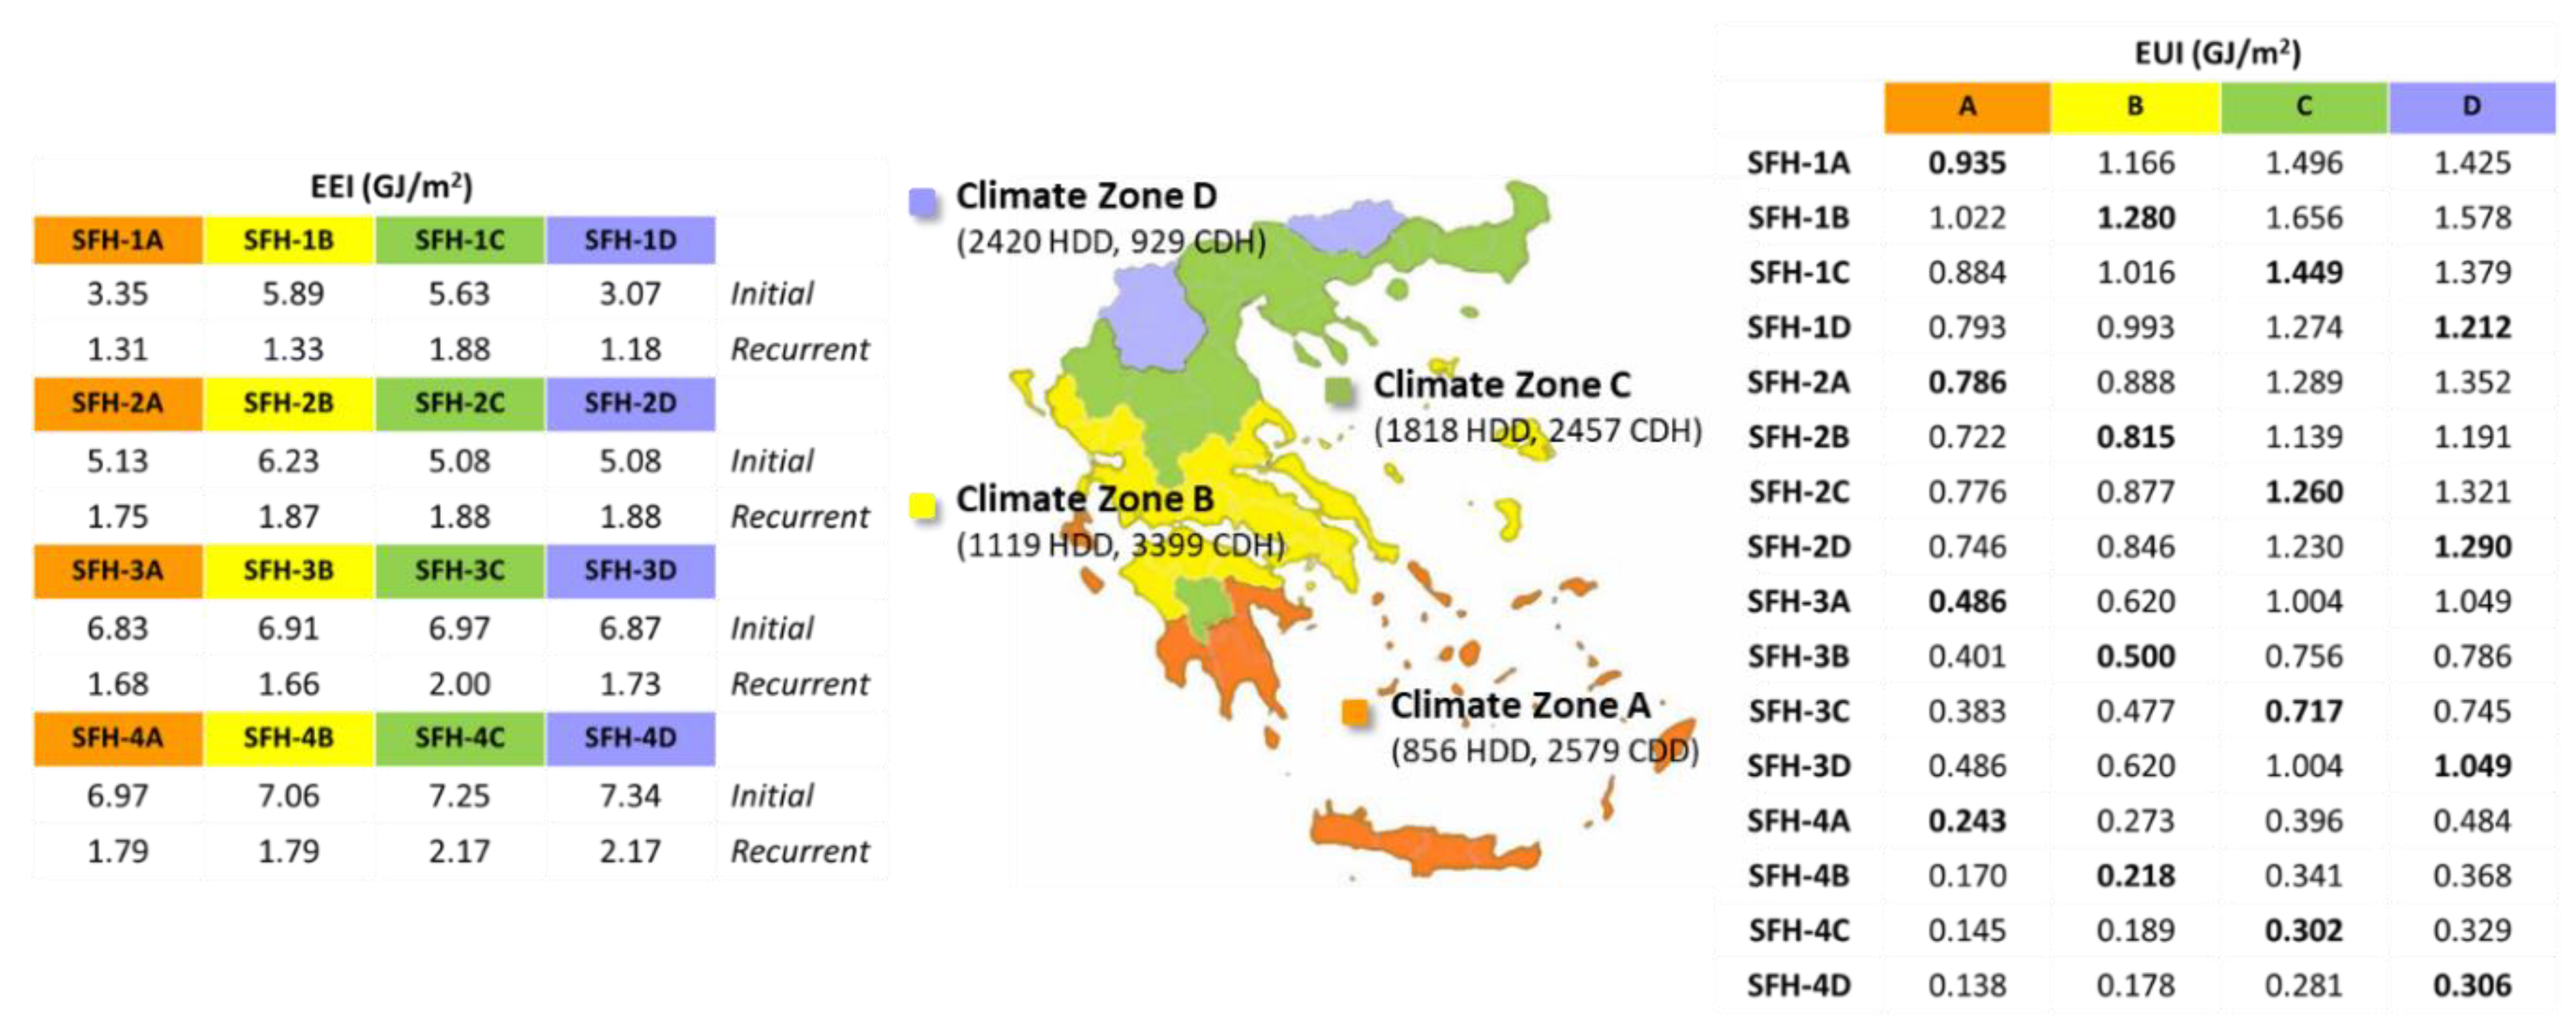
3.3. Energy Use Intensities

The annual operational energy use was calculated independently for each case study in the different tiers. The calculations were performed for each of the 16 case studies presented in Table 1 for all four climate zones (A-D). The estimates were then adapted with the corresponding correction factors that are presented in Appendix A using Equation (3). The adapted EUIs represent more realistic estimates of the actual energy use for the representative SFHs.
The resulting actual energy use intensities are summarized in the matrix on the right in Figure 5. For example, the representative building from the first construction period (e.g., pre-1980) described in Table 1 for the climate zone C is identified as SFH-1C. This corresponds to an adapted annual EUI of 1.449 GJ/m2 that is identified in bold. Similar calculations are performed as if the building was also located in climate zones A, B, and D; the corresponding results are included in the summary of the EUIs in Table 1 under the corresponding heading for climate zones from A to D. For all 16 case studies, the values average 0.570 GJ/m2 in the south (climate zone A) and reach 0.991 GJ/m2 in the north (climate zone D).

3.4. Embodied Energy Intensities

The EEI for each material was calculated using the corresponding quantities from the BoM and the embodied energy coefficients from the Hellenic dataset (Table 3). The prevailing materials in terms of their contribution to the total embodied energy of the buildings include concrete that averages 30.4%, followed by steel rebar at 25.0%, which are the materials with the largest quantities and high EE coefficients. On the other hand, although some materials may be encountered at low quantities, they may have high EE coefficients and as a result, a relatively high contribution in the total building’s embodied energy. For example, thermal insulation materials contribute by as much as 10.7% for SFH-4 buildings (Table 1), which correspond to recent construction periods with stricter thermal envelope requirements that mandate the use of more insulation. The use of aluminium window frames, which have dominated recent construction practices, may have a low mass contribution of about 0.02%, but the embodied energy contributes up to 9.1% for SFH-4 buildings.
Considering the main building structural elements illustrated in Figure 4, the embodied energy of the load-bearing structures dominates from 58.9% up to 69.9% of the total. The openings (e.g., windows, balcony doors) have a minute mass contribution, but a notable share in the total embodied energy of the buildings. The values range from 9.7% up to 10.8% since the case studies SFH-2 to −4 use aluminium frames (Table 1).
The calculation of the initial embodied energy was extended to include transportation from the factory gate to the building site, corresponding to the cradle-to-site. Accordingly, the calculations assumed an average distance of 100 km for transportation from the factory gate to the building site for practically all building products. In the case of concrete, the assumed distance was 40 km.
The results of the calculated initial and recurrent embodied energy for the different building construction materials in the 16 case studies are summarized in Figure 5. The embodied energy intensities have been calculated for each case study and remain the same for all locations. The value of the recurrent EE was calculated for different building lifetimes, but the value included in Figure 5 refers to the case of a building lifetime that corresponds to 80 years.
At this stage, the work has focused on construction materials that constitute the most significant percentage of a building’s embodied energy, and from the technical installations include only the heat generation equipment and solar collectors, where applicable. This is a reasonable first step, since previous studies have quantified that the building envelope represents most of the embodied energy compared to the other E/M installations of residential buildings, estimated at about 2460 MJ/m2 and 99 MJ/m2, respectively [67].

3.5. Lifetime Calculations

The recurrent EE is estimated for the building’s lifetime. The renovation of the building envelope (e.g., thermal insulation, double glazing) is assumed to meet the code minimum requirements that correspond to the post-2010 KENAK standards for the maximum U-values of the building components. Similarly, the renovations of the equipment and technical installations considered in this work include EEMs, like the replacement of the heat generation equipment with a more efficient boiler and the installation of solar thermal collectors for DHW. As previously noted, these renovation measures will impact the cycles for recurrent EE depending on their respective service time (Table 2) during the building’s lifetime. The annual energy savings as a result of the improved energy performance of the renovated buildings are calculated for each measure and then considered all together as a combined scenario in each one of the 16 representative buildings in the four climate zones. The calculated values for the operational energy consumption are also adapted to obtain more realistic estimates of the actual energy consumption using the derived adaptation factors (Figure 6) that correspond to the representative buildings. The results are then compared to the total EE of the various building products used in each case study in order to estimate the corresponding energy recovery time.
In all cases, the calculations of the recurrent energy were simplified to consider that the building materials or products will be replaced with others that comply with the current standards and technical characteristics. In other words, with the current approach, there is no consideration of stricter building standards and technological advances of new materials and equipment that will become available in the market during the following decades. In this case, one may reasonably expect that the building’s operational energy use may be lower in the coming decades, which would mean that the EE share would be higher.

3.5.1. Embodied and Operational Energy Use

The relative importance of the embodied energy for the 16 case studies can be significantly different. The time it will take for the adapted operational energy use to match the initial EE of the buildings, if there are no changes in construction and manufacturing practices, is quantified in Table 4 for each building. The minimum and maximum values are identified with the grey highlighted cells. The results confirm that the embodied energy is becoming increasingly important for the high-performance buildings in the south climate zones. For example, it will take over 53 years for a building from the post-2010 tier (SFH-4D) with a low annual energy use to match its initial EE, in the event that such a building would operate in climate zone A. On the other hand, the high annual energy use of an old building from the pre-1980 tier (SFH-1A) will take just over two years if it operates in climate zone C to match the building’s initial EE.

3.5.2. Energy Recovery Time

The annual energy savings resulting from the implementation of various ECMs or EEMs for each one of the 16 case studies were calculated for the different tiers. The most significant energy savings are anticipated from the addition of thermal insulation on the building’s opaque elements (e.g., walls, roof) to reduce space heating, which actually represents the highest percentage of total energy use. The addition of thermal insulation is assumed to meet the minimum code requirements of the new 2017 KENAK for the opaque elements of the building envelope. Among the most popular ECMs in existing residential buildings is the renovation of windows, although it may not be the most effective measure for optimizing the building’s energy performance [49]. The popularity of this measure is actually driven by a combination of several other factors that go beyond the improved energy performance and thermal comfort, e.g., improved aesthetics, sense of security, better acoustical comfort.
Two additional EEMs are also considered. One refers to the installation of a new boiler for space heating with a more efficient unit, and one for the installation of solar thermal collector to cover 60% of the domestic hot water demand, according to the minimum code requirements of KENAK. Each measure was first assessed individually and then all together as a combined scenario for the 12 case studies. This includes the tiers for the pre-1980 buildings and the following two construction periods, but excludes the renovation of the most recent constructions under the post-2010 buildings that would not be currently considered as cost-effective measures.
The calculated annual operational energy for each case study considered in all four climate zones were adapted for more realistic estimates of the actual energy savings and then compared with the resulting increase of the embodied energy. This is an estimate of the time it would take for the anticipated annual savings to counterbalance the invested embodied energy of the building products used for the ECMs or EEMs considered in the analysis.
For the addition of thermal insulation to the opaque building elements of the various case study buildings in all climate zones, the shortest energy recovery time of 1.1 years occurred for the SFH-1A building operating under climate zone C conditions (Table 5). However, this will stretch to over 21 years for buildings with good thermal performance from the third tier, operating in the warm, south climate zone, i.e., SFH-3A under climate zone A conditions. For windows, the corresponding periods are relatively much longer. The shortest energy recovery time of 2.3 years occurred for SFH-2D under the coldest, north comate zone D. Once again, the longest period for over 37 years would occur from a building with a good thermal performance from the third tier (i.e., SFH-3A), operating in the warm, south climate zone A that even exceeds their theoretical service lifetime of this building product. The results for the EEMs are reasonable ranging from 0.2 years up to 4.6 years for replacing the heat production unit with a new, energy efficient condensing boiler, and from 1.6 years up to 3.5 years for the use of solar collectors for DHW. Finally, the combined scenario with all the individual measures considered together for major renovations of the case study buildings would range from a minimum of 1.6 years for the oldest buildings in tier SFH-1A and SFH-1B, up to a maximum of 9.5 years, for the relatively recent constructions in tier SFH-3C buildings.
According to published results from the assessment of various ECMs under average European climate conditions, the energy recovery time ranges from 0.1 to 2.0 years for the addition of more thermal insulation and 1.4 to 2.1 years for the installation of thermal solar collectors [20]. The results for US buildings have been reported to range from around 3–5 years for old residential buildings constructed before the introduction of energy codes and 1.6–3.2 years for existing buildings in compliance with some energy codes [68].

4. Discussion

One of the main objectives of this work was to quantify and prioritize building construction materials in representative Hellenic single-family houses. The vision is to prepare for the emerging trend of lifecycle analysis of building performance and to facilitate relevant work at the early stages of the decision-making process to account for the embodied energy of building materials and products.

4.1. Hellenic Dataset

As it was anticipated, the data collection from local manufacturing facilities proved a time-demanding process. The major obstacle was that most of the time, the process stumbled on the owner’s reluctance to allow access or release the necessary data since it is considered “proprietary” information. Another obstacle is that the voluntary EPDs remain very scarce, either because they are not public information or manufacturers have not yet considered the benefits for developing EPDs and disclosing relevant data.
Overall, the availability of national and local information continues to be very scarce in Greece and other European member states. This should be taken into consideration during the development of European mandates and regulations on LCA calculations like LEVEL(s) [12].

4.2. Embodied and Operational Energy Use

The present work elaborated 16 representative Hellenic single-family houses. The estimated initial EE averages only 3–9%% of the total operational energy use over 80-year lifetime, for old buildings that are not thermally insulated, i.e., SFH-1 for the pre-1980 tier. On the other hand, the work also confirmed the relative high importance of embodied energy for high energy performance buildings reaching 18–67% of the operational energy use for the most recent tier building constructions, i.e., SFH-4 for post-2010 buildings.
The results agree with the findings from other European studies. For example, in Belgium, the embodied energy of non-thermally insulated and inefficient residential buildings represents only 4% compared to the high total primary energy use over a 30-year lifetime, while for nZEBs, the embodied energy is 50% higher than the lifetime operational energy use [67]. Similar work in the Netherlands has reported that for an average residential building construction, the embodied energy represents 10% to 12% of the total operational energy use for typical homes and reaches 36% to 46% in energy-efficient homes [69].

4.3. Renovations and Energy Recovery Time

The present work assessed some common energy conservation and efficiency measures for the renovation of existing buildings to the minimum code requirements of KENAK. The measures included the addition of thermal envelope insulation, the replacement of windows, and for the E/M installations the replacement of heat production system with a high efficiency boiler and the addition of solar thermal collector for DHW. The energy recovery time for the individual measures and a combined scenario that incorporates all of them are illustrated in Figure 6. In all cases, the replacement of windows has the longest energy-recovery time, ranging from 3.4 years up to 35 years. The adapted operational energy savings range from 0.015 GJ/m2 to 0.259 GJ/m2, while the EEI range from 0.539 GJ/m2 to 0.652 GJ/m2. On the other end, the measure with the shortest recovery period is the replacement of the boiler, averaging from about 1 year up to 3.5 years for the more recent building tier. The operational energy savings range from 0.008 GJ/m2 to 0.305 GJ/m2, while the embodied energy ranges from 0.038 GJ/m2 to 0.071 GJ/m2. The addition of thermal insulation on the building’s envelope results to annual energy savings from 0.007 GJ/m2 to 0.749 GJ/m2 and an embodied energy intensity from 0.118 GJ/m2 to 1.040 GJ/m2. The annual energy savings from the installation of solar thermal collectors to cover 60% of the DHW range from 0.053 GJ/m2 to 0.084 GJ/m2, while the EEI is estimated from 0.114 GJ/m2 to 0.214 GJ/m2. Finally, for the combined scenario of all the individual measures applied together, the adapted annual energy savings range from 0.093 GJ/m2 to 1.123 GJ/m2, while the combined EEI ranges from 0.808 GJ/m2 to 1.928 GJ/m2.

4.4. Future Work

Parallel efforts and similar analysis as the one elaborated in this work can focus on building electromechanical installations, equipment, and systems. Priority should be given to ones that are usually part of building renovations, including upgrades to higher performance equipment, the installation of new equipment that exploit renewables, etc. At this stage of the work, the service lifetime of the equipment is simply used to estimate the relevant cycles for replacing them and estimating the recurrent EE, without accounting for any improved future performance. However, beyond this quantitative assessment, it would be more realistic to also have a qualitative assessment and account for an improved performance that may also reduce the operational energy. For example, replacing a heat production system once it reaches its service lifetime would be more realistic to account for a higher thermal efficiency of a new boiler after a 20- or 40-year cycle. Technological advances that improve equipment’s performance will also have a positive impact on the building’s performance and lower the operational energy use.
The case studies considered in this work are detached single-family houses that constitute 73% of the residential building stock. A similar approach can be followed in the future for multi-family houses. Other building types, e.g., semidetached and row houses, may also be considered in the future, although detailed statistical data are not currently available for a building stock analysis. For practical purposes, the anticipated differences will be limited as a result of the slightly lower material quantities used for the intermediate load-bearing walls, and the lower operational energy use. The non-residential building sector is more difficult to handle since it is very heterogeneous, including various building typologies, functions, sizes, etc., making it more challenging to organize the available data and define the different tiers.
Future work should also consider an improved efficiency and/or primary energy factor (PEF) for electricity generation in the following decades. For example, reflecting on technological progress and the growing share of renewable energy sources in the electricity generation sector, the default European average PEF for electricity used in the European Energy Efficiency Directive (EED 2018/2002) has been lowered from 2.5 to 2.1 and will be revised every four years.
A PEF of 2.9 for electricity was considered in this work, according to the national technical guidelines that were published in 2010. Apparently, the value is outdated and should be revised with a different fuel mix for electricity generation to make more realistic future projections. As illustrated in Figure 7, the time evolution of the PEF in Greece, calculated as the ratio of (primary energy consumption + imports)/final electricity consumption, is following a dropping trend. Beyond the average historic trend line, the projections may be based on the data over the last decade, 2008–2017 (ambitious trend), to reflect more aggressive efforts towards the renewables target (e.g., >32% share of renewables in final energy use), fuel switching from lignite to natural gas, and the overall decarbonization efforts of energy transformation. Greece had recently announced a phase-out of coal-fired power generation by 2028. Even if there may be some delay as a result of the expected economic recession following the COVID-19 pandemic, these developments are of particular importance for the operational and embodied energy use, primary energy, and emission reduction, as buildings move into the era of electrification.
Future work should also account for technological advances in industry and improved production methods and more energy-efficient processes for the production of materials, systems, and other building products. More emphasis may also be placed on recycling and the use of more environmentally-friendly materials. Finally, the system boundaries should be extended to include the end-of-life stage, i.e., the demolition embodied energy.

5. Conclusions

Assessing the embodied energy of buildings during deep renovations is an emerging issue of particular importance in the era nZEBs and decarbonized building stock by 2050. However, readily available national information and data that can be used for calculations and initial benchmarking is limited in some countries. In this direction, this work has set up and implemented a methodology for assessing the operational and embodied energy of national building stocks and for providing some guidance in the design and renovation of buildings. The results can be used by professionals as benchmarks for a first assessment of similar buildings’ energy performance and how their different design solutions or renovations compare against the baselines. This preliminary insight information can also be used to customize energy conservation measures or reconsider specific energy efficiency measures that merit further consideration and more detailed analysis. The results are also of interest to policy makers that need to establish relevant baselines, set priorities and targets, and monitor progress for sustainable buildings.
As a first step, the work considered single-family houses that represent the most common building use. Short energy audits were performed in local manufacturing facilities in an effort to enhance the knowledge base on embodied energy coefficients of common construction materials in Greece. The analysis was performed using 16 case studies, representing various buildings at different tiers in terms of characteristic building construction periods and locations related to the four national climate zones. The total (initial and recurrent) embodied energy and the adapted annual energy use indicators for Hellenic SFH range from 4.26 to 9.50 GJ/m2 and 0.14 to 1.66 GJ/m2, respectively. Depending on the lifecycle of buildings, the embodied energy recovery times for major renovations as a combined scenario of various energy conservation and efficiency measures range from 1.6 to 9.5 years.
The method and accumulated data from this work is also useful for assessing other types of buildings. On-going work considers multi-family houses and representative non-residential buildings that reflect the largest percentage in terms of floor areas (e.g., offices, schools). In addition, there is a need to enhance the Hellenic database of EE coefficients with more local and national data of building construction material and system production processes. Information from the EPDs will be of great value, provided that they become mandatory in order to increase their availability. From the experience gained during this work, it is evident that the related industry in Greece has not yet adapted to the voluntary mandate for developing and releasing EPDs, while some even consider this type of data as proprietary information.
A similar approach focusing on embodied carbon or GHG emissions is also an interesting evolution. Again, efforts should optimize impacts from both operational and embodied emissions. Along these lines, this work needs to account for the European and national efforts to decarbonize power plants that influence operational energy and carbon emissions, along with improved production processes that reduce primary energy use and improve the carbon footprint of the relevant industrial and manufacturing processes.

Author Contributions

Conceptualization, C.A.B. and E.G.D.; methodology, E.G.D. and C.A.B.; formal analysis, P.A.A., E.G.D., C.A.B., K.G.D., and S.K.; investigation, P.A.A. and E.G.D.; data curation, P.A.A. and E.G.D.; writing—original draft, E.G.D.; writing—review and editing, C.A.B., P.A.A., K.G.D., and S.K.; visualization, E.G.D. and P.A.A.; supervision, E.G.D.; project technical coordinator, E.G.D. All authors have read and agreed to the published version of the manuscript.

Funding

This research was funded by the Operational Programme “Competitiveness, Entrepreneurship and Innovation” (NSRF 2014–2020) of the Hellenic Ministry of Development & Investments, and co-financed by Greece and the European Union (European Regional Development Fund). The APC was also funded by the same sources.

Acknowledgments

This work was performed in the frame of the project “THESPIA II—Foundations of synergistic and integrated management methodologies and tools for monitoring and forecasting of environmental issues and pressures” (MIS 5002517), implemented under the action, “Reinforcement of the Research and Innovation Infrastructure”. The paper reflects the views only of the authors who have made every effort to prepare this material for the benefit of the public in light of current and available information. It does not represent the opinion of the European Union or the Hellenic Ministry of Development & Investments. Neither the European Union and Hellenic institutions and bodies nor the authors may be held responsible for the use which may be made of the information contained therein. The authors gratefully acknowledge the collaboration of the owners and technical staff at the production sites that participated in the current field work. The national EPC repository (buildingcert) has been developed and maintained by the Hellenic Ministry of Environment & Energy (YPEN) in collaboration with the Centre for Renewable Energy Sources. The authors wish to acknowledge YPEN for allowing access to the EPC database. The analysis presented herein does not necessarily reflect the opinion of the Ministry.

Conflicts of Interest

The authors declare no conflict of interest. The funders had no role in the design of the study; in the collection, analyses, or interpretation of data; in the writing of the manuscript, or in the decision to publish the results.

Abbreviations

AHeated floor area of a building (m2)
BoMBill of Materials
DHWDomestic Hot Water
ECMEnergy Conservation Measures
EEEmbodied Energy
EEIEmbodied Energy Intensity, i.e., total embodied energy per unit floor area (e.g., GJ/m2)
EEMEnergy Efficiency Measures
EPBDEnergy Performance of Building Directive
EPCEnergy Performance Certificate
EPDEnvironmental Product Declaration
EUIEnergy Use Intensity, i.e., operational energy per unit floor area (e.g., GJ/m2)
HDDHeating Degree Days (K.Days)
CDHCooling Degree Hours (K.Hours)
ICEInventory of Carbon and Energy
KENAKHellenic national regulation on the energy performance of buildings
LCALife Cycle Assessment
LCILife Cycle Inventory
MFHMulti-Family Houses
nZEBnearly Zero Energy Buildings
SFHSingle-Family Houses

Appendix A. Adaptation Factors for EUIs

The derived adaptation f-factors from 1734 EPCs are given in Figure A1. The clustered data of the calculated and actual energy use are organized are analysed for the different tiers of the four construction periods and the four climate zones. The 45°dashed lines (i.e., x = y) identify the (ideal) cases when the calculated and actual energy use are in perfect agreement. The large data scatter reflects the anticipated differences in the calculated EUIs resulting from variations in the building construction and systems performance, the location, weather data, etc. The variability of the actual EUIs reflect the different occupants’ interactions with the space heating system (e.g., actual operating periods, indoor temperature set-points) for buildings in the same tier. In principle, a low actual energy use should not be automatically interpreted as a high performing building, unless one considers that the prevailing indoor environmental quality is acceptable.
The average and median adaptation factors, i.e., defined as the ratio of the actual to the calculated energy use for space heating, are inserted as legends in Figure A1 for each tier. Each bullet corresponds to an SFH and the number of cases in each tier are also identified in each graph. The 45° dashed lines (i.e., x = y) identify the (ideal) cases when the calculated and actual energy use are in perfect agreement. Cases below the diagonal show a prebound effect (i.e., the actual EUI is lower than the calculated) and are more evident for low performance buildings (high calculated EUIs). Cases over the diagonal show a rebound effect (i.e., the actual EUI is higher than the calculated) and are more common for high performance buildings (low calculated EUIs).
The average adaptation factor is 0.536 (median 0.501), which means that the actual energy use for space heating and DHW is 46.4% (49.9%) lower than the calculated value. The results are in-line with similar values published in the literature that also document large deviations of actual and calculated energy use from 30% to 47% [70,71].
Figure A1. Calculated and actual space heating and DHW primary energy use intensity (MJ/m2) from 1734 SFHs in Greece, grouped for the different tiers (four climate zones A–D and four construction periods).
Energies 13 04384 g0a1
Currently, the available data for new buildings are missing (SFH post-2011 in Zone D) or have not yet reached a sufficient population (e.g., SFH post-2011 in Zone A), so they should be used with caution. For the case of the SFH-4D that corresponds to new constructions (post-2011) in the north climate zone D, there is currently no available data from the EPCs. In this case, the adaptation factor used in the calculations was taken as the median value of 0.853 that corresponds to the data for the post-2010 time period.

References

  1. Eurostat. Energy Statistical Country Datasheets; European Commission, DG Energy, Unit A4: Brussels, Belgium, 2019; Available online: https://ec.europa.eu/eurostat/web/energy/data/energy-balances (accessed on 21 May 2020).
  2. European Commission. Census Hub—European Statistical System; European Commission: Brussels, Belgium, 2011; Available online: https://ec.europa.eu/CensusHub2 (accessed on 21 May 2020).
  3. Pezzutto, S. Open Data Set for the EU28. Hotmaps Project, D2.3 WP2 Report. 2019. Available online: https://www.hotmaps-project.eu/wp-content/uploads/2018/03/D2.3-Hotmaps_for-upload_revised-final_.pdf (accessed on 21 May 2020).
  4. EU Climate Strategies & Targets. Available online: https://ec.europa.eu/clima/policies/strategies/2050_en (accessed on 21 May 2020).
  5. Directive (EU) 2018/844 of the European Parliament and of the Council of 30 May 2018 Amending Directive 2010/31/EU on the Energy Performance of Buildings and Directive 2012/27/EU on Energy Efficiency; European Commission: Brussels, Belgium, 2018; Available online: http://data.europa.eu/eli/dir/2018/844/oj (accessed on 21 May 2020).
  6. Filippidou, F.; Jimenez Navarro, J.P. Achieving the Cost-Effective Energy Transformation of Europe’s Buildings; EUR 29906 EN; Publications Office of the European Union: Luxembourg, 2019; p. 50. [Google Scholar] [CrossRef]
  7. Ferrara, M.; Monetti, V.; Fabrizio, E. Cost-Optimal Analysis for Nearly Zero Energy Buildings Design and Optimization: A Critical Review. Energies 2018, 11, 1478. [Google Scholar] [CrossRef] [Green Version]
  8. D’Agostino, D.; Mazzarella, L. What is a Nearly zero energy building? Overview, implementation and comparison of definitions. J. Build. Eng. 2019, 21, 200–212. [Google Scholar] [CrossRef]
  9. Chen, J.; Zhou, W.; Yang, H. Is Embodied Energy a Better Starting Point for Solving Energy Security Issues?—Based on an Overview of Embodied Energy-Related Research. Sustainability 2019, 11, 4260. [Google Scholar] [CrossRef] [Green Version]
  10. Dixit, M.K. Life cycle recurrent embodied energy calculation of buildings: A review. J. Clean. Prod. 2019, 209, 731–754. [Google Scholar] [CrossRef]
  11. Frischknecht, R. Basics for the Assessment of Embodied Energy and Embodied GHG Emissions for Building Construction, Guideline for Designers and Consultants—Part 1; IEA EBC Annex 57; Lützkendorf, T., Balouktsi, M., Eds.; Institute for Building Environment and Energy Conservation: Tokyo, Japan, 2016; Available online: http://www.iea-ebc.org/Data/publications/EBC_Annex_57_Guideline_for_Designers_Part_1.pdf (accessed on 21 May 2020).
  12. Building Sustainability Performance—Level(s). Available online: https://ec.europa.eu/environment/eussd/buildings.htm (accessed on 21 May 2020).
  13. Vilches, A.; Garcia-Martinez, A.; Sanchez-Montanes, B. Life cycle assessment (LCA) of building refurbishment: A literature review. Energy Build. 2017, 135, 286–301. [Google Scholar] [CrossRef]
  14. Azari, R.; Abbasabadi, N. Embodied energy of buildings: A review of data, methods, challenges, and research trends. Energy Build. 2018, 168, 225–235. [Google Scholar] [CrossRef]
  15. Chastas, P.; Theodosiou, T.; Bikas, D. Embodied energy in residential buildings-towards the nearly zero energy building: A literature review. Build. Enrviron. 2016, 105, 267–282. [Google Scholar] [CrossRef]
  16. European Committee for Standardization. Sustainability of Construction Works. Environmental Product Declarations. Core Rules for the Product Category of Construction Products; EN 15804:2012 + A2:2019; European Committee for Standardization: Brussels, Belgium, 2019. [Google Scholar]
  17. European Committee for Standardization. Sustainability of Construction Works—Assessment of Environmental Performance of Buildings—Calculation Method; EN 15978:2011; European Committee for Standardization: Brussels, Belgium, 2011. [Google Scholar]
  18. Herczeg, M.; McKinnon, D.; Milios, L.; Bakas, I.; Klaassens, E.; Svatikova, K.; Widerberg, O. Resource Efficiency in the Building Sector; ECORYS Nederland BV: Rotterdam, The Netherlands, 2014; Available online: http://ec.europa.eu/environment/eussd/reports.htm (accessed on 21 May 2020).
  19. Dixit, M.K. Life cycle embodied energy analysis of residential buildings: A review of literature to investigate embodied energy parameters. Renew. Sustain. Energy Rev. 2017, 79, 390–413. [Google Scholar] [CrossRef]
  20. Balouktsi, M.; Lîtzkendorf, T. Energy Efficiency of Buildings: The Aspect of Embodied Energy. Energy Technol. 2016, 4, 31–43. [Google Scholar] [CrossRef]
  21. Chastas, P.; Theodosiou, T.; Kontoleon, K.J.; Bikas, D. The Effect of Embodied Impact on the Cost-Optimal Levels of Nearly Zero Energy Buildings: A Case Study of a Residential Building in Thessaloniki, Greece. Energies 2017, 10, 740. [Google Scholar] [CrossRef] [Green Version]
  22. Berardi, U. Definitions, Design Methodologies, Good Practices, and Case Studies. In Handbook of Energy Efficiency in Buildings, 1st ed.; Asdrubali, F., Desideri, U., Eds.; Butterworth-Heinemann Elsevier Ltd.: Oxford, UK, 2018; Chapter 3.2 ZEB and NZEB; p. 836. [Google Scholar] [CrossRef]
  23. BSO, EU Building Stock Observatory; European Commission, Energy. Available online: https://ec.europa.eu/energy/en/topics/energy-efficiency/buildings/eubuildings (accessed on 21 May 2020).
  24. Azari, R. Life Cycle Energy Consumption of Buildings; Embodied + Operational. In Sustainable Construction Technologies, Life-Cycle Assessment; Tam, V.W.Y., Le, K.N., Eds.; Elsevier: Amsterdam, The Netherlands, 2019; Chapter 5; pp. 123–144. [Google Scholar] [CrossRef]
  25. Hu, M. A Building Life-Cycle Embodied Performance Index—The Relationship between Embodied Energy, Embodied Carbon and Environmental Impact. Energies 2020, 13, 1905. [Google Scholar] [CrossRef] [Green Version]
  26. Becalli, M.; Cellura, M.; Fontana, M.; Longo, S.; Mistretta, M. Energy retrofit of a single-family house: Life cycle net energy saving and environmental benefits. Renew. Sustain. Energy Rev. 2013, 27, 283–293. [Google Scholar] [CrossRef]
  27. Hammond, G.P.; Jones, C.I. Inventory of Carbon and Energy (ICE); Department of Mechanical Engineering, University of Bath: Bath, UK, 2011. [Google Scholar]
  28. Alexandri, E.; Androutsopoulos, A. Energy Upgrade of Existing Dwellings in Greece; Embodied Energy Issues. Proc. Environ. Sci. 2017, 38, 196–203. [Google Scholar] [CrossRef]
  29. Balaras, C.A.; Argiropoulou, P.; Koubogiannis, D.; Syngros, G. Operational Energy Savings & Embodied Energy in Hellenic Residential Buildings. In Proceedings of the EinB2016–5th International Conference “Energy in Buildings 2016”, Athens, Greece, 12 November 2016; ASHRAE Hellenic Chapter and Technical Chamber of Greece: Athens, Greece, 2016; p. 237. Available online: http://www.ashrae.gr/Proceedings/EinB2016_PROCEEDINGS.pdf (accessed on 21 May 2020).
  30. Koubogiannis, D.G.; Balaras, C.A. Embodied energy in electro-mechanical installations of Hellenic dwellings. In Proceedings of the 3rd International Conference Energy in Buildings, Athens, Greece, 2 September 2014; ASHRAE Hellenic Chapter and Technical Chamber of Greece: Athens, Greece, 2014. Available online: http://www.ashrae.gr/EinB2014/EinB2014_Proceedings.pdf (accessed on 21 May 2020).
  31. Papadopoulos, A.M.; Giama, E. Environmental performance evaluation of thermal insulation materials and its impact on the buildings. Build. Environ. 2007, 42, 2178–2187. [Google Scholar] [CrossRef]
  32. Halyvourgiki Steel Production, Greece. Available online: http://www.halyvourgiki.gr (accessed on 21 May 2020).
  33. Mytilineos Holdings. Sustainability Report; Mytilineos Holdings: Athens, Greece, 2016; Available online: https://www.mytilineos.gr/Uploads/ETHSIA_DELTIA/csr_reports/Sustainability_Report_2016_GR.pdf (accessed on 21 May 2020).
  34. Koroneos, C.; Dompros, A. Environmental assessment of brick production in Greece. Build. Environ. 2007, 42, 2114–2123. [Google Scholar] [CrossRef]
  35. Koubogiannis, D.; Nouhou, C. How much Energy is Embodied in your Central Heating Boiler? IOP Conf. Ser. Mater. Sci. Eng. 2016, 161, 012094. [Google Scholar] [CrossRef]
  36. Koroneos, C.J.; Nanaki, E.A. Life cycle environmental impact assessment of a solar water heater. J. Clean. Prod. 2012, 37, 154–161. [Google Scholar] [CrossRef]
  37. Dascalaki, E.; Argiropoulou, P.; Balaras, C.A.; Droutsa, K.G.; Kontoyiannidis, S.; Koubogiannis, D. On the share of embodied energy in the lifetime energy use of typical Hellenic residential buildings. IOP Conf. Ser. Earth Environ. Sci. 2020, 410, 012070. [Google Scholar] [CrossRef]
  38. Dascalaki, E.; Argiropoulou, P.; Balaras, C.A.; Droutsa, K.G.; Kontoyiannidis, S. Analysis of the embodied energy in building lifecycle assessment of Hellenic residential buildings. In Proceedings of the 50th International HVAC&R Congress and Exhibition, SMEITS—KGH Srbije, Belgrade, Serbia, 4–6 December 2019. [Google Scholar]
  39. European Commission, Energy. Nearly Zero-Energy Buildings. Available online: https://ec.europa.eu/energy/topics/energy-efficiency/energy-efficient-buildings/nearly-zero-energy-buildings (accessed on 21 May 2020).
  40. Scrivener, K.L.; Vanderley, M.J.; Gartner, E.M. Eco-Efficient cements: Potential economically viable solutions for a low-CO2 cement-based materials industry. Cem. Concr. Res. 2018, 114, 2–26. [Google Scholar] [CrossRef]
  41. Chadiarakou, S. The compliance of building materials to the European & National standards. In Proceedings of the 2nd International Conference Energy in Buildings—Northern Hellas 2015, Thessaloniki, Greece, 9 May 2015; ASHRAE Hellenic Chapter and Technical Chamber of Greece, Central Macedonia Section: Thessaloniki, Greece, 2015. Available online: http://www.ashrae.gr/EstaK2015/EstaK2015_Chadiarakou.pdf (accessed on 21 May 2020).
  42. Anastaselos, D.; Giama, E.; Papadopoulos, A.M. An assessment tool for the energy, economic and environmental evaluation of thermal insulation solutions. Energy Build. 2009, 41, 1165–1171. [Google Scholar] [CrossRef]
  43. IEA. Technology Roadmap—Low-Carbon Transition in the Cement Industry; International Energy Agency: Paris, France, 2018; Available online: https://www.iea.org/reports/technology-roadmap-low-carbon-transition-in-the-cement-industry (accessed on 21 May 2020).
  44. Bribián, I.Z.; Capilla, A.V.; Usón, A.A. Life cycle assessment of building materials: Comparative analysis of energy and environmental impacts and evaluation of the eco-efficiency improvement potential. Build. Environ. 2011, 46, 1133–1140. [Google Scholar] [CrossRef]
  45. ELSTAT. 2011 Buildings Census; Hellenic Statistical Authority: Athens, Greece, 2015. Available online: http://www.statistics.gr/census-buildings-2011 (accessed on 21 May 2020).
  46. Dascalaki, E.G.; Balaras, C.A.; Kontoyiannidis, S.; Droutsa, K.G. Modeling Energy Refurbishment Scenarios for the Hellenic Residential Building Stock Towards the 2020 & 2030 Targets. Energy Build. 2016, 132, 74–90. [Google Scholar] [CrossRef]
  47. Dascalaki, E.G.; Balaras, C.A.; Gaglia, A.G.; Droutsa, K.G.; Kontoyiannidis, S. Energy performance of buildings—EPBD in Greece. Energy Policy 2012, 45, 469–477. [Google Scholar] [CrossRef]
  48. Energy Performance of Buildings Directive. EU Countries’ 2018 Cost-Optimal Reports. Available online: https://ec.europa.eu/energy/en/topics/energy-efficiency/energy-performance-of-buildings/energy-performance-buildings-directive/eu-countries-2018-cost-optimal-reports (accessed on 17 January 2020).
  49. Droutsa, K.G.; Kontoyiannidis, S.; Dascalaki, E.G.; Balaras, C.A. Mapping the Energy Performance of Hellenic Residential Buildings from EPC (energy performance certificate) Data. Energy 2016, 98, 284–295. [Google Scholar] [CrossRef]
  50. Visscher, H.; Dascalaki, E.; Sartori, I. Towards an energy efficient European housing stock: Monitoring, mapping and modelling retrofitting processes: Special issue of energy and buildings. Energy Build. 2016, 132, 1–3. [Google Scholar] [CrossRef]
  51. Sandberg, N.H.; Sartori, I.; Heidrich, O.; Dawson, R.; Dascalaki, E.; Dimitrou, S.; Vimm, T.; Filipiddou, F.; Stegnar, G.; Šijanec Zavrl, M.; et al. Dynamic building stock modelling: Application to 11 European countries to support the energy efficiency and retrofit ambitions of the EU. Energy Build. 2016, 132, 26–38. [Google Scholar] [CrossRef] [Green Version]
  52. Malmqvist, T.; Glaumann, M.; Scarpellini, S.; Zabalza, I.; Aranda, A.; Llera, E.; Díaz, S.; Bribián, I.Z. Life cycle assessment in buildings: The ENSLIC simplified method and guidelines. Energy 2011, 36, 1900–1907. [Google Scholar] [CrossRef]
  53. Soust-Verdaguer, B.; Llatas, C.; Garcia-Martinez, A. Simplification in life cycle assessment of single-family houses: A review of recent developments. Build. Environ. 2016, 103, 215–227. [Google Scholar] [CrossRef] [Green Version]
  54. PRé Consultants, B.V. SimaPro Analyst Release 8.5.2.0. Available online: https://www.pre-sustainability.com/simapro (accessed on 21 May 2020).
  55. Wernet, G.; Bauer, C.; Steubing, B.; Reinhard, J.; Moreno-Ruiz, E.; Weidema, B. The ecoinvent database version 3 (part I): Overview and methodology. Int. J. Life Cycle Assess. 2016, 21, 1218–1230. [Google Scholar] [CrossRef]
  56. Frischknecht, R.; Wyss, F.; Knöpfel, S.B.; Lützkendorf, T.; Balouktsi, M. Cumulative energy demand in LCA: The energy harvested approach. Int. J. Life Cycle Assess. 2015, 20, 957–969. [Google Scholar] [CrossRef]
  57. Frischknecht, R.; Jungbluth, N. Overview and Methodology; Ecoinvent Report No. 1; Swiss Centre for Life Cycle Inventories: Dübendorf, Switzerland, 2007; Available online: https://www.ecoinvent.org/files/200712_frischknecht_jungbluth_overview_methodology_ecoinvent2.pdf (accessed on 21 May 2020).
  58. Balaras, C.A.; Dascalaki, E.G.; Droutsa, K.G.; Kontoyiannidis, S. Empirical Assessment of Calculated and Actual Heating Energy Use in Hellenic Residential Buildings. Appl. Energy 2016, 164, 115–132. [Google Scholar] [CrossRef]
  59. Zou, P.X.W.; Wagle, D.; Alam, M. Strategies for minimizing building energy performance gaps between the design intend and the reality. Energy Build. 2019, 191, 31–41. [Google Scholar] [CrossRef]
  60. ELSTAT. Survey on Energy Consumption in Households 2011–2012; Hellenic Statistical Authority: Athens, Greece, 2013. Available online: http://www.statistics.gr/statistics/-/publication/SFA40/ (accessed on 21 May 2020).
  61. Piccardo, C.; Dodoo, A.; Gustavsson, L.; Tettey, U.Y.A. Retrofitting with different building materials: Life-Cycle primary energy implications. Energy 2020, 192, 116648. [Google Scholar] [CrossRef]
  62. Balaras, C.A.; Droutsa, K.; Dascalaki, E.; Kontoyiannidis, S. Deterioration of European Apartment Buildings. Energy Build. 2005, 37, 515–527. [Google Scholar] [CrossRef]
  63. Hugo, A.; Zmeureanu, R. Residential Solar-Based Seasonal Thermal Storage Systems in Cold Climates: Building Envelope and Thermal Storage. Energies 2012, 5, 3972–3985. [Google Scholar] [CrossRef] [Green Version]
  64. EcoInvent v.3.4. Available online: https://www.ecoinvent.org (accessed on 21 May 2020).
  65. Dixit, M.K.; Fernandez-Solis, J.L.; Lavy, S.; Culp, C.H. Identification of parameters for embodied energy measurement: A literature review. Energy Build. 2010, 42, 1238–1247. [Google Scholar] [CrossRef]
  66. ALUMIL. Environmental Product Declaration, European Aluminium; Alumil 7; Alumil: Thessaloniki, Greece, 2017. [Google Scholar]
  67. Verbeeck, G.; Hens, H. Life cycle inventory of buildings: A contribution analysis. Build. Environ. 2010, 45, 964–967. [Google Scholar] [CrossRef]
  68. Shirazi, A.; Ashuri, B. Embodied Life Cycle Assessment (LCA) Comparison of Residential Building Retrofit Measures in Atlanta. Build. Environ. 2020, 171, 106644. [Google Scholar] [CrossRef]
  69. Koezjakov, A.; Urge-Vorsatz, D.; Crijns-Graus, W.; van den Broek, M. The relationship between operational energy demand and embodied energy in Dutch residential buildings. Energy Build. 2018, 165, 233–245. [Google Scholar] [CrossRef]
  70. Sunikka-Blank, M.; Galvin, R. Introducing the prebound effect: The gap between performance and actual energy consumption. Build. Res. Inf. 2012, 40, 260–273. [Google Scholar] [CrossRef]
  71. Dineen, D.; Gallachoir, B.P.O. Exploring the range of energy savings likely from energy efficiency retrofit measures in Ireland’s residential sector. Energy 2017, 121, 126–134. [Google Scholar] [CrossRef]
Figure 1. Methodological schematic of the work.
Energies 13 04384 g001
Figure 2. Range and distribution of published values for the embodied energy coefficients (MJ/kg) of commonly used construction materials.
Energies 13 04384 g002aEnergies 13 04384 g002b
Figure 3. Percentage of the total building mass and embodied energy for the materials used in the case studies and averaged for the four construction periods.
Energies 13 04384 g003
Figure 4. Percentage of the total building mass and embodied energy for the aggregated materials used in the main structural elements of the case studies and averaged for the four construction periods.
Energies 13 04384 g004
Figure 5. Primary initial EE and recurrent EE (for an 80-year building lifetime) embodied energy intensities (EEIs) and annual energy use intensities (EUIs) expressed in GJ/m2 for all the 16 case study buildings (Table 1) in the four climate zones of Greece, including the average heating degree days (HDD) and cooling degree days (CDD) in each zone.
Energies 13 04384 g005
Figure 6. Energy recovery time (years) for individual energy conservation and efficiency measures and a combined scenario for the different SFH case studies in the four climate zones.
Energies 13 04384 g006
Figure 7. Time evolution of total primary energy factors for electricity generation in Greece (Data source: Energy balances from [1]).
Energies 13 04384 g007
Table 1. Building and technical installation characteristics for 16 single-family houses (SFH) and other assumptions used in the calculations.
SFH-1SFH-2SFH-3SFH-4
Climate Zones
ABCDABCDABCDABCD
Energies 13 04384 i001 Energies 13 04384 i002 Energies 13 04384 i003 Energies 13 04384 i004 Energies 13 04384 i005 Energies 13 04384 i006 Energies 13 04384 i007 Energies 13 04384 i008 Energies 13 04384 i009 Energies 13 04384 i010 Energies 13 04384 i011 Energies 13 04384 i012 Energies 13 04384 i013 Energies 13 04384 i014 Energies 13 04384 i015 Energies 13 04384 i016
Construction periodPre-19801981–20002001–2010post-2011
DescriptionOld buildings, not thermally insulated envelopePartly insulated according to first regulationFully insulated according to first regulationFully insulated according to KENAK-EPBD regulation
Storeys1111111112212222
Slab-on gradeNononononononononononononono
PilotisnoNononononononononononono
Over unheated spacenonononono
Heated floor area (m2)80808080130130130130150150150150155155155155
Building Elements
Load Bearing
Reinforced concrete
Thermal insulation (cm)noNonononononono44445678
Walls
Area (m2)68777768758375758311411483114114114114
Bricks and plaster
Thermal insulation (cm)nononono444444444567
Floors
Reinforced concrete
Thermal insulation (cm)nonononononononono4442344
Finish material - Area
Ceramic tiles (m2)no4343no606060606969696975757575
Mosaic-Terrazzo (m2)43nono43nononononononononononono
Wood (m2)29434329606060606969696975757575
Basement (non-heated)
Reinforced concrete
Thermal insulation (cm)nononononononononononono2344
Area (m2)097970014700139100100139100100100100
Finish materialmosaicmosaicceramic tilesceramic tiles
Roofs
Reinforced concrete
Thermal insulation (cm)nononono666666666779
Cover materialMosaicRoman clay tilesConcreteRoman clay tilesConcrete tilesRoman clay tilesConcrete tilesRoman clay tiles
Flat, Area (m2)8080nono130nonono1508819no90901919
Tilted, Area (m2)nono8080no130130130nono69150no97292
Windows
MaterialsSingle glazing, wooden framesDouble glazing, aluminium framesDouble glazing, aluminium frames with thermal breaksDouble glazing low-e, aluminium frames with thermal breaks
Area (m2)19191919262827262830302828282828
Basement
MaterialsSingle glazing, wooden framesDouble glazing, aluminium framesDouble glazing, aluminium framesDouble glazing, aluminium frames
Area (m2)0060010001111111110101010
ShadingStructural elements (e.g., balconies)Structural elements (e.g., balconies)Structural elements (e.g., balconies)Structural elements (e.g., balconies)
Technical Installations
Heating system
Fuel, SystemOil-fired boilerOil-fired boilerOil-fired boilerOil-fired condensing boiler
Thermal efficiency (%)72727272828282828686868698989898
Cooling system
SystemLocal split unitsLocal split unitsLocal split unitsCentral heat pump
Coefficient of Performance1.71.71.71.71.71.71.71.71.71.71.71.72.52.52.52.5
Domestic hot waterElectric storage tankElectric storage tankElectric storage tankWinter: coupled with boiler central heating; Summer: Electric heater + Solar collectors
Calculation assumptions according to national regulation
Set-points20 °C in winter, 26 °C in summer; 18-h daily operation
Internal gainsLights: 0.1 W/m2, People: 4 W/m2, Equipment: 2 W/m2
Infiltration0.75 m3/h/m2 floor area
DHW consumption27.38 m3/bedroom at 45 °C
Lighting; AppliancesCalculations for residential buildings do not account for lighting, appliances, and similar plug loads that are not linked to occupant comfort conditions
Table 2. Service lifetime in years of common building materials, elements, equipment, and installations.
Materials, Elements, EquipmentService Lifetime (Years)
Window frames/Glass30
Plastering (exterior)50
Doors (exterior)40
Paint10
Laminated floor35
Ceramic tiles30
Mosaic30
Timber55
Roof tiles (clay)30
Heat production (boiler)20
Radiators62
Solar thermal collectors25
Table 3. Production processes and derived embodied energy coefficients (MJ/kg) in the Hellenic dataset from the field surveys (cradle-to-gate) or calculated from other Hellenic data sources using EcoInvent.
MaterialOverview of Production ProcessField SurveyOther SourcesCoefficient (MJ/kg)Difference from EcoInvent
AluminiumPrimary aluminium ingot production from a Hellenic manufacturing facility; bauxite ore from national mines and imports is used. Bauxite is refined into alumina that is then treated in a high temperature kiln to produce aluminium oxide that next undergoes an electrolytic reaction to smelt the material into aluminium. The processes are very energy intensive using large amounts of electricity for the electrolysis and fuel for the combustion in the kilns. Using recycled raw materials that can be melted at a lower temperature results in energy savings. For aluminium window profiles, the calculations are based on primary aluminium ingot production (60%) and recycled aluminium (40%) for 1 m2 window from EPDs [66] with coated profiles and 24 mm thermal breaks at 2.59 GJ/m2. Hellenic data [33] and EcoInvent209.543.4%
Bricks (burnt clay)Clay is extracted from a local quarry and transported by tracks (30 km roundtrip) to the facility; water is pumped from a well at the site. The raw material is crushed, grounded, and screened re-grounded, if necessary. The fine material is mixed with water and finally shaped with machine moulding. The formed bricks are dried in enclosed spaces that are heated with a biomass (olive pit pellet) furnace and then pass through an oil-fired kiln for baking. The final product is 8 × 10.5 × 19 cm and weight 1150 gr/unit. Used clay and intermediate products are recycled back to the raw material feeders. Defective bricks and other scrap are also crushed and used as ceramic powder for use in lime mortars or gravel for road construction projects. 2.62−12.5%
Cement Facility for the production CEM II/A-M Portland-composite cement. Raw materials are extracted from local quarries (e.g., limestone at 1.2 km roundtrip, clay or sandstone at 28 km) are mixed with small quantities of alumina and iron oxide. A fine powder of the raw materials is mixed (e.g., limestone 1250 kg/tonne clinker, clay minerals 300 kg/tn, liquid ammonia 20 kg/tn and other alternative materials 20 kg/tn) and fed into a high temperature dry-process kiln. The clinker is grinded and mixed with calcium sulphate (gypsum) and minor quantities of additional constituents (e.g., pozzolana, fly ash) to produce the known grey powder material. Electricity is mainly used in the stage of crushing and pre-homogenization of raw materials, as well as for the rotating furnaces. Fuel oil, petcoke, and coal are also used during the calcification phase in rotary kilns. 1.0252.2%
Concrete (ready-mix)The facility for the production of ready-mix concrete receives the cement from a manufacturing site located 100 km away and the transportation is made by trucks. For cement production and transportation to the site, the value becomes 3.3 MJ/kg cement. The quarry for mining the aggregates is within a radius of 9 km from the treatment plant and are transported by trucks. The aggregates are processed, crashed, cleaned, and stored at the ready-mix concrete production site and include gravel (16–31.5 mm diameter), washed gravel (12–31.5 mm), fine limestone (6–12 mm), and sand (<6 mm). 0.650.5%
Concrete (lean)Material with less than 10% cement content.EcoInvent0.4714.0%
Insulation (stone wool)Production of stonewool products (30–200 kg/m3) from a Hellenic manufacturing facility. Raw materials include amphibolite (70% p.w.), bauxite (8% p.w.), lime calcium oxide (8% p.w.), and dolomite (4% p.w.) that are transported to the plant and reuse of its own recycled stonewool material (10% p.w.). The facility uses an immersed electric arc furnace for melting the raw materials, followed by fiberizing, injection of binders, and curing. Other materials used for the final product include the production of various resins, auxiliary materials (silicone, mineral oil), materials used as back cover (e.g., aluminium foil) and packaging. Hellenic data [31,41] and EcoInvent37.855.1%
MosaicMosaic and Gabriel mosaic floors were very popular cast floors in the past, as economical, easy, and long-lasting floor cover, for both interior and exterior spaces. The raw materials include cement mortar made of white cement and small pieces of marble (waste). After the material have solidified and dried, the surface is sanded and polished.EcoInvent1.043.9%
Cement mortar and base plaster Facility for the production of various types of ready to use cement-based mortars. Various modes of transportation are used for the raw materials (e.g., sand, limestone, cement). Coefficients calculated for different mixing ratios for (a) pressed cement screed for walls and flooring; (b) material used in masonry construction to fill the gaps between the bricks and blocks. 0.72−136.5%
0.78−88.5%
Roof (clay) tilesSimilar production process with burnt clay bricks. The formed roman roof tiles are dried for longer periods (24–36 h) using heat and exhaust gases from an oil-fired, LPG, or biomass (olive pit pellet) furnace, followed by an additional firing process for surface treatment in order to melt and adhere the glazed surface finish. Final product 42 × 17.5 cm and weight 3850 gr/unit. 3.69−12.5%
Steel rebarSteel production is a major industrial and energy intensive activity. Iron ore, limestone, and coke can be fed into a furnace for melting into cast iron and the carbon content can be controlled through further smelting. The production considered here is based on the use of ferrous scrap that is mostly imported and an electric arc furnace to produce weldable bars and rods to strengthen concrete in load-bearing building construction. Production satisfies the domestic market demand, although some facilities have faced major obstacles during the recession and slowdown in construction activities. Hellenic data [32] and EcoInvent16.02−36.7%
Table 4. Time (years) for the adapted annual operational energy use to match the initial EE for the 16 case studies in the four climate zones.
Case StudyClimate Zone
BuildingsABCD
SFH-1A3.62.92.22.4
SFH-2A6.55.84.03.8
SFH-3A14.111.06.86.5
SFH-4A28.725.617.614.4
SFH-1B5.74.63.53.7
SFH-2B8.67.65.55.2
SFH-3B17.213.89.18.8
SFH-4B41.632.420.719.2
SFH-1C6.35.53.94.1
SFH-2C6.55.84.03.8
SFH-3C18.214.69.79.4
SFH-4C49.838.424.022.0
SFH-1D3.93.12.42.5
SFH-2D6.86.04.13.9
SFH-3D14.111.16.86.5
SFH-4D53.241.226.124.0
Table 5. Energy recovery time (years) for individual energy conservation and efficiency measures and a combined scenario for the different case studies.
Climate ZoneClimate ZoneClimate ZoneClimate ZoneClimate Zone
BuildingsABCDABCDABCDABCDABCD
InsulationWindowsBoilerSolar CollectorCombined
SFH-1A1.51.31.11.39.76.93.63.70.60.40.30.32.62.52.73.32.52.11.61.8
SFH-2A2.12.31.51.721.016.15.64.90.50.40.20.21.72.02.12.43.23.22.02.1
SFH-3A21.414.85.65.637.122.15.54.82.51.80.80.82.01.91.61.99.07.93.93.9
SFH-1B1.61.41.21.49.96.93.73.70.50.40.20.22.82.72.93.52.52.11.61.8
SFH-2B2.12.72.02.222.617.46.14.50.70.60.30.31.72.02.12.44.14.12.62.6
SFH-3B15.110.52.55.432.819.85.75.04.22.91.31.12.01.91.61.99.58.03.44.2
SFH-1C2.83.01.71.99.97.12.72.90.60.40.30.32.82.72.93.54.13.32.02.1
SFH-2C2.62.71.81.924.919.06.45.70.50.50.30.21.72.02.12.43.83.72.32.4
SFH-3C12.39.95.45.433.619.65.65.04.63.21.31.22.01.91.61.99.58.14.34.3
SFH-1D2.32.01.71.99.97.03.63.70.70.50.30.32.72.72.83.43.52.82.12.3
SFH-2D2.72.81.82.023.721.66.12.30.50.50.30.22.02.32.32.53.93.82.32.4
SFH-3D2.43.02.12.435.321.55.44.82.51.80.80.82.01.91.61.96.15.32.92.9

