1. Introduction
An increase in peak load value affects voltage stability [
1]. Worldwide, the increase in peak load value in power systems is becoming increasingly problematic. Rising electricity consumption is directly related to the load variation, and load variation is related to power generation. Therefore, regardless of the load, it is necessary to maintain the system’s reliability. In power systems, many outages are related to voltage collapses. For instance, approximately 51 outages related to voltage collapses or voltage instabilities were reported from 1965 to 1994 [
2]. According to a Western Systems Coordinating Council (WSCC) report [
2], on 2 July 1996, approximately two million people suffered damage in the North American WSCC system because of outages related to a severe voltage collapse. About 110 voltage collapses were reported from 2010 to 2013 in Nigeria [
3]. A voltage collapse on 8 September 2011 in the Pacific Southwest also led to an outage [
4]. At that time, about 2.7 million people who lived in San Diego, California, Arizona, and Mexico suffered damage for 12 h. On 6 August 2013 in Manila, Philippines, 14 generators were curtailed, which led to a voltage collapse. Consequentially, about 8 million people were affected.
When renewable energy is integrated into power systems, there are a few things to consider, such as overvoltage, undervoltage, electricity quality, and so on [
5]. Thus, before the integration of renewable energy, it is necessary to consider the system’s stability. According to a California Independent System Operator (ISO) load curve, the installation of photovoltaics (PV) in 2013 resulted in a drop in the net load compared to 2012 [
6], meaning the net load was reduced due to PV generation. After sunset, power systems with integrated renewable energy adjust the load using a traditional generator (e.g., gas turbine and thermal plants) to meet the load demand. However, because each generator has its own ramp rate, the system will collapse when it exceeds the generator’s ramp rate. Therefore, an estimation of the maximum capacity of renewable energy is needed to address this problem. Taking system stability into consideration, this paper will outline a method of estimating the maximum capacity by injecting the maximum renewable energy.
Many methods have been proposed to estimate the hosting capacity. The authors of [
7,
8,
9,
10,
11,
12,
13] proposed an approach to evaluate the hosting capacity based on overvoltage by integrating renewable energy. In [
7], the authors suggested a method to estimate the distributed energy resource (DER) hosting capacity with equivalent distribution modeling that included an infinity bus, network impedance, and no load. However, this system model did not include load for the worst-case scenario. In contrast, [
8] considered load characteristics below the realistic system features. In [
9], the authors constructed a pi model for distribution network modeling using real cable parameters for all lines and estimated the host capacity by selecting a particular bus. In [
11,
12], mixed integer nonlinear programming (MINLP) was applied to act network management (ANM) considering reactive power compensation (RPC) and network reconfiguration (NR) to estimate the DER hosting capacity. The authors of [
13] used mixed integer second-order cone programming (MISOCP) to estimate the DER hosting capacity by reflecting demand response (DR) and on-load tap changer (OLTC). However, the abovementioned studies [
7,
8,
9,
10,
11,
12,
13] only focused on overvoltage. Undervoltage problems can be an issue when there is a reduction in the renewable energy output or an outage of renewable energy owing to system disturbance and uncertainty. The authors of [
14,
15] utilized optimal power flow (OPF) to estimate the DER hosting capacity. In [
14], the authors estimated the DER hosting capacity by including constraint of protection equipment based on fault level-constrained OPF (FLCOPF). In [
15], the authors proposed an approach that estimates hosting capacity based on security-constrained OPF (SCOPF) by considering the maximum capacity of the generator with diverse contingency. Even though these methods can estimate the DER hosting capacity with optimal position, they cannot confirm the results of all buses. The suggested algorithm in this paper, however, can check the results of all buses, including the weakest bus.
The authors of [
16,
17,
18] proposed a method to evaluate the DER hosting capacity using an algorithm based on a probability approach. In [
16], considerable amounts of data was needed to perform the probability approach, with each hour of data for 365 days, i.e., 8760 h, required as input data. Furthermore, in [
16], a total of four DER hosting capacities were determined based on overvoltage, voltage deviation, dynamic voltage, and voltage unbalance. These four results were different according to voltage criteria. In [
17], the authors suggested an approach based on Monte Carlo simulations. Even though it included various technical constraints for evaluation, it tended to need many repeats, with 800,000 simulations conducted. Generally, a probability-based algorithm requires considerable amounts of data to improve the accuracy, and this approach is more accurate with many simulations than the suggested algorithm in this paper. However, the use of a stochastic approach means it may not simulate the worst case as there are cases where this approach cannot find the worst-case scenario despite long simulation times. During such cases, the algorithm suggested here calculates the DER hosting capacity with more simplicity, although with less accuracy. It can reduce the time for data processing and analyzes the voltage stability simultaneously.
The contributions of this paper are as follows. (1) This paper explains the method for estimating the DER hosting capacity by assuming not only renewable energy uncertainty but also outages from renewable energy by considering the ramp rate of the generator. In particular, estimation of the hosting capacity depends on the undervoltage criteria that collapses the system. (2) This paper discusses an algorithm that can estimate the DER hosting capacity using simple input data for power flow alone. In this regard, the method does not require complex or many data points to estimate the DER hosting capacity.
In this study, we determined the maximum capacity with continuation power flow (CPF). For analyzing the power system, the power flow calculation is one of the basic methods that is also used for stability and fault analysis [
19]. CPF is a combination of a continuous method and static power flow, which analyzes the static voltage stability. Moreover, CPF is a method of determining the maximum power transfer point and voltage stability. Thus, there is a need for stability analysis that considers integration of a renewable energy system. When the total load is constant, assuming the case of normal operation and renewable energy integration, the load is adjusted proportional to the injected amount. Then, it is possible to determine the peak load using the PV curve based on the computed bus voltage and depending on the voltage criteria for operating the distribution system. Moreover, the weakest bus is determined from the CPF results, and the system’s margin operating point is determined by selecting the bus’s marginal operating point. The process of checking the marginal operating point on the PV curve as described above and the maximum power transfer point are determined when the CPF result assumes that renewable energy is included. Therefore, the maximum power transfer point is larger than the original system’s operating point. In this case, the power system does not cause a voltage collapse and is free from outages. However, if the maximum power transfer point that is simulated with renewable energy is smaller than the original operating point, the PV curve will not overlap. Thus, the power flow analysis will show a divergence, and it will lead to an outage. Therefore, the amount of marginal injection when the system begins a voltage collapse is equal to the storage limit. Lastly, this study determines the renewable maximum injection storage by employing an IEEE-33 radial distribution system.
The rest of the paper is organized as follows.
Section 2 presents the three steps needed to obtain the CPF formulation.
Section 3 describes and compares it to the representative parameterization method. In
Section 4, we propose the main algorithm for evaluating the hosting capacity using CPF. In
Section 5, the proposed simulation algorithm is applied to an IEEE-33 radial system. Additionally, the obtained results from the simulation are reported graphically. In the conclusion section, important aspects are highlighted and summarized.
2. CPF Algorithm for Saddle-Node Bifurcation
Generally, the CPF algorithm is an optimal technique to compute the load ability limits using the PV curve [
20]. In particular, it can solve the Jacobian matrix’s singular problem and is used to determine the bifurcation point. Additionally, it can be used to calculate steady-state voltage stability, and various research papers have been published in order to improve the efficiency of CPF. In [
21], the accuracy of CPF was improved by combining the methods of local parameterization and physical parameterization. In [
22], the accuracy of the prediction value from the prediction step was improved by applying the Lagrangian interpolation method. In [
23], instead of using prediction and correction steps, the authors used the holomorphic embedding load flow method (HELM) and reduced the computation process by removing the iteration of finding roots. Finally, in [
24], the authors reduced the calculation process by controlling the step size and increasing the efficiency of the CPF results based on polynomial regression.
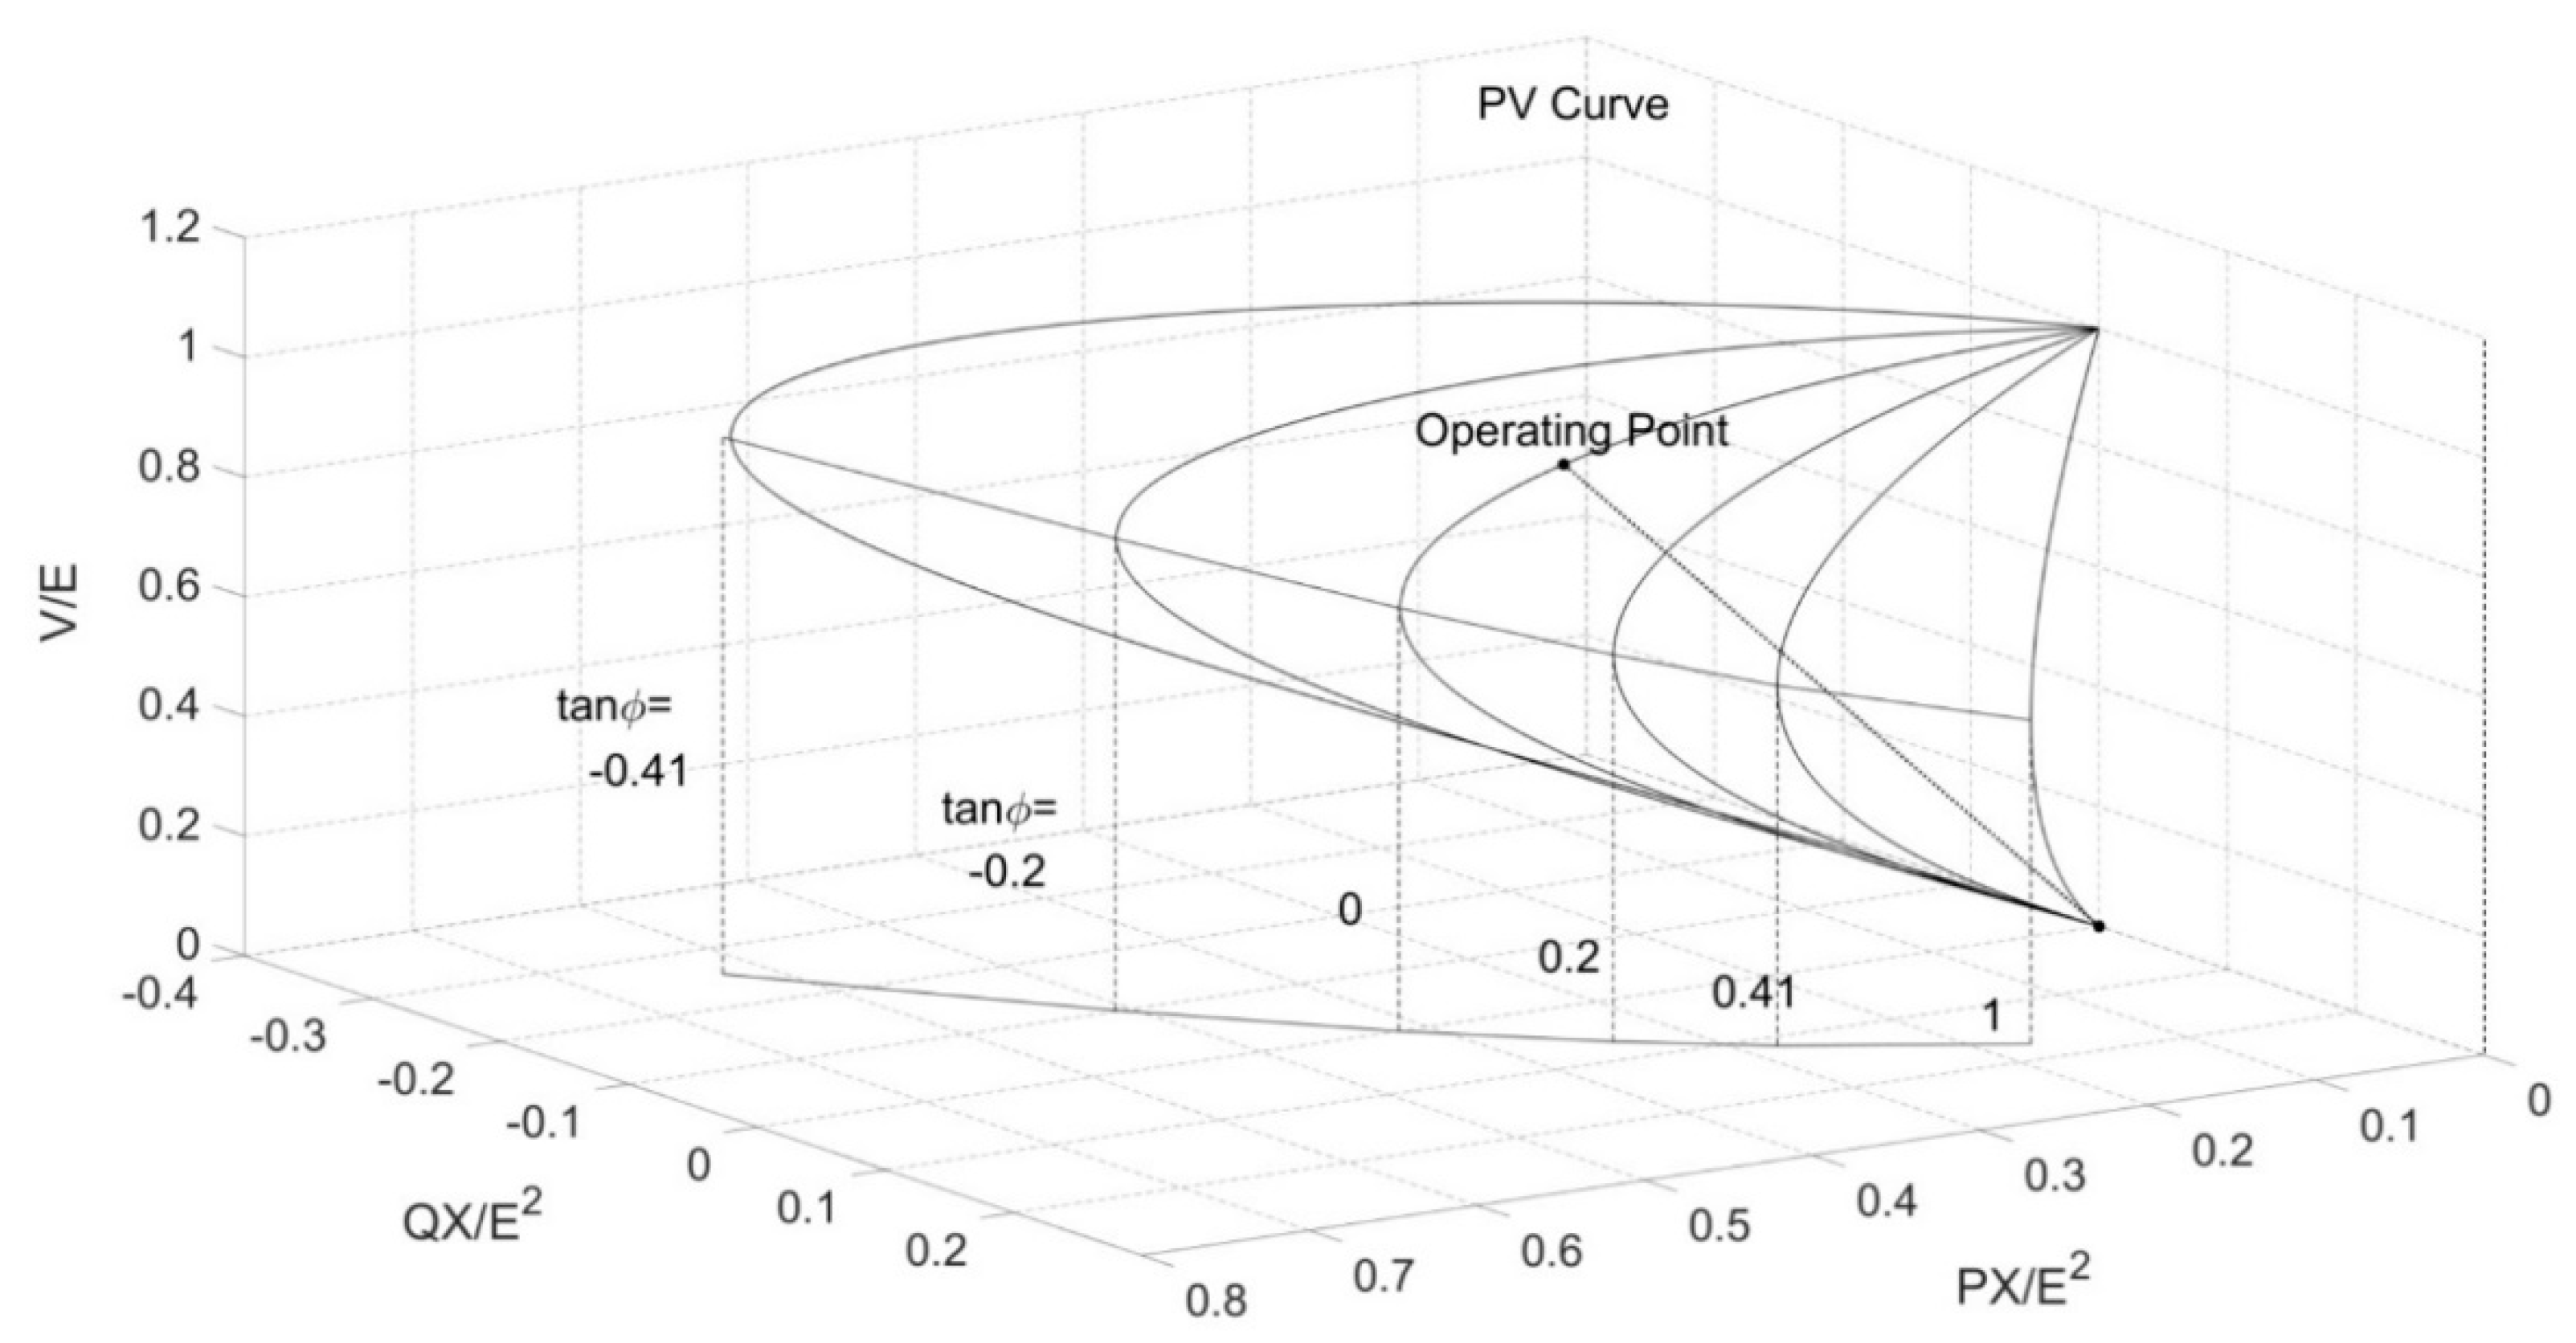
This CPF algorithm can be obtained from the PV curve, which consists of the tangent vector, prediction step, and correction step, by selecting a suitable step size. The PV curve is utilized by an indicator to verify the blackout point from the operating point of the current system by reflecting the network and load characteristics.
The accuracy of the CPF algorithm depends on the step size and the load parameterization method. If these two components are set improperly, the value obtained during the prediction step will have a high error compared with the actual solution. Because of this problem, the correction step requires a considerable number of iterations, and it takes a long time to find the solution. In severe cases, the solution may also diverge [
25]. Therefore, we need to select a proper step size and load parameterization method to find a solution with high accuracy.
To write the equation for the PV curve, first, the active power and reactive power can be written as follows:
where
E is the ideal voltage source,
X is the network impedance, and theta is the voltage angle.
In Equation (2), the real part is the active power and the imaginary part is the reactive power.
This can also be written as follows:
When theta is eliminated from Equations (3) and (4), they can be expressed as follows:
By multiplying (
EV)
2 on both sides of Equation (9), the voltage Equation can be written as follows:
From the above Equation, the PV curve according to a given power factor of the load can be expressed as shown in
Figure 1.
2.1. Prediction Step
The prediction step is the part of the process that estimates the next solution by utilizing the tangent vector from the current variables by setting the step size and load parameter. As a priority, the Jacobian matrix can be reformulated by adding load parameter
λ in the basic Jacobian matrix for power flow. This can be written as follows:
where
Pi is PV bus(2 ≤
i ≤
n),
Pj is PQ bus(
n + 1 ≤
j ≤
m),
Pz is parameterization, and
K is a multiplier designating the rate of load change as
λ changes. The tangent vector can be calculated using the reformulated Jacobian matrix and is written as follows:
The next solution can be calculated using the step size and tangent vector that were solved in Equation (12). This can be written as follows:
where
Vap is the predicted voltage angle,
Vmp is the predicted voltage magnitude,
λp is the predicted load parameter,
is the tangent vector, and
is the step size.
2.2. Correction Step
A correction step is proposed to determine the exact power flow based on the Newton–Raphson method from the predicted value calculated in the prediction step. In this process, the derivative of the complex power can be calculated as shown in Equation (16) using the normal value, predicted value, and
λ by subtracting them. Then, the derivative of the parameterization with Jacobian matrix that was reformulated in the prediction step is added, as shown in Equations (17) and (18). Finally, the exact power flow value can be calculated.
3. Load Parameterization
The CPF algorithm shows various results according to the parameterization method in terms of accuracy and calculation time [
26]. In short, parameterization is the key to the CPF algorithm, and in the correction step, it can be calculated by adding a one-dimensional equation that reflects the derivative of the load parameter with normal power flow equations.
The CPF algorithm can be diverged when the difference between the predicted value and exact value is large. This means that the CPF algorithm can converge quickly as long as the difference between them is small. Therefore, the difference between them is standard for evaluating the parameterization method [
27]. For example, the results from Equations (11)–(15) are different in accordance with the parameterization method, even though it has the same step size.
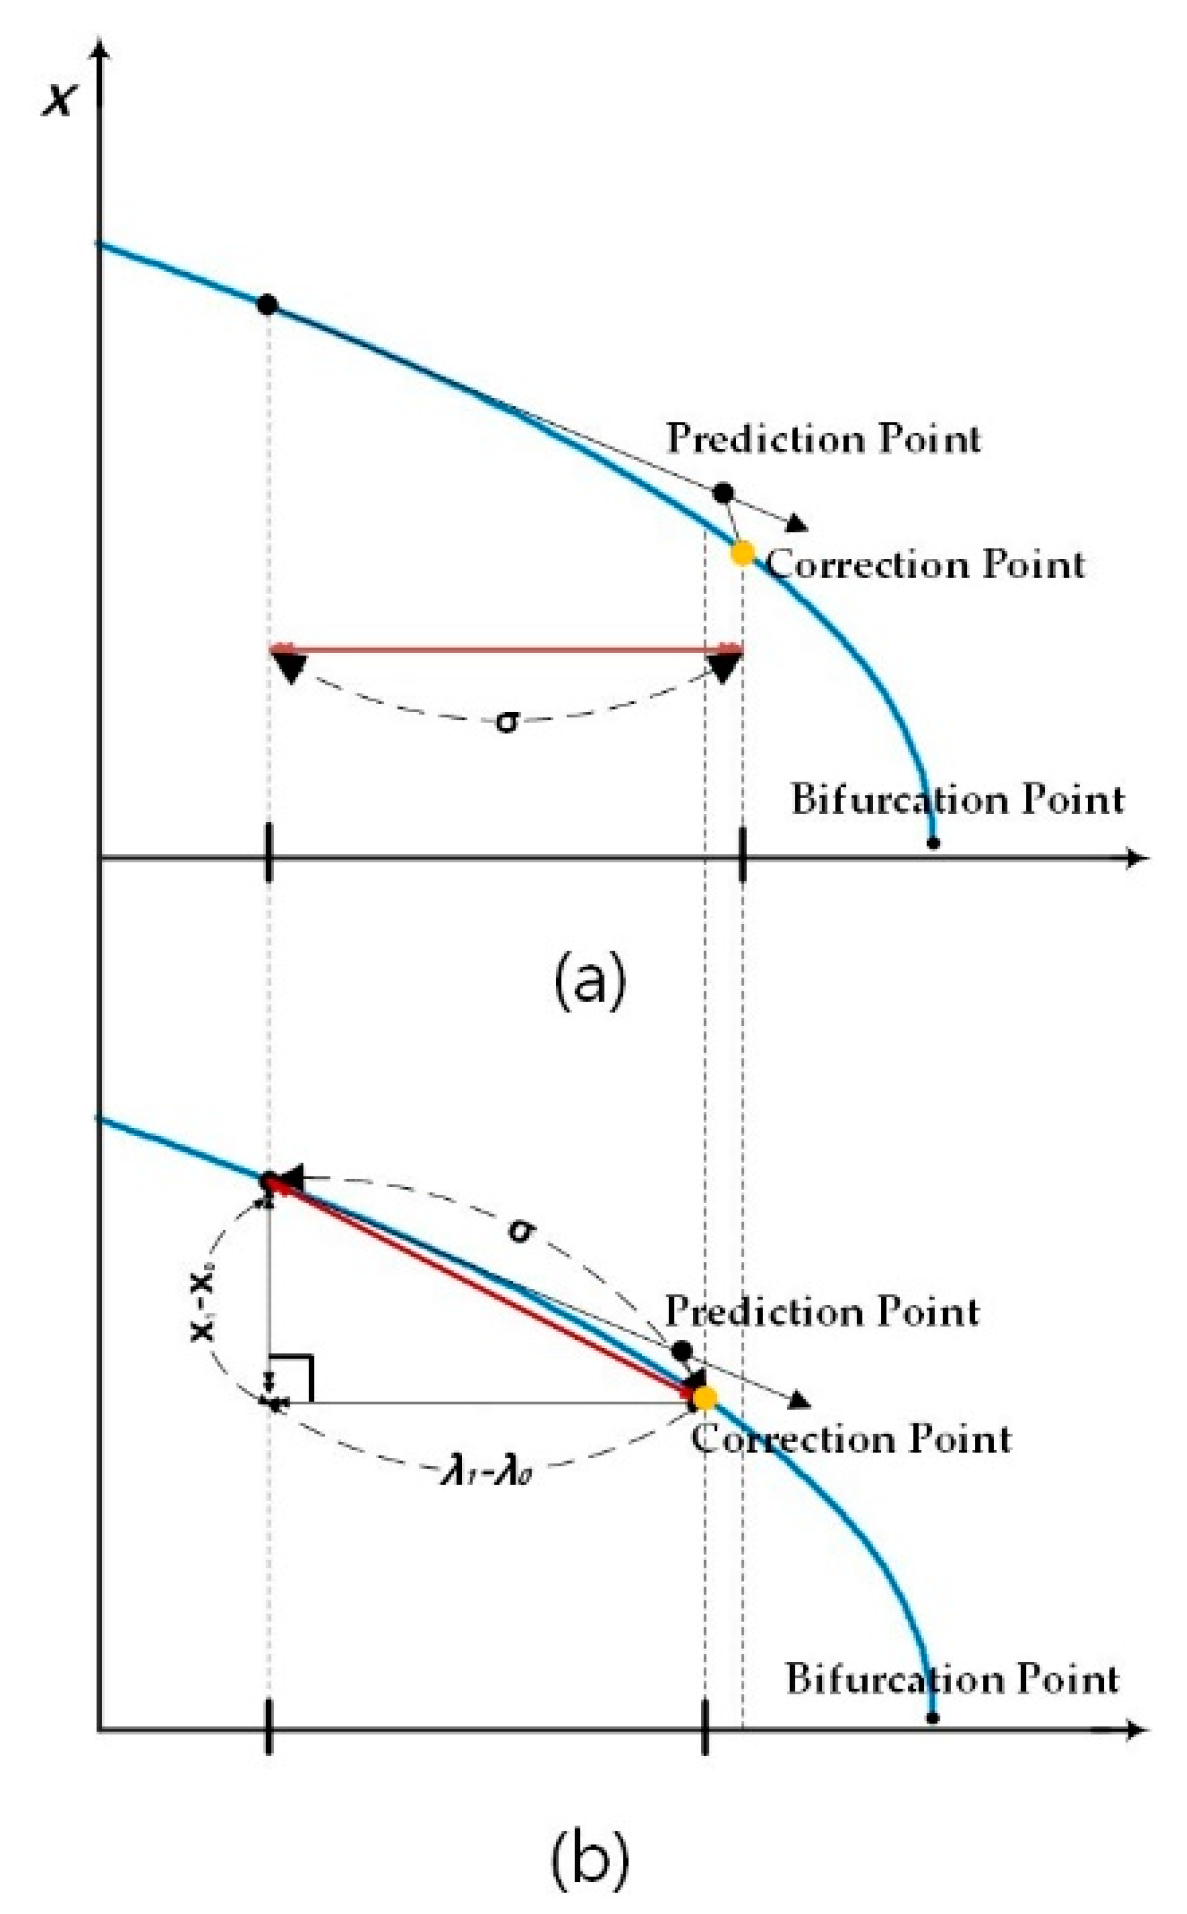
As shown in
Figure 2, the parameterization method includes various methods, such as local, arc length, etc. Local parameterization is a simple method that only considers
λ. Thus, the derivative of parameterization and the last row of the Jacobian matrix can be expressed as in Equations (19) and (20).
However, the local parameterization tends to have low accuracy. In particular, when the step size is high, it may diverge because it has high sensitivity around the bifurcation point. To correct this, the arc-length parameterization method was applied in this study. This is a method based on the distance between two points. The derivative of parameterization and the last row of the Jacobian matrix can be expressed as in Equations (21) and (22).
Regarding this characteristic, the arc-length parameterization method can calculate more points than the local method despite the same step size, which shows a high convergence around the bifurcation point.
4. Algorithm for DER Hosting Capacity Estimation that Utilizes the CPF Method
The algorithm for estimating the DER hosting capacity is represented in
Figure 3. The concept is that the load can be reduced as much as the DER capacity when the DER is an outage from disturbance or uncertainty to confirm whether a generator can increase the output with a ramp rate.
The flow chart that estimates the DER hosting capacity involves first calculating the power flow using normal variables. Then, we can apply the parameterization method to the variables to set the
λ, which represents the load parameter. Consequently, it can show the bifurcation point in the PV curve according to the tangent vector, prediction step, and correction step. Afterwards, the voltage sensitivity factor (
VSF) used to determine the weakest bus in the system can be calculated using Equation (23). In this expression,
Vk is the voltage of the
k-th bus.
VSF is determined to be
dVk because
dλ is equal to every bus.
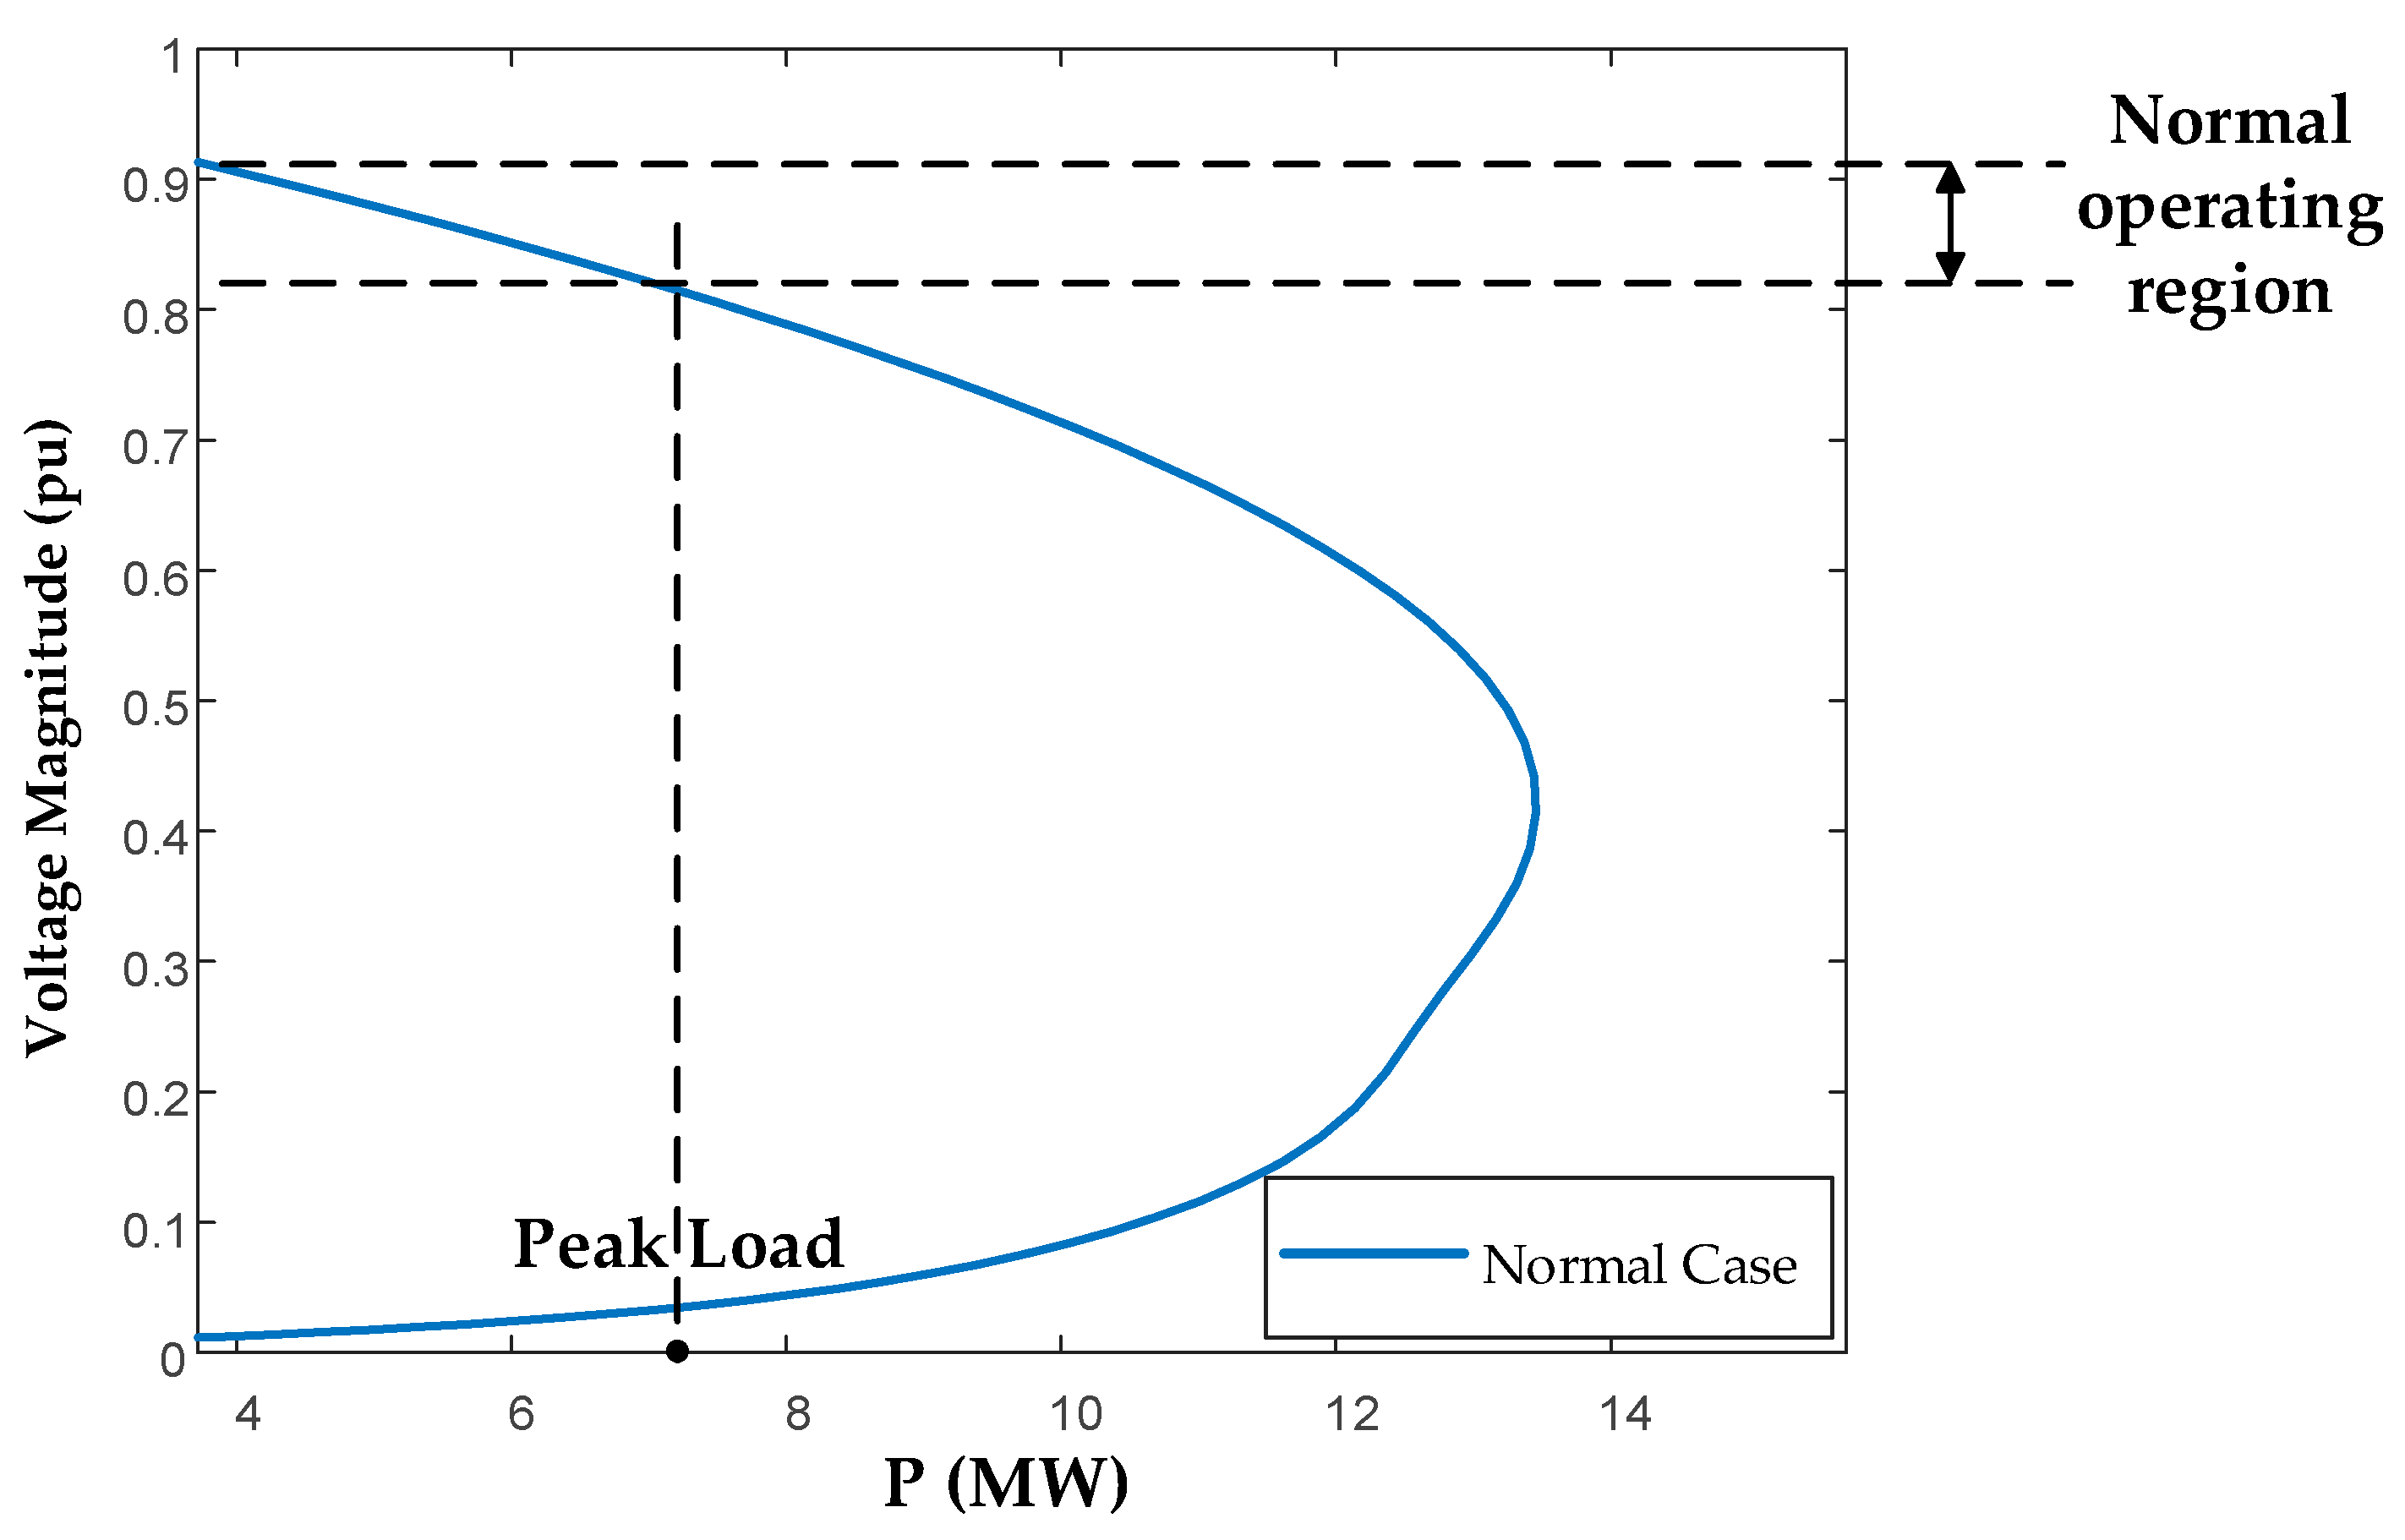
The bus that has the highest VSF is considered to be the weakest bus. This is also severely affected by a DER outage or variation in the DER with uncertainty. With this in mind, the DER hosting capacity can be estimated by determining the operation point region and peak load for establishing stability and reliability based on the weakest bus.
To determine the bifurcation point when DER has an abrupt outage from a disturbance or uncertainty, the load can be adjusted by as much as the DER capacity. In this situation, if the bifurcation point does not overlap with the peak load point, the generator with its ramp rate cannot increase the output because there is no operating point.
With regard to voltage stability, it can predict the collapse of the system. Therefore, this algorithm continues to check the bifurcation point while reducing the load, and if this point equals the peak load point, the algorithm stops. To summarize, for all the power systems that require analyzation, voltage sensitivity is calculated for all buses with Equation (23) using CPF and power flow. Then, the weakest bus is chosen by taking the highest value of the voltage sensitivity factor. Based on the weakest bus, the operating point and peak load can be found. Moreover, considering the outage of renewable energy from the disturbance, the loads are adjusted proportional to the hosting capacity. Then, by running the CPF, it is possible to see if the bifurcation point is equal to the peak load. If they are equal, the DER hosting capacity considering the outage and undervoltage can be calculated by subtracting the current load value from the peak load value.
6. Discussion
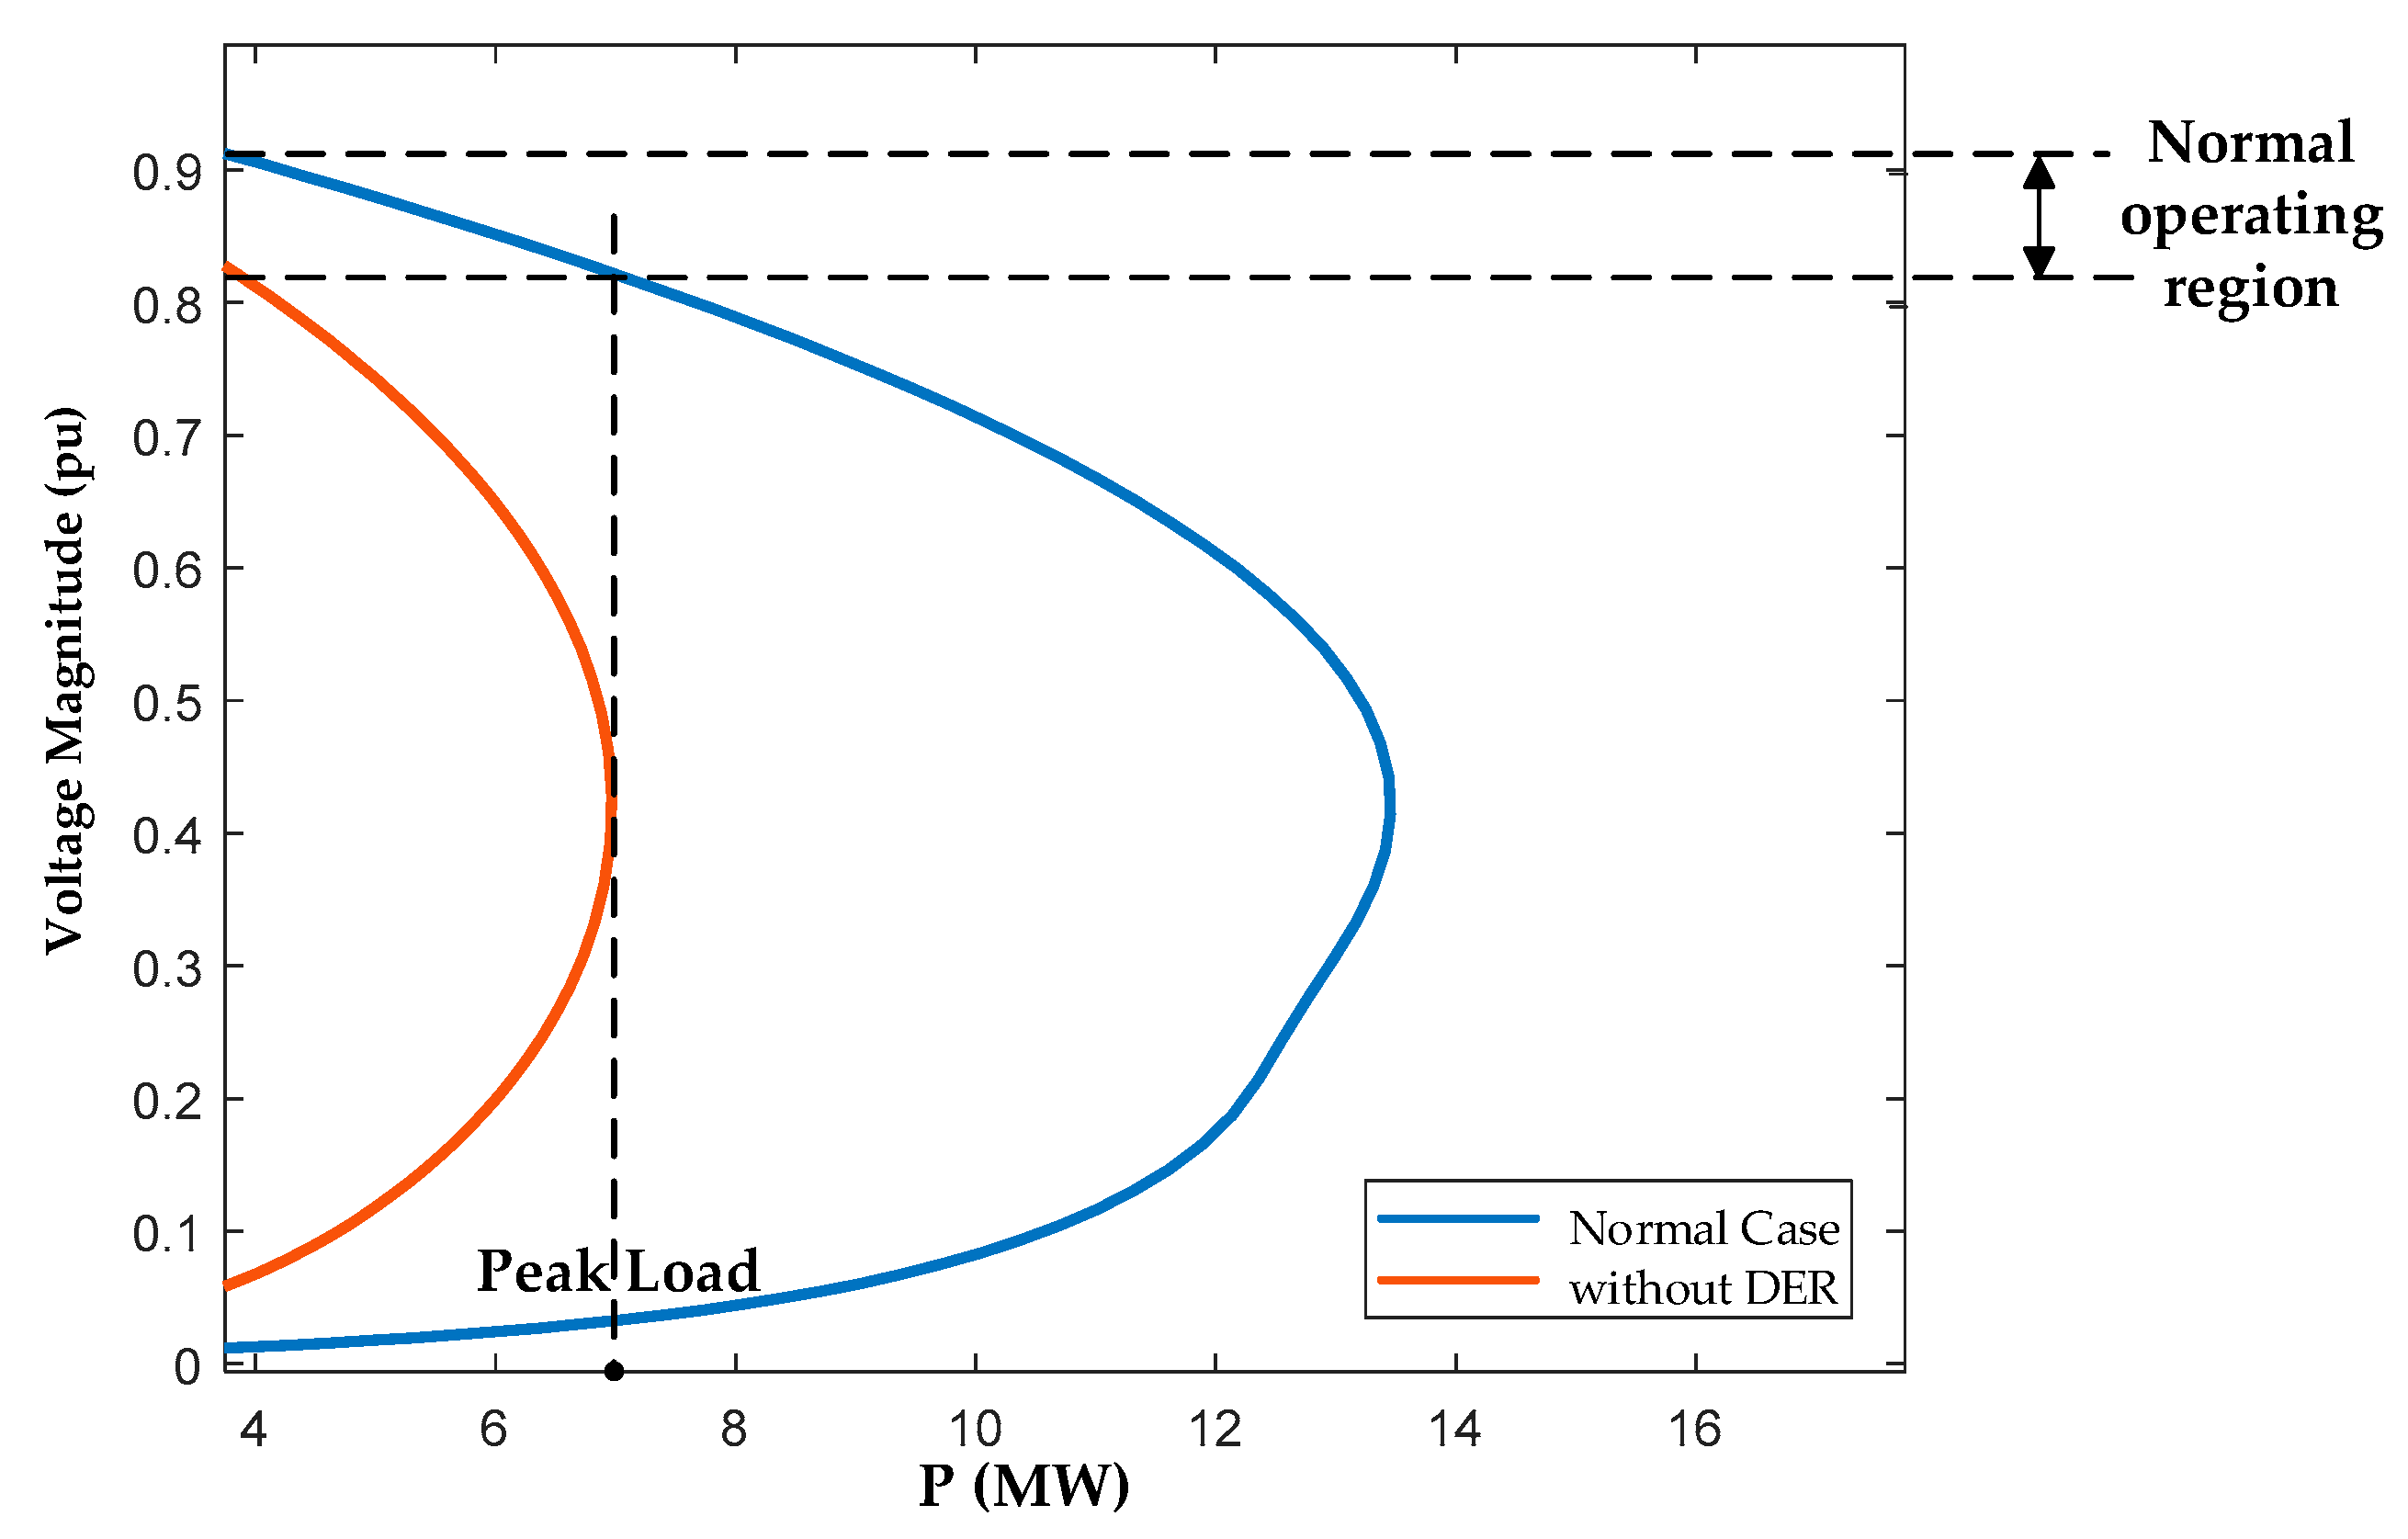
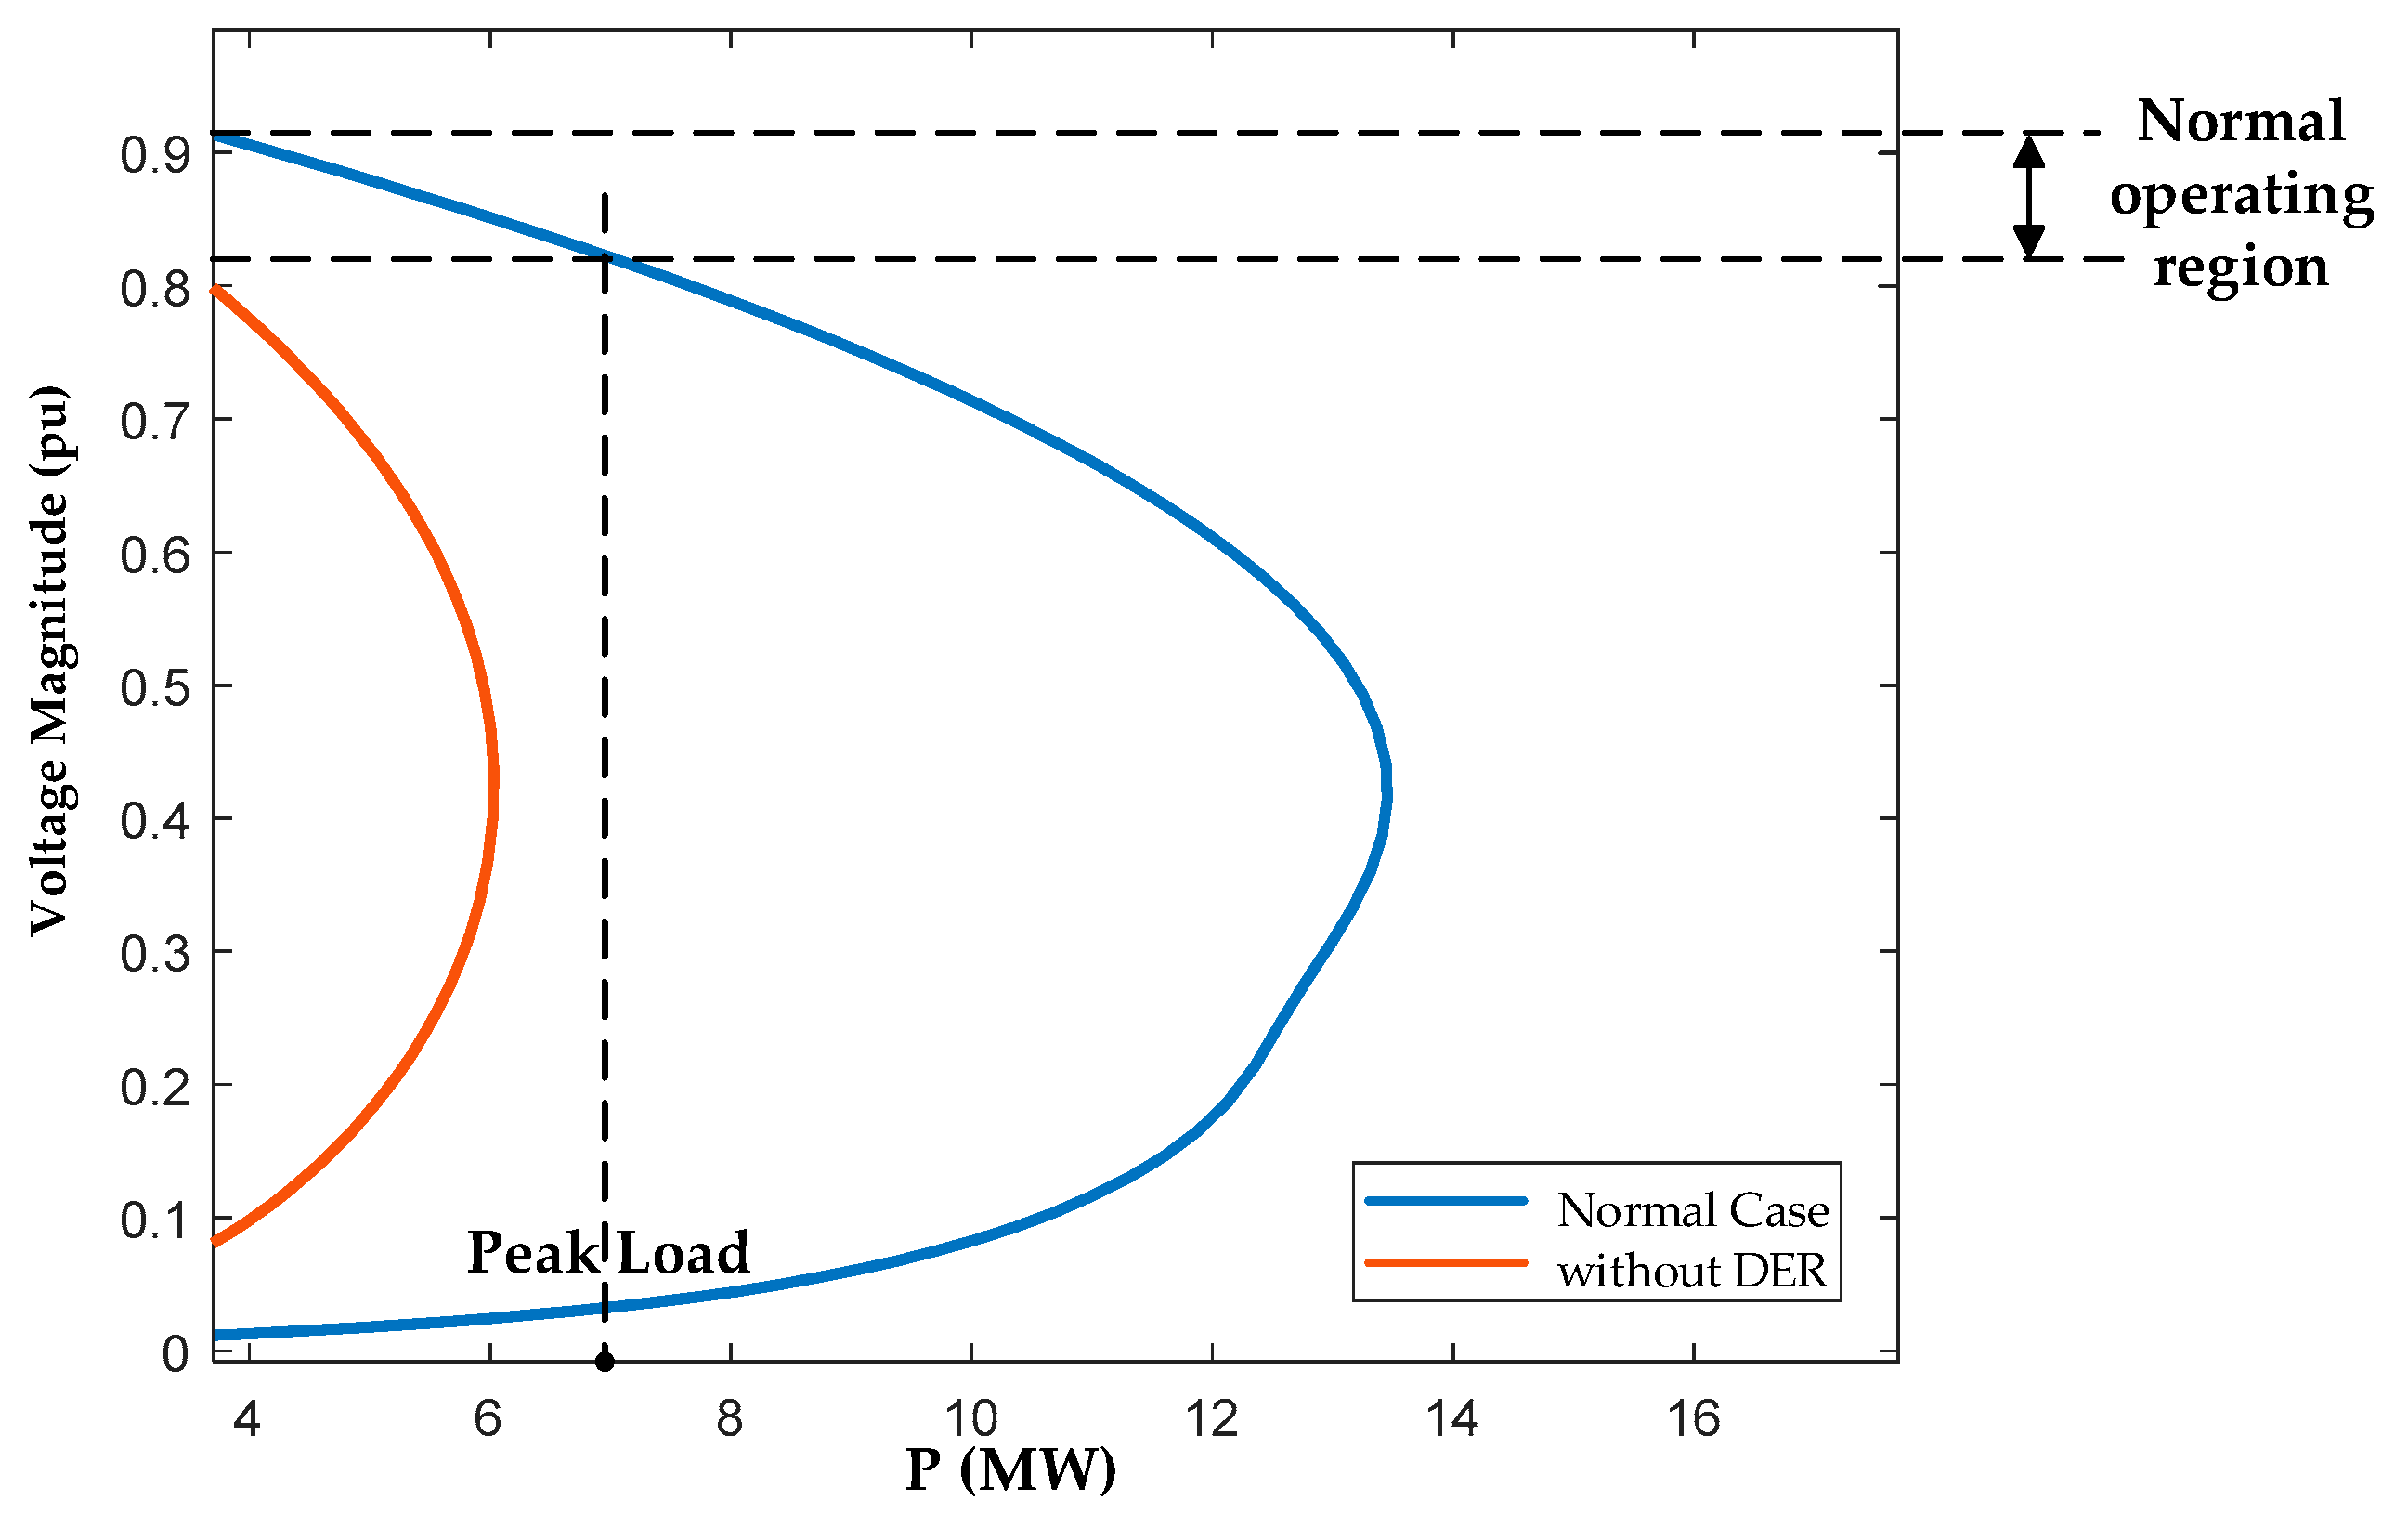
The case studies estimated the maximum hosting capacity to be 5.6 MW, and therefore an installation larger than this threshold could cause serious voltage instability in case of a DER outage. When DER with the maximum available capacity (5.6 MW) is installed in the grid, there is an operating point at the point of contact between the bifurcation point and the peak load (see
Figure 8). However, as shown in
Figure 9, the bifurcation point and the peak load do not overlap when DER of 5.89 MW is deployed, indicating no existing grid operating points. Therefore, the grid is in danger of a possible blackout because there is no operating point for power flow.
A comparison of the stochastic method and the proposed method is provided in
Table 3, in which three cases are presented for DER allocation. In the stochastic method, one needs to test all buses, resulting in many scenarios and a wide range of DER hosting capacity. In contrast, by observing only the weakest bus, the proposed method minimizes the number of scenarios and simulations. Furthermore, it can be noted that high DER hosting capacity is estimated when investigating buses with high voltage stability. This capacity value cannot be used because voltage instability can occur at the weakest bus. In this sense, the weakest bus must be assessed for estimating the maximum hosting capacity.
Because the proposed method only considers undervoltage, we need to take into account other criteria, such as overvoltage, voltage deviation, dynamic voltage, and voltage unbalance at the high penetration of renewables, for more accurate estimation of the maximum hosting capacity. In other words, even though the method estimates the capacity on the basis of undervoltage, other criteria can be violated under normal operating conditions. Hence, further research to estimate the DER hosting capacity considering various criteria is required.
7. Conclusions
In the electric power field, the increasing penetration of renewable energy can provide various benefits that overcome environmental issues and improve economics. However, the main problem is that an electric system may collapse because synchronous generators with a ramp rate cannot adjust the output abruptly in the case of a DER outage with serious disturbance or uncertainty. Thus, in this paper, we present a practical and efficient approach to estimate the hosting capacity by considering the generator ramp rate in a distribution system for stable operation.
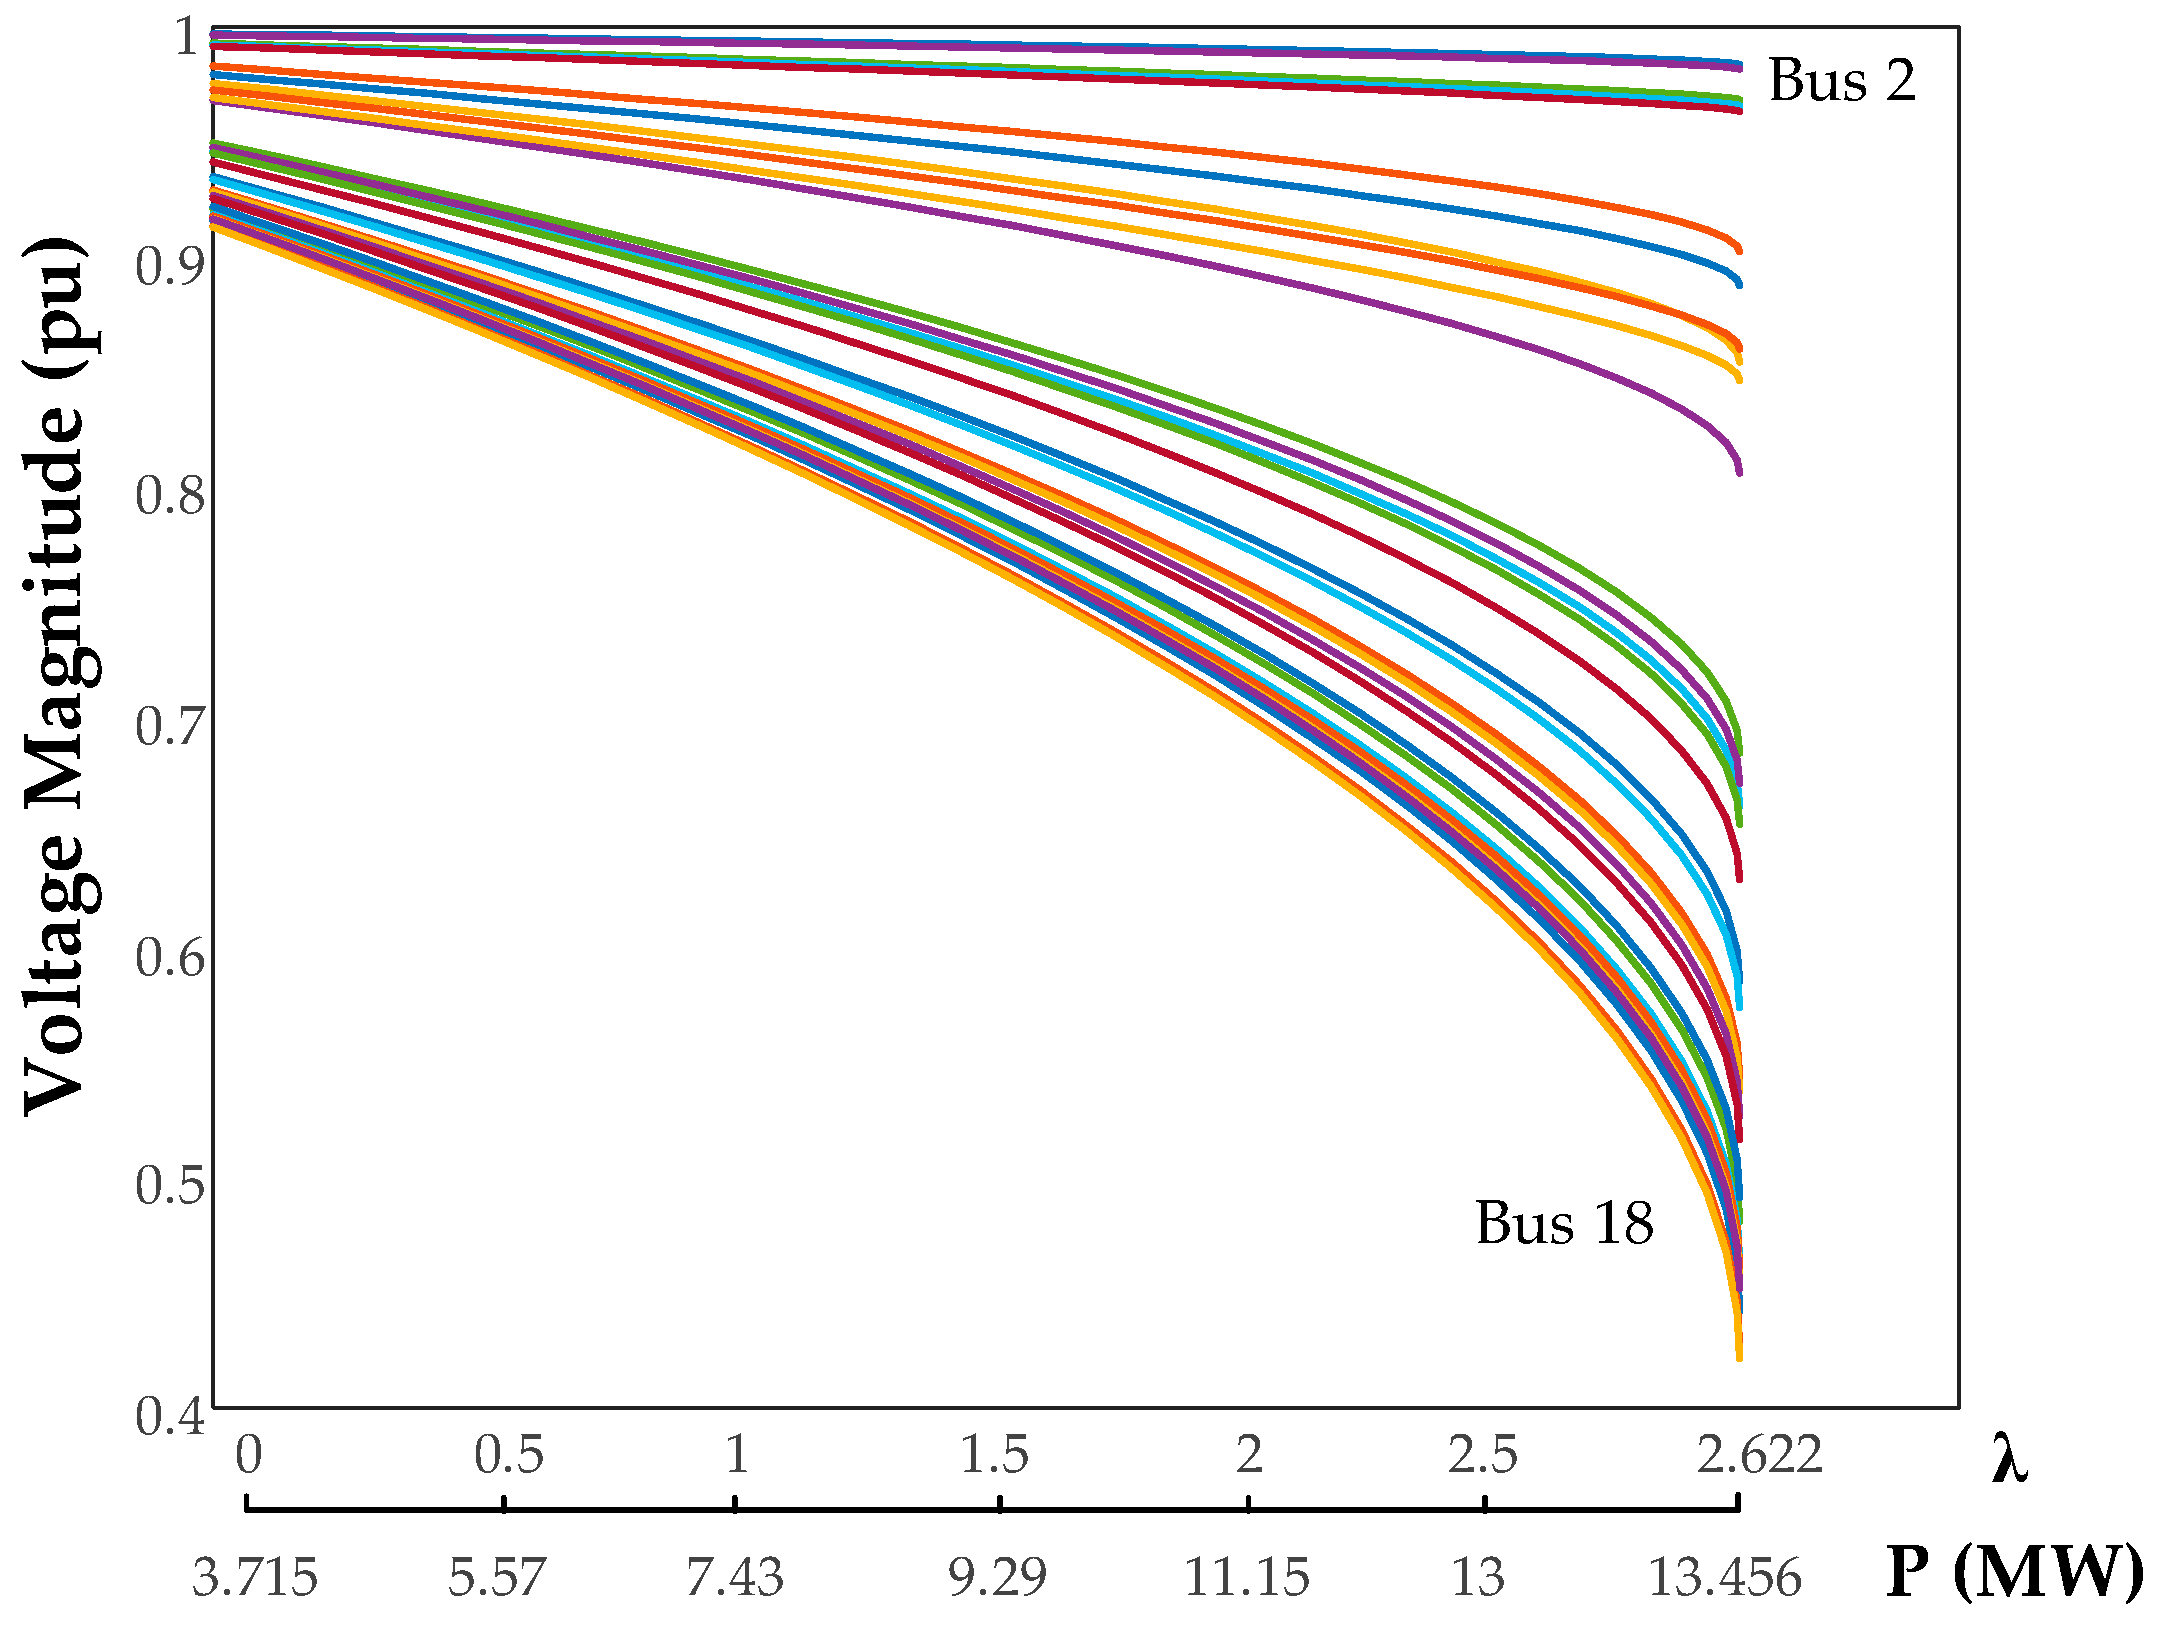
To estimate the DER hosting capacity, in general, the well-known CPF method can be applied using minimum amount of data for power flow. Additionally, the weakest bus is selected from the VSF, and peak load can be used to determine the standard DER hosting capacity. In this study, the DER hosting capacity was estimated based on arc-length parameterization using an IEEE-33 radial distribution system. We found that the weakest bus is bus 18, and the bifurcation point is 13.47 MW. In terms of the DER hosting capacity, it was estimated to be 5.6 MW in this system. If it penetrates by more than 5.6 MW, the system may collapse because the bifurcation point and peak load will no longer overlap with each other. In this study, the DER hosting capacity was calculated by considering the undervoltage problem and DER outages due to abrupt disturbances or uncertainties. In particular, to ensure voltage stability, we focused on calculating the DER hosting capacity by considering undervoltage. Additionally, it is necessary to consider undervoltage and apply this to other criteria, including overvoltage, voltage deviation, dynamic voltage, and voltage unbalance. Moreover, the number of scenarios and the simulation time are minimized by estimating the DER hosting capacity based on the weakest bus.
Consequently, the key contribution of this paper is the estimation of the DER hosting capacity by considering the generator ramp rate based on the CPF method using minimum amount of data for basic power flow. Moreover, this method can also consider voltage stability for the DER hosting capacity using the PV curve, which represents low-voltage characteristic around the load increment.


