Article

The Circular Economy and Organic Fraction of Municipal Solid Waste Recycling Strategies

by
Anna Rolewicz-Kalińska
*,
Krystyna Lelicińska-Serafin
and
Piotr Manczarski
Faculty of Building Services, Hydro and Environmental Engineering, Warsaw University of Technology, 00-653 Warsaw, Poland
*
Author to whom correspondence should be addressed.
Energies 2020, 13(17), 4366; https://doi.org/10.3390/en13174366
Submission received: 29 July 2020 / Revised: 20 August 2020 / Accepted: 21 August 2020 / Published: 24 August 2020
(This article belongs to the Special Issue Biowaste Management)

Abstract

:
Densely populated areas with large incoming populations have difficulty achieving high separate collection rates of municipal solid waste. The manuscript analyzes the link between biowaste collection and circular economy requirements as a fulfilment of the recycling rates and using biogas as a sustainable energy source. Three biowaste collection scenarios and three technical scenarios for its treatment are considered. The first scenario assumes only composting for biowaste treatment, the next includes also anaerobic digestion. In the years 2020–2050, the separate biowaste collection level will increase, depending on the scenario, from 26.9 kg/inh. up to 148.1kg/inh. By 2030, the quantity of biogas generated from biowaste can grow to almost 9 million m3/year, enabling the production of renewable energy at annual levels of almost 17 GWh and 69 TJ. Using the third scenario, the quantity of biogas generated grows more than twice (in 2035). If the capture rate of biowaste increases from 15% to 20% and then to 25%, the quantity of biogas generated grows by, respectively, 65% and more than 100%. Unfortunately, none of the scenarios enables the required municipal solid waste recycling rates in 2030 (60%) and 2035 (65%), which demonstrates the significant need to develop more effective separate collection systems, including biowaste. Methodology applied in the paper can be used for other cities and regions trying to meet circular economy demands.

Graphical Abstract

1. Introduction

The management of Municipal Solid Waste (MSW) still continues to be a significant challenge in all the states of the European Community and is an important element in the transition to Circular Economy (CE) [1]. In the case of MSW, an important aspect of the implementation of the CE assumptions is a plan for reducing their weight deposited at landfills and enhancing the share of waste, which can be returned to the system by material and organic recycling [2]. The European Union has set an ambitious objective for its Member States of ensuring the preparation for re-use and recycling of 65% of MSW in 2035, while, at the same time, reducing its landfilling to not more than 10%. In amending a package of Directives in order to implement the CE principles into European Union law, including the Waste Framework Directive and the Landfill Directive [3,4], a good deal of attention was paid to the Organic Fraction of Municipal Solid Waste (OFMSW), which is an important element in the planning of the sustainable MSW management system [5]. From 2023, Member States will be obliged, among other things, to carry out mandatory biowaste collection. As reported in literature sources creating a circular bioeconomy based on effective use of biomass (including biowaste) is one of the major global concerns [6]. International experiences, including countries such as China, India and Americas, show successful attempts to implement many technologies of valuable use of OFMSW (e.g., in biorefineries, biofuel production), however, there is still a need for further analysis and technological improvements, especially in relation to the quality of feedstock and economic aspects [7].
Biowaste are produced in the entire supply chain. In the MSW management system, the sources of biowaste generated include mostly households and commercial entities [8,9]. Literature data indicate that the share of OFMSW varies on average from 30 to 40% [10,11,12]. A key factor that affects the possibility of further use of biowaste is its quality; in particular, the impurities in the material collected [13,14,15]. This factor is closely related to the efficiency of the OFMSW separate collection system. As indicated in research conducted by Malamis et al [16] in Greece, source separation schemes are key factor for biowaste and further products (e.g., compost) quality. Similar findings can be found in study described by Rodrigues et al. concerning biowaste from 20 treatment plants in Catalonia (Spain) [17]. Italian findings based on the study in Italia Romagna Region highlight that in regions with lower population density (in the range 150–500 inh./km2), it is easier to obtain positive results in the quality of waste separate collection, but it is much more difficult in densely populated areas such as large cities [18]. Similar conclusions can be found in work conducted in the Aveiro municipality (Portugal) [19]. The results obtained during the research in Portsmouth (United Kingdom) indicated that another obstacle to achieving high recycling rates might be a highly transient population [20]. On the other hand, a paper by Carvalho describes that separately collected waste treatment units are effective (in terms of costs) if they cover 400–550 thousand residents [21]. Another study from Portugal, conducted in a municipality with a population of 28,000 inhabitants, showed that selective waste collection may not cause an increase in costs (and even bring them down) if the participation of residents in it is over 40% [22]. Biowaste is not only important for waste management issues, but is also a recognised source of green energy [23,24,25]. It can also be successfully used in the production of biofuels, as a substitute for traditional fossil fuels [26]. The efficiency of biogas production from OFMSW is presented in Table 1; the dry matter content in the quoted sources was respectively 19% [27], 15% [28], 21% [29], and 18% [30].
The technological properties of biowaste are of key importance for their further use on an industrial scale [36]. The literature indicates that there is a strong need to develop biowaste to bioenergy technologies (including biogas production) [37]. At the same time, the work of Achinas et al. [38] indicates an increasing share of Anaerobic Digestion (AD) installations in European Union countries. In addition, other works indicate biowaste processing in AD installations has a positive effect on the reduction of Greenhouse Gases emissions [39]. For example, in their paper, Demichelis et al. concluded that for the case study of Italy biowaste treatment, avoided CO2 emissions were increased between 10% and 89.9%, when applying AD instead thermal treatment [40]. The work of Zeller et al., analysing circular biowaste management options at city-region level, concludes that AD treatment combined with separate collection may be beneficial in terms of meeting environmental criteria (based on life cycle assessment) [41]. Research by Maroušek et al. indicates that the benefits of AD technology can be extended by further using the digestate to produce biochar [42]. Moreover, if the quality requirements are met, the digestate can traditionally be used as an organic fertilizer [43]. According to the European Environment Agency [44], 30–40% of municipal solid waste generated in Europe can be used for anaerobic digestion.
In the future, the technology for the treatment of the OFMSW will aim for the most effective use of its values, in accordance with the principles of the CE. In practice, this means reducing waste landfilling to a minimum in favour of more efficient treatment methods [45]. When planning the development of OFMSW processing technology, one should also take into account the global transformation to industry 4.0 [46]. In this context, new solutions should be sought, including the introduction of new business models [47].
This will be inseparably related, among other things, to the intensive development of separate collection systems [48,49,50,51]. The works cited earlier broadly analyse different aspects of separate collection, but we have not found a comprehensive analysis that relates them to the CE recycling demands.
This article analyzes how the development of the separate biowaste collection system and the treatment of the waste acquired affects the fulfilment of the CE requirements. For this purpose, the research analyzes three scenarios for the separate biowaste waste collection development and three paths for its future treatment. All scenarios are analyzed within the timeframes until 2030 (the nearest 10 years) and until 2050 (as a long-term outlook). The further part of the paper is composed as follows. Section 2 includes methodology and key concepts of the paper. In the third part, there is a discussion of the results on the potential of bio-waste in Warsaw in comparison with other countries, and on the three options for the MSW treatment development (with particular emphasis on OFMSW treatment). The last part presents the conclusions, first it shows the possibility of universal use of the results obtained. The original results of this work can support decision makers in more effective MSW planning, in particular in the future technological transformation adapted to the changing waste stream and CE requirements. It also indicates that the dynamic development of biowaste collection, even if the assumptions for the collection of the packaging waste are met, is necessary to meet the CE requirements.
Acronyms used in the paper are presented in Table 2.

2. Materials and Methods

2.1. Case Study Description

The objective of the analysis is the capital of Poland (Warsaw). In 2018, it had 1.778 million inhabitants [52]. The weight of MSW generated in Warsaw in 2018 was 775,513 Mg [53], indicating that per year one, city inhabitants generated 436 kg of waste.
The city has a five container-based system for MSW collection door-to-door, including the collection of: mixed waste, plastics and metals, glass, paper, and biowaste. Green waste is also collected separately. Separate biowaste collection from households was introduced in early 2019. Within this fraction, food waste and other biowaste are collected, excluding products of animal origin, such as bones, meat waste or animal fats. The pilot studies on the quality of the biowaste collected, which were carried out in 2019, showed that the waste collected had a high content of impurities, of nearly 17.5%; Table 3 [pilot study, unpublished].
Our own studies on the composition of food-derived biowaste generated in households indicated that waste of animal origin represented about 14% [pilot study, unpublished].
As regards the technological capacity for the treatment of municipal solid waste fractions collected in Warsaw, particularly mixed waste and biowaste, at present the city has an incineration plant for mixed municipal solid waste. The plant has a treatment capacity of 40,000 Mg per year and access to a Mechanical Biological Treatment plants (MBT), with aerobic stabilisation in the biological part, and CP for separately collected green waste and a small amount of food waste. It is planned that the existing incineration plant will be expanded to a capacity of 300,000 Mg per year. The city also encourages residents who live in single-family houses to engage in home composting by introducing a lower waste fee for households that have a composting unit.

2.2. Biowaste Separate Collection Scenarios

The analysis of the capacity for biowaste treatment, including its energy potential, requires a quantitative and qualitative assessment of the OFMSW collected. In this article, the biowaste content in MSW was estimated on the basis of the only data available on the composition of MSW in Poland, as contained in the National Solid Waste Management Plan. According to the Plan, the average morphological composition of MSW generated in large cities (with more than 50,000 inhabitants) in 2014 indicates that the share of biowaste is about 34.2%, with food waste representing 84% and green waste representing 16% of the biowaste fraction [54]. Similar data can be found in the publications on the composition of waste in Polish cities [55,56].
The quantitative assessment of the biowaste stream available within the timeframe until 2050 was performed using three different scenarios for the development of the separate OFMSW collection system. For all three scenarios, common assumptions were adopted on the general changes in the quantities of the MSW generated. In accordance with the analyses of waste management trends determined on the basis of historical data, it was assumed that Poland would see a mean annual increase of about 0.5% in the share of the biodegradable fractions in the total MSW stream and that the rate of increase would remain the same until 2025. This would be followed over the subsequent 10 years by an annual rate of 0.1%, until it stabilises in 2035 at the level of a 40.7% share of biowaste in MSW. The changes in the total weight of the waste generated were determined on the basis of the forecast of demographic changes adopted in the Strategy for the development of Warsaw [57], which provided that the number of inhabitants would increase in 2020 by about 4.8% relative to 2014 when Warsaw had 1.735 million inhabitants and that then its increase would slow down, to reach about 1.8 million in 2050. On the basis of the data on the MSW in Warsaw in the period from 2014 to 2018 [52], it was assumed that the generation rate (calculated as the mass of waste generated per inhabitant) for all the MSW would increase by 1% annually until 2030 and then by 0.5% until 2050.
Since 2013, green waste has been collected in Warsaw at the level of 78.5% [53]. It was assumed for all three scenarios that in the first year the capture rate (understood as the amount of waste collected and diverted to recycling) of food waste reached the level of 5%. Moreover, it was assumed that in all scenarios the green waste collection system would develop in a similar way; specifically, that it would grow by 2% annually over the first 20 years and then stabilise at an annual growth rate of 1%. For the purposes of this analysis, it was assumed that all collected waste would be recycled, which means that the capture and recycling rate have the same value. This is a simplification, due to the fact some of the biowaste will not be suitable for further use due to impurity content and improper collection conditions, among other things [58,59].
The first separate collection scenario S1 was determined on the basis of historical data on changes in the capture rate of the separate collection of dry fractions (paper, plastics and metals, glass) in Warsaw [60]. It was assumed that the weight of separately collected food waste would grow by 20% on a mean annual basis over the first 10 years after the separate biowaste collection system introduction (2019–2029). It was assumed, that over the subsequent 8 years, it would grow with a tendency to gradual decline by 2 percentage points annually (2030–2038), and that it would stabilise from 2039. The growth curve for separately collected waste shows a logarithmic trend and the growth rate diminishes when the separate collection system eliminates its gaps and is strengthened.
Scenario S2 assumes that a separate food waste collection system would develop more slowly than under scenario S1, by 15% over the first 10 years (2019–2029), to drop by 1% over the subsequent 14 years and to stabilise in 2042.
Scenario S3 provides for the dynamic development of the separate food waste collection, assuming that the experiences and effects of societal education achieved when introducing the collection of dry fractions would induce a higher growth rate of separate biowaste collection—by 25% over the first 25 years and by 20% over the subsequent 5 years. From 2029 it would be followed by a similar growth rate as in scenario S1.

2.3. Technical Scenarios

The proposed investigation considered three Technical Scenarios (TSs) for Municipal Solid Waste Management. For each of them, using the Material Flow Analysis method [61], the waste flow was calculated for the period from 2020 to 2050, with a 5-year step. All the scenarios include home composting in some single-family housing (as a measure to prevent waste generation); separate biowaste collection from households in single- and multi-family buildings; from commerce, institutions and business; as well as separate collection of green waste from parks. Separate collection scenarios are described in Section 2.2.
For the analysis of all the TSs, common technological assumptions were adopted in the field of home composting, waste incineration and recycling of dry fractions. The main variable in the research was the development of technology (industrial installations) for the treatment of the separately collected OFMSW. With constant assumptions for the above-mentioned, another variable will also be the mass of waste directed to MBT plants and to landfills. The initial rate of 15% effectiveness was assumed for home composting in 2020 (denoting the share of single-family housing residents who have decided on home composting), to be followed by gradual growth until its stabilisation at the level of 30% in 2030. This is a very conservative scenario, since the literature sources indicate that with appropriately implemented information and education programmes supporting home composting, an effectiveness of even more than 70% can be achieved [62]. For waste incineration, assumptions consistent with the actual situation and plans for Warsaw were adopted; specifically, that the existing waste incineration plant with a treatment capacity of 40,000 Mg, generating 2.4 MWe of electricity and 10 MWth of heat, would operate until 2024. In accordance with the city plans, in 2025 it is to be expanded to a capacity of 300,000 Mg, to generate 23 MWe of electricity and 54 MWth of heat [60]. At the same time, according to the legal requirements in Poland, the incineration plant may burn up to 30% of the MSW generated in the region [35,63]. As regards the development of dry fraction recycling in the period from 2020 to 2050, it was assumed that it would be consistent with the CE requirements; specifically, that 65% of total packaging waste would be recycled in 2025 and that the 70% target would be achieved in 2030 [4,63] then to stabilise until 2050.
In TS-I food waste (excluding animal by-products) and green waste is collected, then directed to organic recycling at a CP; see Figure 1.
In TS-II, food waste (excluding animal by-products) and green waste is collected, and then is intended for organic recycling at a (50% of OFMSW collected) and at an AD plant (50% of OFMSW collected). The composting process runs in two stages, with the first stage in closed conditions involving forced aeration and the discharge and treatment of process air, and the second stage in heaps in an open area with mechanical shifting; or as a whole in closed conditions involving forced aeration and the discharge and treatment of process air; see Figure 2.
In TS-III, food waste (including animal by-products) and green waste are collected and directed to organic recycling at an AD plant (95% of the OFMSW collected) and at a CP (5% of the OFMSW collected); see Figure 3.
The introduction of this model of biowaste collection (including animal by-products) is very difficult due to sanitary aspects [64]; therefore, in most countries only fruit and vegetable food waste is collected from households [65].

2.4. Biogas Generation

Biogas generation was determined using the properties of biowaste listed in Table 1. identified in our own studies on biowaste generated in Warsaw and the literature data on properties of feedstock used in AD process in Poland adopted following Iglinski et al. [30], including: biogas yield from OFMSW 90 m3·Mg−1, biogas yield from 1 Mg of dry matter of OFMSW 543 m3, and methane content in biogas 60%.
The parameters used to determine the potential for electricity and heat production from biogas generated from OFMSW (in cogeneration) included: the calorific value of methane of 33 MJ·m−3 (9.17 kWh·m−3), the thermal efficiency in cogeneration of 43%, the electrical efficiency in cogeneration of 38%, and the 90% availability of facilities in a year [27,66].

3. Results and Discussion

3.1. Biowaste Theoretical Potential

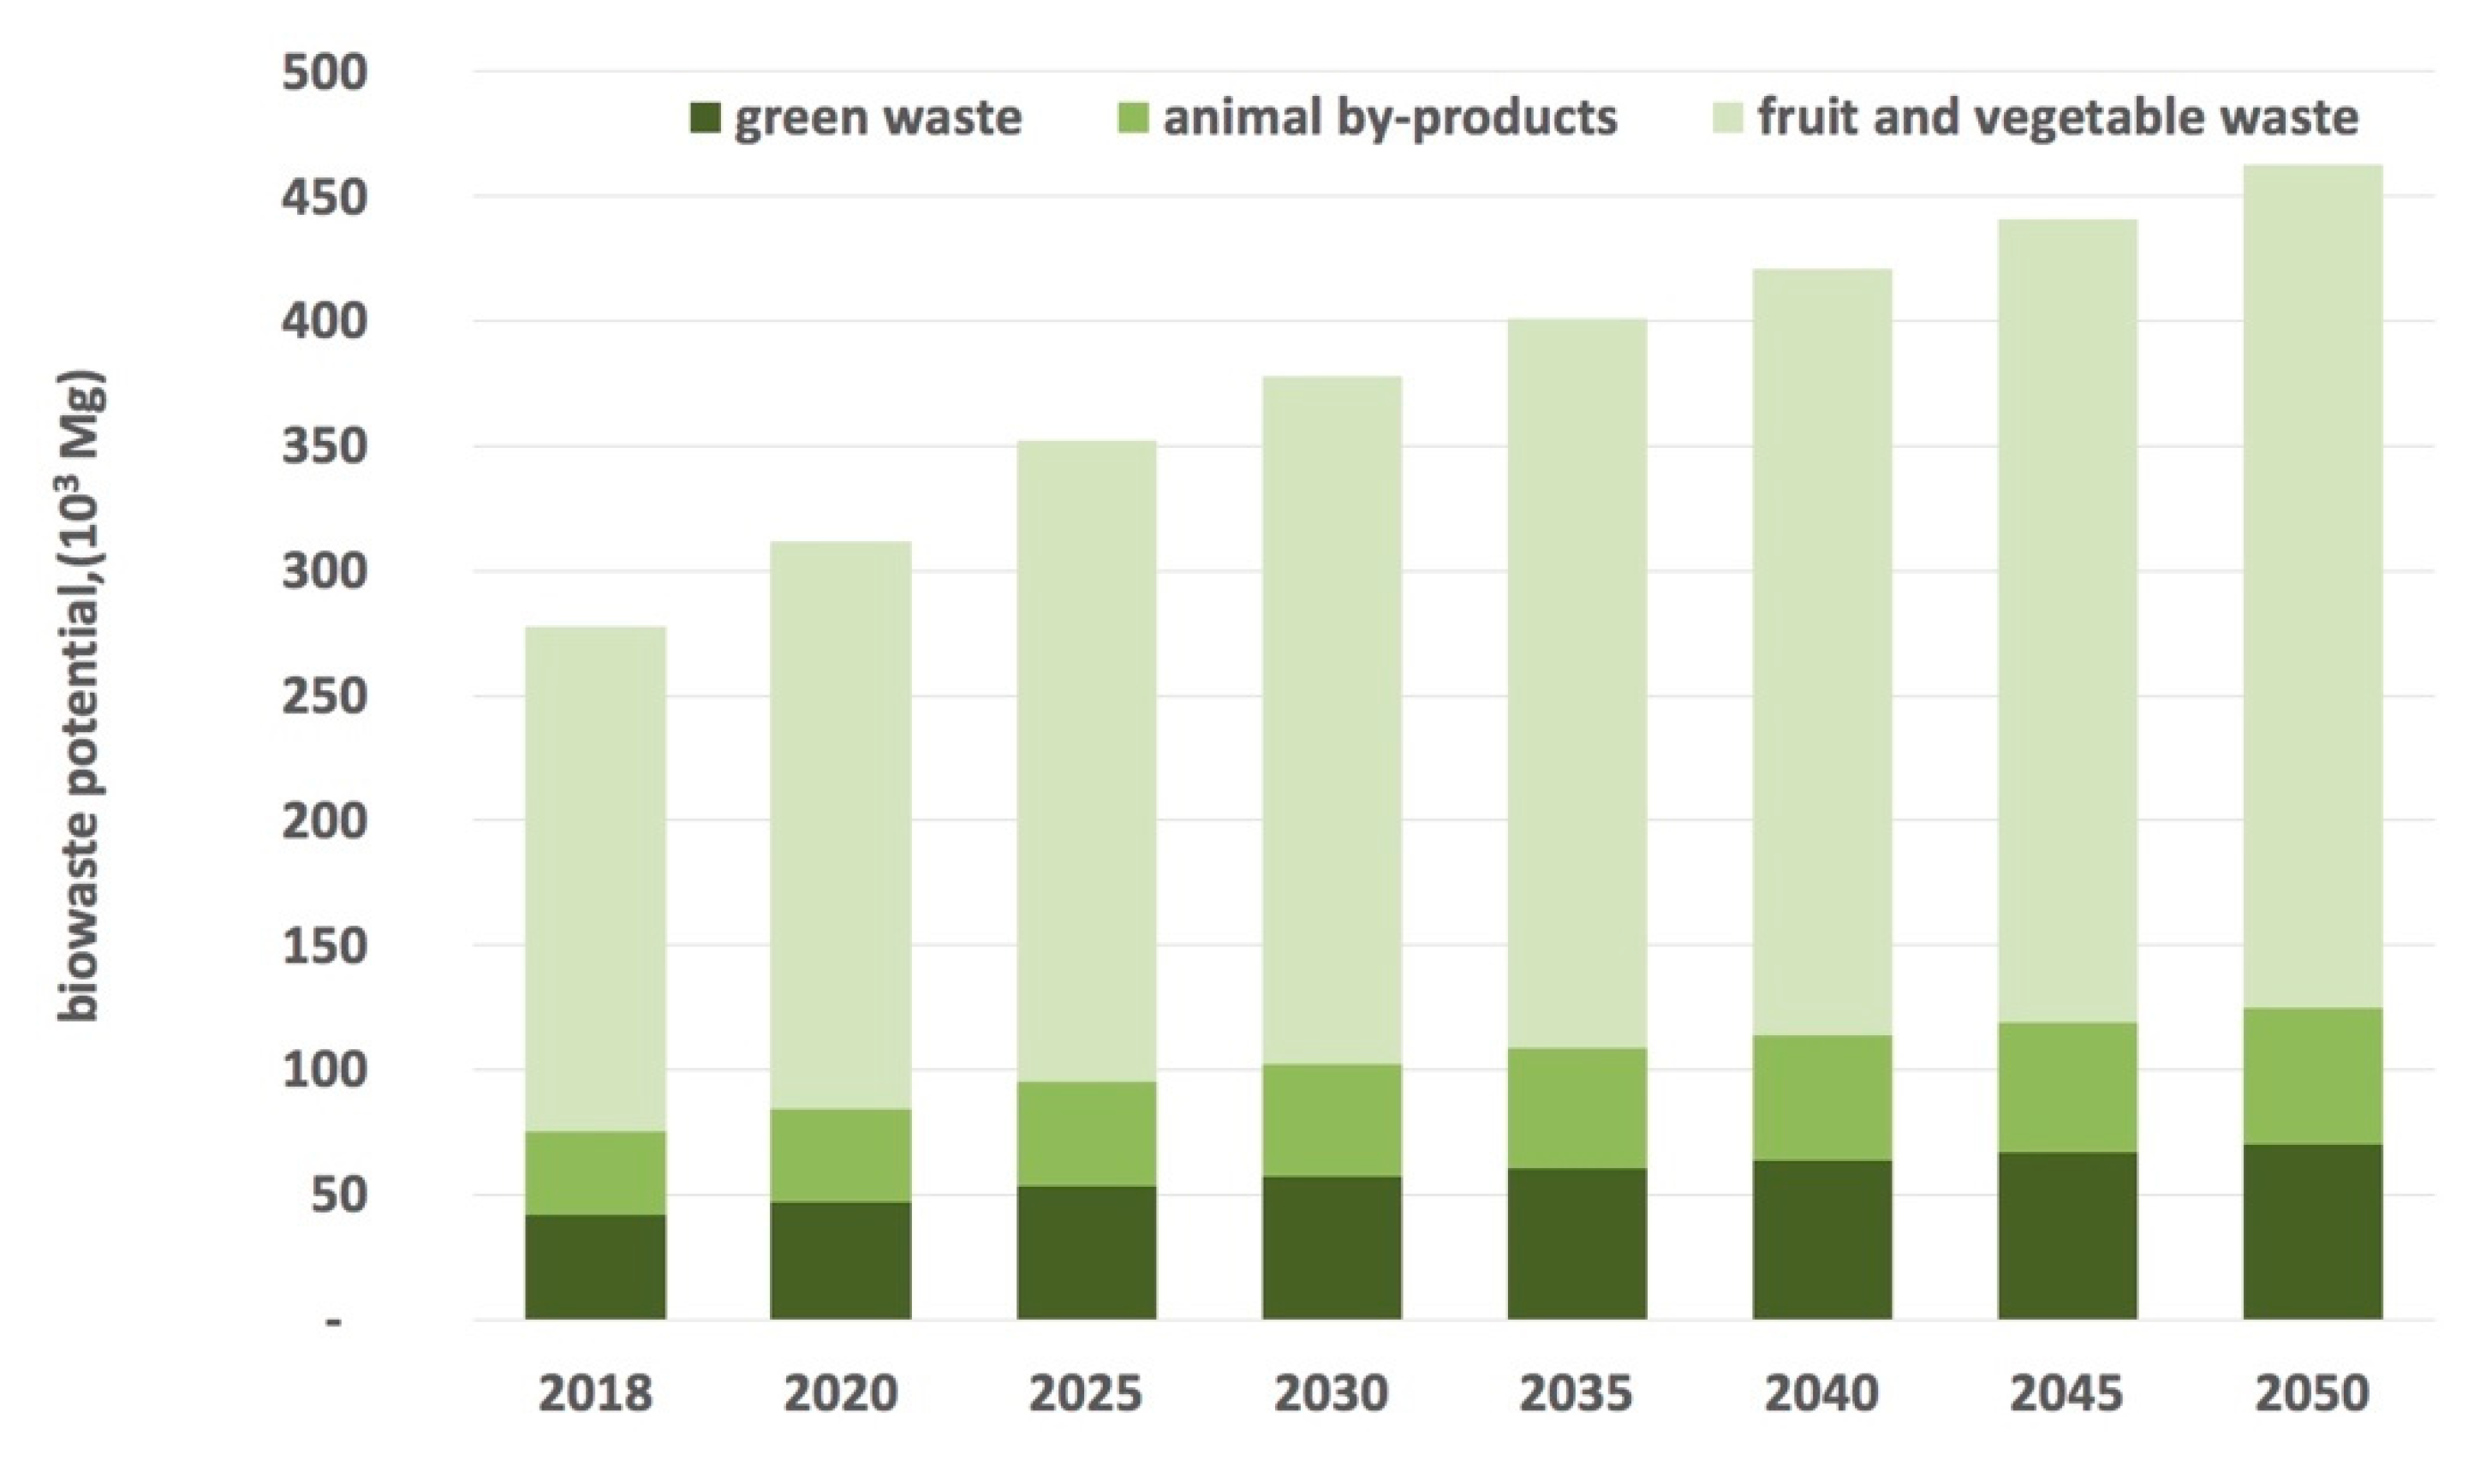
The food waste potential per inhabitant estimated for 2018 was 133 kg/inh. and it will gradually grow to reach 193 kg/inh. in 2050. In the analogous time interval, the indicator estimated for green waste varies in the range from 23 to 35 kg/inh. Figure 4. shows the potential of food and green waste until 2050.
The data for Europe as cited by Corrado and Sala indicate food wastage (in the entire supply chain) in the range from 158 to 298 kg/inh. [9]. The data on food waste arising only in households indicate that it is generated e.g., at a rate of about 76.1 kg/inh. in Greece and that of 68.04 kg/inh. in Hungary. Higher food waste levels arising in households can be found in the report [67], which states that 113 kg/inh. is generated in Europe, while the quantity in Poland is 112 kg/inh. The same report states that the total generation rate of biowaste in Poland is 247 kg/inh. Because the collection of green waste in Warsaw was already at a high level of 78.5% in 2018, the development of scenarios of biowaste separate collection in general will be determined by the development of food waste collection. In the analogous years in scenario S2, the following values will be achieved, respectively: 26.9 kg/inh. (2020), 51.2 kg/inh. (2030), and 99.4 kg/inh. (2050); while in scenario S3 they will be: 27.5 kg/inh. (2020), 76.9 kg/inh. (2030), and 148.1 kg/inh. (2050). For example, in Germany in 2016, 148 kg/inh. of OFMSW was collected, of which over 93% was green waste. According to statistics, the capture rate of green waste in Germany is 78% and of food waste 56%. The highest collection rates, reaching a total biowaste capture rate of between 70–85%, are reported for selected cities and regions: Parma (Italy), Gratz (Austria) and Lubljana (Slovenia) [51]. The average collection level of biowaste in the EU is about 50 kg/inh. [68].
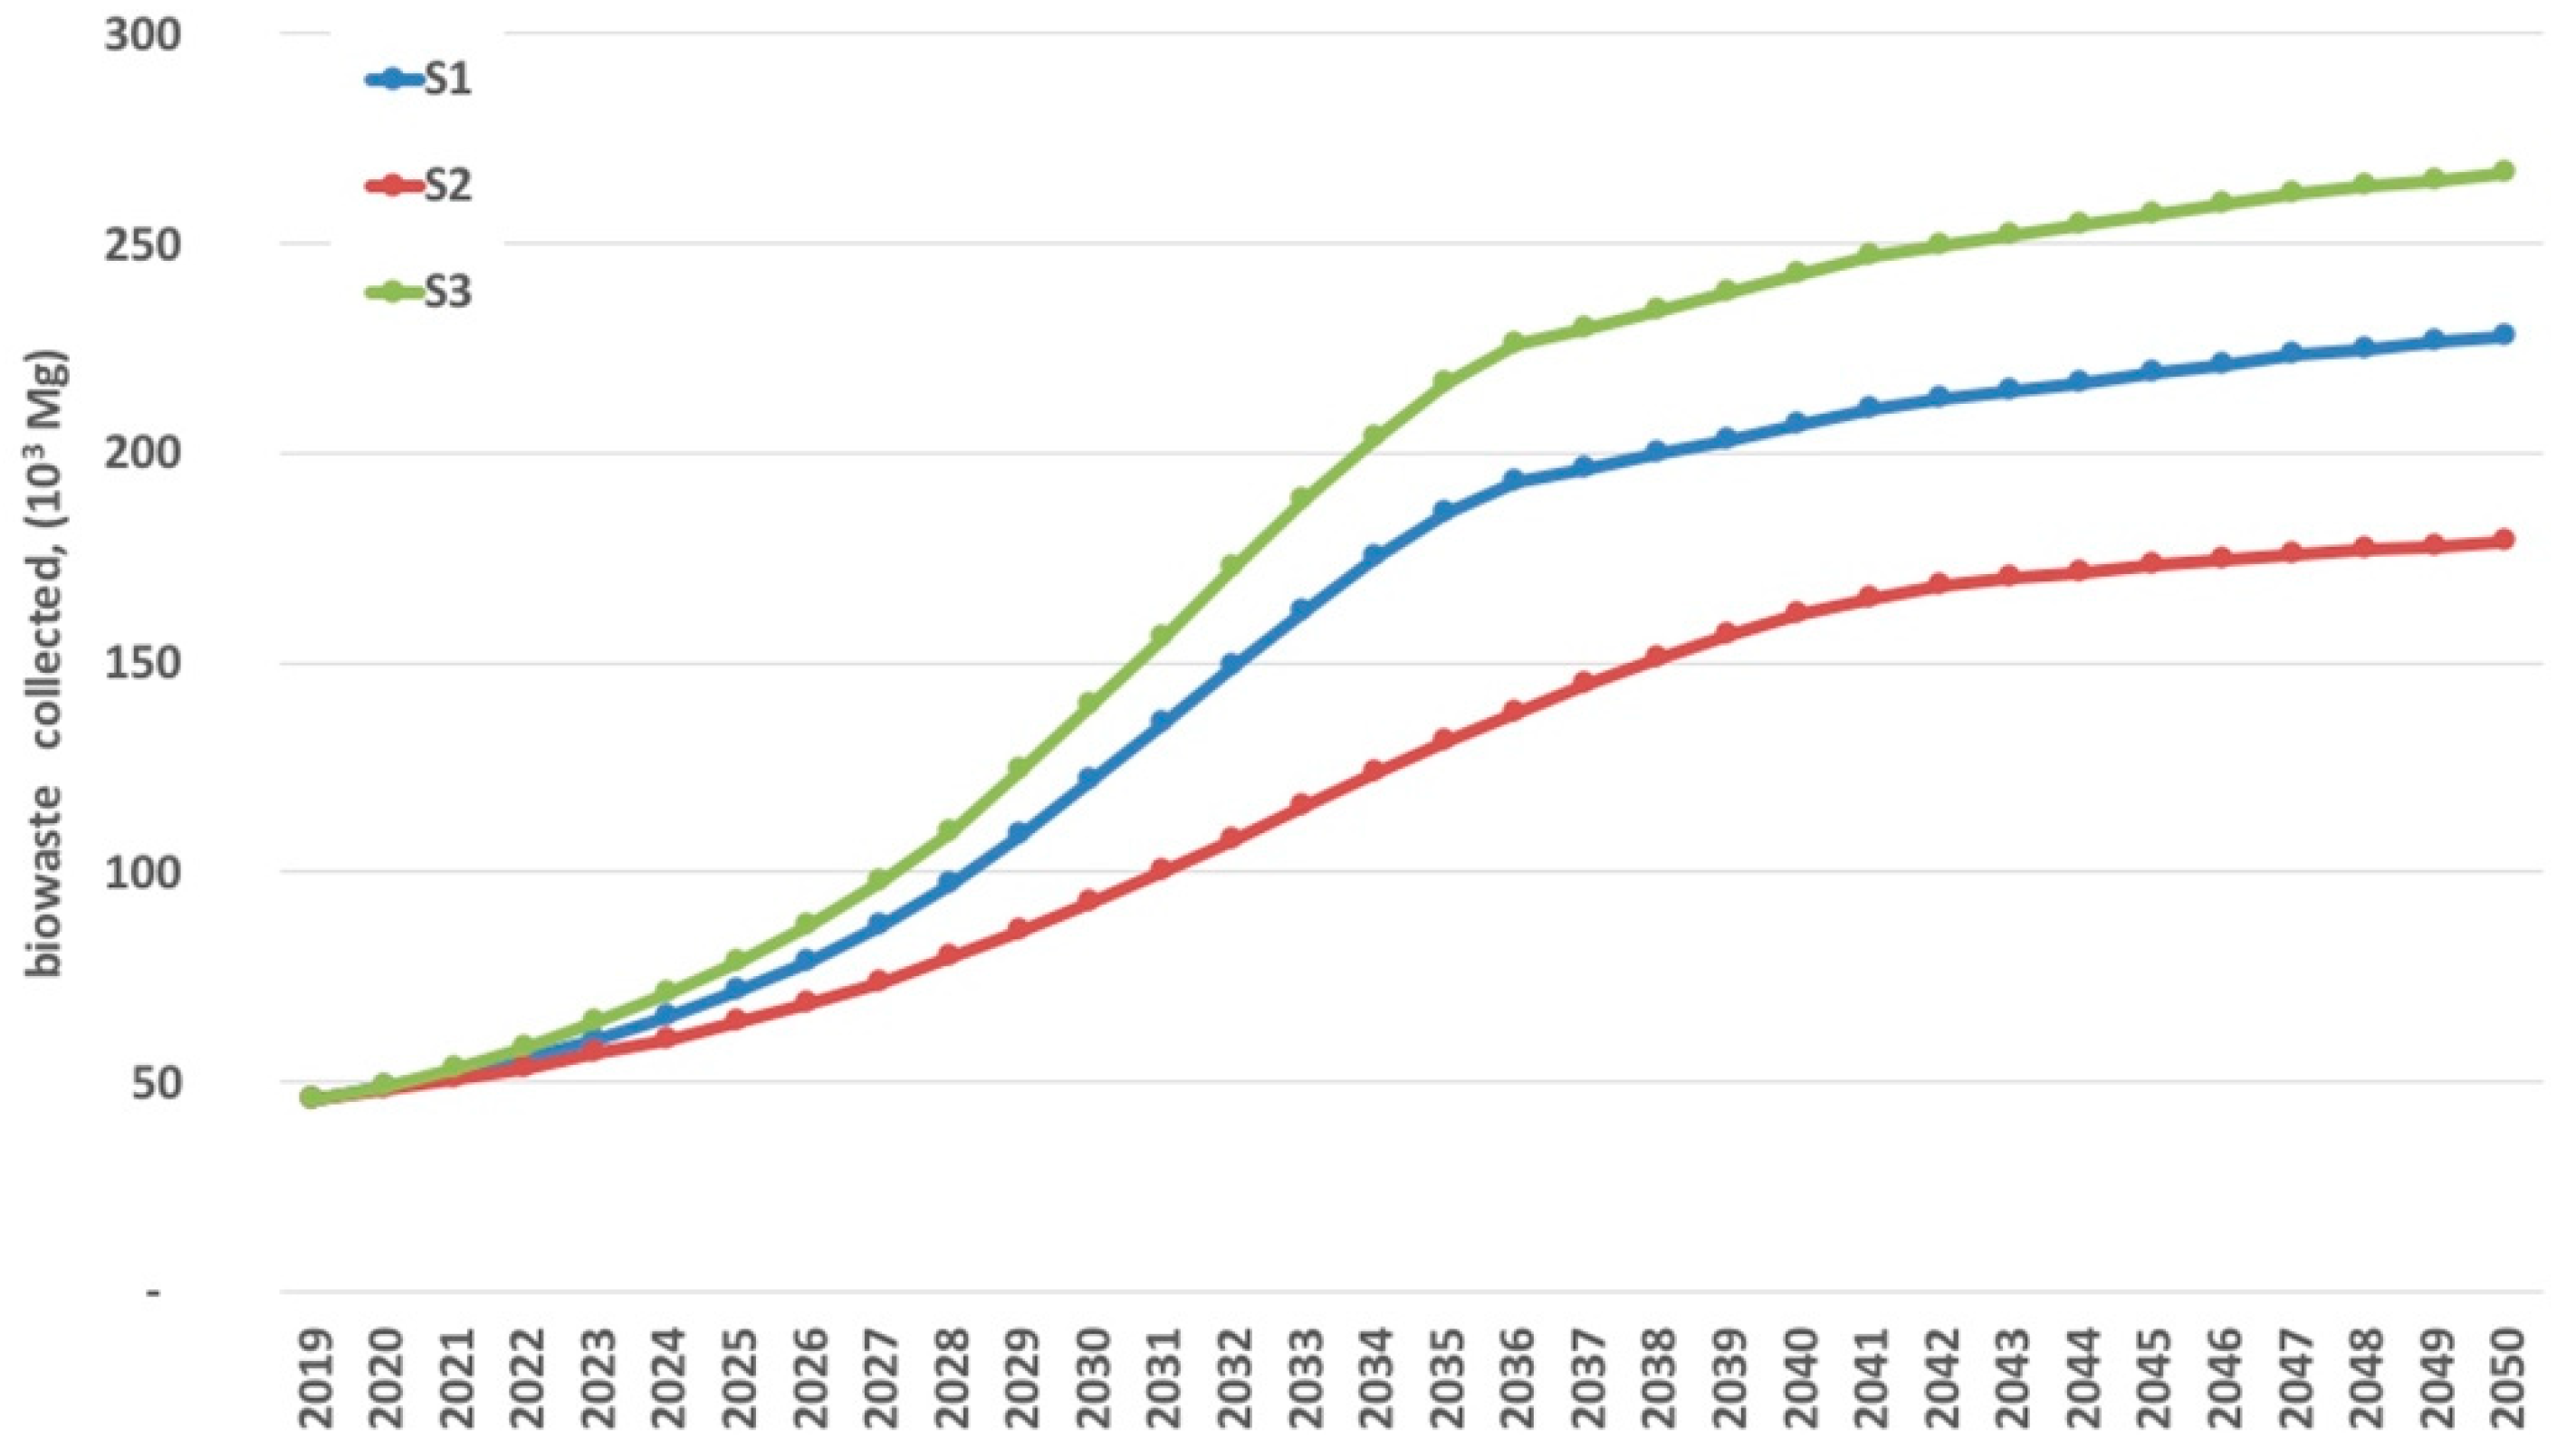
An analysis of the three scenarios of separate biowaste collection presented in Figure 5. indicates that over the first 5 years the differences in the mass of the OFMSW collected are slight, that only after 2025 do the first differences in capture rate appear between the scenarios implemented and that after 2030 it can be clearly seen that scenario S2 strongly differs in terms of the development pace from scenarios S1 and S3. In subsequent years, this difference grows, although the growth rate of separate collection halts for each of them.
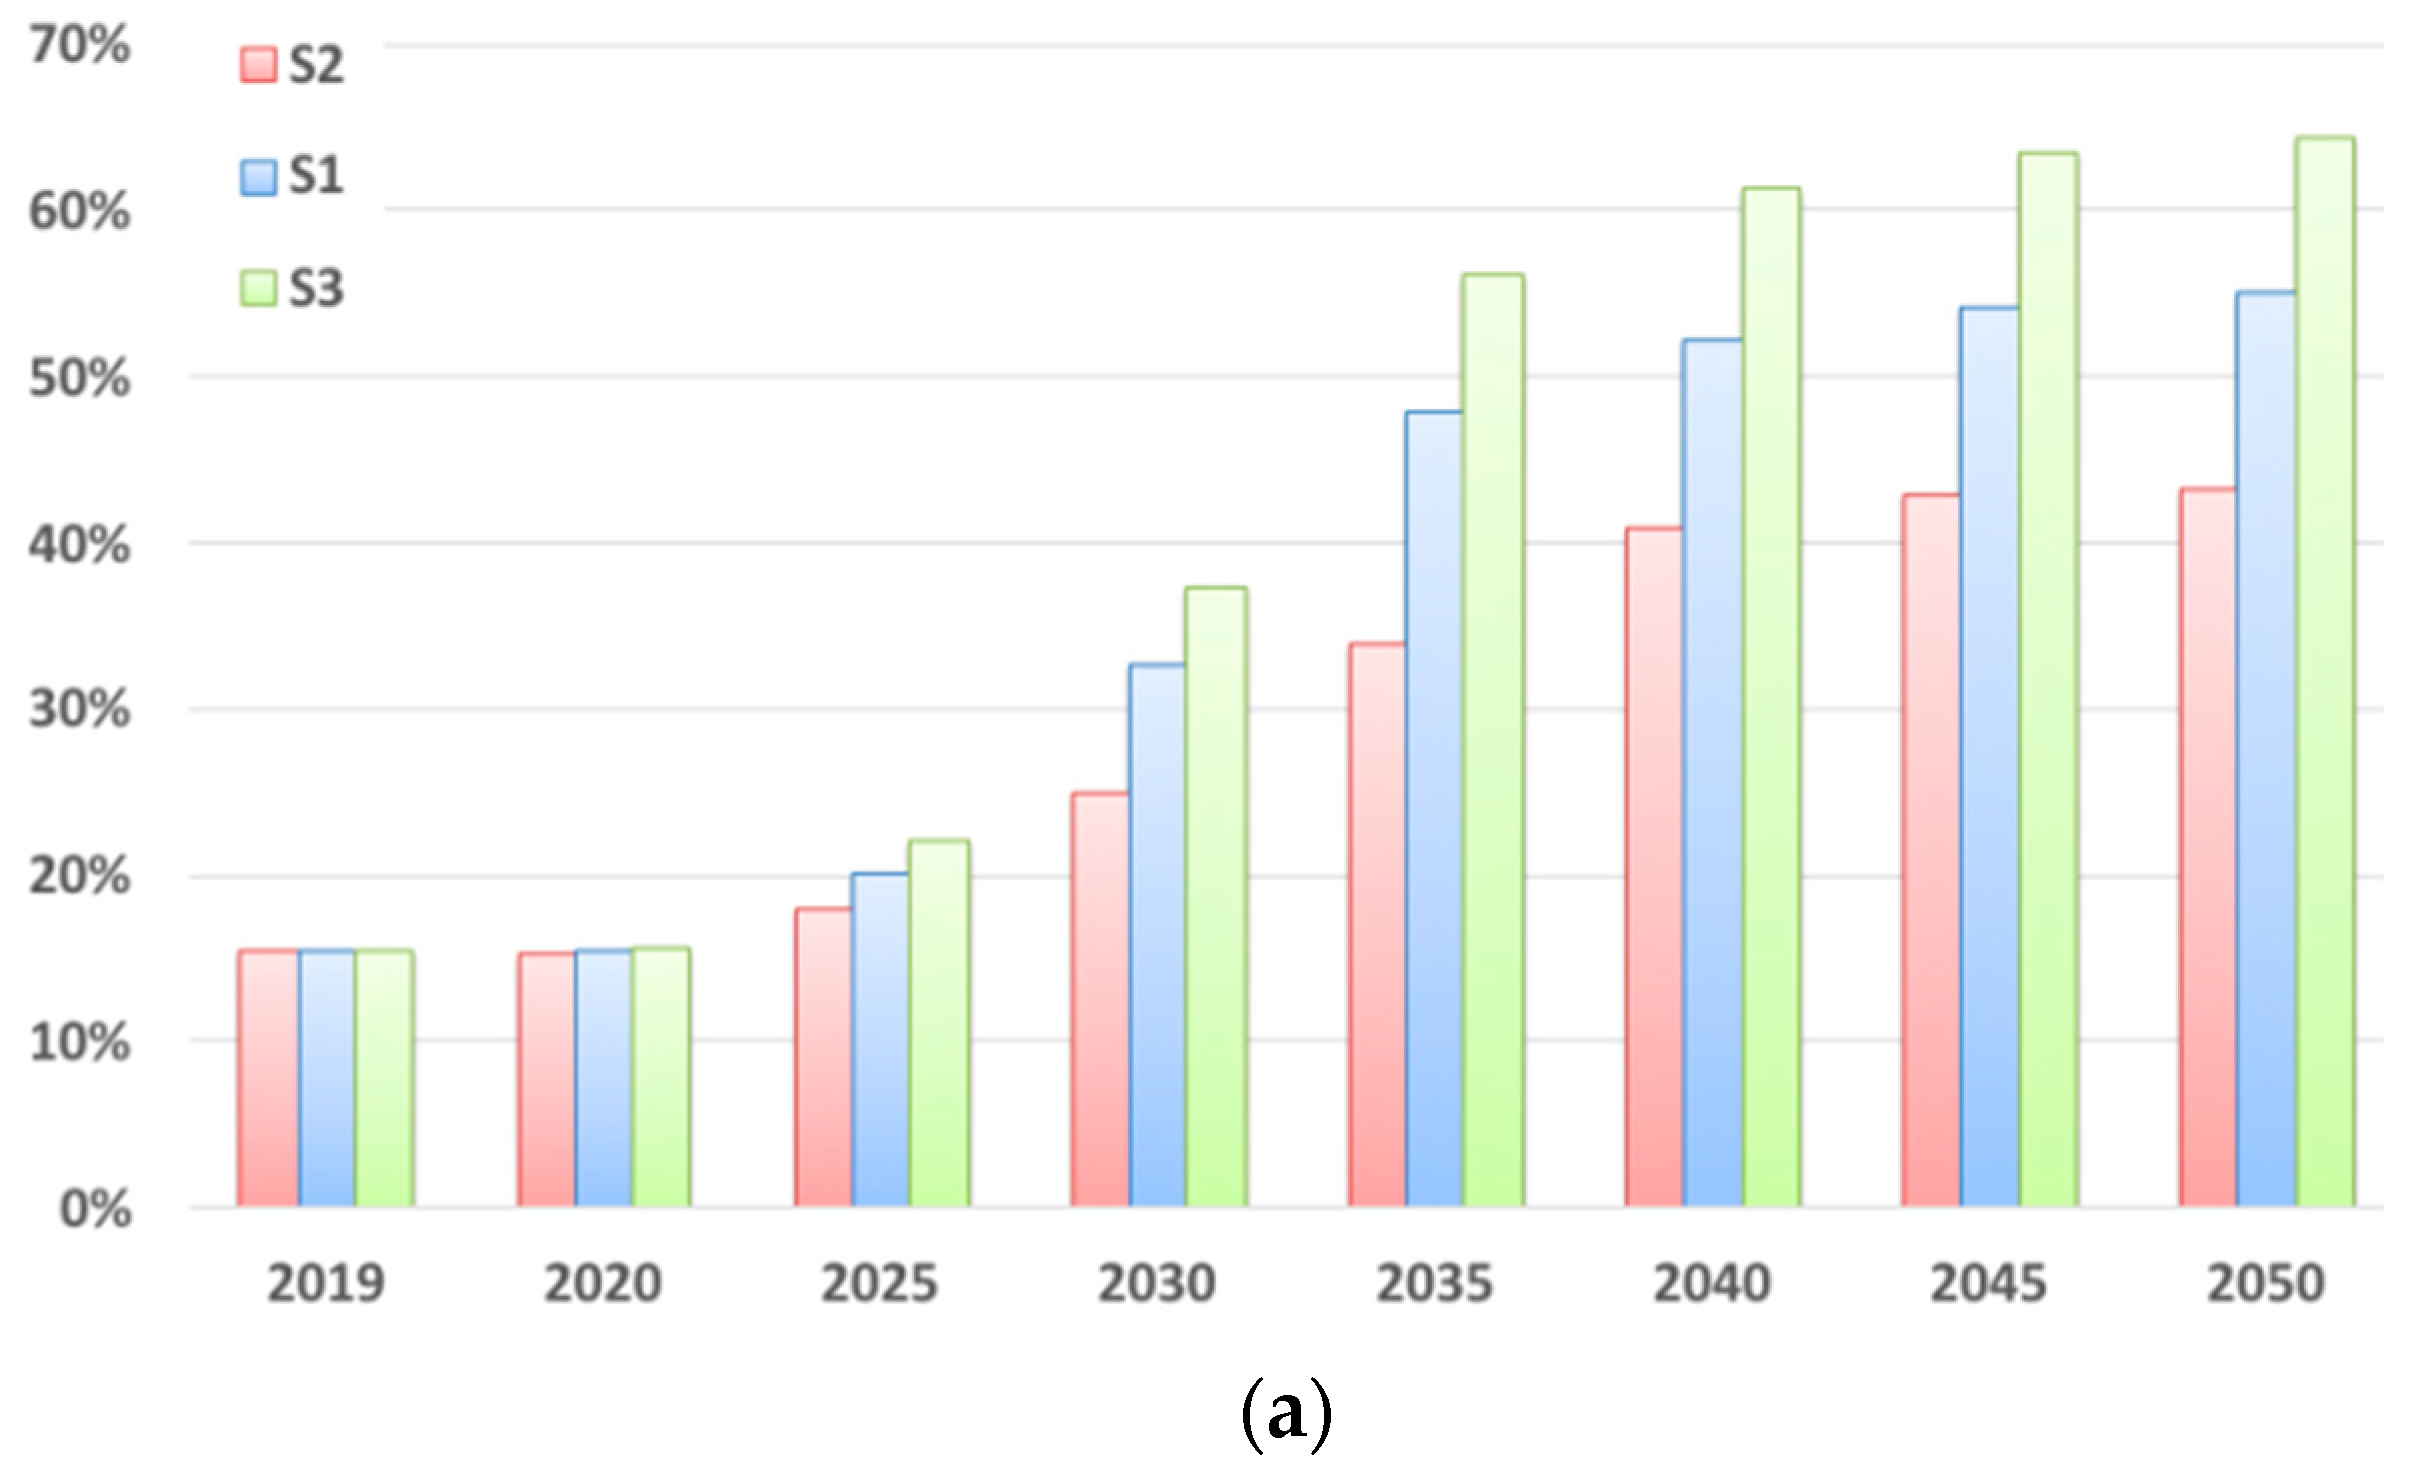
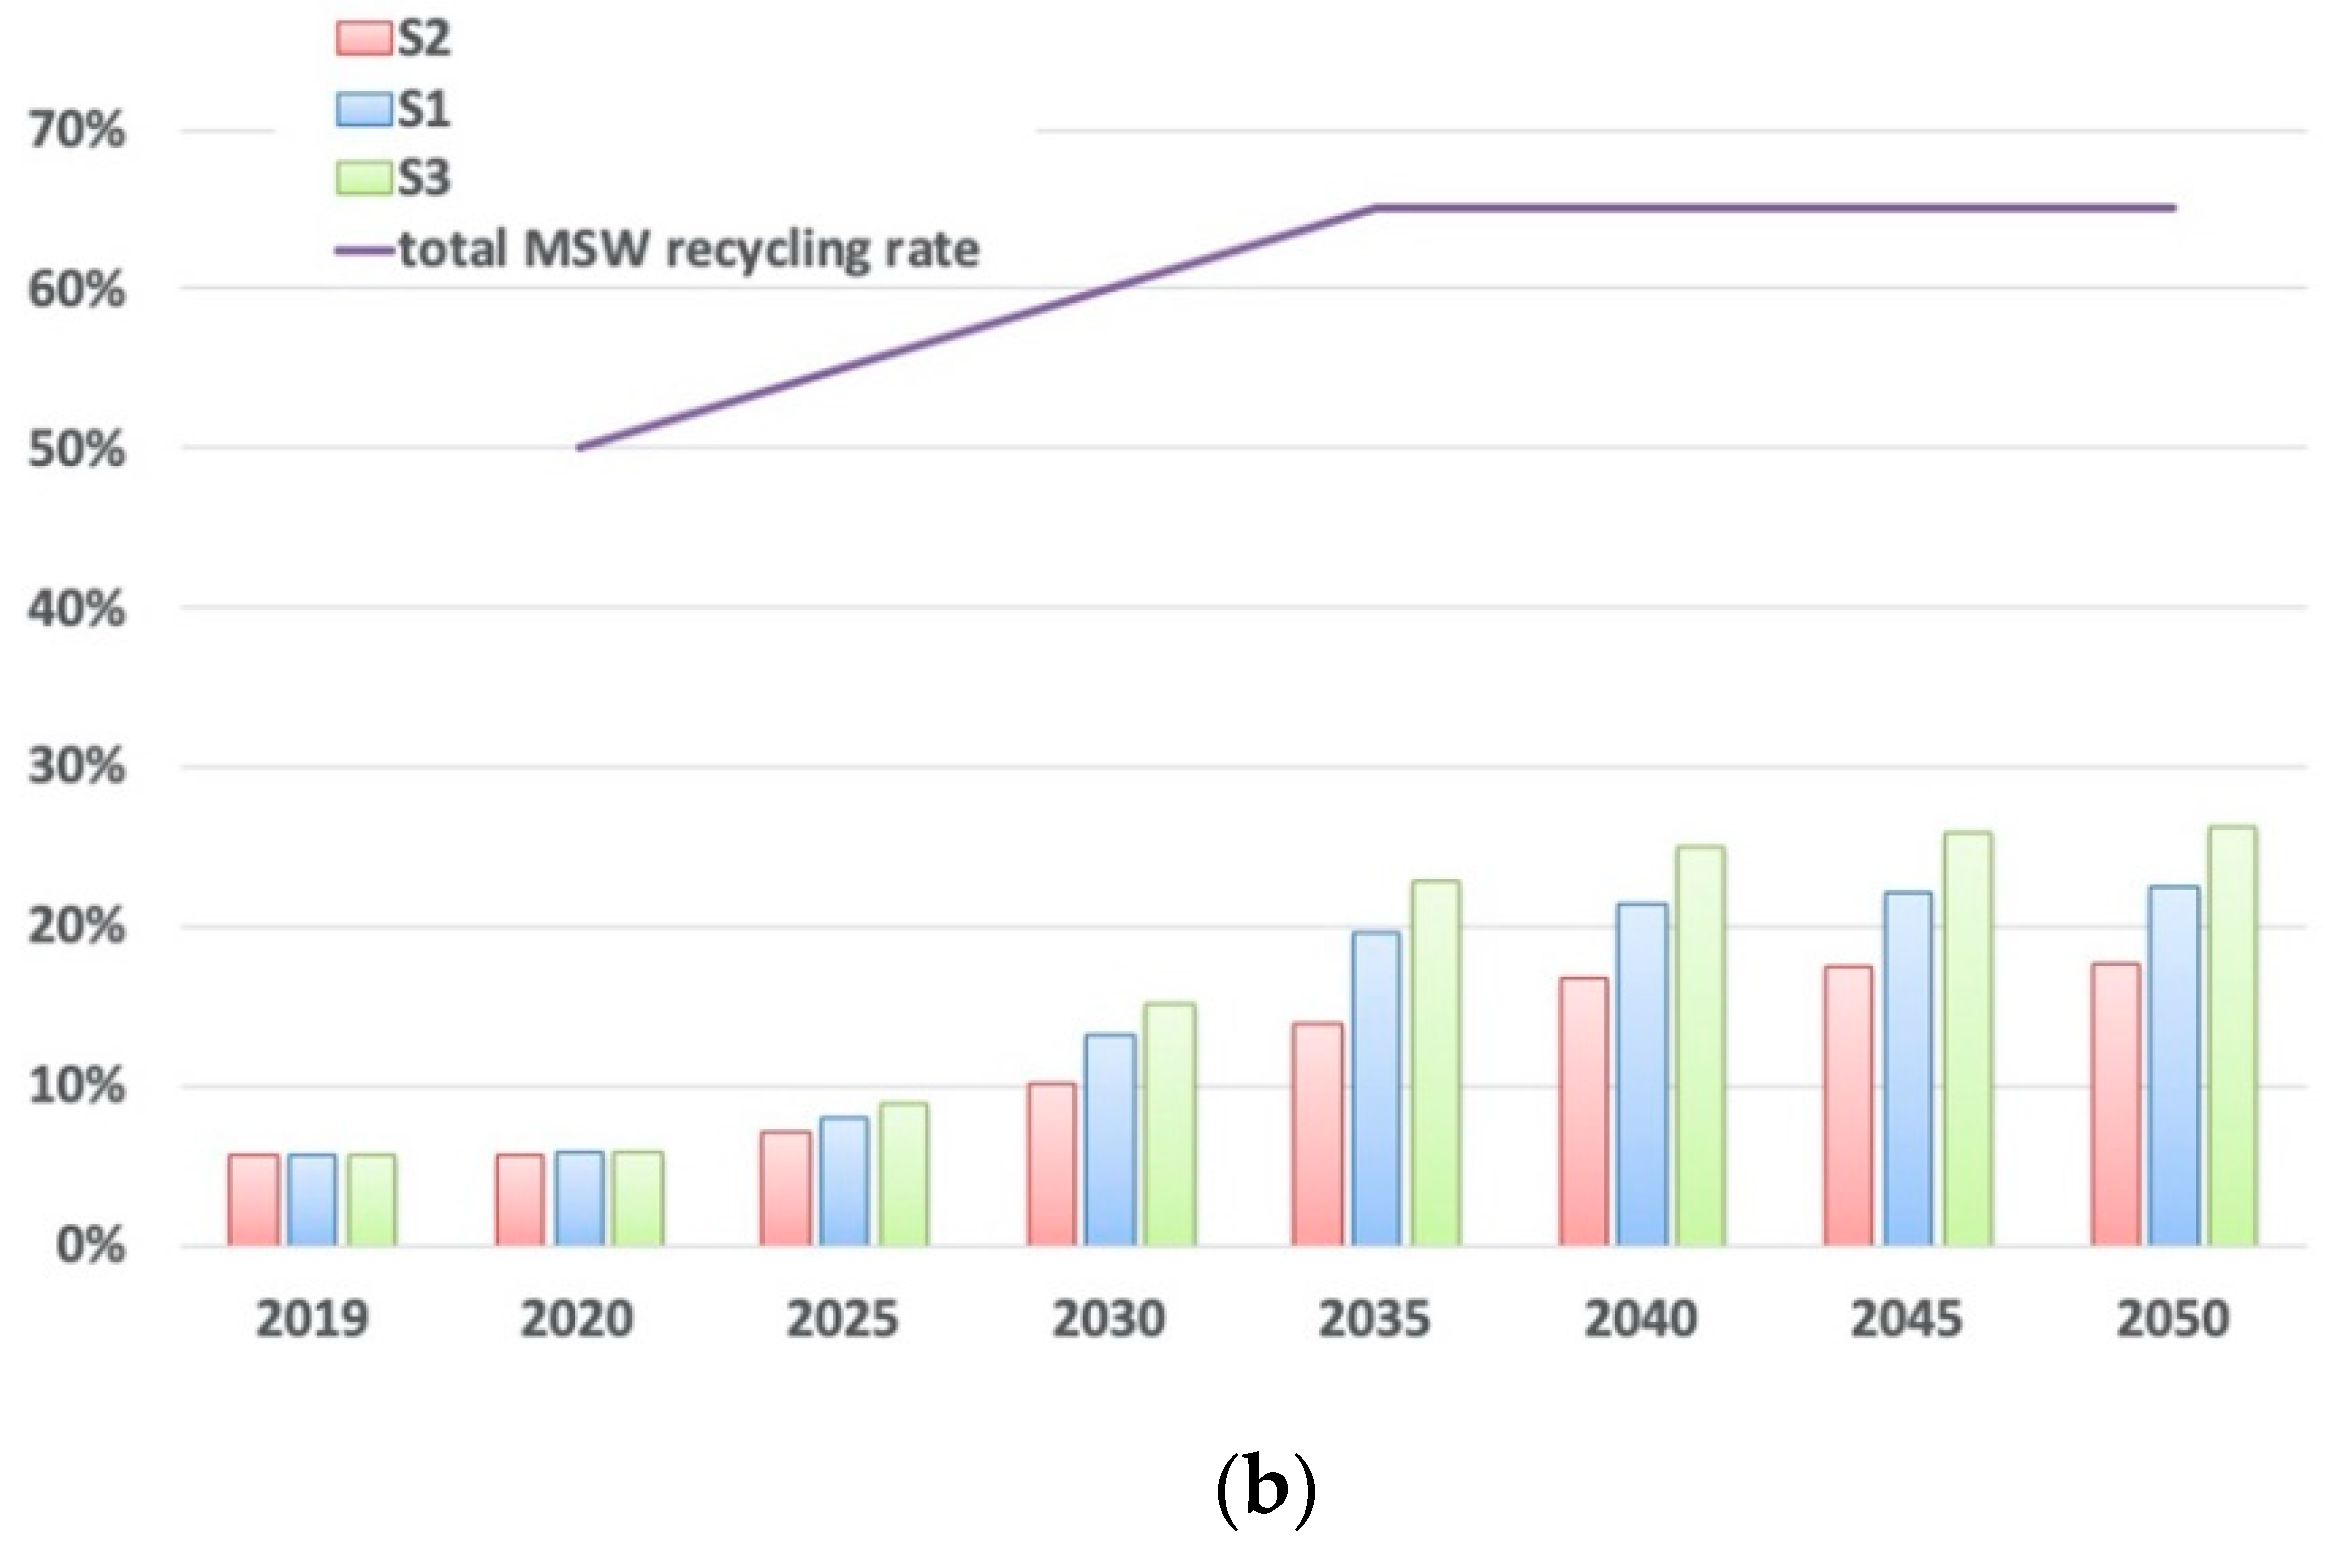
Figure 6 presents biowaste recycling rates in successive years and the share of biowaste in the overall MSW recycling rates. It can be seen that only scenario S3 will make it possible to achieve a recycling rate of more than 50% for the separately collected OFMSW in 2035, while in scenario S2 it will be slightly more than 30%. The rate achieved in scenario S3 will make it possible to achieve 22% from the biowaste fractions towards the required 65% recycling target for total MSW.
The analysis of scenarios S1–S3 indicates that the efforts taken in the first 10 years of the biowaste collection system’s development (in the case of Warsaw until 2030) are crucial for achieving the CE levels.

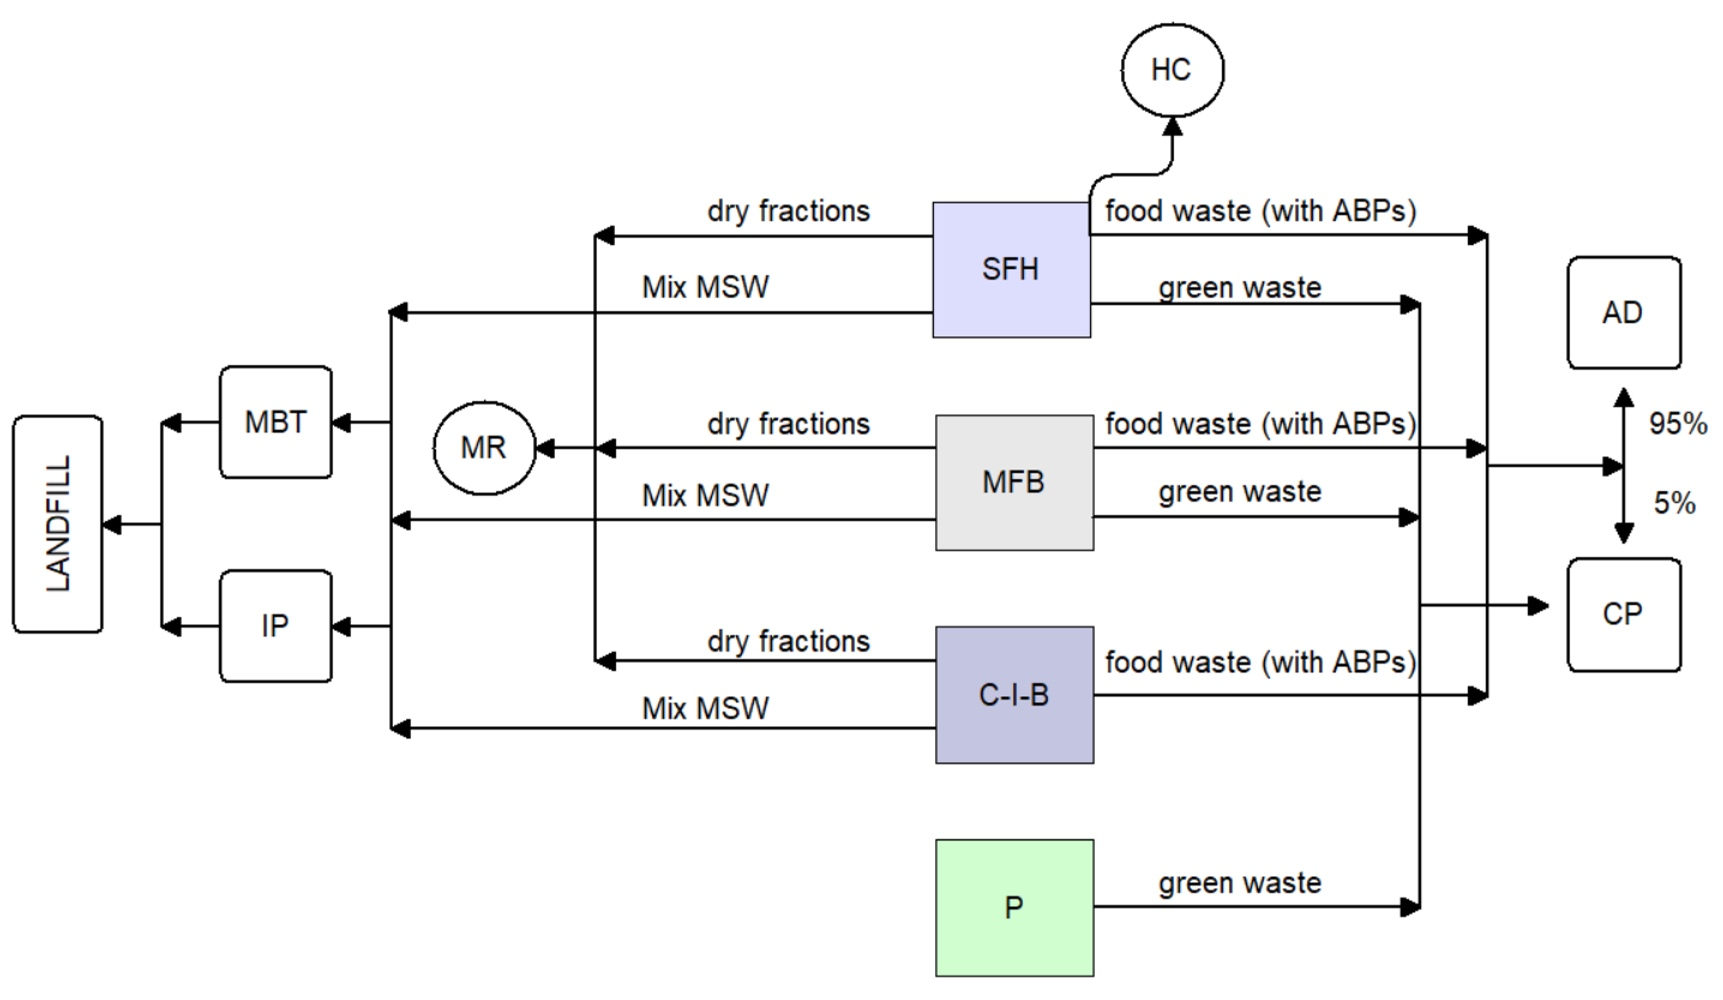
3.2. Technical Scenario I

TS-I assumes a technological scenario that is close to the current situation where all the separately collected OFMSW is composted. In this scenario, the incineration plant is the only source of energy from waste. In accordance with the assumptions adopted, in subsequent years the material and organic recycling levels will grow and, thus, the weight of waste going to the MBT plant and the landfill of waste will diminish. In 2035, under S1, 14% of MSW will go to the MBT plant, compared with 19% under S2, and only 10% under S3. Each scenario will meet the condition that not more than 10% of MSW may be landfilled: this will be 7%, 8.6% and 6%, respectively, for collection scenarios S1–S3 analysed.
The waste flow results and calculated recycling rates (shown in Table 4) indicate that even when assuming that the CE requirements for the recycling of packaging waste are met (70% from 2030) and taking into account the home composting with 30% effectiveness (1.7% total MSW recycling rate), the 60% recycling rate in 2030 and that of 65% in 2035 required for total MSW will not be achieved for any of the collection scenarios under technical scenario TS-I. The highest rate can be achieved for scenario TS-I-S3 52.5% in 2030 and 60.3% in 2035.
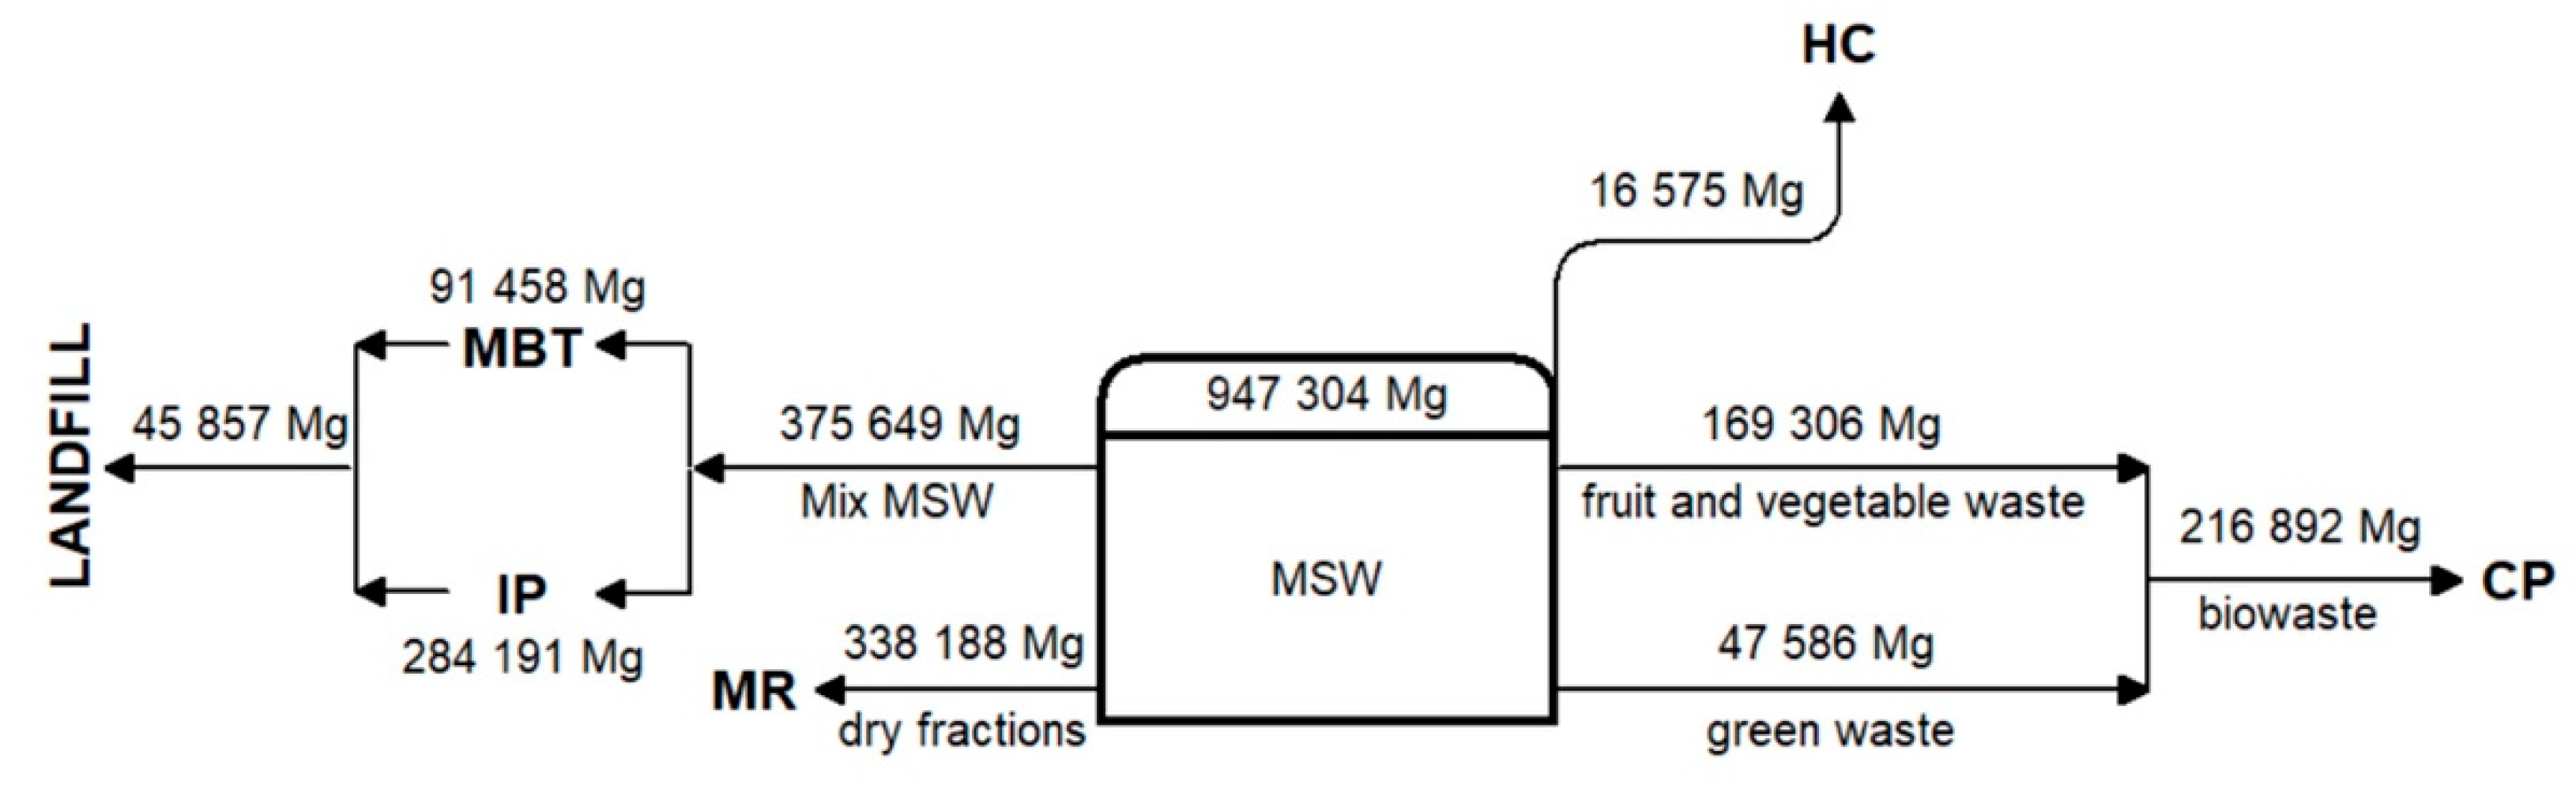
The detailed MFA analysis for 2035 for the best case TS-I-S3 is presented in Figure 7.

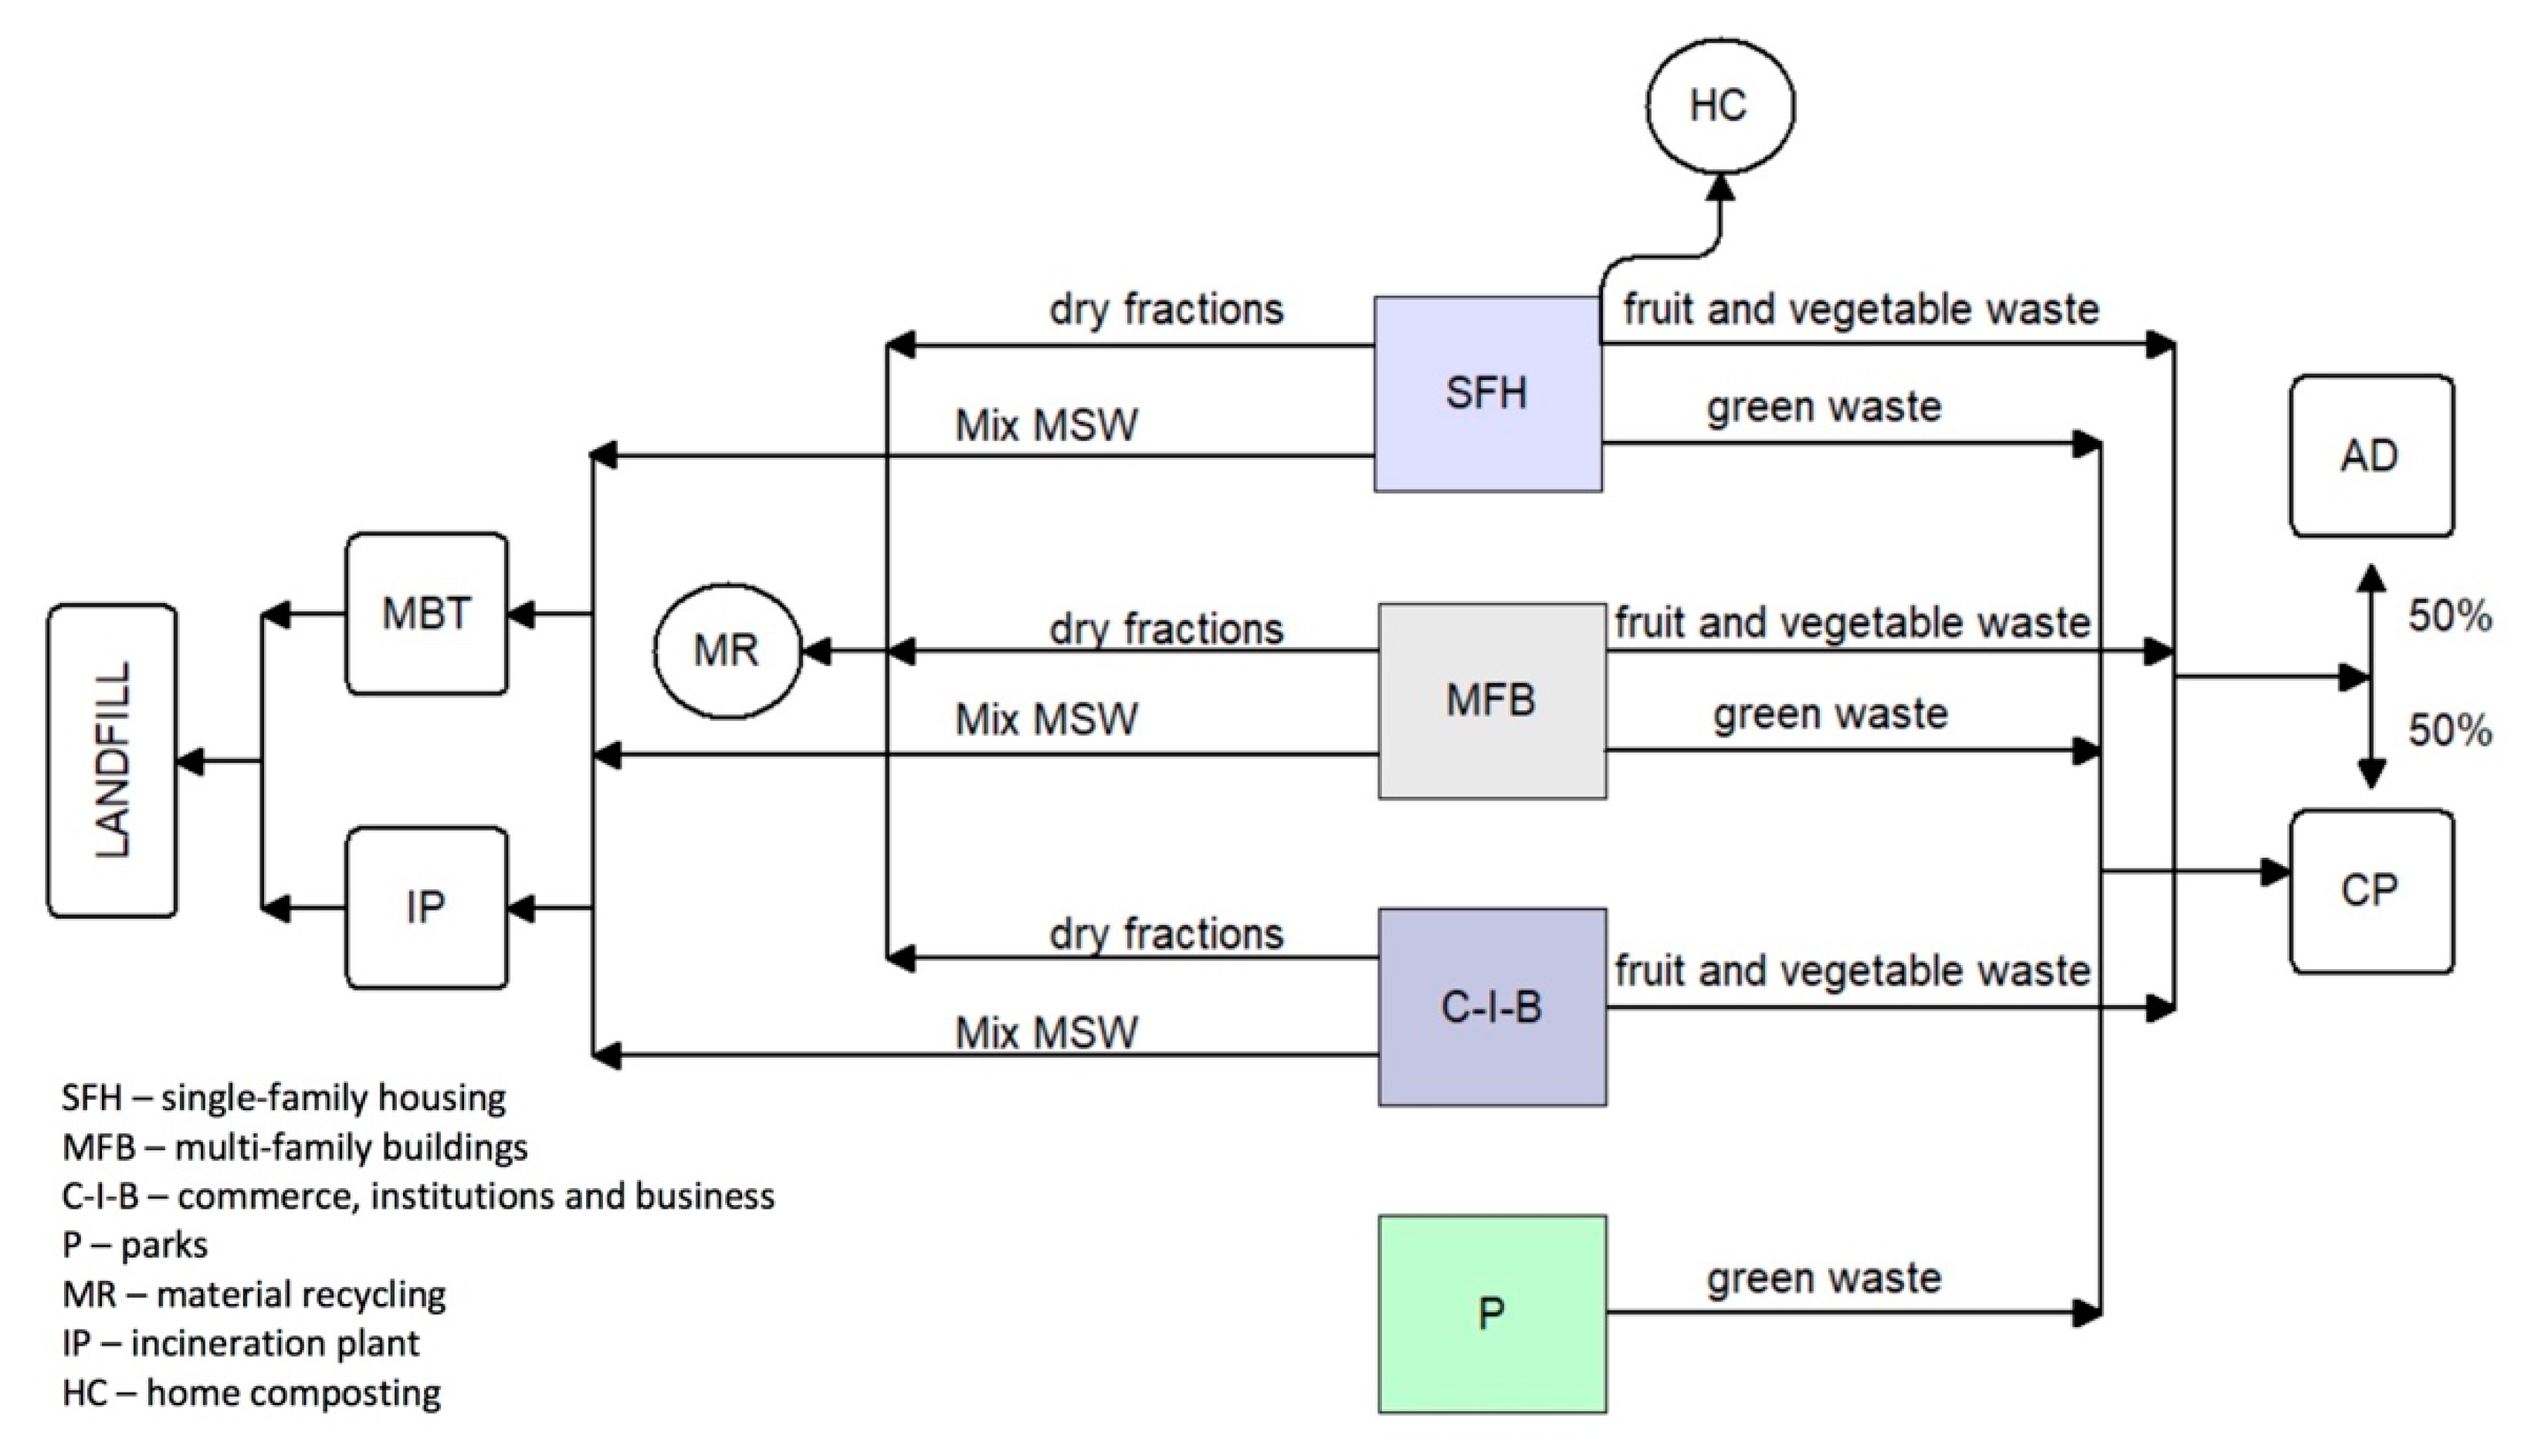
3.3. Technical Scenario II

In scenario TS-II, the mass of waste going to the MBT plants and the landfills under three scenarios of separate biowaste collection (S1–S3) will be the same as in scenario TS-I. The total MSW recycling rates will also be the same, failing to meet the requirements for 2030 and 2035.
Due to the introduction of AD technology, almost half the OFMSW will be intended for the AD and will become the source of energy for the city. Table 5 shows the mass of waste processed in successive years in CP and AD and the recycling rates to be achieved for total MSW.
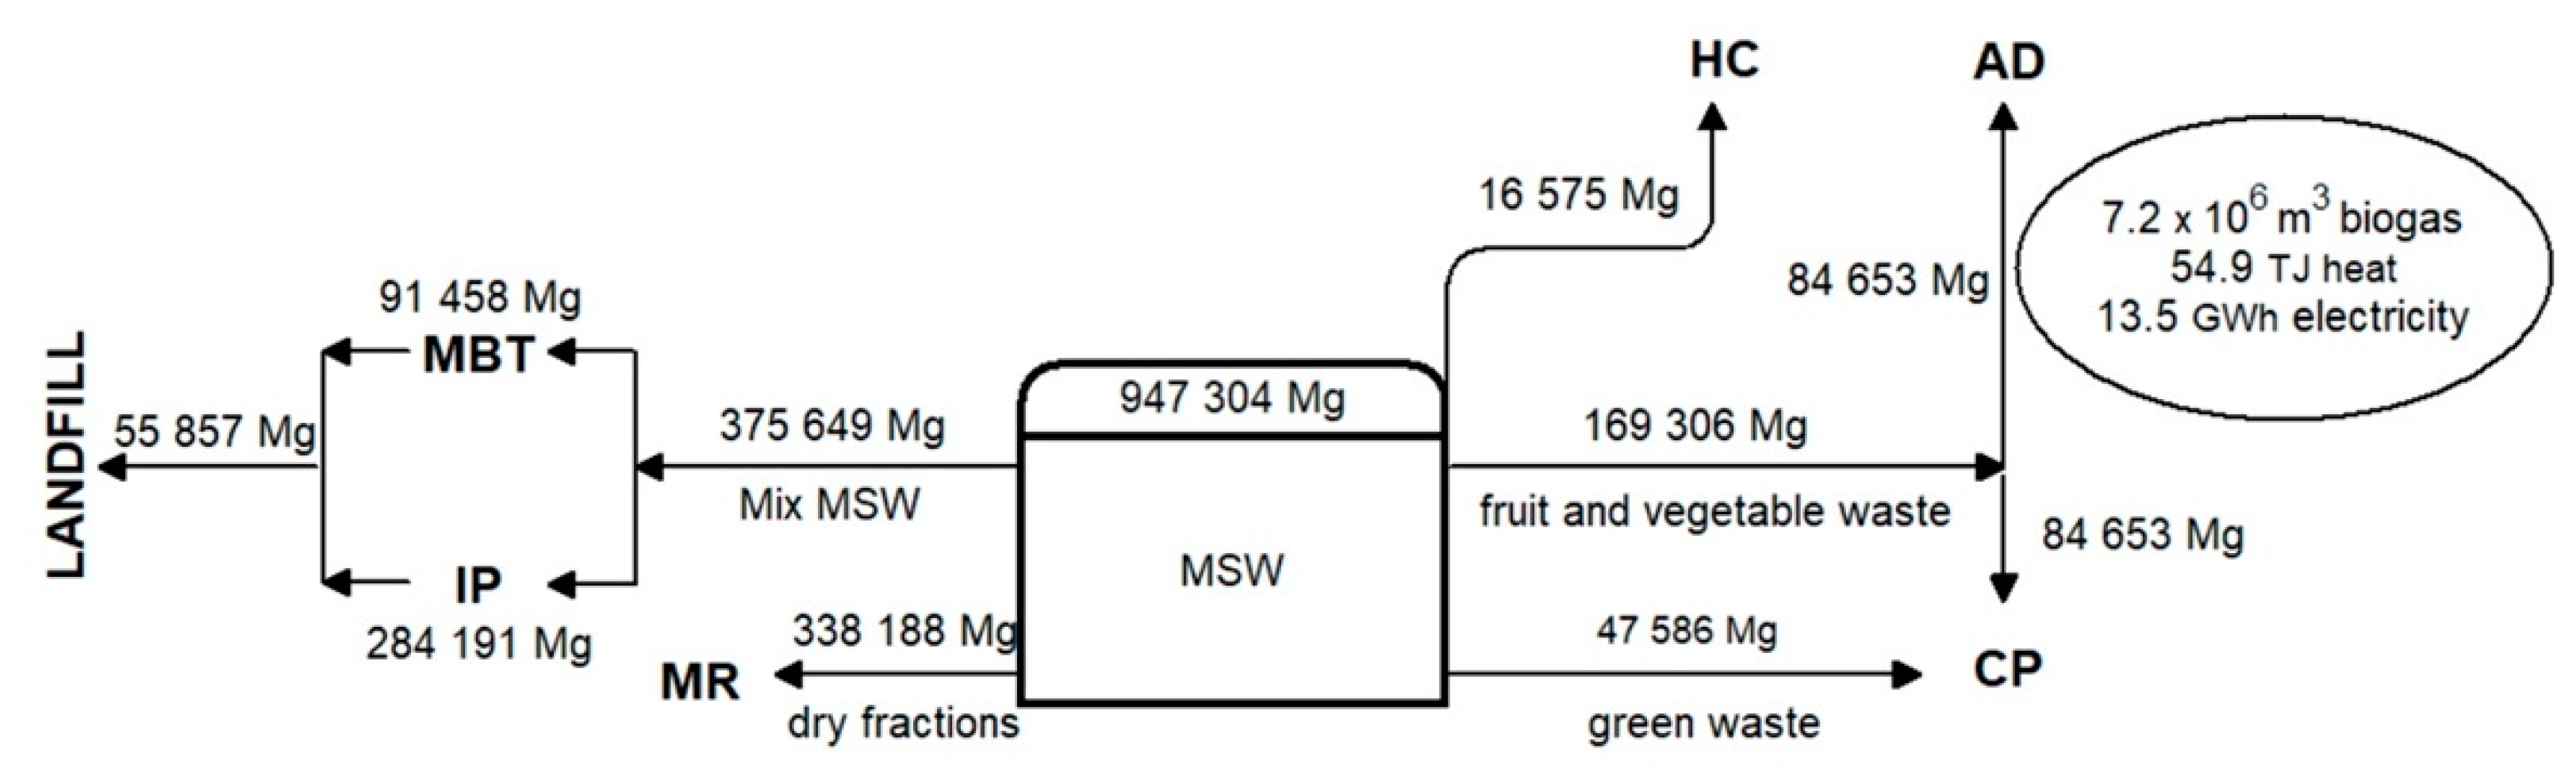
Under S3, the best-case scenario of separate collection, in 2035, is 14% of total MSW will be composted and nearly 9% will be directed to AD, ensuring that, when including home composting (1.7%), more than 24% of waste will undergo organic recycling. In 2050, this rate will already exceed 28%. The detailed MFA analysis for 2035 for the best case TS-II-S3 is presented in Figure 8.

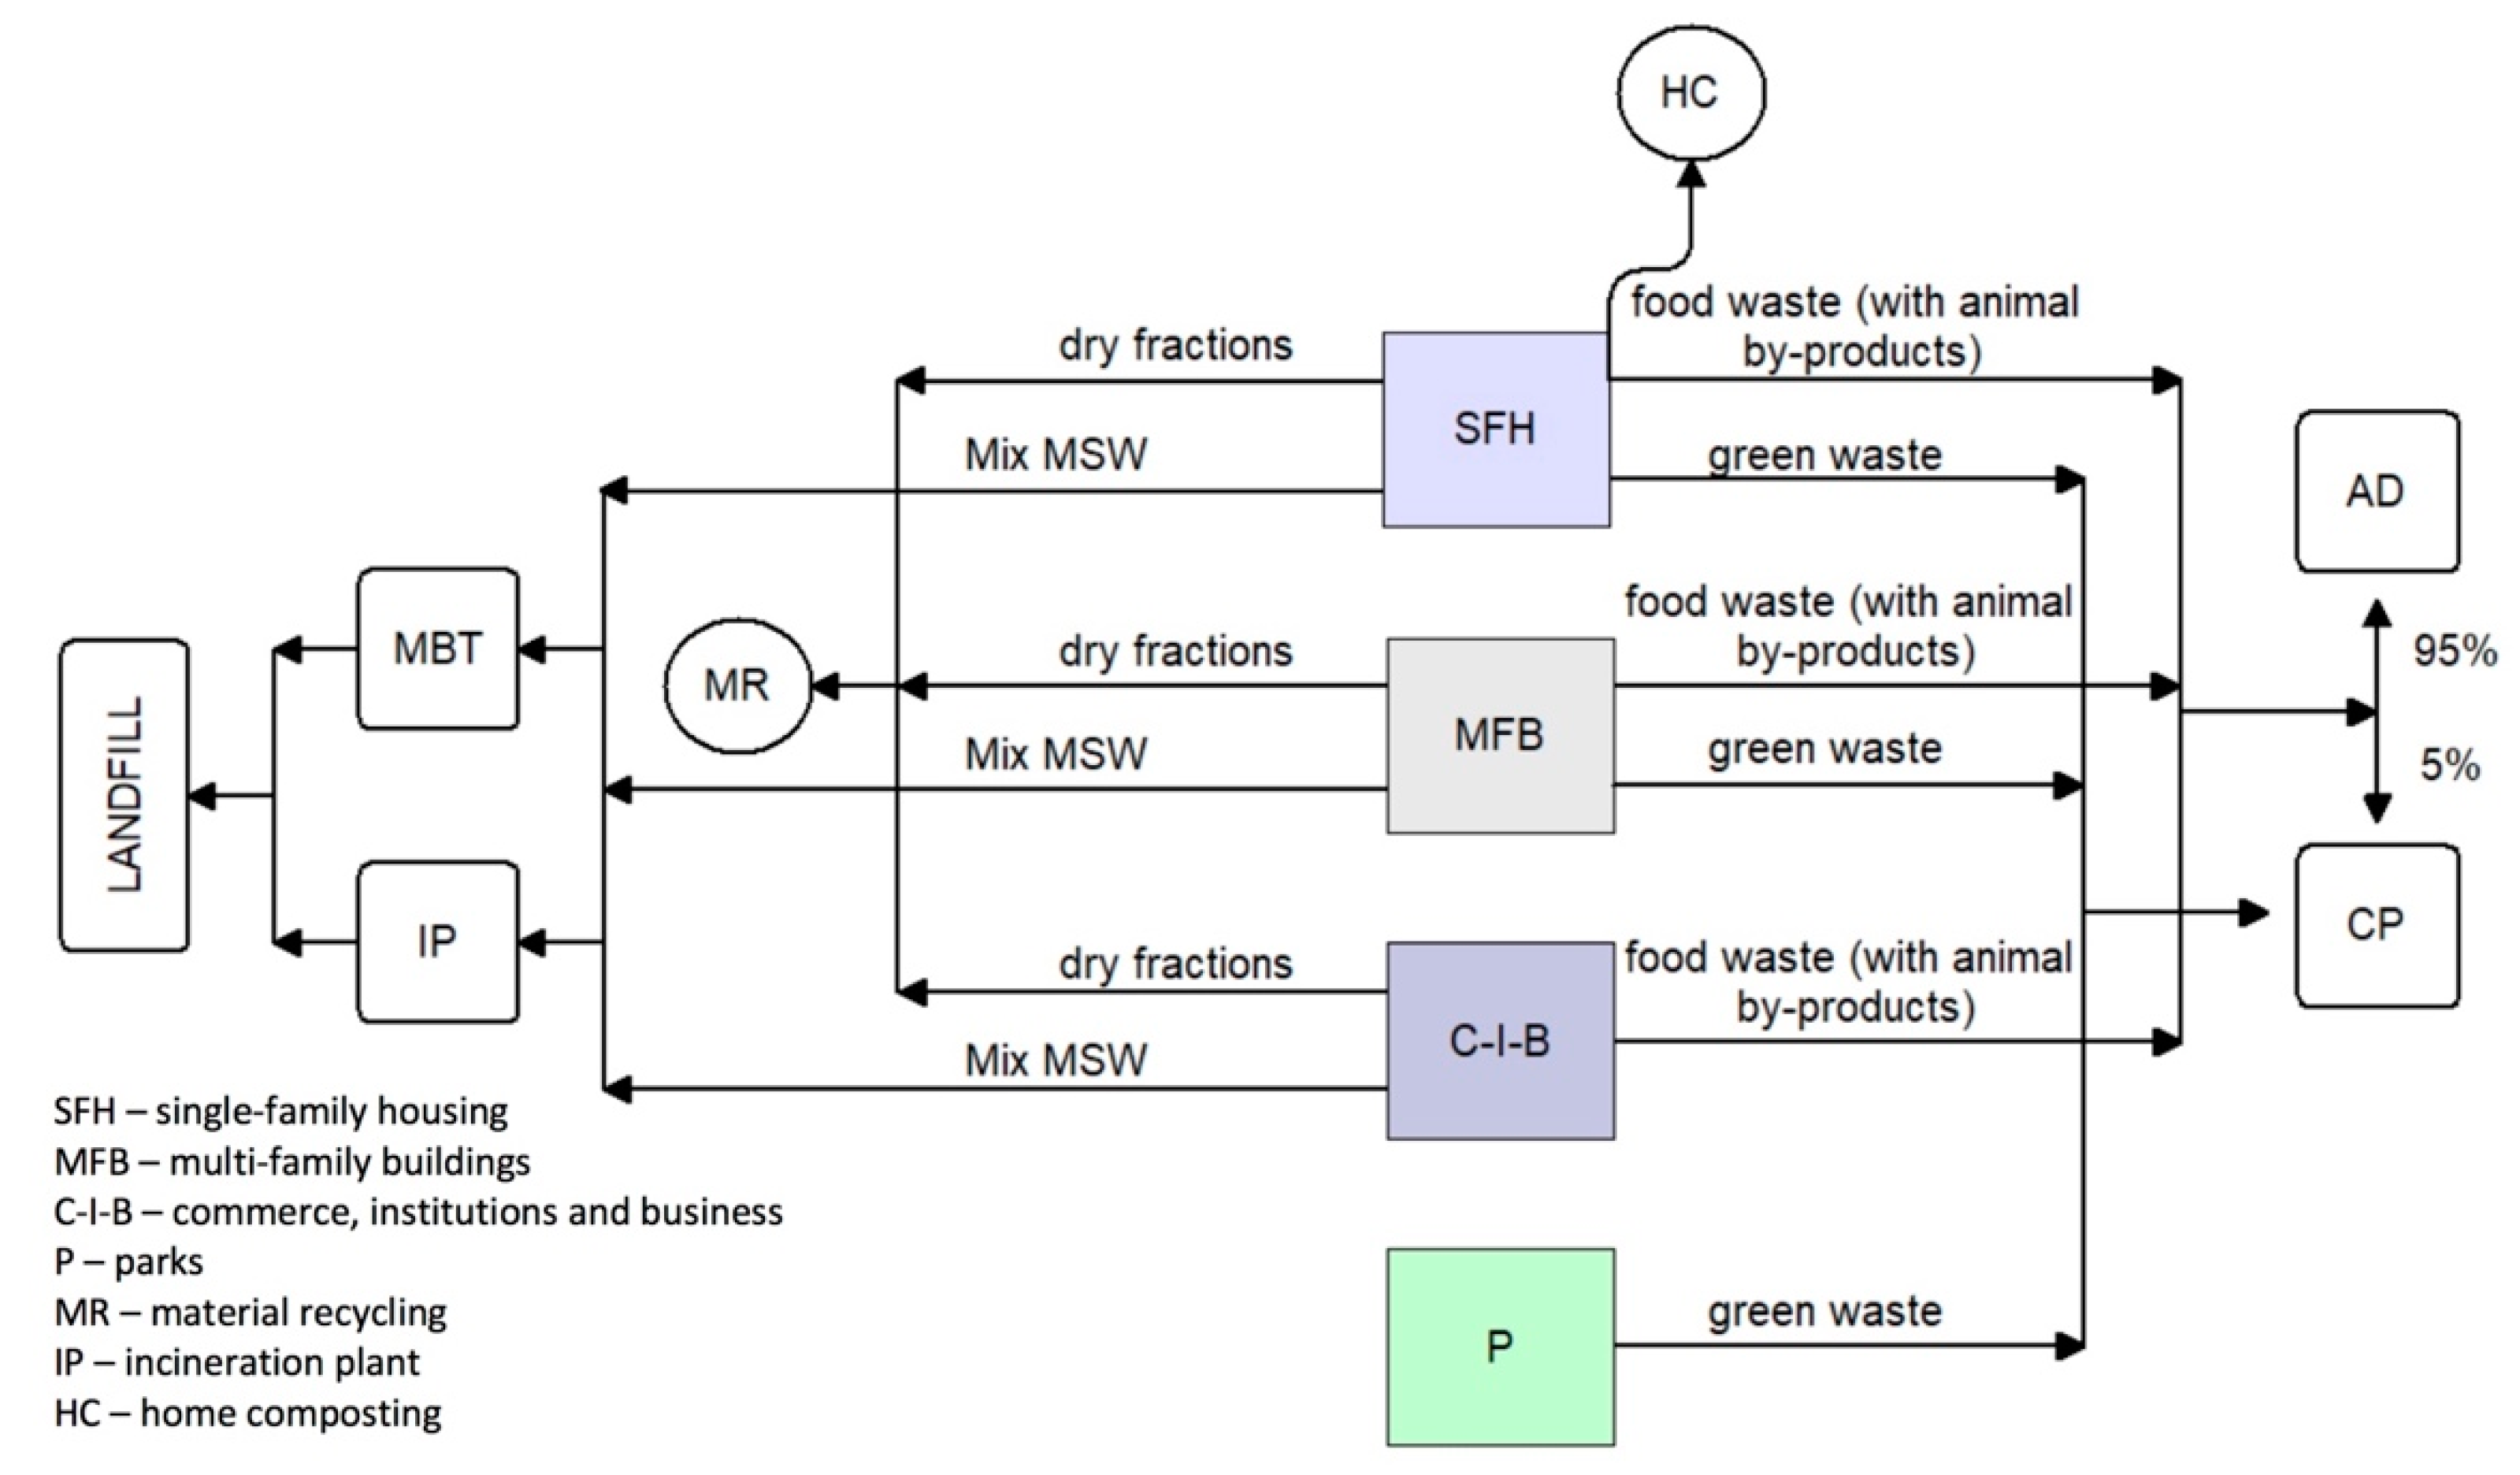
3.4. Technical Scenario III

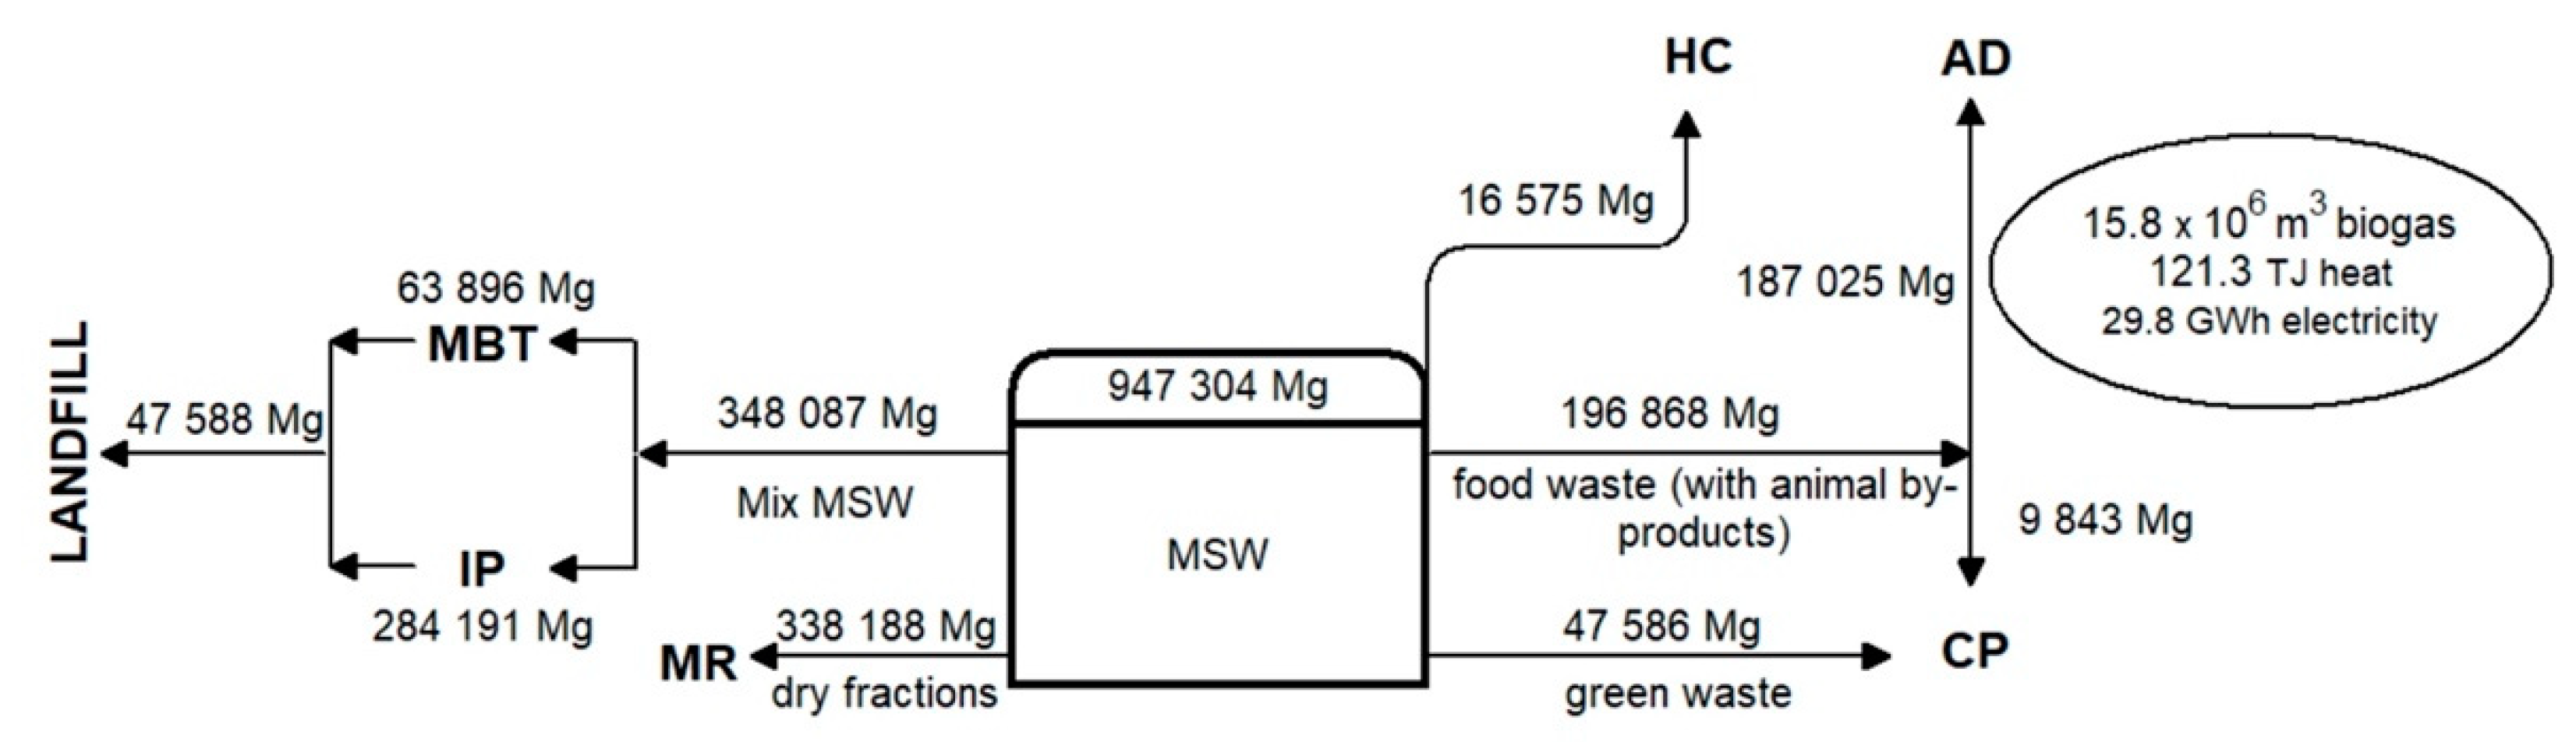
TS-III expands the biowaste stream with food waste including animal by-products. Under this scenario for S1 in 2035, 11% of MSW will go to the MBT plant, and so will 17% for S2 and only 7% for S3. Just as in the case of TS-I and TS-II, each scenario will meet the condition that not more than 10% of MSW is directed to landfill, this will be 2%, 8.2% and 5%, for scenarios S1–S3 respectively.
Table 6 presents the flow of waste, which will be intended for AD and CP and the recycling rates achieved for total MSW.
The waste flow results and calculated recycling rates shown indicate that even when assuming that the CE requirements for the recycling of packaging waste are met, taking into account the home composting with 30% effectiveness (that results in 1.7% in the total MSW recycling rate), the 60% recycling rate in 2030 and that of 65% in 2035 required for total MSW will not be achieved under TS-III for any of the scenarios of separate biowaste collection. The highest rate can be achieved under scenario TS-III-S3; it will be 54.2% in 2030 and 63.3% in 2035. The rate of 65% will be achieved in 2040. The detailed MFA analysis for 2035 for the best case TS-III-S3 is presented in Figure 9.

3.5. Biogas Generation

Due to the specific nature of scenario TS-I, which closely represents the actual state of the MSW management system in Warsaw, biogas is not produced from separately collected biowaste and the energy from MSW only comes from the energy recovery process (waste incineration).
The benefit in the case of the other technical scenarios analysed (TS-II and TS-III) is the possibility of enhancing energy production by additionally using biogas generated from biowaste. In accordance with [44], in view of the significant potential for growth of biogas production from OFMSW, Member States should assess their biowaste streams, identify their sources, determine the potentials for biogas production, and ensure separate collection.
The analyses performed clearly demonstrates the impact of the development of separate biowaste collection on the potential for using green energy. As separate biowaste collection develops, the justification will emerge for its treatment in AD; in addition to organic recycling, this will make it possible to produce renewable energy, which would correspond with the CE goals (decoupling from the use of resources and strengthening the resilience of the system). It is also of substantial importance in the context of the reduction in methane emissions from the decomposition of unmanaged biomass and the reduction in emissions of Greenhouse Gases. Many literature sources have pointed out that the conversion of food waste to energy in AD processes is economically viable [69,70,71,72], unlike for other biodegradable fractions, e.g., paper waste with high resistance of the organic matter to enzymatic hydrolysis (due to the high level of cellulose) [73]. For food waste among the benefits of using the above-mentioned scenarios, especially TS-III-S3, one should also indicate the possibility of using fermentation residues, which may reduce the costs of biogas production. This is especially true in developing countries [43]. However, consideration should be given to the difficulties related to the collection of such waste [74].
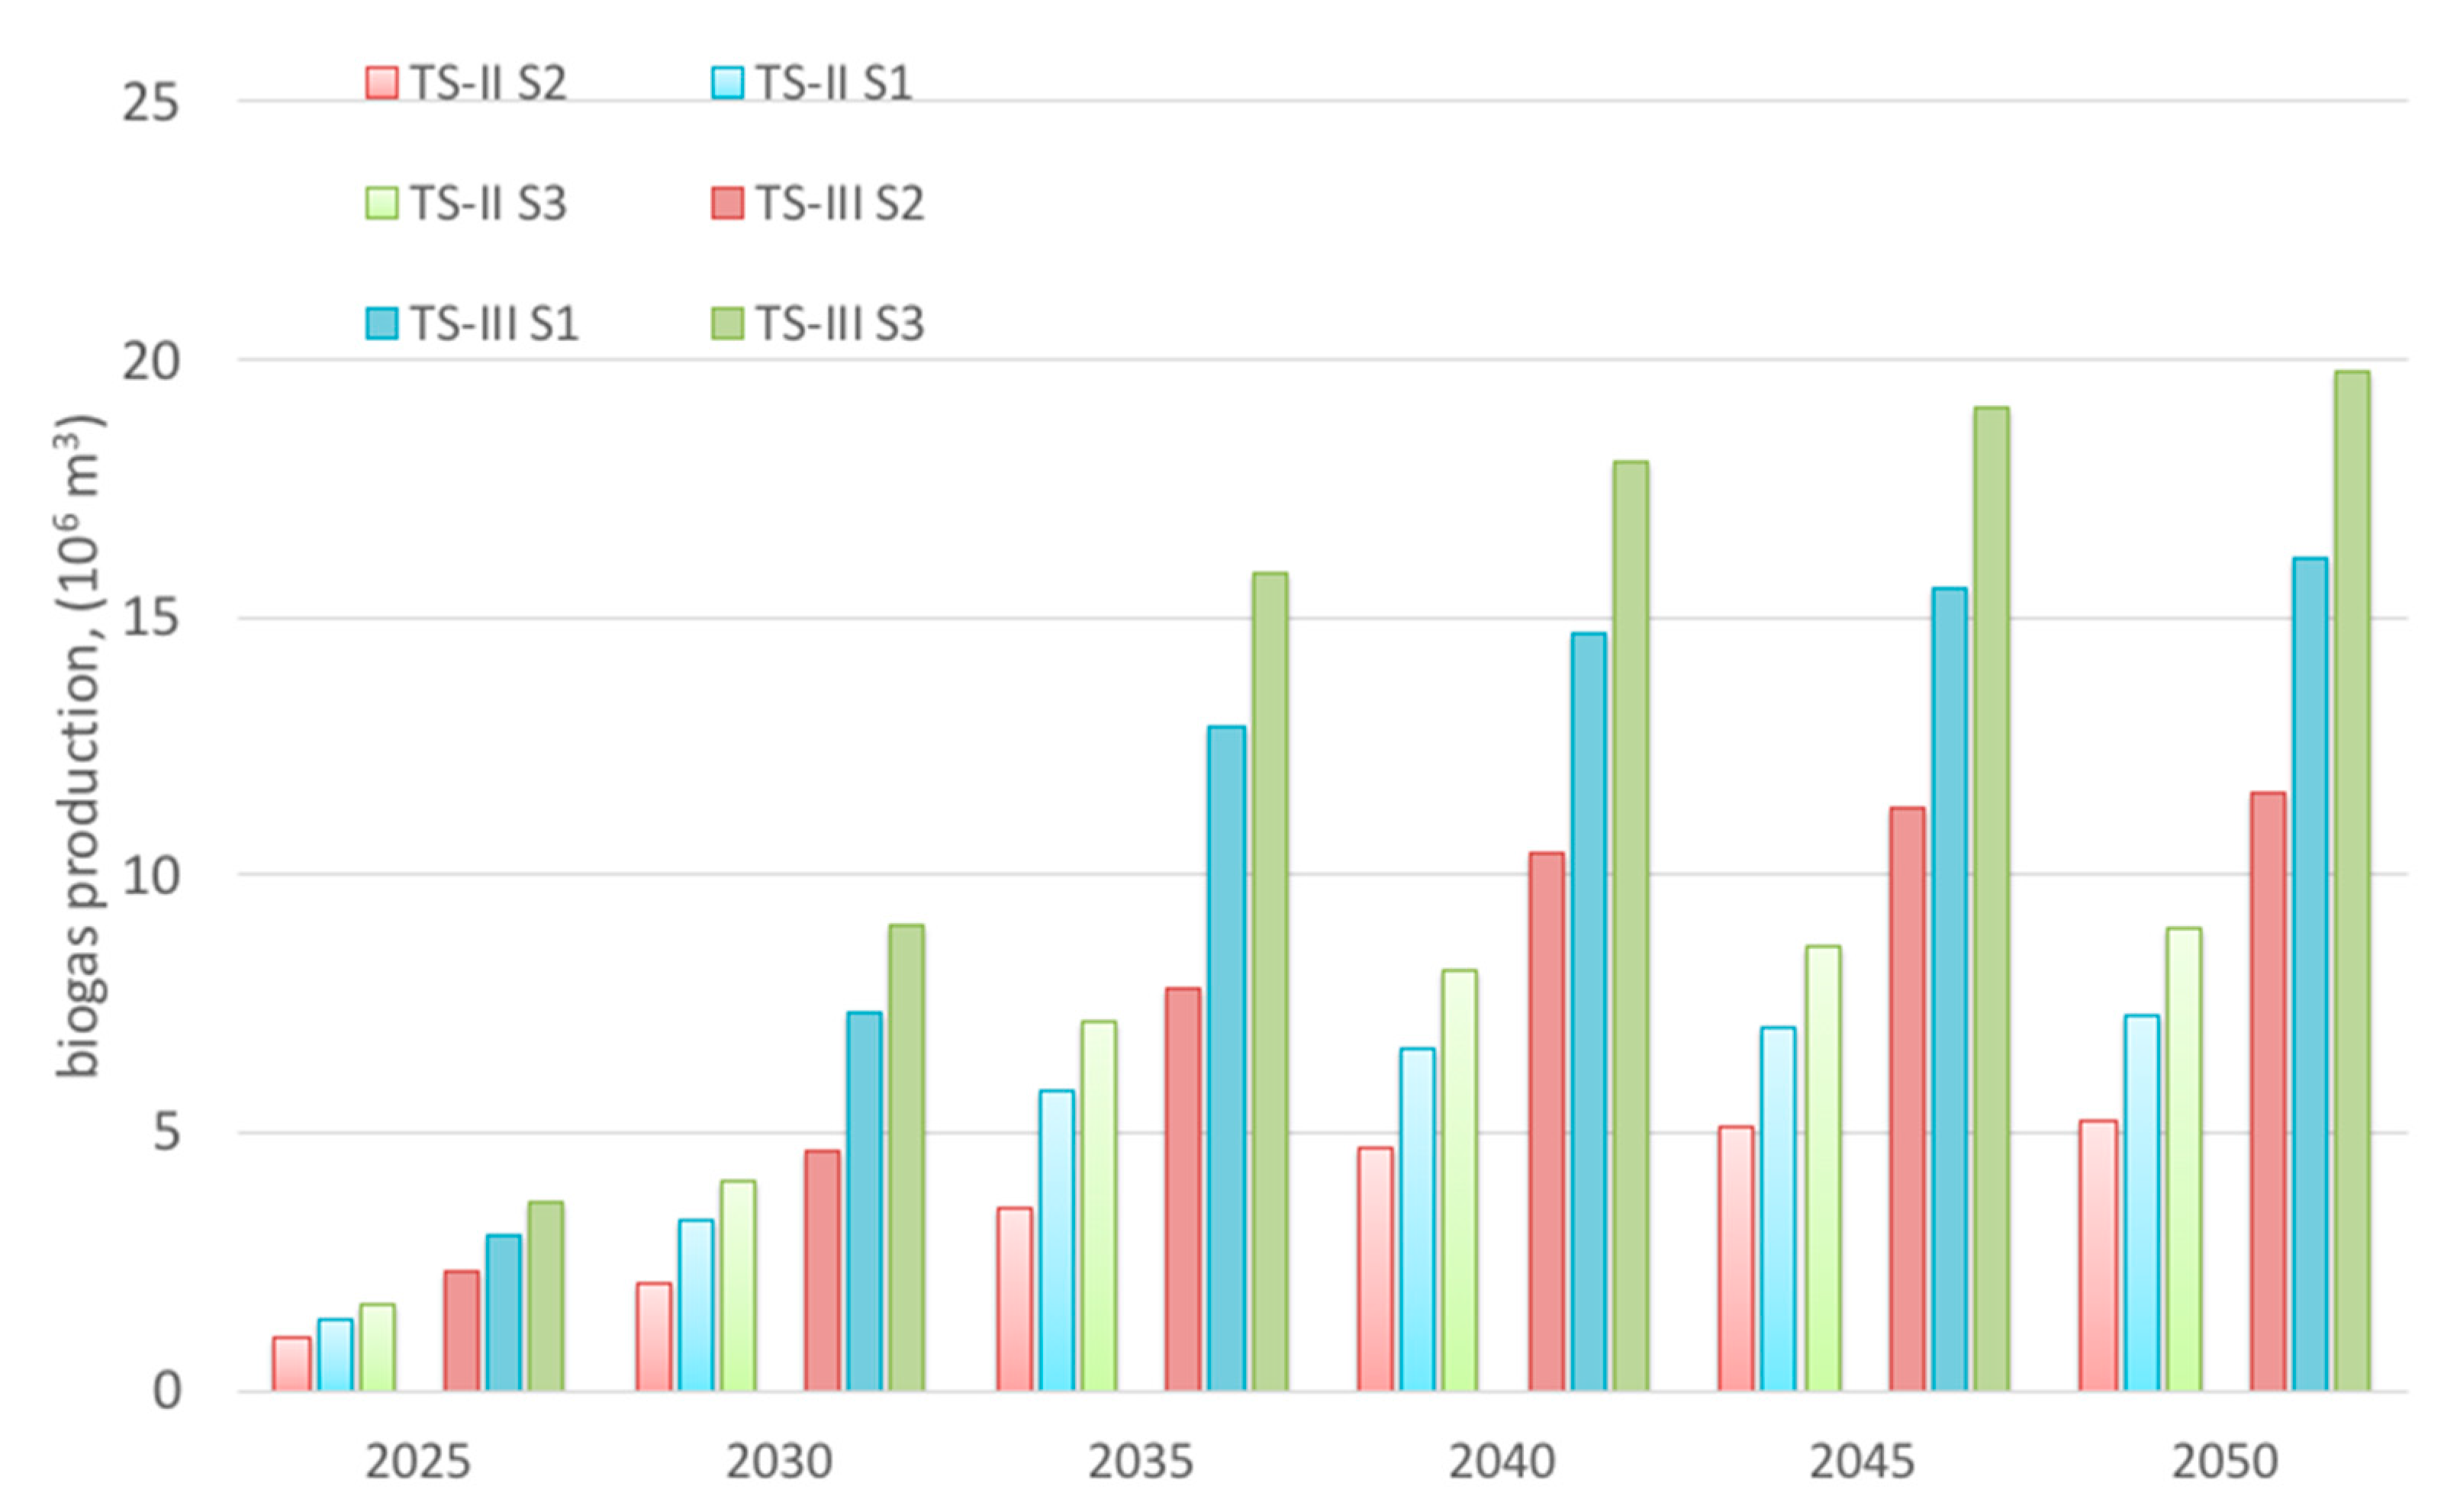
Clear differences can be seen between the adopted technical scenarios and the capture rates in biowaste collection scenarios. An analysis of the data for 2035 indicates that when TS-III is used, the quantity of biogas generated grows more than twice (with the same capture rates of biowaste). In turn, when the effectiveness of separate collection of bio-fractions increases from 15% to 20% and then to 25%, the quantity of biogas generated grows by, respectively, 65% and more than 100% (irrespective of which technological system is adopted from among the two enabling biogas production); Figure 10.
Over the next 10 years (within the timeframe until 2030), the quantity of biogas generated from biowaste separately collected in Warsaw can grow to almost 9 million m3/year, enabling the production of green electricity and heat in cogeneration at annual levels of almost 17 GWh/year and 69 TJ. In the long term (until 2050), the quantities can be more than twice as large. When only electricity is generated (according to the German data, the power yield is about 300 kWh per 1 Mg of raw biowaste from households [75]), in 2030 in Warsaw this quantity can reach about 32 GWh and 70 GWh in 2050. Energy generation predictions for TS-II and TS-II are presented respectively in Table 7.
Electricity consumption in a single household in Poland in 2018 amounted to 2.4 MWh [52], therefore, the energy from biogas in 2035 in the case of the TS-II-S3 scenario could meet the needs of 5625 and in the case of TS-III-S3 more than 12,400 households. Similarly, in 2050 it would be 7000 for TS-II-S3 and 15,000 for TS-III-S3, respectively. In the case of heat production, based on Central Statistical Office data, according to which in 2018 one household consumed 31.2 GJ of heat, in 2035 in the case of TS-II-S3 scenario, heat can be supplied to 1760 households and in the case of TS-III-S3 to over 3800 households. Similarly, in 2050 it would be almost 2200 for TS-II-S3 and 4900 for TS-III-S3.
It should be pointed out that the quantity of biogas predicted in the study to be generated from biowaste separately collected in Warsaw can be larger in light of three basic issues. The level of biogas generation from biowaste adopted in this study is lower than the one indicated by certain literature sources [38,66,76], but recommended for the Polish conditions [77]. In addition, a specific feature of the Capital City of Warsaw is the increasing number of unregistered inhabitants and those commuting every day from the metropolitan area and other cities (even up to 700,000) [78], which has not been taken into account in studies but causes a higher waste generation level, including biowaste. Moreover, account should be taken of the fact that the biowaste collected in Warsaw contains more than 17% of impurities and that their share should diminish as the system develops.
It is important to note the relatively large share of food waste of animal origin in the biowaste generated in Warsaw. At present, these fractions become part of the mixed MSW stream. However, their separate collection for the purpose of AD treatment (as envisaged by scenario ST-III) will become important only when the level of separate biowaste collection grows.
In the case of the intensive development of AD (TS-III), the share of food waste (including animal by-products) in biowaste becomes more important, as it increases the potential of collected waste; moreover, there is a much greater potential of bioenergy to be obtained. However, the selective collection of these fractions in terms of their processing into AD becomes important only with the increasing capture rate of biowaste. The choice of the TS-III scenario causes more than a twofold increase in the amount of biogas produced, and consequently electricity and heat, in relation to the amounts obtained in TS-II. For each technological variant, the best results are obtained in the case of the S3 collection scenario. On the other hand, the increase in the capture rate of biowaste from 15% to 20% and 25% respectively (scenarios S2, S1 and S3) allows for an increase in the amount of biogas produced by 65% and over 100%, respectively. It should be expected that the forecasted amount of biogas produced in Warsaw may be higher due to the increase in the number of inhabitants living in the city. However, considering the practical aspect of system development, it is necessary to consider the difficulties related to food waste (with animal by products) and the fact that there are already existing CP; the most sound to implement seems to be the TS-II scenario. It is also worth considering an intermediate scenario between TS-II and TS-III, increasing the share of AD, but based on food waste (with animal by-products) exclusively from gastronomy, household food waste would be collected without animal by-products.
This paper, due to its scope, did not take into account the profitability analysis of the considered scenarios. However, the comprehensive assessment of separate collection of biowaste and its further treatment requires its inclusion in subsequent works.

4. Conclusions

The analysis conducted shows the challenges that countries that are just introducing biowaste collection face in the next 10 years in order to meet the requirements of CE for 2030 and 2035. The case study of Warsaw shows that even assuming 70% of the recycling level of packaging waste is achieved in 2030, efficiency of home composting at the level of 30% and the intensive development of biowaste collection (an annual increase of 25% in the capture rate for the first 5 years, and then 20% for the next 5 years), the total MSW recycling rate required in 2030 (60%) and 2035 (65%) has not been achieved. Given the above, it can be seen that meeting the CE demands requires intensive activities in developing separate collection and recycling of MSW in relation to all fractions. It also seems that it is necessary to complete the MSW collection system with the textile fractions [79], planned from 2025, which has a chance to supplement the missing recycling levels. The literature review and the experiences of other cities with regard to separate collection also indicate that densely populated areas with large incoming populations have difficulty achieving high separate collection rates. It may therefore turn out that the barrier to implementing CE will not only be the biowaste collection, but also collection rates of packaging waste. All these aspects should be taken into account in implementing future strategies. Choosing a biowaste treatment scenario, based on the different share of composting and AD technology, is an important aspect of the recycling system and its benefits. The research shows an advantage related to the development of AD technology, especially in the case of animal by-products collection. Taking into account technological developments, regions should also implement more advanced solutions such as biorefineries [80]. However, it must be related to economic analysis.
The research hypothesis presented in this paper that biowaste separate collection and its treatment play an important role in meeting the requirements of the circular economy has been confirmed. Methodology applied in the paper can be used for different types of MSW separately collected and for other cities and regions trying to meet CE demands. In particular, the results can be applied to regions that are just beginning to implement separate collection of biowaste, similarly to Warsaw. In future works, the analysis should be extended to variable factors related also to the packaging and textile waste. Furthermore, the issue of OFMSW processing economics should be developed, as it is a factor necessary to implement the technology on a full industrial scale.

Author Contributions

Conceptualization, K.L.-S. and A.R.-K.; methodology, K.L.-S. and A.R.-K..; validation, P.M.; formal analysis, P.M.; investigation, K.L.-S. and A.R.-K.; resources, K.L.-S. and A.R.-K.; data curation, K.L.-S. and A.R.-K.; writing—original draft preparation, K.L.-S. and A.R.-K.; writing—review and editing, P.M.; visualization, K.L.-S. and A.R.-K.; supervision, P.M.; project administration, P.M.; funding acquisition, P.M. All authors have read and agreed to the published version of the manuscript.

Funding

This research was co-financed by the Strategic Research Project of the Warsaw University of Technology “Circular Economy”.

Conflicts of Interest

The authors declare no conflict of interest.

References

  1. Malinauskaite, J.; Jouhara, H.; Czajczyńska, D.; Stanchev, P.; Katsou, E.; Rostkowski, P.; Thorne, R.J.; Colón, J.; Ponsá, S.; Al-Mansour, F.; et al. Municipal solid waste management and waste-to-energy in the context of a circular economy and energy recycling in Europe. Energy 2017. [Google Scholar] [CrossRef]
  2. Tisserant, A.; Pauliuk, S.; Merciai, S.; Schmidt, J.; Fry, J.; Wood, R.; Tukker, A. Solid Waste and the Circular Economy: A Global Analysis of Waste Treatment and Waste Footprints. J. Ind. Ecol. 2017, 21, 628–640. [Google Scholar] [CrossRef] [Green Version]
  3. EC. Council Directive 1999/31/EC of 26 April 1999 on the Landfill of Waste; European Comission: Brussels, Belgium, 1999. [Google Scholar]
  4. European Comission. COMMISSION IMPLEMENTING DECISION (EU) 2018/1147 of 10 August 2018 Establishing Best Available Techniques (BAT) Conclusions for Waste Treatment, under Directive 2010/75/EU of the European Parliament and of the Council (Notified under Document C(2018) 5070); European Comission: Brussels, Belgium, 2018. [Google Scholar]
  5. Kyriakopoulos, G.L.; Kapsalis, V.C.; Aravossis, K.G.; Zamparas, M.; Mitsikas, A. Evaluating circular economy under a multi-parametric approach: A technological review. Sustainability 2019, 11, 6139. [Google Scholar] [CrossRef] [Green Version]
  6. Sherwood, J. The significance of biomass in a circular economy. Bioresour. Technol. 2020, 300. [Google Scholar] [CrossRef] [PubMed]
  7. Awasthi, M.K.; Sarsaiya, S.; Patel, A.; Juneja, A.; Singh, R.P.; Yan, B.; Awasthi, S.K.; Jain, A.; Liu, T.; Duan, Y.; et al. Refining biomass residues for sustainable energy and bio-products: An assessment of technology, its importance, and strategic applications in circular bio-economy. Renew. Sustain. Energy Rev. 2020, 127, 109876. [Google Scholar] [CrossRef]
  8. Borrello, M.; Caracciolo, F.; Lombardi, A.; Pascucci, S.; Cembalo, L. Consumers’ perspective on circular economy strategy for reducing food waste. Sustainability 2017, 9, 141. [Google Scholar] [CrossRef] [Green Version]
  9. Corrado, S.; Sala, S. Food waste accounting along global and European food supply chains: State of the art and outlook. Waste Manag. 2018, 79, 120–131. [Google Scholar] [CrossRef]
  10. Jędrczak, A. Composting and Fermentation of Biowaste—Advantages and Disadvantages of Processes. Civ. Environ. Eng. Reports 2019, 28, 71–87. [Google Scholar] [CrossRef] [Green Version]
  11. Edjabou, M.E.; Jensen, M.B.; Götze, R.; Pivnenko, K.; Petersen, C.; Scheutz, C.; Astrup, T.F. Municipal solid waste composition: Sampling methodology, statistical analyses, and case study evaluation. Waste Manag. 2015, 36, 12–23. [Google Scholar] [CrossRef] [Green Version]
  12. Karak, T.; Bhagat, R.M.; Bhattacharyya, P. Municipal solid waste generation, composition, and management: The world scenario. Crit. Rev. Environ. Sci. Technol. 2012, 42, 1509–1630. [Google Scholar] [CrossRef]
  13. Abad, V.; Avila, R.; Vicent, T.; Font, X. Promoting circular economy in the surroundings of an organic fraction of municipal solid waste anaerobic digestion treatment plant: Biogas production impact and economic factors. Bioresour. Technol. 2019, 283, 10–17. [Google Scholar] [CrossRef] [PubMed]
  14. Do Carmo Precci Lopes, A.; Robra, S.; Müller, W.; Meirer, M.; Thumser, F.; Alessi, A.; Bockreis, A. Comparison of two mechanical pre-treatment systems for impurities reduction of source-separated biowaste. Waste Manag. 2019, 100, 66–74. [Google Scholar] [CrossRef] [PubMed]
  15. Cerda, A.; Artola, A.; Font, X.; Barrena, R.; Gea, T.; Sánchez, A. Composting of food wastes: Status and challenges. Bioresour. Technol. 2018, 248, 57–67. [Google Scholar] [CrossRef] [PubMed] [Green Version]
  16. Malamis, D.; Bourka, A.; Stamatopoulou; Moustakas, K.; Skiadi, O.; Loizidou, M. Study and assessment of segregated biowaste composting: The case study of Attica municipalities. J. Environ. Manag. 2017, 203, 664–669. [Google Scholar] [CrossRef]
  17. Rodrigues, L.C.; Puig-Ventosa, I.; López, M.; Martínez, F.X.; Ruiz, A.G.; Bertrán, T.G. The impact of improper materials in biowaste on the quality of compost. J. Clean. Prod. 2020, 251, 119601. [Google Scholar] [CrossRef]
  18. Passarini, F.; Vassura, I.; Monti, F.; Morselli, L.; Villani, B. Indicators of waste management efficiency related to different territorial conditions. Waste Manag. 2011, 31, 785–792. [Google Scholar] [CrossRef]
  19. Rodrigues, J.; Oliveira, V.; Lopes, P.; Dias-Ferreira, C. Door-to-Door Collection of Food and Kitchen Waste in City Centers Under the Framework of Multimunicipal Waste Management Systems in Portugal: The Case Study of Aveiro. Waste Biomass Valorization 2015, 6, 647–656. [Google Scholar] [CrossRef]
  20. Timlett, R.E.; Williams, I.D. The impact of transient populations on recycling behaviour in a densely populated urban environment. Resour. Conserv. Recycl. 2009, 53, 498–506. [Google Scholar] [CrossRef]
  21. Carvalho, P.; Marques, R.C. Economies of size and density in municipal solid waste recycling in Portugal. Waste Manag. 2014, 34, 12–20. [Google Scholar] [CrossRef]
  22. Gomes, A.P.; Matos, M.A.; Carvalho, I.C. Separate collection of the biodegradable fraction of MSW: An economic assessment. Waste Manag. 2008, 28, 1711–1719. [Google Scholar] [CrossRef]
  23. Demirbas, A. Biogas production from the organic fraction of municipal solid waste. Energy Sources Part A Recovery Util. Environ. Eff. 2006, 28, 1127–1134. [Google Scholar] [CrossRef]
  24. Kigozi, R.; Aboyade, A.; Muzenda, E. Biogas Production Using the Organic Fraction of Municipal Solid Waste as Feedstock. Int. J. Res. Chem. Metall. Civ. Eng. 2014, 1, 107–114. [Google Scholar] [CrossRef]
  25. Campuzano, R.; González-Martínez, S. Characteristics of the organic fraction of municipal solid waste and methane production: A review. Waste Manag. 2016, 54, 3–12. [Google Scholar] [CrossRef] [PubMed]
  26. Mardoyan, A.; Braun, P. Analysis of czech subsidies for solid biofuels. Int. J. Green Energy 2015, 12, 405–408. [Google Scholar] [CrossRef]
  27. Curkowski, A.; Mroczkowski, P.; Oniszk-Popławska, A.; Wiśniewski, G. Biogas—Production and Use; Mazovia Energy Agency: Warsaw, Poland, 2009. [Google Scholar]
  28. Starr, K.; Villalba, G.; Gabarrell, X. Upgraded biogas from municipal solid waste for natural gas substitution and CO2 reduction—A case study of Austria, Italy, and Spain. Waste Manag. 2015, 38, 105–116. [Google Scholar] [CrossRef]
  29. Biogas Calculator. Available online: http://en.planet-biogas.com/biogas-calculator/ (accessed on 20 May 2020).
  30. Igliński, B.; Buczkowski, R.; Iglińska, A.; Cichosz, M.; Piechota, G.; Kujawski, W. Agricultural biogas plants in Poland: Investment process, economical and environmental aspects, biogas potential. Renew. Sustain. Energy Rev. 2012, 16, 4890–4900. [Google Scholar] [CrossRef]
  31. Comparetti, A.; Greco, C.; Navickas, K.; Venslauskas, K. Engineering for Rural Development Evaluation of Potential Biogas Production in Sicily. In Proceedings of the 11th International Science Conference, Jelgava, Latvia, 24–25 May 2012. [Google Scholar]
  32. Kuo, J.; Dow, J. Biogas production from anaerobic digestion of food waste and relevant air quality implications. J. Air Waste Manag. Assoc. 2017, 67, 1000–1011. [Google Scholar] [CrossRef]
  33. United States Environmental Protection Agency. The Benefits of Anaerobic Digestion of Food Waste at Wastewater Treatment Facilities; United States Environmental Protection Agency: Washington, DC, USA, 2007. [Google Scholar]
  34. Pöschl, M.; Ward, S.; Owende, P. Evaluation of energy efficiency of various biogas production and utilization pathways. Appl. Energy 2010, 87, 3305–3321. [Google Scholar] [CrossRef]
  35. Mirmohamadsadeghi, S.; Karimi, K.; Tabatabaei, M.; Aghbashlo, M. Biogas production from food wastes: A review on recent developments and future perspectives. Bioresour. Technol. Rep. 2019, 7, 100202. [Google Scholar] [CrossRef]
  36. Maroušek, J.; Strunecký, O.; Kolář, L.; Vochozka, M.; Kopecký, M.; Maroušková, A.; Batt, J.; Poliak, M.; Šoch, M.; Bartoš, P.; et al. Advances in nutrient management make it possible to accelerate biogas production and thus improve the economy of food waste processing. Energy Sources Part A Recovery Util. Environ. Eff. 2020, 00, 1–10. [Google Scholar] [CrossRef]
  37. Bhatia, S.K.; Joo, H.S.; Yang, Y.H. Biowaste-to-bioenergy using biological methods—A mini-review. Energy Convers. Manag. 2018, 177, 640–660. [Google Scholar] [CrossRef]
  38. Achinas, S.; Achinas, V.; Jan, G.; Euverink, W. A Technological Overview of Biogas Production from Biowaste. Engineering 2017, 3, 299–307. [Google Scholar] [CrossRef]
  39. Pavlas, M.; Dvořáček, J.; Pitschke, T.; Peche, R. Biowaste treatment and waste-to-energy-environmental benefits. Energies 2020, 13, 1994. [Google Scholar] [CrossRef] [Green Version]
  40. Demichelis, F.; Piovano, F.; Fiore, S. Biowaste management in Italy: Challenges and perspectives. Sustainability 2019, 11, 4213. [Google Scholar] [CrossRef] [Green Version]
  41. Zeller, V.; Lavigne, C.; D’ans, P.; Towa, E.; Achten, W.M.J. Assessing the environmental performance of circular economy options for biowaste flows at city-region level. Sci. Total Environ. 2020, 745. [Google Scholar] [CrossRef]
  42. Maroušek, J.; Kolář, L.; Strunecký, O.; Kopecký, M.; Bartoš, P.; Maroušková, A.; Cudlínová, E.; Konvalina, P.; Šoch, M.; Moudrý, J., Jr.; et al. Modified biochars present an economic challenge to phosphate management in wastewater treatment plants. J. Clean. Prod. 2020, 272, 123015. [Google Scholar] [CrossRef]
  43. Maroušek, J.; Bartoš, P.; Filip, M.; Kolář, L.; Konvalina, P.; Maroušková, A.; Moudrý, J.; Peterka, J.; Šál, J.; Šoch, M.; et al. Advances in the agrochemical utilization of fermentation residues reduce the cost of purpose-grown phytomass for biogas production. Energy Sources Part A Recovery Util. Environ. Eff. 2020, 1–11. [Google Scholar] [CrossRef]
  44. European Comission. Optimal Use of Biogas from Waste Streams: An Assessment of the Potential of Biogas from Digestion in the EU beyond 2020; European Comission: Brussels, Belgium, 2016. [Google Scholar]
  45. Rada, E.C.; Cioca, L. Optimizing the Methodology of Characterization of Municipal Solid Waste in EU under a Circular Economy Perspective. Energy Procedia 2017, 119, 72–85. [Google Scholar] [CrossRef]
  46. Ludbrook, F.; Michalikova, K.F.; Musova, Z.; Suler, P. Business models for sustainable innovation in industry 4.0: Smart manufacturing processes, digitalization of production systems, and data-driven decision making. J. Self-Gov. Manag. Econ. 2019, 7, 21–26. [Google Scholar] [CrossRef]
  47. Milward, R.; Popescu, G.H.; Michalikova, K.F.; Musova, Z.; Machova, V. Sensing, smart, and sustainable technologies in industry 4.0: Cyber-physical networks, machine data capturing systems, and digitized mass production. Econ. Manag. Financ. Mark. 2019, 14, 37–43. [Google Scholar] [CrossRef] [Green Version]
  48. Cimpan, C.; Rothmann, M.; Hamelin, L.; Wenzel, H. Towards increased recycling of household waste: Documenting cascading effects and material ef fi ciency of commingled recyclables and biowaste collection. J. Environ. Manag. 2015, 157, 69–83. [Google Scholar] [CrossRef] [PubMed]
  49. Bernstad, A. Household food waste separation behavior and the importance of convenience. Waste Manag. 2014, 34, 1317–1323. [Google Scholar] [CrossRef]
  50. Nelles, M.; Grünes, J.; Morscheck, G. Waste Management in Germany—Development to a Sustainable Circular Economy? Procedia Environ. Sci. 2016, 35, 6–14. [Google Scholar] [CrossRef]
  51. Dubois, M.; Sims, E.; Moerman, T.; Watson, D.; Bauer, B.; Bel, J.-B.; Mehlhart, G. Guidance for Separate Collection of Municipal Waste (Final Deliverable of the Study to Support the Commission in Establishing Guidelines for Separate Collection of Waste under Framework Contract N° ENV/B.3/FRA/2017/0005); Directorate-General for Environment (European Commission): Brussels, Belgium, 2020. [Google Scholar] [CrossRef]
  52. Central Statistical Office in Warsaw. Data for Years 2014-2018; Central Statistical Office in Warsaw: Warsaw, Poland, 2018. [Google Scholar]
  53. Central Office of the Capital City of Warsaw. Waste Management Unit. Analysis of the State of Municipal Waste Management for the Capital City of Warsaw for 2018; Central Office of the Capital City of Warsaw: Warsaw, Poland, 2019. [Google Scholar]
  54. Government of the Republic of Poland. Resolution No 88 Council of Ministers of 1 July 2016 on the National Waste Management Plan 2022; Government of the Republic of Poland: Warsaw, Poland, 2016. [Google Scholar]
  55. Alwaeli, M. An overview of municipal solid waste management in Poland. The current situation, problems and challenges. Environ. Prot. Eng. 2015, 41, 181–193. [Google Scholar] [CrossRef]
  56. Den Boer, E.; Jedrczak, A.; Kowalski, Z.; Kulczycka, J.; Szpadt, R. A review of municipal solid waste composition and quantities in Poland. Waste Manag. 2010, 30, 369–377. [Google Scholar] [CrossRef] [PubMed]
  57. Council of the Capital City of Warsaw. Development Strategy for the Capital City Of Warsaw until 2030; Council of the Capital City of Warsaw: Warsaw, Poland, 2018. [Google Scholar]
  58. Molino, A.; Nanna, F.; Ding, Y.; Bikson, B.; Braccio, G. Biomethane production by anaerobic digestion of organic waste. Fuel 2013, 103, 1003–1009. [Google Scholar] [CrossRef]
  59. Jank, A.; Müller, W.; Waldhuber, S.; Gerke, F.; Ebner, C.; Bockreis, A. Hydrocyclones for the separation of impurities in pretreated biowaste. Waste Manag. 2017, 64, 12–19. [Google Scholar] [CrossRef]
  60. Board of the Mazowieckie Voivodeship Waste Management Plan for the Mazowieckie Vovoidship for the Years 2016–2021, Including the Years 2022–2027; Board of the Mazowieckie Voivodeship Waste Management: Warsaw, Poland, 2016.
  61. Fragkou, M.C.; Vicent, T.; Gabarrell, X. A general methodology for calculating the MSW management self-sufficiency indicator: Application to the wider Barcelona area. Resour. Conserv. Recycl. 2010, 54, 390–399. [Google Scholar] [CrossRef]
  62. Vázquez, M.A.; Soto, M. The efficiency of home composting programmes and compost quality. Waste Manag. 2017, 64, 39–50. [Google Scholar] [CrossRef]
  63. Government of the Republic of Poland Act on Maintaining Cleanliness and Order in Communes (Dz. U. 1996 Nr 132 poz. 622). 2020; pp. 1–58. Available online: http://isap.sejm.gov.pl/isap.nsf/download.xsp/WDU19961320622/U/D19960622Lj.pdf (accessed on 20 May 2020).
  64. Albihn, A. Recycling biowaste—Human and animal health problems. Acta Vet. Scand. 2002, 43, 69–75. [Google Scholar] [CrossRef] [Green Version]
  65. European Commission—DG ENV. Assessment of separate collection schemes in the 28 capitals of the EU Final Report CLIENT European Commission Directorate-General Environment Report title Final Report; European Commission: Brussels, Belgium, 2015. [Google Scholar]
  66. Scarlat, N.; Dallemand, J.F.; Fahl, F. Biogas: Developments and perspectives in Europe. Renew. Energy 2018, 129, 457–472. [Google Scholar] [CrossRef]
  67. Giavini, M.; Favoino, E. Bio-Waste Generation in the EU: Current Capture Levels and Future Potential; Bio-Based Industries Consortium (BIC): Brussels, Belgium, 2020. [Google Scholar]
  68. Schüch, A.; Morscheck, G.; Lemke, A.; Nelles, M. Bio-Waste Recycling in Germany—Further Challenges. Procedia Environ. Sci. 2016, 35, 308–318. [Google Scholar] [CrossRef]
  69. Murphy, J.D.; Power, N.M. A technical, economic and environmental comparison of composting and anaerobic digestion of biodegradable municipal waste. J. Environ. Sci. Health Part A Toxic/Hazard. Subst. Environ. Eng. 2006, 41, 865–879. [Google Scholar] [CrossRef] [PubMed]
  70. Gebrezgabher, S.A.; Meuwissen, M.P.M.; Prins, B.A.M.; Lansink, A.G.J.M.O. Economic analysis of anaerobic digestion-A case of Green power biogas plant in the Netherlands. NJAS Wageningen J. Life Sci. 2010, 57, 109–115. [Google Scholar] [CrossRef] [Green Version]
  71. Batstone, D.J.; Virdis, B. The role of anaerobic digestion in the emerging energy economy. Curr. Opin. Biotechnol. 2014, 27, 142–149. [Google Scholar] [CrossRef]
  72. Huiru, Z.; Yunjun, Y.; Liberti, F.; Bartocci, P.; Fantozzi, F. Technical and economic feasibility analysis of an anaerobic digestion plant fed with canteen food waste. Energy Convers. Manag. 2019, 180, 938–948. [Google Scholar] [CrossRef]
  73. Vochozka, M.; Maroušková, A.; Váchal, J.; Straková, J. Reengineering the paper mill waste management. Clean Technol. Environ. Policy 2016, 18, 323–329. [Google Scholar] [CrossRef]
  74. Paritosh, K.; Kushwaha, S.K.; Yadav, M.; Pareek, N.; Chawade, A.; Vivekanand, V. Food Waste to Energy: An Overview of Sustainable Approaches for Food Waste Management and Nutrient Recycling. BioMed Res. Int. 2017, 2017. [Google Scholar] [CrossRef]
  75. Fachverband Biogas e.V. German Biogas Association Biogas in Germany—Aspects of organic waste digestion. In Proceedings of the Biogas Convention, Hanover, Germany, 14–16 November 2018. [Google Scholar]
  76. Dehkordi, S.M.M.N.; Jahromi, A.R.T.; Ferdowsi, A.; Shumal, M.; Dehnavi, A. Investigation of biogas production potential from mechanical separated municipal solid waste as an approach for developing countries (case study: Isfahan-Iran). Renew. Sustain. Energy Rev. 2019, 109586. [Google Scholar] [CrossRef]
  77. Igliński, B.; Buczkowski, R.; Cichosz, M. Biogas production in Poland—Current state, potential and perspectives. Renew. Sustain. Energy Rev. 2015, 50, 686–695. [Google Scholar] [CrossRef]
  78. Administration and Civic Affairs Office of the Capital City of Warsaw. How Many Inhabitants Does Warsaw Have? Available online: https://www.um.warszawa.pl/aktualnosci/ilu-mieszka-c-w-ma-warszawa (accessed on 25 May 2020).
  79. European Parliment. Directive (EU) 2018/851 of the European Parliament and of the Council of 30 May 2018 Amending Directive 2008/98/EC on Waste; European Parliament: Strasbourg, France, 2018. [Google Scholar]
  80. Maroušek, J.; Myšková, K.; Žák, J. Managing environmental innovation: Case study on biorefinery concept. Rev. Tec. Fac. Ing. Univ. Zulia 2015, 38, 216–220. [Google Scholar]
Figure 1. Flow diagram in TS-I.
Energies 13 04366 g001
Figure 2. Flow diagram in TS-II.
Energies 13 04366 g002
Figure 3. Flow diagram in TS-III.
Energies 13 04366 g003
Figure 4. Biowaste potential in MSW in Warsaw.
Energies 13 04366 g004
Figure 5. Biowaste separate collection scenarios.
Energies 13 04366 g005
Figure 6. OFMSW (food+green waste) recycling rate (a) and biowaste share in total MSW recycling rate (b).
Energies 13 04366 g006aEnergies 13 04366 g006b
Figure 7. MFA for TS-I-S3, prediction for 2035.
Energies 13 04366 g007
Figure 8. MFA for TS-II-S3, prediction for 2035.
Energies 13 04366 g008
Figure 9. MFA for TS-III, prediction for 2030.
Energies 13 04366 g009
Figure 10. Biogas potential prediction until 2050 under scenarios TS-II and TS-III.
Energies 13 04366 g010
Table 1. Biogas and CH4 yield from OFMSW.
ParametersUnitsValueSource
Biogas yield(m3·Mg−1)120[27]
107[28]
160[31]
121[29]
90[30]
(m3·Mg−1 DM)636[27]
713[28]
547[29]
578–828[32]
588[33]
500[30]
592[34]
(m3·Mg−1 ODM)853[27]
543[30]
CH4 yield(m3·Mg−1 ODM)512[27]
522[35]
326[30]
DM—dry mass; ODM—organic dry mass.
Table 2. List of acronyms used in the paper.
AcronymExtended Meaning
ADAnaerobic digestion
CECircular Economy
CPComposting plant
OFMSWOrganic fraction of municipal solid waste
MBTMechanical-biological treatment
MSWMunicipal solid waste
SSeparate collection scenario
TSTechnical scenario
Table 3. Properties of biowaste collected in Warsaw in 2019.
Properties Mean Value
Moisture, (%) 79.09
Dry matter content, (%) 20.91
Total organic matter content, (%) 74.56
Total impurities, (%): 17.45
Animal by-products 1, (%)1.44
Nuts, seeds, (%)0.91
Paper, (%)1.10
Plastics, (%)10.65
Glass, (%)2.57
Metals, (%)0.78
1 Due to the fact that in the system introduced in Warsaw, animal by-products should not be collected with biowaste, their presence in the sample was treated as contamination.
Table 4. TS-I material flow of biowaste in recycling process and MSW recycling rate achieved.
Units202520302035204020452050
S1Composting(Mg)71,488121,984185,634206,912219,099227,689
(% 1)8.013.219.621.422.122.5
total MSW recycling rate(%)42.2%50.657.058.859.659.9
S2Composting(Mg)64,26293,051131,004161,596173,345179,076
(% 1)7.210.013.816.717.517.7
total MSW recycling rate(%)41.447.551.354.154.955.1
S3Composting(Mg)78,748139,749216,892242,439256,808266,736
(% 1)8.8%15.122.925.025.926.3
total MSW recycling rate(%)43.052.560.362.563.463.8
1 share in total MSW recycling rate.
Table 5. TS-II material flow of biowaste in recycling process and MSW recycling rate achieved.
Units202520302035204020452050
S1CP(Mg)55,45682,755116,610128,463135,832141,467
(% 1)6.28.912.313.313.714.0
AD(Mg)16,03239,22969,02478,45083,26886,222
(% 1)1.84.27.38.18.48.5
Total MSW recycling rate(%)42.250.657.058.859.659.9
S2CP(Mg)51,84368,28989,295105,804112,955117,161
(% 1)5.87.49.410.911.411.6
AD(Mg)12,41924,76241,70955,79160,39061,915
(% 1)1.42.74.45.86.16.1
Total MSW recycling rate(%)41.447.551.354.154.955.1
S3CP(Mg)59,08691,638132,239146,226154,686160,991
(% 1)6.69.914.015.115.615.9
AD(Mg)19,66348,11184,65396,213102,122105,745
(% 1)2.25.28.99.910.310.4
Total MSW recycling rate(%)43.052.560.362.563.463.8
1 share in total MSW recycling rate.
Table 6. TS-III material flow of biowaste in recycling process and MSW recycling rate achieved.
Units202520302035204020452050
S1CP(Mg)41,28848,08855,61259,13562,24665,271
(% 1)4.65.25.96.16.36.4
AD(Mg)35,42086,668152,495173,319183,963190,490
(% 1)4.09.416.117.918.618.8
Total MSW recycling rate(%)42.852.059.461.462.362.7
S2CP(Mg)40,86746,40652,43656,50059,58662,445
(% 1)4.65.05.55.86.06.2
AD(Mg)27,43854,70892,148123,260133,421136,790
(% 1)3.15.99.712.713.513.5
Total MSW recycling rate(%)41.948.352.756.056.957.1
S3CP(Mg)41,71049,12157,42961,20164,43967,541
(% 1)4.75.36.16.36.56.7
AD(Mg)43,441106,292187,025212,564225,619233,623
(% 1)4.811.519.721.922.823.0
Total MSW recycling rate(%)43.754.263.365.766.767.2
1 share in MSW recycling rate.
Table 7. TS-II and TS-III heat and energy generation prediction.
ParameterUnits202520302035204020452050
TS-II
S1tHP 1(TJ)10.425.444.850.954.055.9
tEP 2(GWh)2.66.211.012.513.313.7
S2tHP 1(TJ)8.116.027.136.239.240.2
tEP 2GWh2.03.96.68.99.69.9
S3tHP 1(TJ)12.831.254.962.466.268.6
tEP 2(GWh)3.17.713.515.316.316.8
TS-III
S1tHP 1(TJ)23.056.298.9112.4119.3123.6
tEP 2(GWh)5.613.824.327.629.330.3
S2tHP 1(TJ)17.835.559.880.086.588.7
tEP 2GWh4.48.714.719.621.321.8
S3tHP 1(TJ)28.269.0121.3137.9146.4151.5
tEP 2(GWh)6.916.929.833.935.937.2
1 tHP—Total heat production 2 tEP—Total electricity production.

