Article

Online Monitoring of Partial Discharges in Power Transformers Using Capacitive Coupling in the Tap of Condenser Bushings

1
High Voltage Equipments—HVEX, Nossa Sra. de Fatima, Itajubá MG 37502-508, Brazil
2
Institute of Electrical Systems and Energy, Federal University of Itajubá, Pinheirinho, Itajubá MG 37500-903, Brazil
3
Energisa, Bragança Paulista SP 12916-360, Brazil
*
Authors to whom correspondence should be addressed.
Energies 2020, 13(17), 4351; https://doi.org/10.3390/en13174351
Submission received: 20 July 2020 / Revised: 15 August 2020 / Accepted: 18 August 2020 / Published: 22 August 2020
(This article belongs to the Section F: Electrical Engineering)

Abstract

:
Failures in power transformers are one of the most serious occurrences in a power system. Thus, the monitoring of transformers and their ancillary equipment, such as bushings, is of great importance to improving the operational efficiency of these assets. In this context, this paper presents the development of a monitoring system for the measurement of partial discharges (PDs), which are a key parameter in the analysis of insulation condition. PD measurements were performed using the electrical method. For this purpose, a capacitive coupling device was developed for bushings that works as a sensor for high-frequency signals and also as a protection apparatus to guarantee the integrity of the bushings in cases of extreme events, such as lightning surges. In addition, a computational routine is presented that applies a digital filtering process followed by a proposed step for differentiating PDs from noises. For validation, the proposed system was subjected to laboratory tests and field applications, from which the viability of the project and the efficiency in detecting PDs were verified.

Graphical Abstract

1. Introduction

Power transformers constitute one of the main devices in a Transmission and Distribution (T&D) infrastructure, since they demand high financial investment and represent a link between different voltage classes [1,2]. Therefore, the reliability of these assets, which is related to their fault-free operation, is an important aspect to be considered in the system operation [3].
Faults in power transformers are generally catastrophic and lead to internal damage, which may be irreversible, since they occur mainly in the insulation systems of the equipment and may interrupt the power flow [4]. In this context, a crucial issue for ensuring the reliability of a power transformer and, consequently, its safe operation, is the monitoring of the insulation of this asset and its ancillary equipment such as bushings or load tap changers, which may involve, for example, dissolved gas analysis (DGA), partial discharge (PD) detection, and thermal analysis [5,6].
Monitoring of T & D equipment covers the measurement of basic parameters that influence the proper functioning of the asset. Typical monitoring systems perform the integration and data collection of sensors to detect evidence of failures, issue warnings of abnormal level quantities, design trend curves, and correlate events to trigger maintenance staff [6]. Particularly, this work focuses on partial discharge monitoring that is largely efficient in the analysis of the insulation conditions [7].
Partial discharges may occur under normal operating conditions of the equipment, due to small cavities filled by gases present in a solid dielectric [7], which are usually caused by the following factors: (i) design failures, which can cause dielectric stresses; (ii) failures in the lamination process; (iii) inadequate transportation and installation; (iv) dielectric contamination; and (v) natural wear of insulation layers. The existence of these cavities causes ionization of the gases when the material is subjected to an electric field, causing a high-frequency discharge of less than 1 µs duration, which, depending on its intensity, can be highly destructive [5]. Thus, according to IEC-60270 [8], a PD is defined as a localized electrical discharge that only partially bridges the insulation between conductors and which may or may not occur adjacent to a conductor. When PD occurs, several physical phenomena are generated. This fact allows the PD activity to be detected by several methods [4].
In the optical method, light-sensing devices are applied to identify the optical signals emitted by PDs, whose wavelengths can vary in the spectrum from ultraviolet to infrared [9]. In this technique, the main advantages are low interference from electromagnetic (EM) waves and high sensitivity [10]. These characteristics, however, may vary according to the technology of the applied sensors. Regarding the disadvantages, the invasive characteristics of this method, specifically the necessity to position the optical sensor in the vicinity of the PD, should be mentioned. This can be a difficult task because this area is generally not known and the locations of installation of a sensor inside a transformer tank can be limited by its construction characteristics [11,12]. Additionally, an important peculiarity regarding the optical method is that the condition of the dielectric material influences the sensitivity of the measurement. Thus, as power transformers have oil in the insulation system and the oil can suffer contamination by gases or solid particles throughout its lifetime, detecting light signals emitted by PDs can become a difficult task [13].
In the acoustic method, suitable sensors are used to capture the acoustic effects of partial discharge activities that generally occur in the 20–500 kHz frequency range. However, most sensors currently used operate in the central frequency range equal to 60–150 kHz, the latter being more appropriate for field applications [14]. The main advantages of this method are the great immunity to EM interferences, its non-invasiveness (since that sensors can be installed on the surface of the transformer tank), and the potential to locate PDs when several sensors are employed. On the other hand, the disadvantages are the impossibility of calibration, attenuations that occur in the acoustic waves, and time consumption [5].
The Ultra High Frequency (UHF) method is based on the detection of EM emissions that originated by PD activities via specific antennas [14]. In this case, the main advantages presented are the high immunity to noise, which facilitates field application, and the ability to locate PDs. However, the difficulties are related to the impossibility of calibration, the lack of flexibility for installation of the antennas (which often depend on the structure of the transformer), and the high costs of the measurement components [5,15].
Finally, the electrical method allows the detection of PDs in the insulation through current or voltage pulses that occur within a limited frequency range, which is typically limited to a few MHz [16]. This method stands out for its high sensitivity, and presents the benefit of allowing the calibration of the measurements so that it is possible to accurately determine the severity of the detected PD occurrences. However, to ensure such accuracy, the calibration should be performed in a reliable range of the transformer’s response. This is important in order to avoid attenuations or unknown reflections in PD signals. Regarding the difficulties, they relate to the presence of noise in the signal acquisition and the inability to locate defect points [17,18].
By using the latter method, this work presents the development of an online monitoring system with a high sampling rate and vertical resolution that can detect PD activities in power transformers from the capacitive coupling in the test taps of high voltage (HV) condenser bushings. Performing measurements from the tap terminal has the key benefit of detecting the occurrence of PDs not only in the insulation of the bushings but also in the insulation of the windings due to the capacitive and inductive coupling of the intrinsic elements of a transformer.
Since the electrical method is commonly used for the acceptance of equipment in a laboratory environment due to its accuracy and sensitivity [18], it is a good practice to adapt it for online monitoring. For this, however, some special aspects such as reducing external interference in data processing and ensuring the reliability of the designed equipment must be considered.
Thus, an important contribution of this work is the application of a methodology that can differentiate the PDs from external noise through a computational routine that does not cause attenuation in the measured signal and demonstrates fast processing (because it does not require the use of cascade filters or transform calculations). This is a relevant task for practical online monitoring applications since data must be processed repeatedly.
Another contribution is the presentation of an exceptionally reliable coupling device for condenser bushings that guarantees the integrity of the monitored asset even in extreme situations in the power system, such as lightning surges. Such protection in the tap coupling is a fundamental requirement so that the monitoring system can operate continuously in substations. As there has been a lack of developments of this type in the literature, this work can complement the developments presented in [19,20,21], which also deal with coupling on the tap of transformer bushings.
In order to validate the development, the monitoring system was subjected to intense high voltage tests in laboratory and then applied in substations for monitoring different 30 MVA power transformers with primary voltages of 138 kV.

2. Materials and Methods

2.1. Power Transformer Condenser Bushing

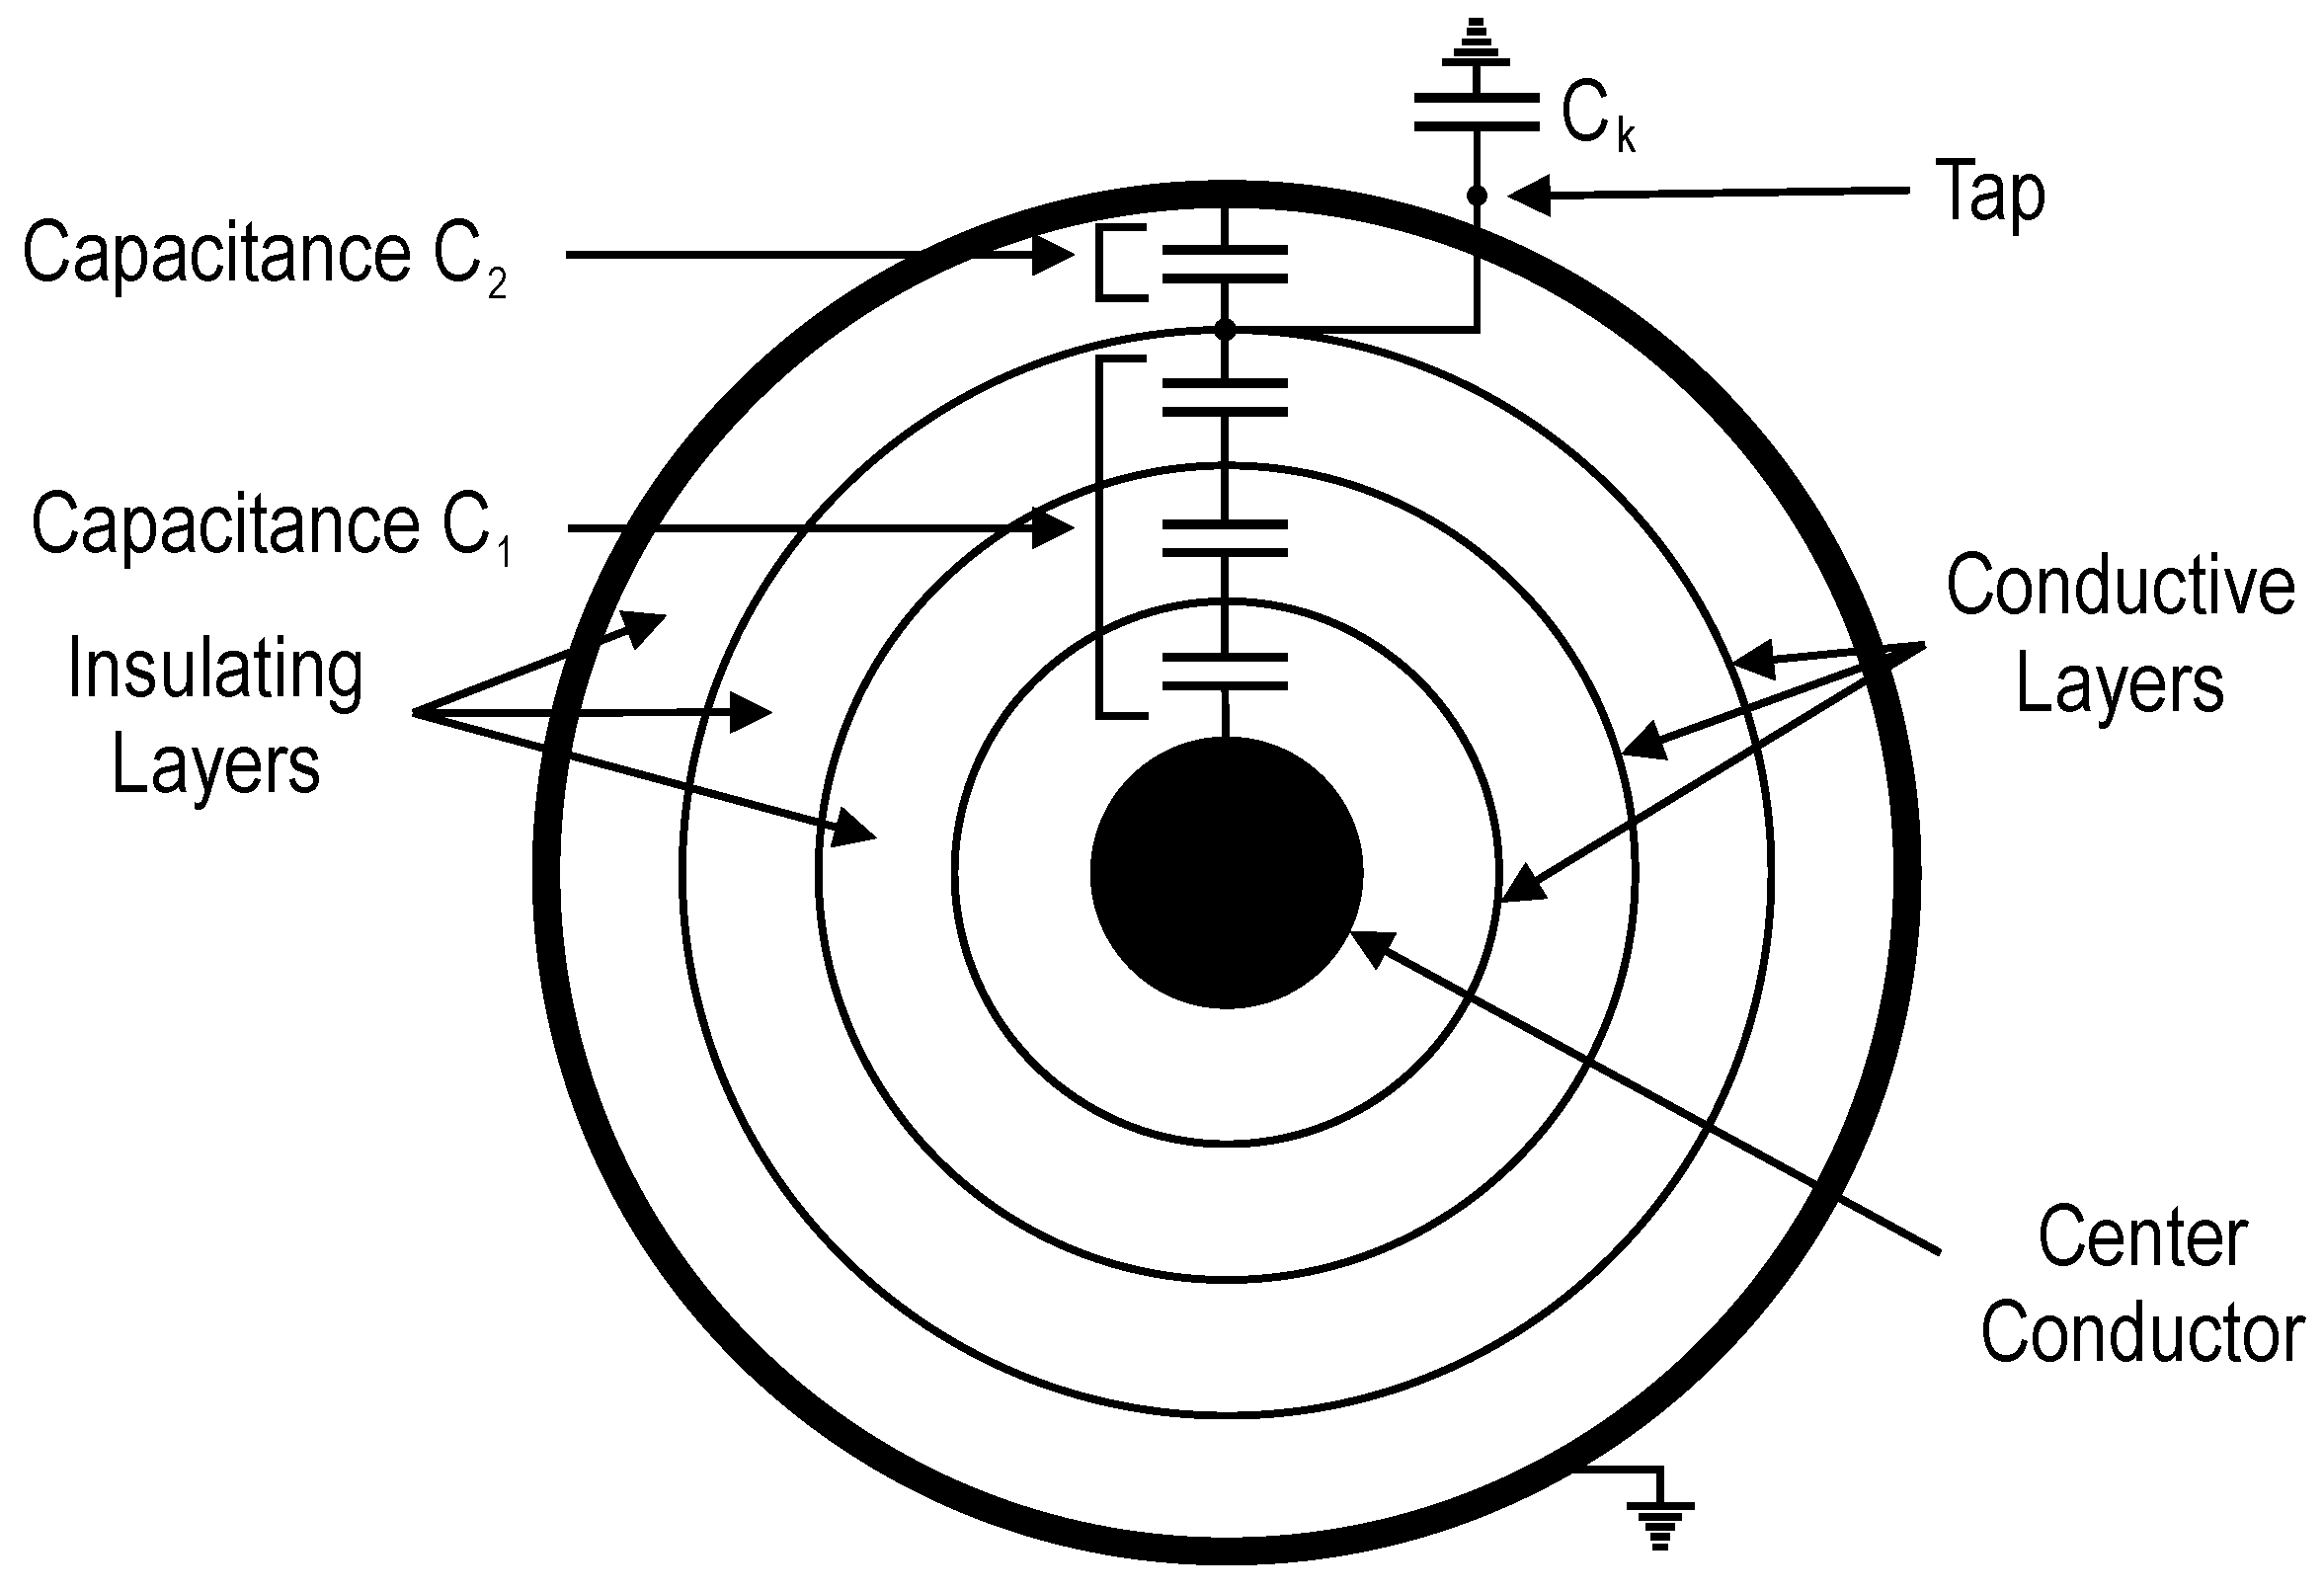
Condenser bushings are mainly used at voltages above 69 kV and are characterized by their insulation designed with cylindrical layers, composed of insulating materials, usually paper and oil, arranged coaxially with the conductive layers, as shown in Figure 1. The length and diameter of the cylinders are defined according to the partial capacitance, resulting in an electric field distribution and radial field control within the boundaries of the insulating material [22,23].
This type of bushing is usually provided with a test tap, located among capacitances C 1 and C 2 and the grounding surface, that works as an external terminal for access to the internal insulation, being widely used for monitoring and diagnostic purposes [24]. From the tap it is possible to perform some measures such as: partial discharges, dissipation factors, insulation power factors, and capacitances [6].
These measurements can be reached using an external coupling capacitance ( C k ) that works according to the desired application. For online tests (i.e., with the equipment in service), C k is intended for the acquisition of high-frequency signals, due to the high-pass characteristics, and establishment of a voltage divider with the internal capacitance C 2 . Alternately, for offline tests, C k can be used as a branch of a Schering bridge [25].

2.2. Partial Discharges Measurement

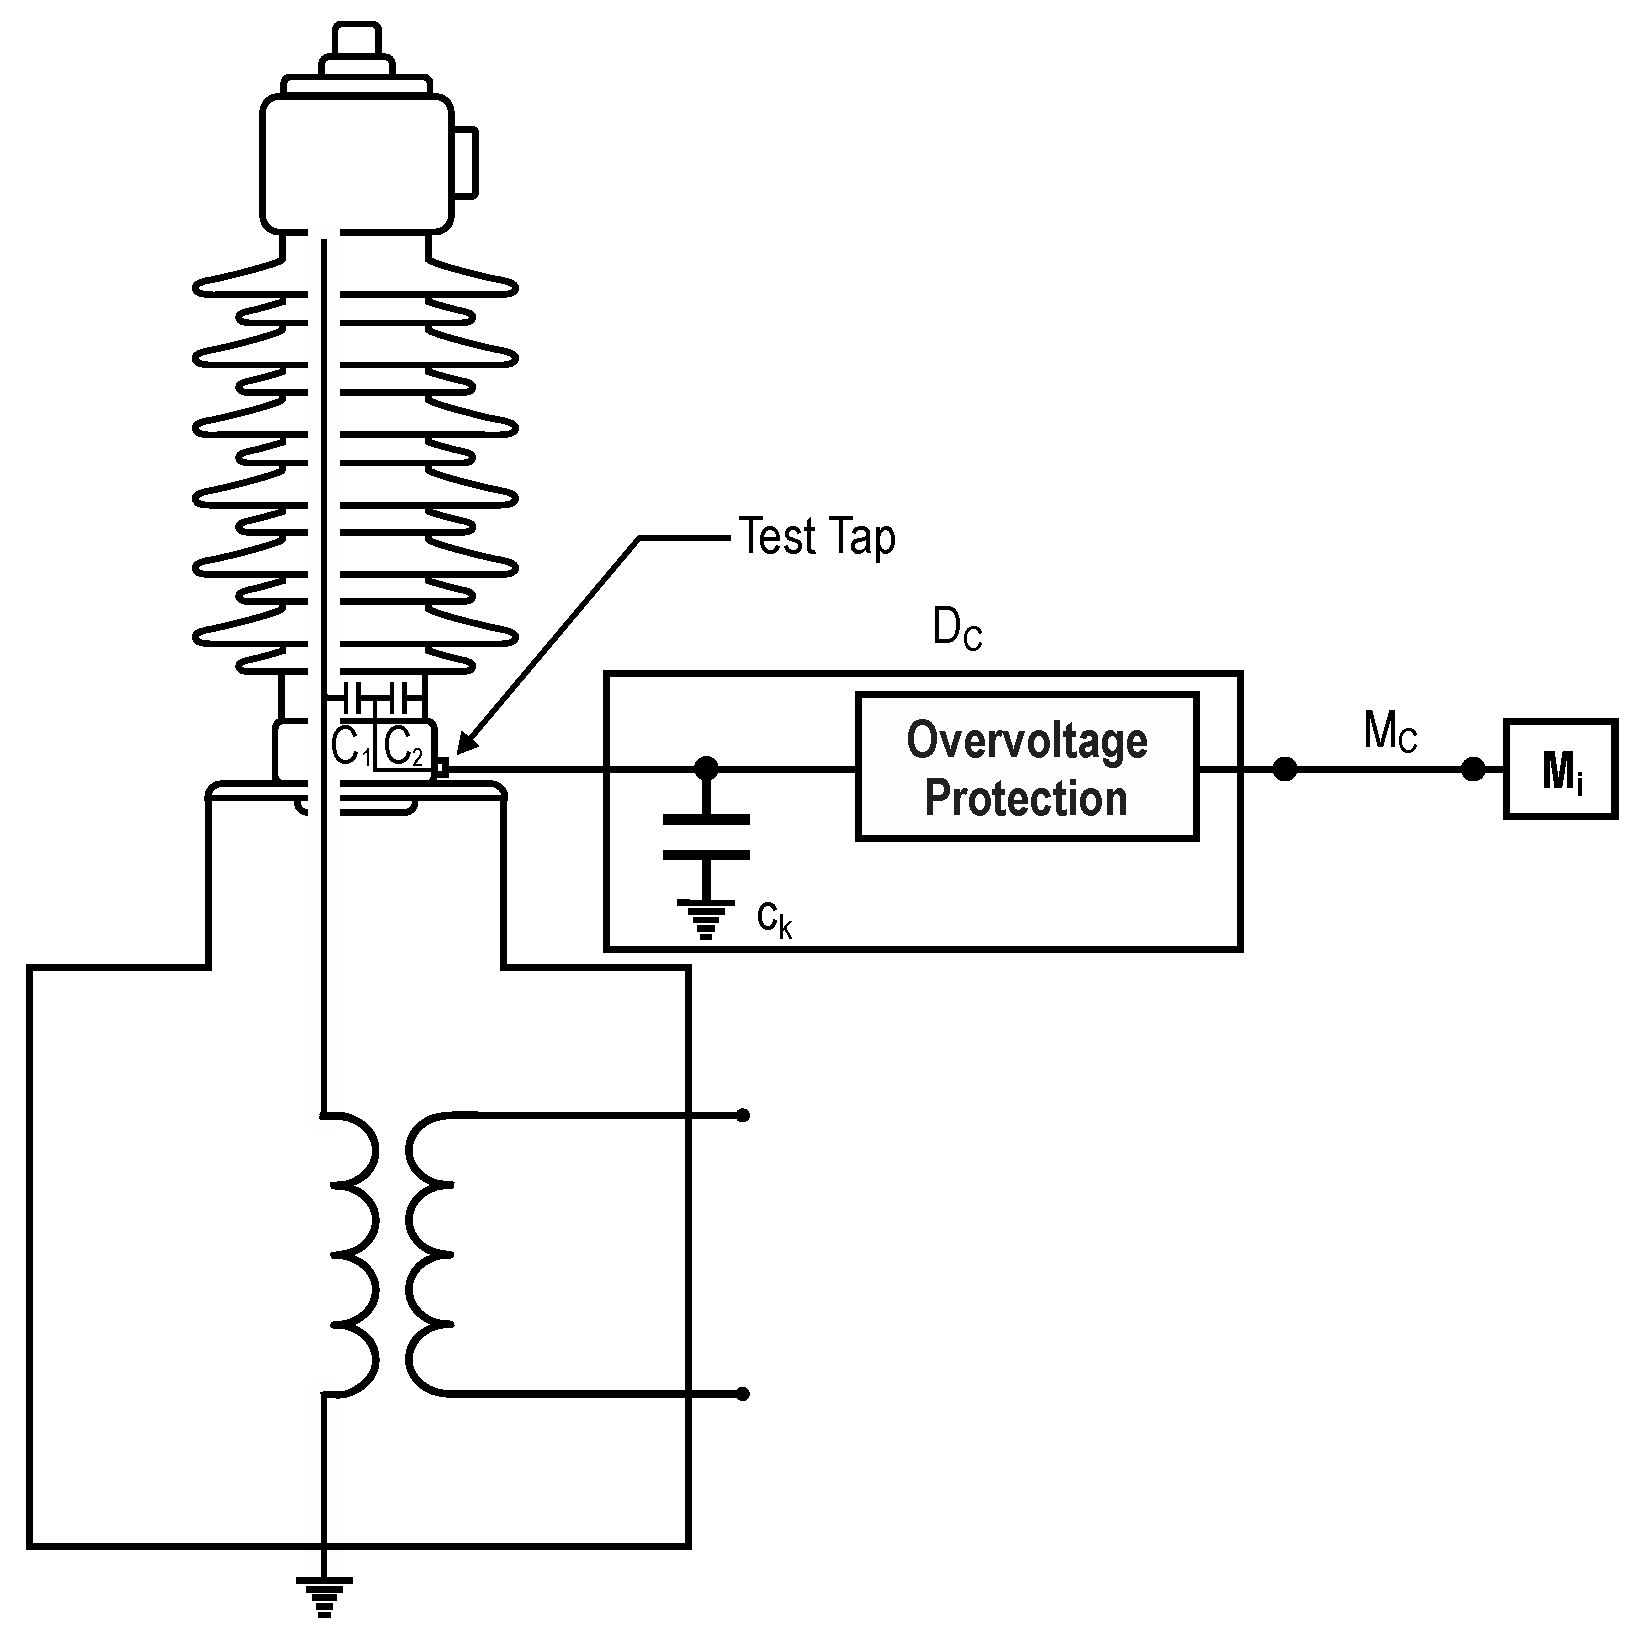
The circuit for measuring PDs by the electrical method in power transformer bushings is shown in Figure 2 [26]. In this scheme, the measurement and data processing instrument ( M i )—usually composed of an oscilloscope (or high-speed acquisition board) and a computer—connects through the conductor ( M c ) to the coupling device ( D c ), which is composed by C k and a protection circuit.
In the implementation of the illustrated circuit of Figure 2, it is emphasized that the connection of D c to the test tap must be made directly or through short conductors in order to reduce the equivalent inductance of the system and to avoid EM interferences. For the same reason, it is recommended that the conductor M c be as short as possible.

2.3. Structure and Design of the Online Monitoring System

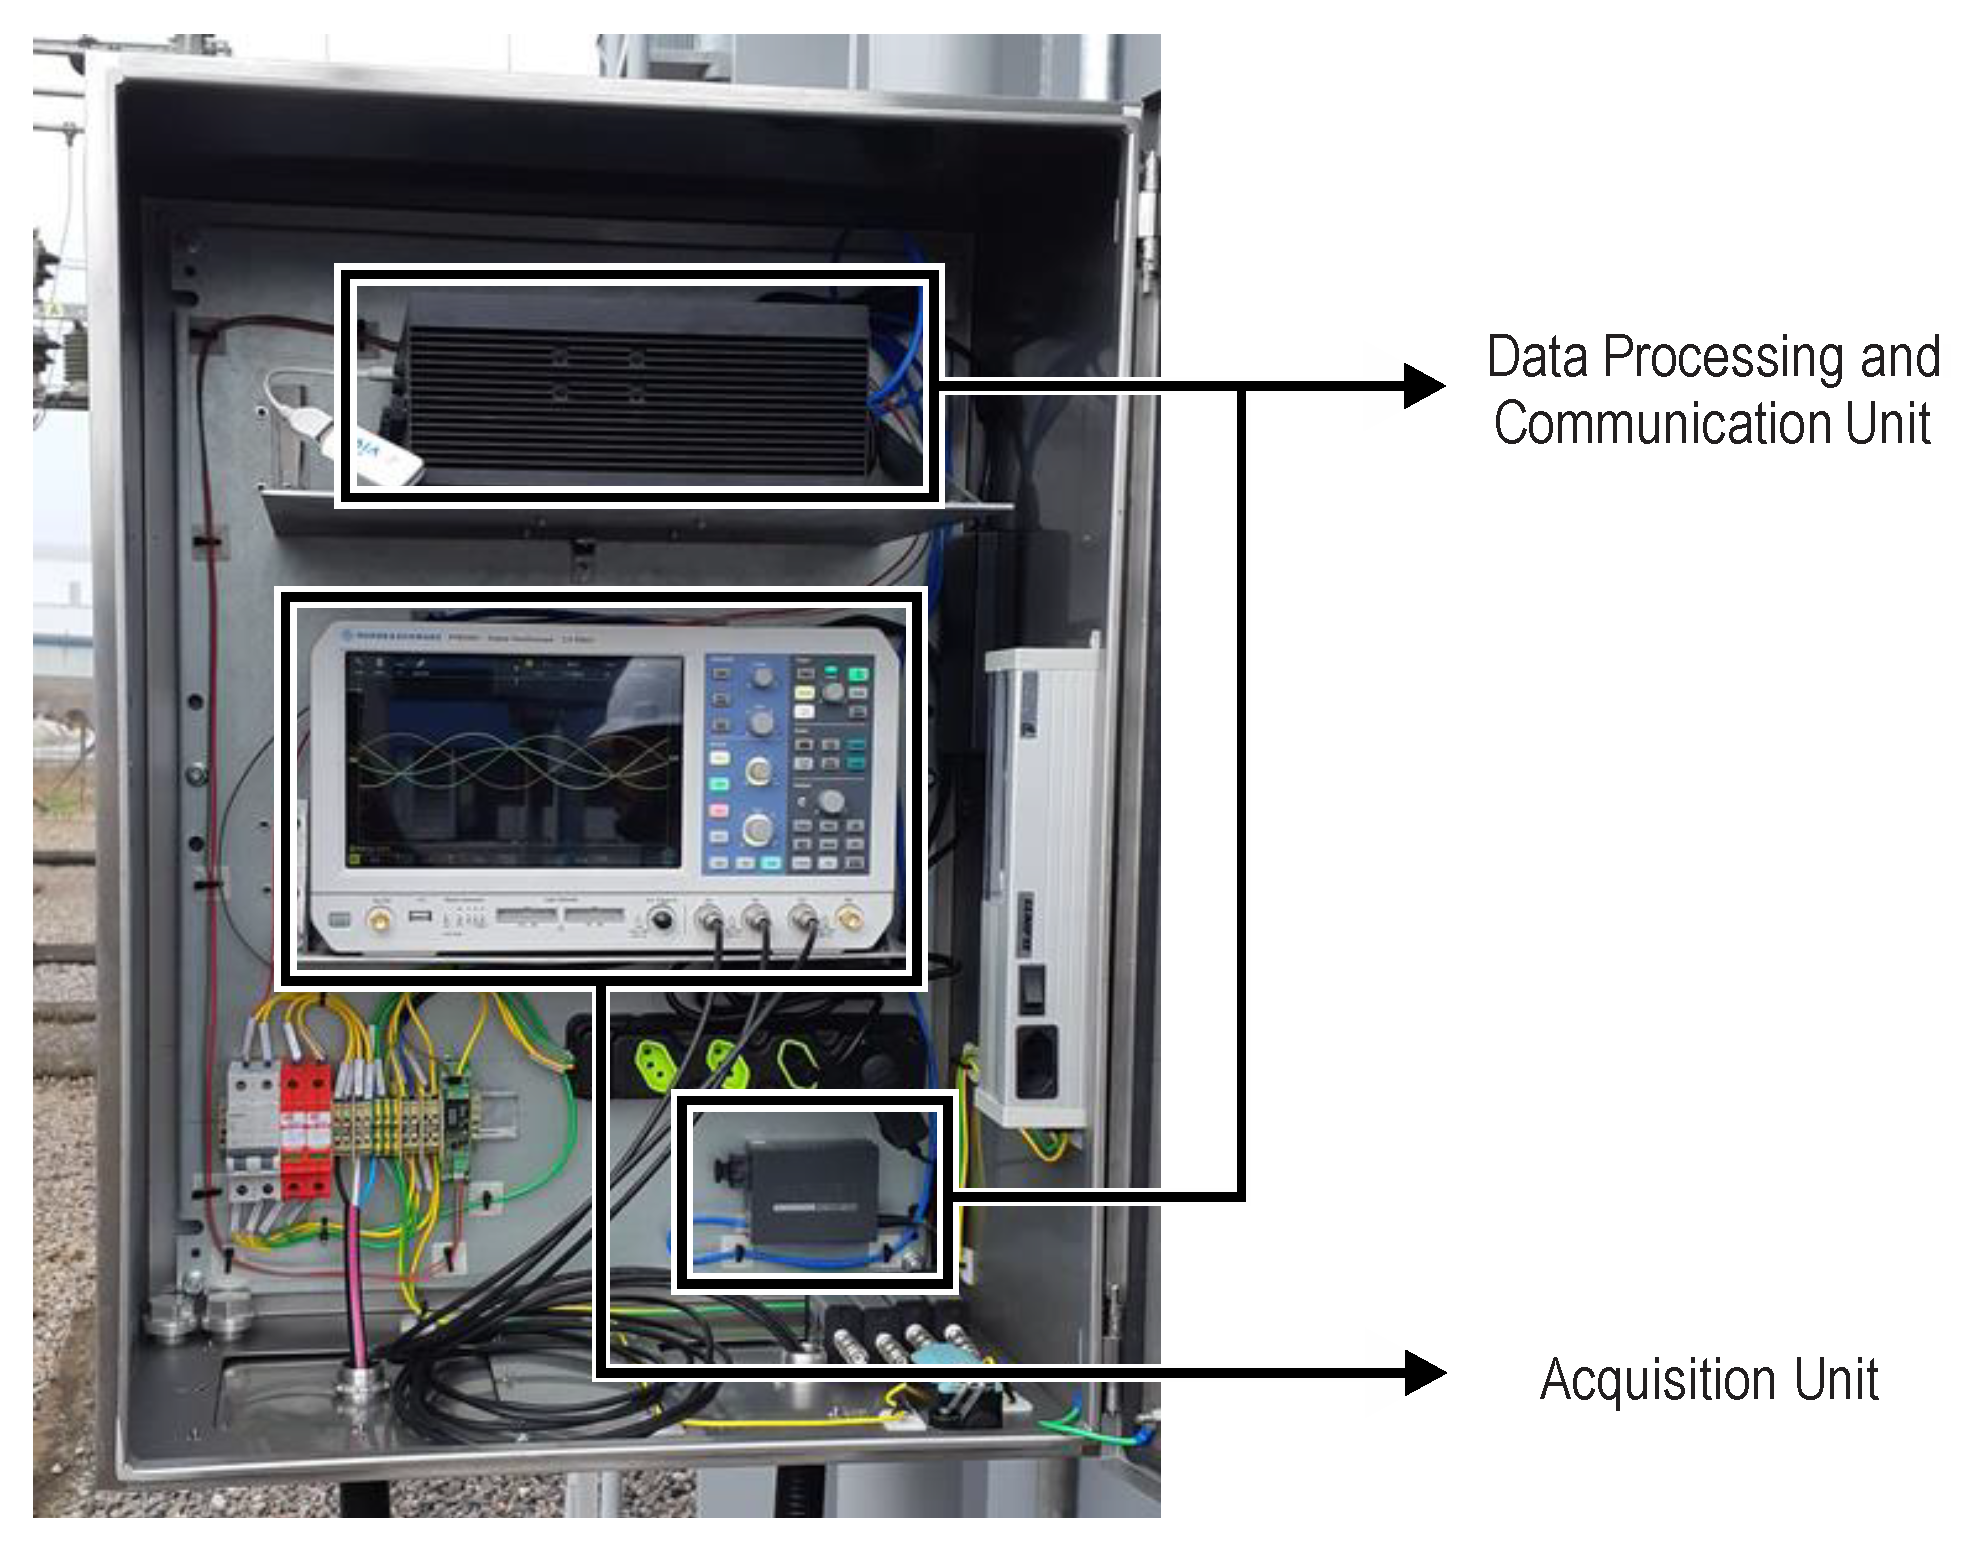
In terms of hardware, an online monitoring system can be integrated by three units, as shown in Figure 3. The coupling unit, composed only of the coupling device, connects to the test tap of the HV bushings. The acquisition unit receives the signal acquired from the bushings to perform an A/D conversion and send the digitalized signal to the data processing and communication unit for calculating the PDs, sending information to the utility’s control center. It is noteworthy that, in this work, these last two units are allocated within a cabinet that is fixed to the transformer tank at the substations.

2.3.1. Coupling Unit

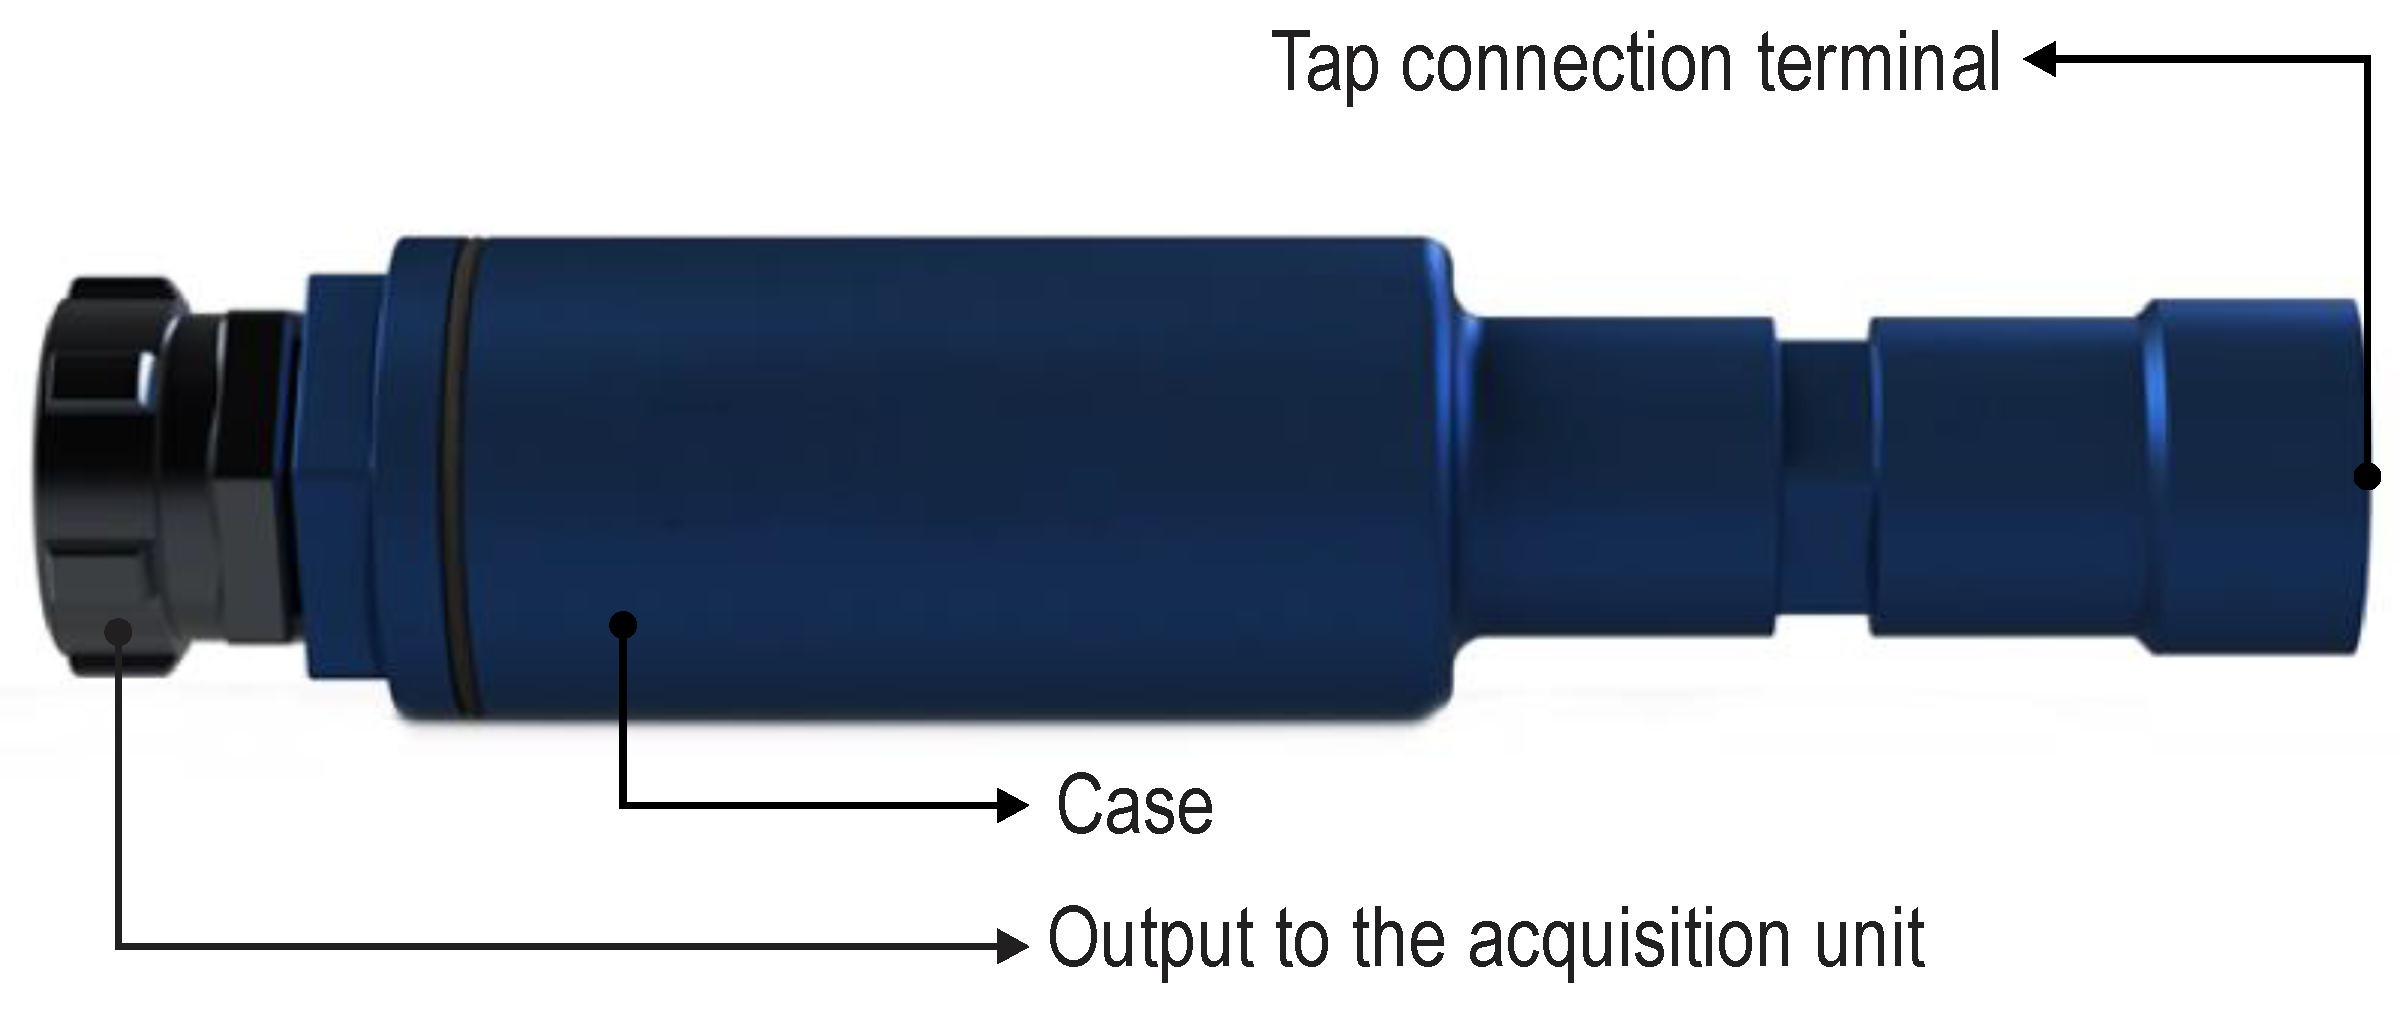
In order to detect partial discharges, a coupling device (depicted in Figure 4) was developed to: (i) form a voltage divider with the internal capacitance C 2 of the bushing; (ii) ensure electrical protection against overvoltage from the capacitive tap; and (iii) shield the signal conditioned against external interferences.
The mechanical design of this device was developed to allow direct coupling to the tap of ABB-type GOB bushings and ensure minimal maintenance and proper operating conditions when exposed to the environment. In order to meet these requirements, important points related to vibration, operating temperature, and protection against moisture must be taken into account.
Vibration is an unavoidable problem because the coupling device connects directly to the tap terminal of the bushing. This situation may cause disturbances in the signal acquisition. However, once this device is grounded with the same ground potential as the transformer, this problem can be overcome.
Addressing the operating temperature demanded for field application, it is essential that the device in question be able to operate properly at high levels. Therefore, an important task of this work was to select internal and external components that support continuous operation up to at least 50 °C.
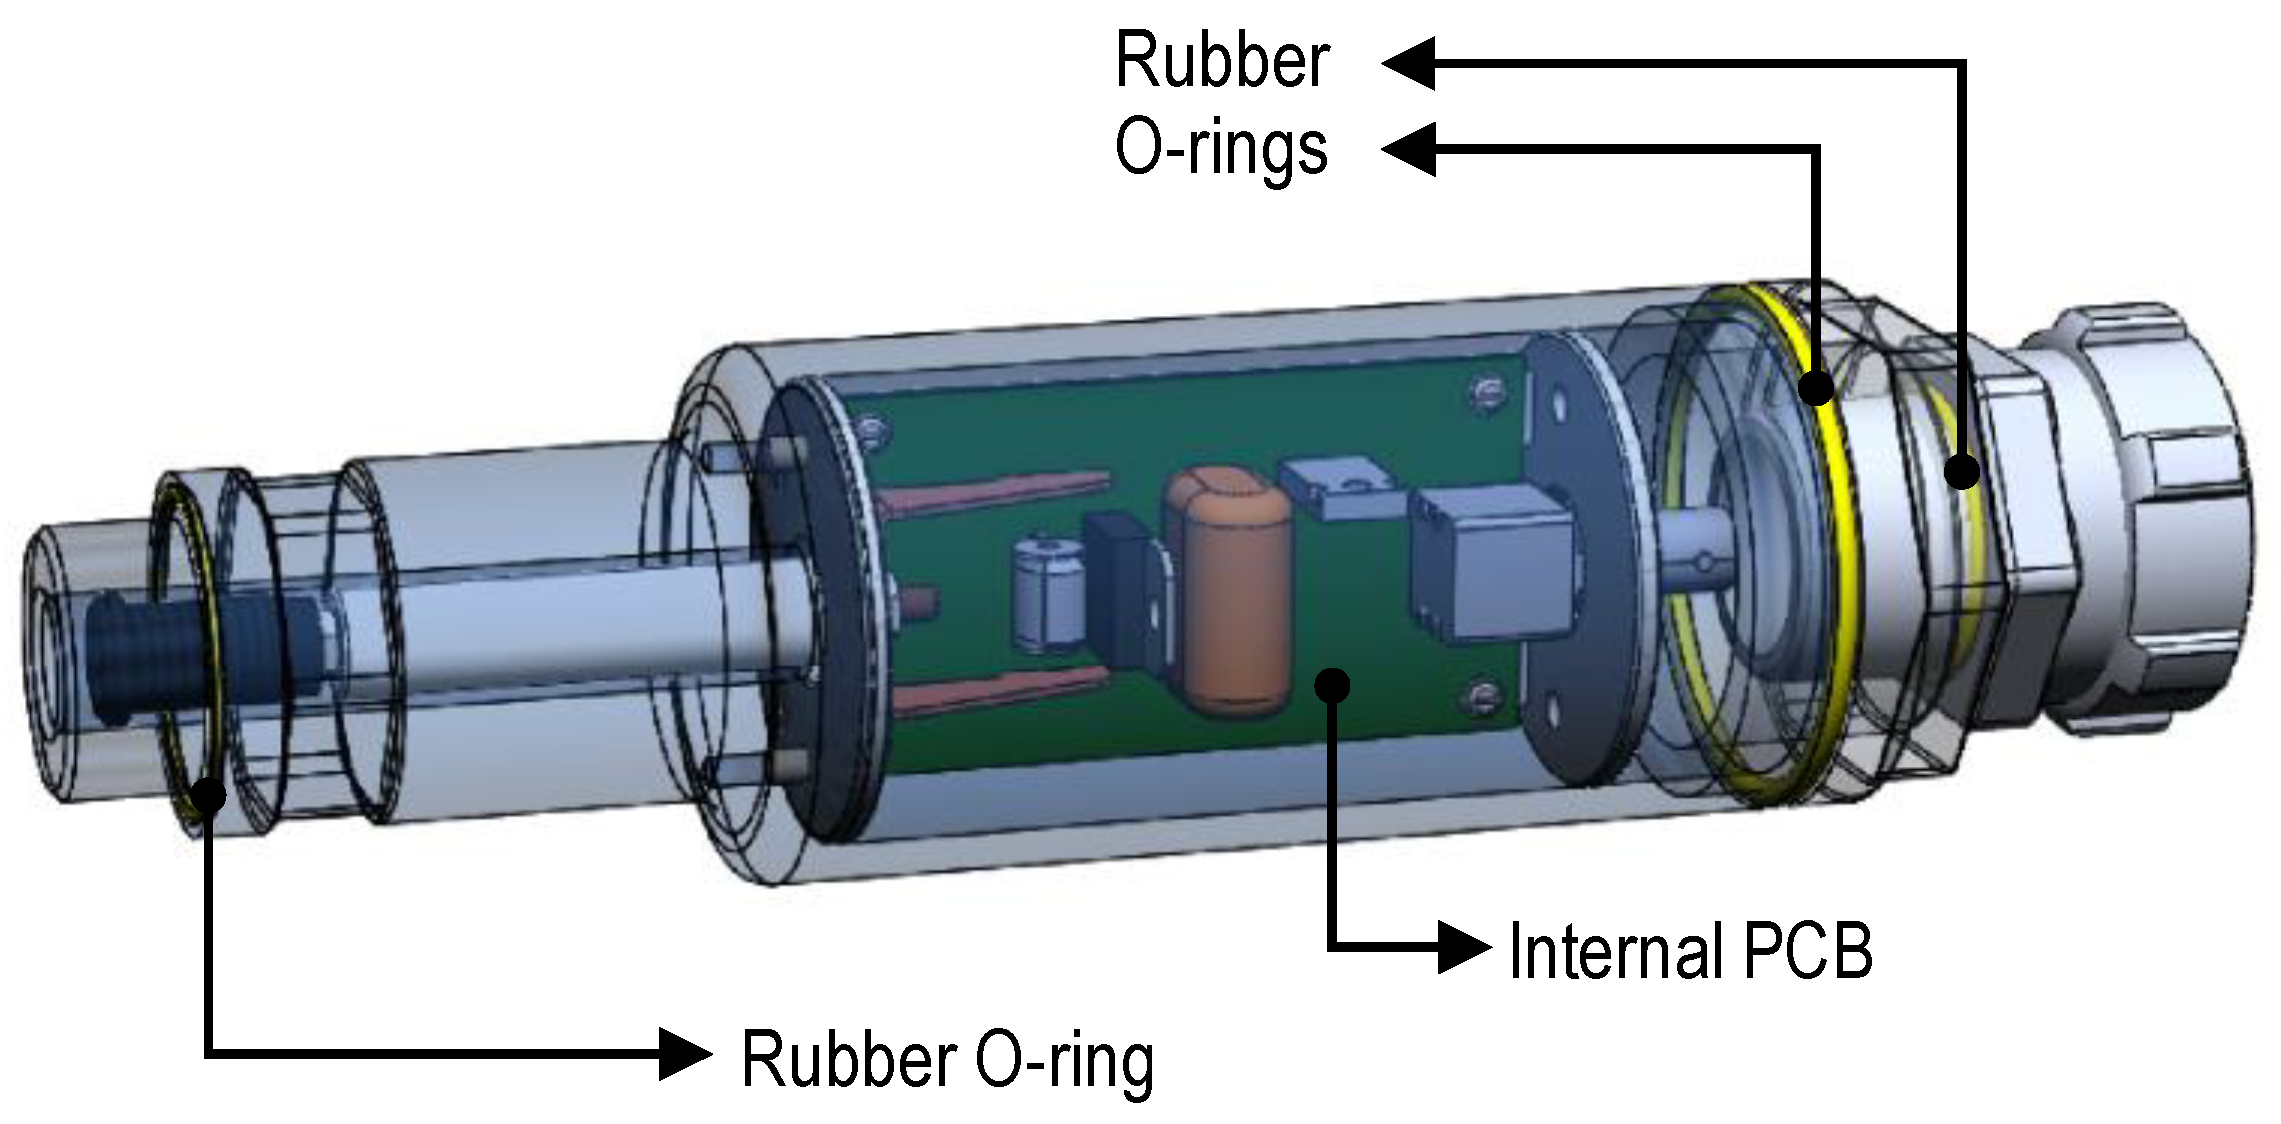
It should be noted that moisture can cause degradation of the bushing’s insulating layers during tap connection [27,28,29]. For this reason, all joints of the coupling device were completely sealed with rubber O-rings, as shown in Figure 5. This constructive aspect was essential to certify this equipment with IP-67 protection degree.
Internally, the coupling device had an internal circuit implemented in a printed circuit board (PCB), as seen in Figure 5, where the test tap signal was collected and transferred to the acquisition unit. This circuit, which is depicted in Figure 6, was composed of C k and protection systems classified as primary and secondary that were designed to trip coordinately in case of surges. The protection system was integrated by a Gas Discharge Tube (GDT) and different models of protection thyristors (Th1, Th2, and Th3), and it was designed to guarantee the integrity of the monitoring system and the monitored asset in two specific situations:
  • Lightning or switching surge without damage to C k : in this case, the protection devices must trip to prevent the overvoltage from reaching the acquisition unit and damaging it.
  • Lightning or switching surge with damage to C k : if there is a C k burnout, the test tap of bushing would lose connection to the grounding system. This situation would generate a high voltage gradient at the tap, which, in turn could cause an explosion and permanently damage the asset. Hence, to prevent this scenario, the GDT or thyristor Th3 must trip.
As a design requirement, it was considered that for a nominal operation of the transformer bushing (138 kV phase-to-phase or 79.7 kV phase-to-ground), C k must establish a voltage divider with the internal capacitance of the bushing to ensure a voltage level of 7 V (phase-to-ground) at the input of the acquisition unit. This implies a scale factor of approximately 11,400:1. Thus, considering the internal capacitance values of the bushing, C k was specified with 3.3 µF.
The primary protection of the coupling device was composed of thyristors Th1 and Th2. The former was specified to support less severe surges with a Maximum Repetitive Peak Off-State Voltage ( V D R M ) of 15 V. The latter was selected to trip as a backup protection for the thyristor Th1 with a V D R M equal to 30 V. It should also be highlighted that Th1 and Th2 had Peak Pulse Current ( I P P ) ratings of 400 A and 2.5 kA, respectively.
The secondary protection, composed of the thyristor Th3 and the GDT, was designed to prevent the coupling capacitor from burnout, which is possible at an overvoltage above 250 V. Thus, Th3 was specified with a V D R M of 140 V and an I P P of 5 kA. In turn, the GDT, which works as a backup protection device for Th1, was specified with V D R M and I P P nominal values of 250 V and 40 kA, respectively.
Table 1 summarizes the V D R M and I P P values of the protection devices used on the internal PCB of the coupling device. It should be pointed out that, to provide greater reliability to the project, both primary and secondary protection devices from different manufacturers were used. Additionally, it is important to mention that the PCB protection was designed with protection thyristors because they have a fast response against surges and, when damaged, go into a permanent short circuit state. In turn, the GDT was employed due to the possibility of higher V D R M and I P P values.
Continuing the analysis of the circuit shown in the Figure 6, resistor R 1 was used for the purpose of limiting the output current of the coupling device, which flows to the acquisition unit.
A fundamental point of the project is to ensure that the coupling circuit does not cause attenuation of the signal captured from the bushing. Thus, considering the equivalent capacitances of the protection devices and of the cable that connects the coupling device to the acquisition unit as, specified in the datasheet and shown in Table 2, the equivalent circuit depicted in Figure 7 can be constructed to analyze the AC transfer characteristics of the project. It should be highlighted that the cable connected to the acquisition unit in Figure 7 had a length of 5 m and an equivalent resistance of 1.6 mΩ/m.
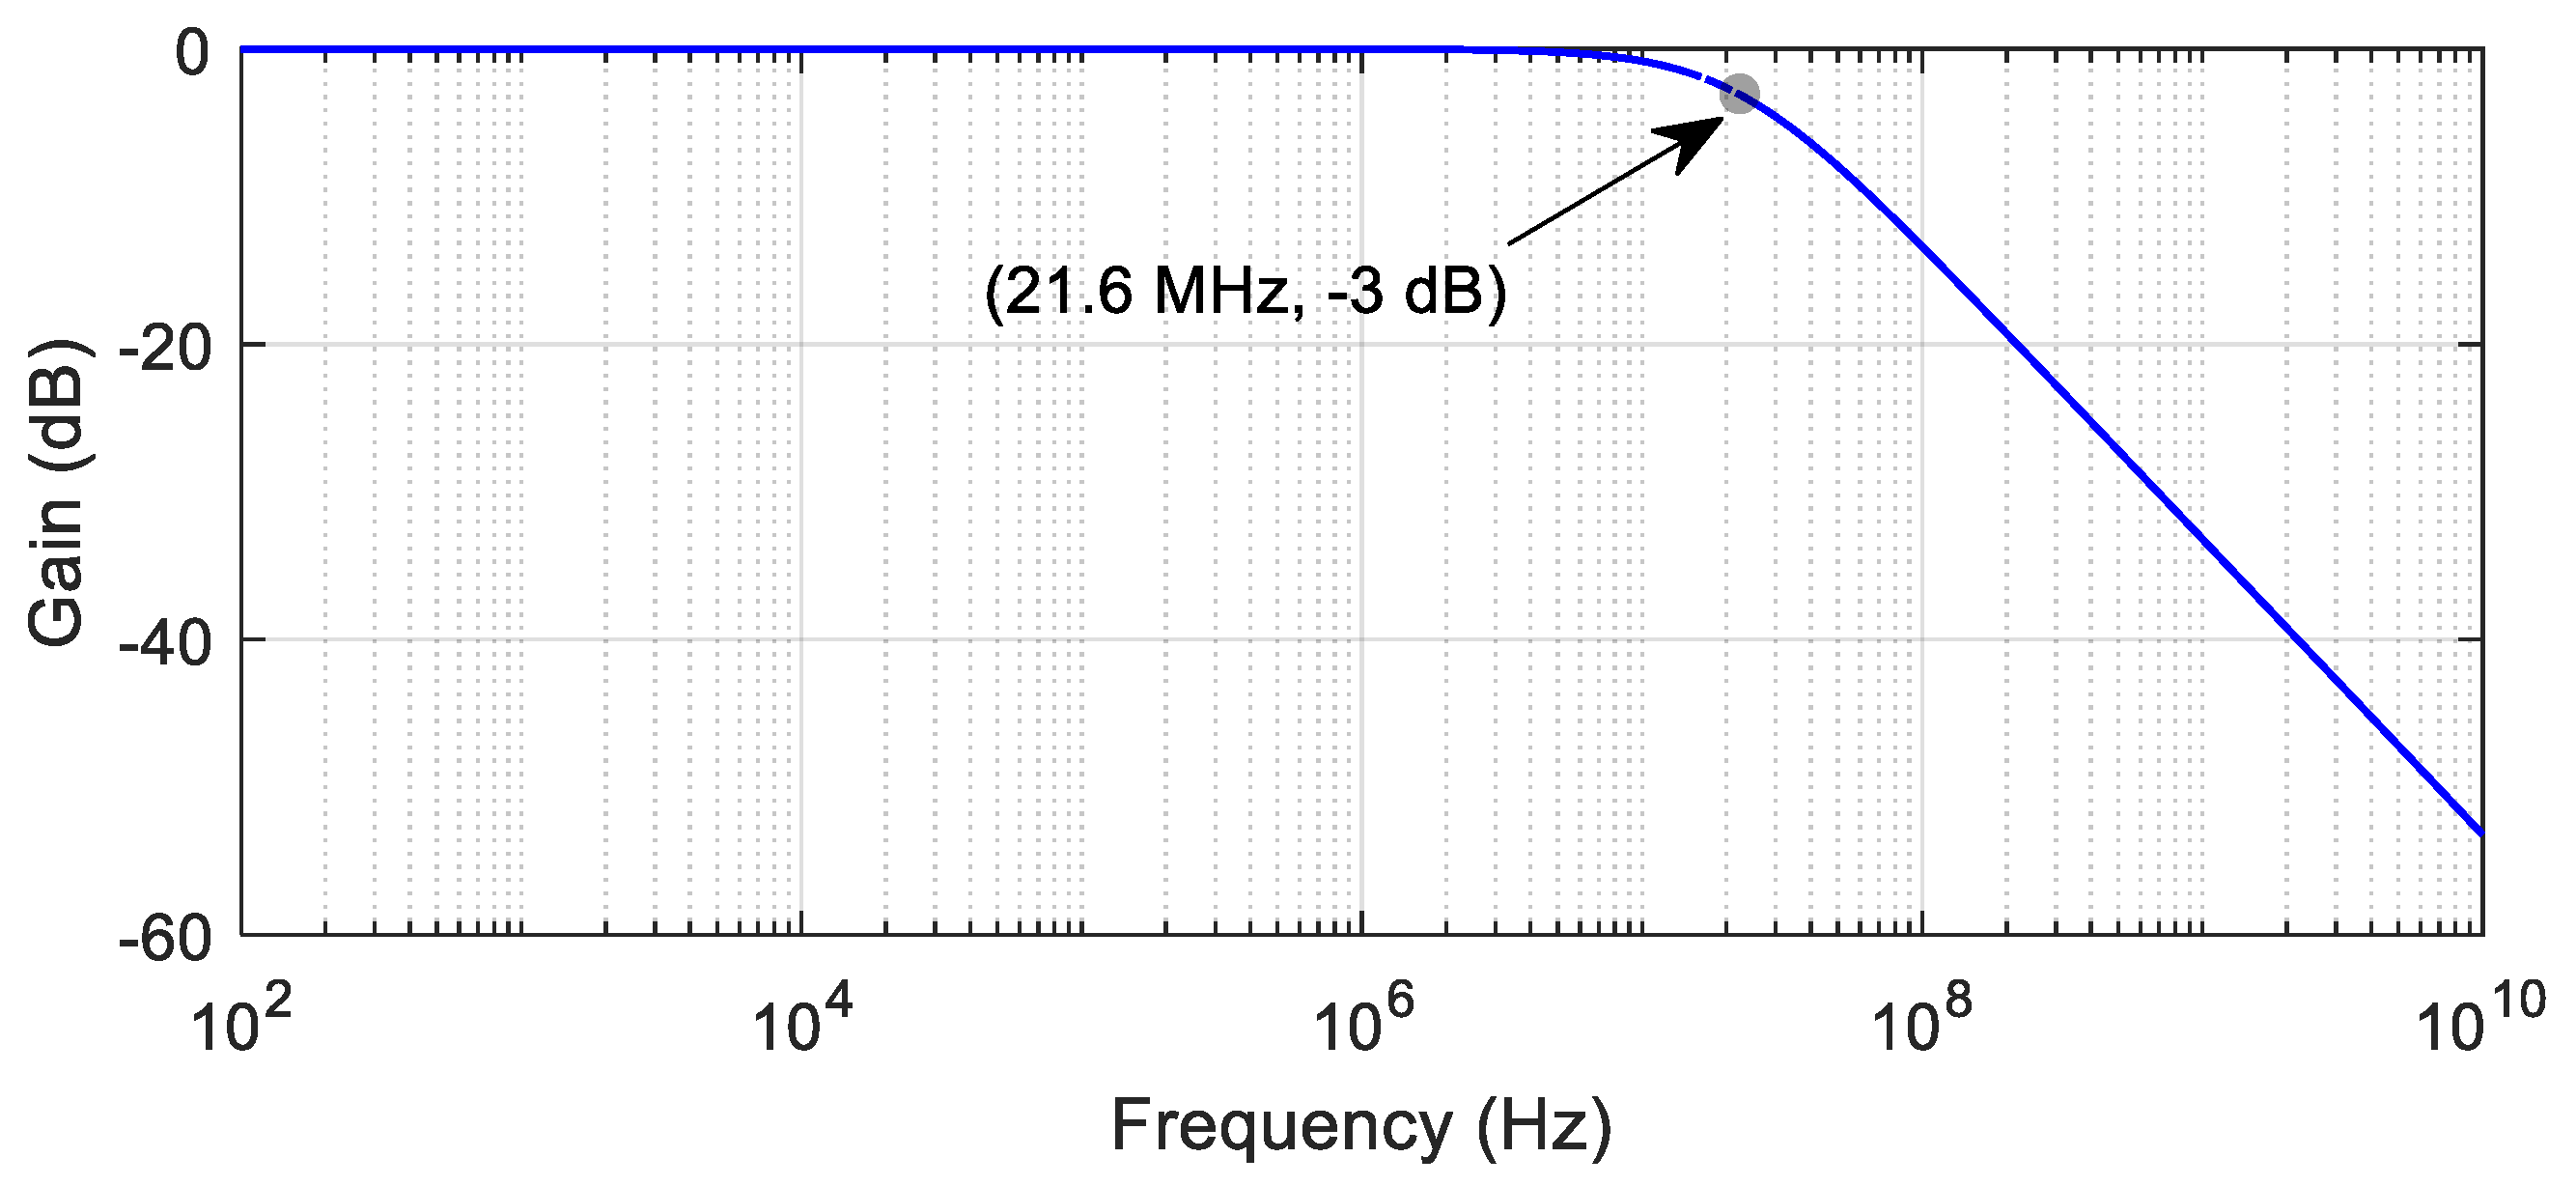
Considering the circuit in Figure 7, a Bode diagram of the coupling device output in shown in Figure 8.
As shown in Figure 8, the frequency of −3 dB, from which significant attenuation of a signal can be noted, occurs at 21.6 MHz, which is higher than the frequencies expected for the electrical detection of partial discharges. Hence, it can be observed that the coupling device design ensured the non-attenuation of the signal acquired from the tap.
It should be observed in Figure 7 that the circuit termination does not have an impedance of 50 Ω to form a match with the characteristic impedance of the cable. An impedance matching at the circuit termination would certainly increase the bandwidth of the measurement and would not impact the signal acquired by possible wave reflections. However, the impedance seen at a low frequency (60 Hz) would be reduced abruptly so that it would not be possible to locate the formation of PDs within a sinusoidal signal, nor would it be possible to read the RMS value on the test tap. In this sense, it would be impossible to infer whether there is a loss of primary capacitance of the bushing and a failure evolution with a consequent increase in the leakage current amplitude. Therefore, as it is important to analyze the dielectric conditions of the condenser bushing and this will be used for future investigations, in this work there was no implementation of an impedance matching at the termination of the circuit.

2.3.2. Acquisition Unit

The acquisition unit is a fundamental part of a monitoring system, since through it the data captured from the bushings must undergo an efficient A/D conversion to avoid degradation of the signal and, consequently, a loss of information. This aspect is especially relevant for detecting partial discharges that occur in extremely short time intervals at high-frequency ranges [5].
The acquisition system used in this work is composed of a high-performance oscilloscope that works with simultaneous readings in three channels (one for each coupling device connected to the HV bushing) whose specifications largely satisfy key technical requirements.
For example, regarding the sampling frequency ( f s ), the acquisition system works with 2.5 GS/s, which corresponds to a sampling period ( T s ) of 0.4 ns, a sufficient value to detect the expected peaks of a PD.
Another important feature is the 10-bit vertical resolution of the A/D conversion. This results in a sharper digital waveform (i.e., with more detail). Thus, given that PDs have a relatively low amplitude when the signal is collected from the bushing, this value of vertical resolution provides an efficient identification of the peak discharges. This characteristic is useful for the calculation of the apparent charges, as described in Section 2.4.
It is also worth noting that the acquisition system has a broadband reading of up to 200 MHz. Thus, given that PDs are present in a high-frequency range, this bandwidth is clearly sufficient for detecting their pulses.
Since the acquisition system is housed in a cabinet exposed to environmental conditions in a substation, the maximum operating temperature of the oscilloscope, specified from 0 to 50 °C, makes its application in the development of this work favorable.
The technical specifications of the acquisition unit used are summarized in Table 3.

2.3.3. Data Processing and Communication Unit

The data processing and communication unit consists of a software (see Section 2.4) installed on an industrial computer from which data are sent to the operation center through a communication network.
Regarding communication, it was carried out using the protocol DNP 3.0 so that the data could be integrated into the utility’s Supervisory Control and Data Acquisition (SCADA). As a physical interface, the RJ-45 output of the computer was used. Then, an RJ-45 to Fiber Optic converter was employed to send the data to the switch present in the substation. This switch is connected to the intranet, and, from it, the field measurements can be monitored at the power system operation center, as shown in Figure 9.

2.4. Data Processing and Calculation of Partial Discharges

The data processing and calculation of partial discharges detected from the test tap of bushings is performed by a proprietary software. This software, which is developed in the Python programming language and calibrated according to IEC 60270 [8], is responsible for receiving the signal sampled at the acquisition unit, calculating the partial discharges and sending the data to the power system control center.

2.4.1. Methodology

Before proceeding to the calculation of PDs, it should be noted that the voltage acquired from the acquisition unit represents the signal available on the tap during online monitoring, which is composed of different components, including the 60 Hz voltage of the power system and the noise present in the substation. These last two components are undesirable in the calculation of PDs and, therefore, must be eliminated through filtering.
In the proposed algorithm, a digital filtering routine was implemented. The filter to be applied, as well as its lower and upper cutoff frequencies, must be defined in loco according to the noise level present in the substation. It is noteworthy that, in this work, a 6th order band-pass Butterworth filter has been used.
Once filtering has been carried out, the resulting signal is composed only of partial discharges and some noise with frequencies close to those of the PDs. Thus, a routine responsible for differentiating noise and discharges through a trigger that consists of an amplitude value from which a noise does not exceed is applied in this methodology.
The advantage of this proposal is that, through the trigger, PDs can be identified by comparing their peaks with a pre-established value. For extremely noisy signals, this technique would possibly not be useful because the amplitude of the noise could be excessively high. However, for the applications of this work, this situation does not occur because the Butterworth filter applied previously guarantees the removal of a large part of the undesirable signal.
Hence, it is worth highlighting two main advantages of this methodology. The first refers to the fact that, as PD peaks are identified by comparison, there is no possibility of the measured signal to present attenuations or distortions. This situation, however, could not be fully guaranteed if, for example, a new band-pass filter with a very short bandwidth was used in cascade with the previous filter to eliminate the remaining noise. The second advantage is related to the low computational cost of the implemented routine. This is possible because the application of the trigger to detect PD peaks does not require analysis in the frequency domain or convolution operations. Therefore, all data processing is carried out more quickly. This aspect is especially important for online monitoring.
Mathematically, the trigger is obtained as follows:
γ = 1 N n = 1 N ( u n u ¯ ) 2 + α   u m a x ,
where γ is the trigger (V); u n is the n -th sample of the signal acquired from the bushing tap (V); u ¯ is average value of μ ; u m a x is the peak value of u ; N is the number of samples; and α is a constant determined experimentally. It is highlighted that, in this work, 230,000 samples were considered and α was equal to 0.075. Regarding this latter parameter, it could be greater for very noisy environments.
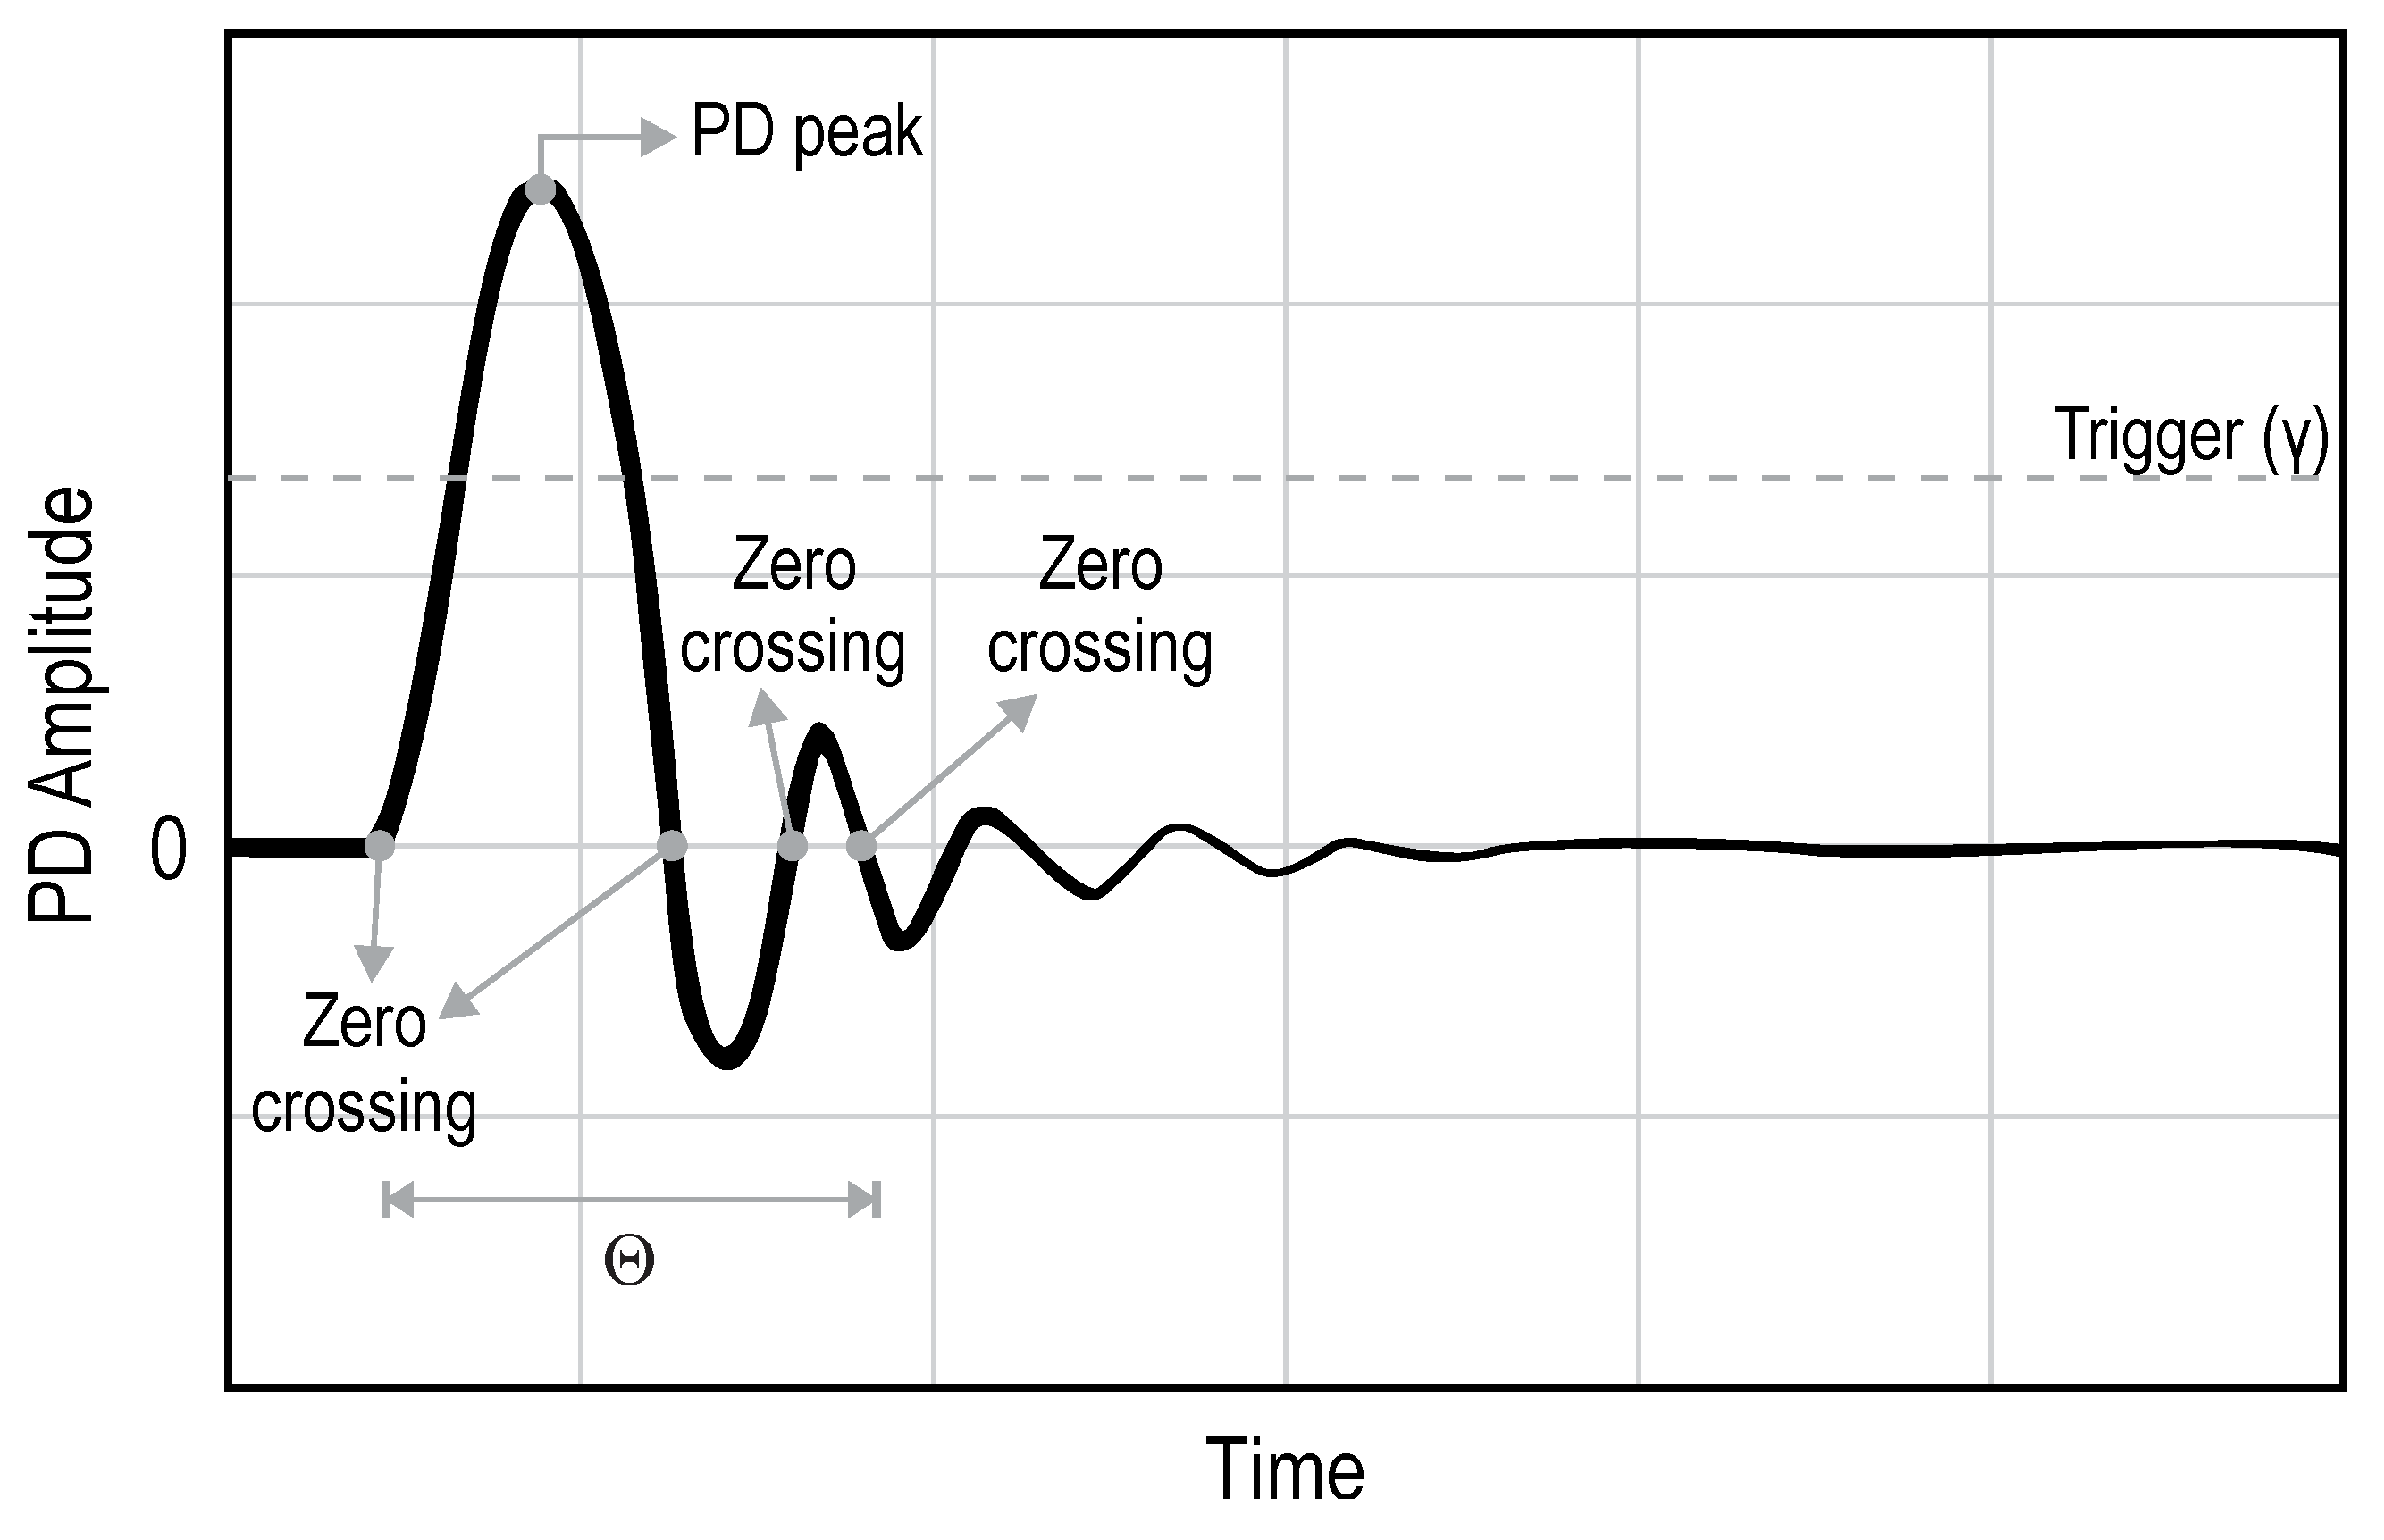
With the trigger value determined, the peaks of PDs are defined as the peak values between two zero crossing time, if greater than γ , as shown in the Figure 10.
From the identification of the peaks, the apparent charge of the PDs, in coulombs, is calculated by numerical integration, using the following equation:
q P D = K Θ 2 π f C k n = 1 N u n ,
where K is the gain related to the scale factor of the voltage divider established between C k and the internal capacitance of the bushing, f is the operating frequency of the monitored asset, and Θ is the time interval between the first zero crossing before the peak of PD and the third zero crossing after this peak, as shown in Figure 10.
The calculation of the partial discharges is carried out every 5 min and the software only starts the calculation if the oscillations are subsequently constituted, generating an area of energy dissipation. Considering the energy dissipation of the detected pulses is a fundamental requirement to avoid counting false positives as partial discharges. False positives can be observed due to several reasons, but the main occurrences are due to: (i) switching in the power system, such as opening or closing circuit breakers that normally produce electric arcs; and (ii) the presence of coaxial cables and the high impedance of the measurement system, which can generate multiple reflections for high-frequency signals.

2.4.2. Flowchart

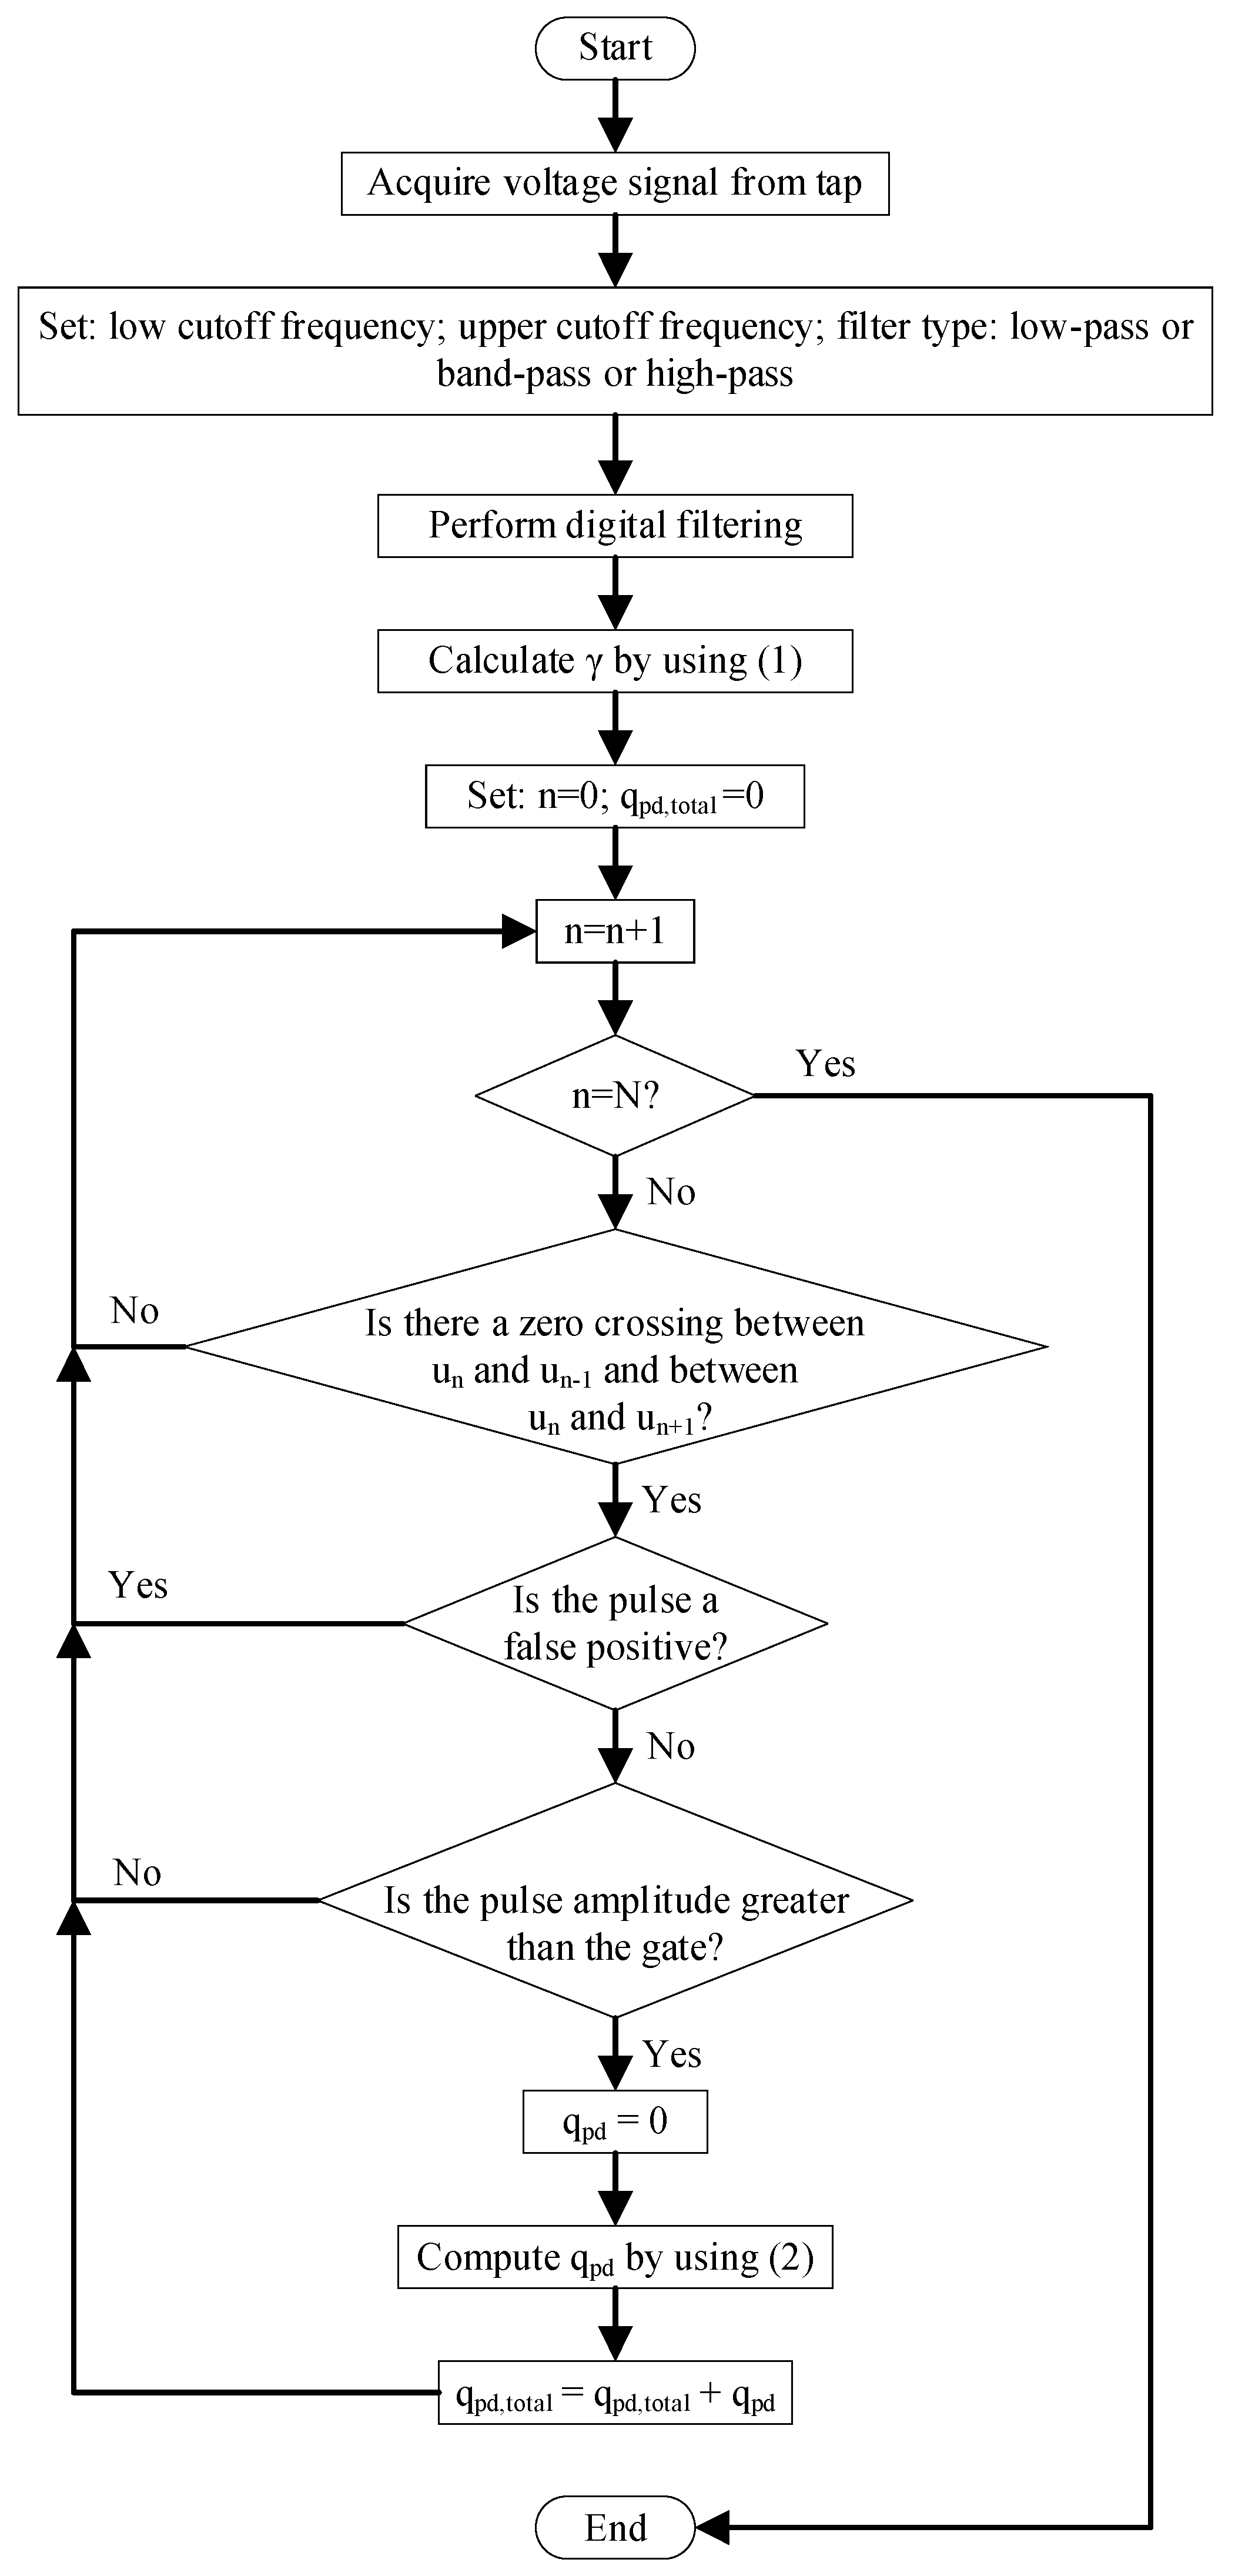
The overall computational procedure of the implemented methodology can be seen in the flowchart shown in Figure 11.

3. Results and Discussion

3.1. Laboratory Tests

Prior to field application of the monitoring system, a set of tests was performed to: (i) validate PD detection; (ii) assess whether inserting the coupling device would weaken the dielectric property of the bushing under high voltage stress; and (iii) check whether EM interference can impair the acquisition of signals collected from the test tap.
The structure used to perform the tests is shown in Figure 12.
In order to validate the sensing of high-frequency signals through the coupling device as well as the proposed methodology to identify the PD peaks, a partial discharge test was carried out in a laboratory. For this purpose, a current pulse generator was connected to the bushing’s terminal to simulate PDs in the insulation. As an example of the PD detection, a phase resolved partial discharge (PRPD) graph is shown in Figure 13 that was obtained during the test, from which it is possible to verify the capability of the developed equipment to detect narrow discharges.
In addition to the efficiency in detecting partial discharges, a fundamental issue for the application of an online monitoring system relates to its supportability to electrical stresses that can occur in the monitored asset. Thus, the applied voltage and lightning impulse tests were conducted in order to verify the reliability of the equipment in the face of 60 Hz overvoltage and electrical transients.
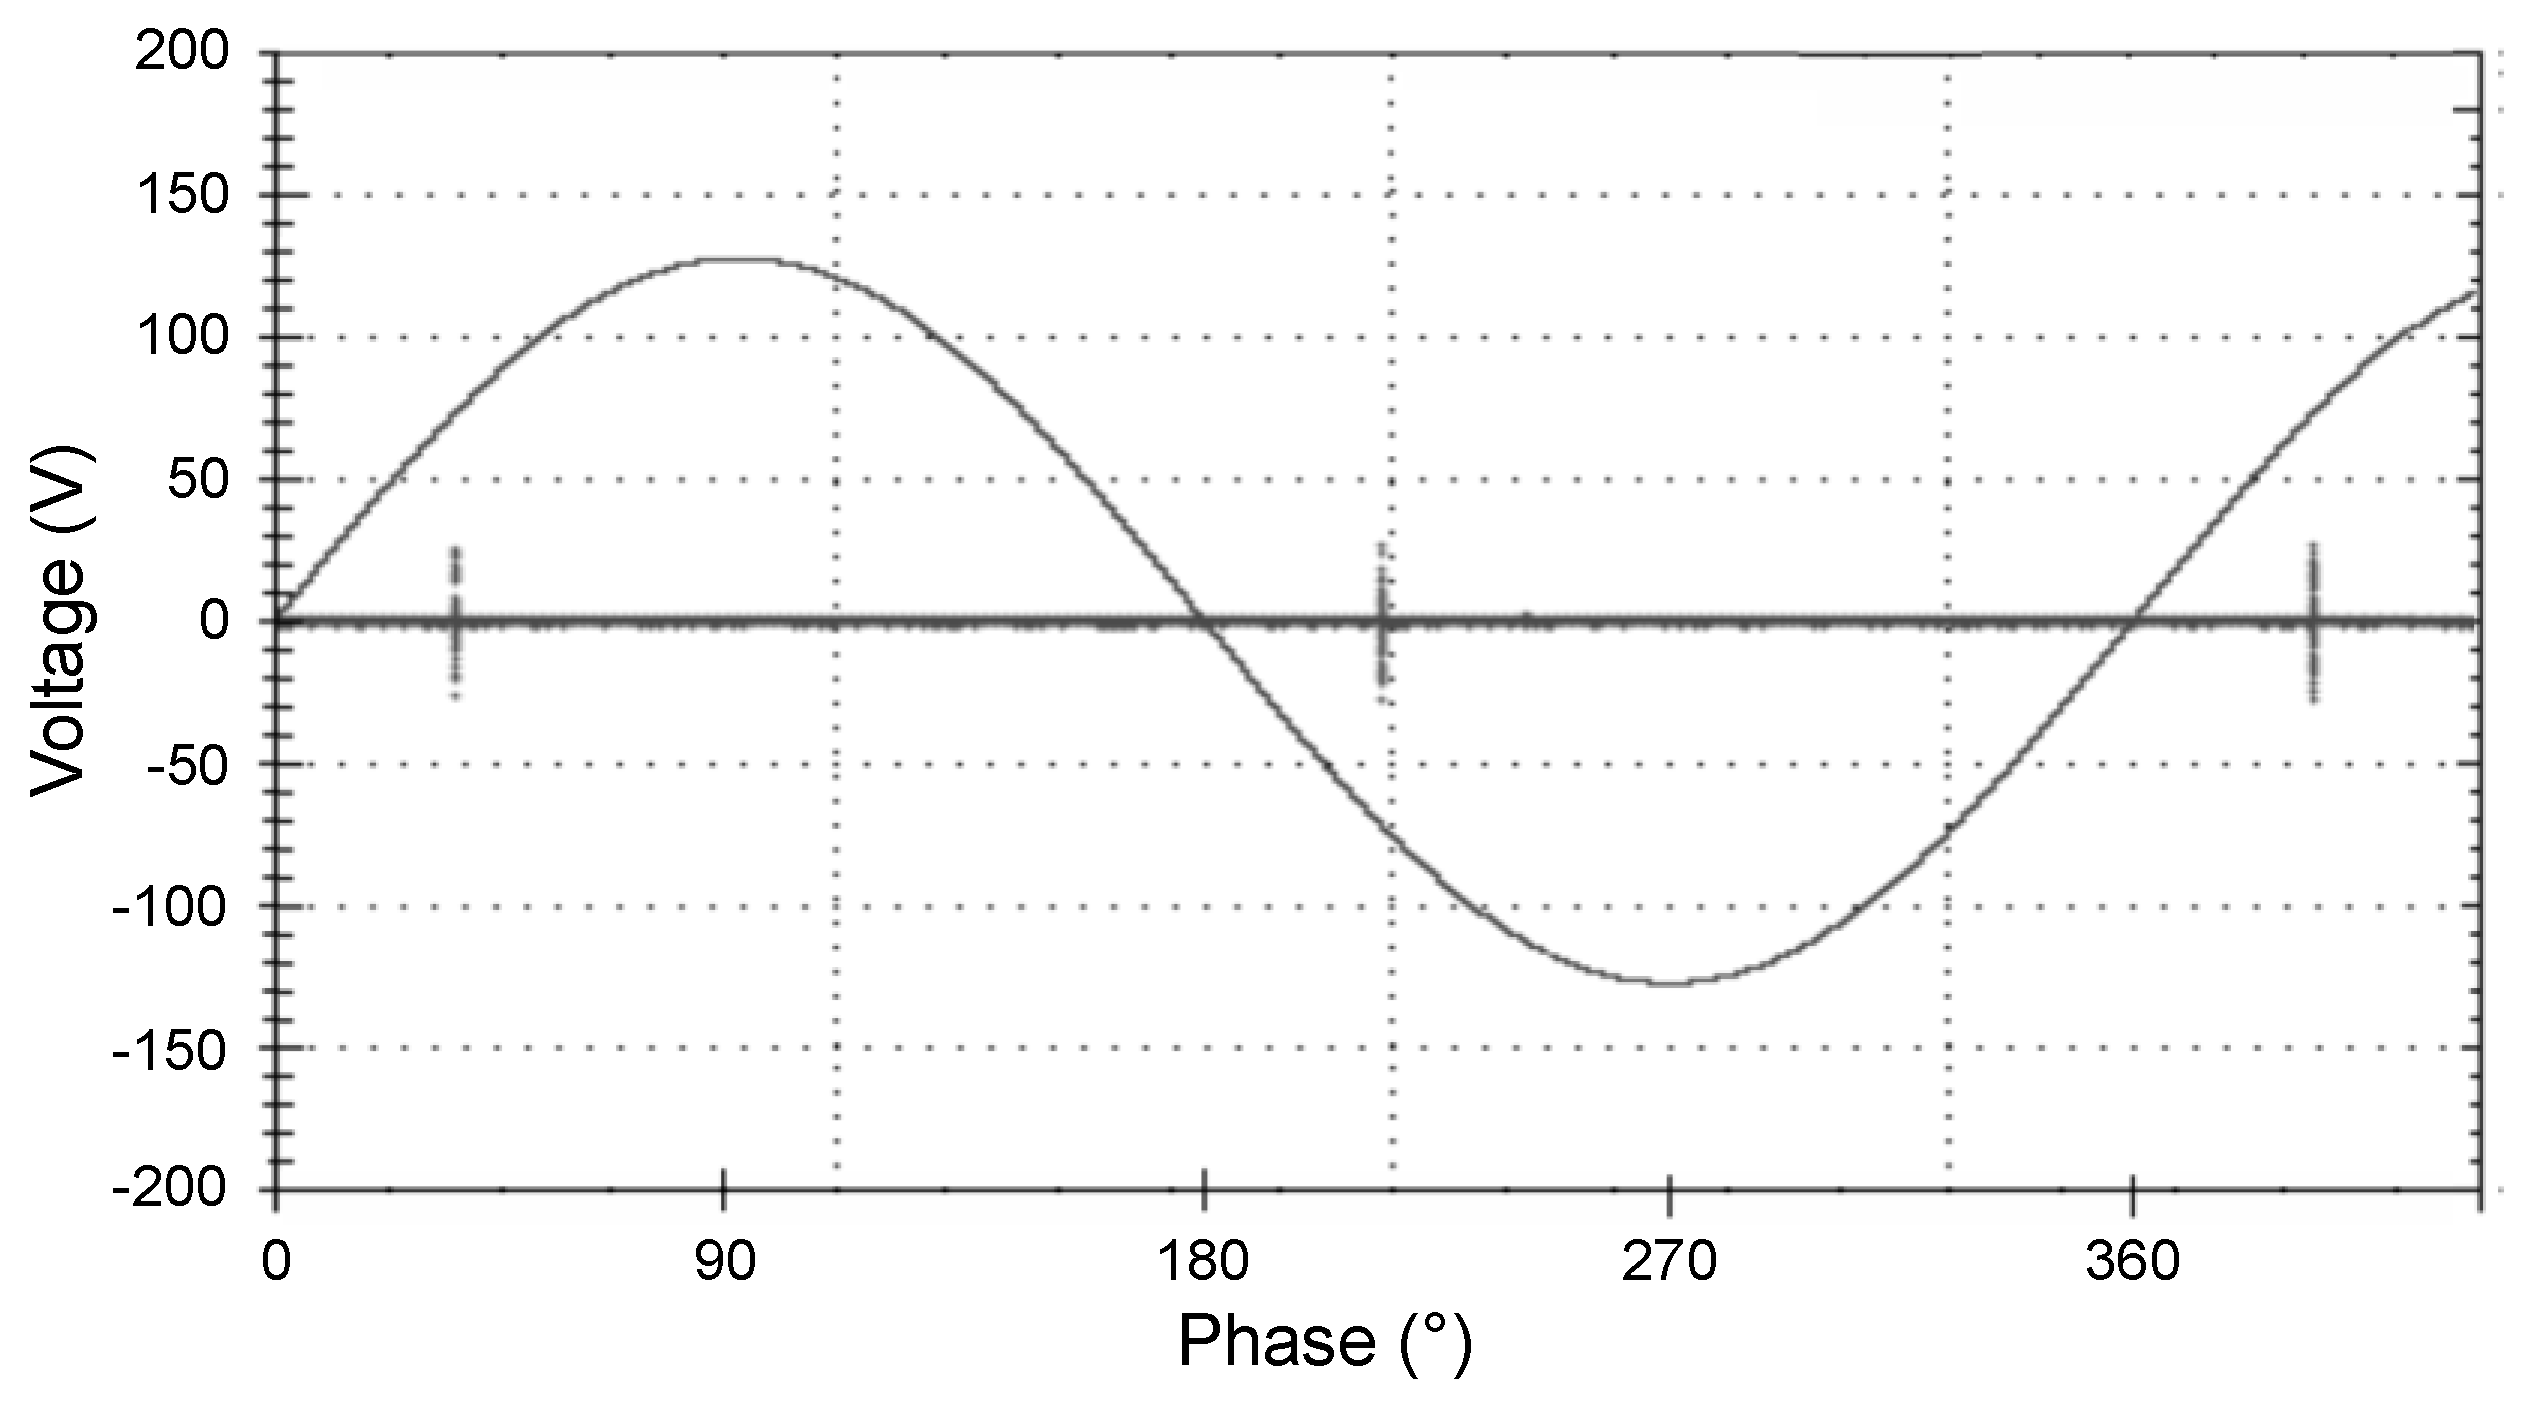
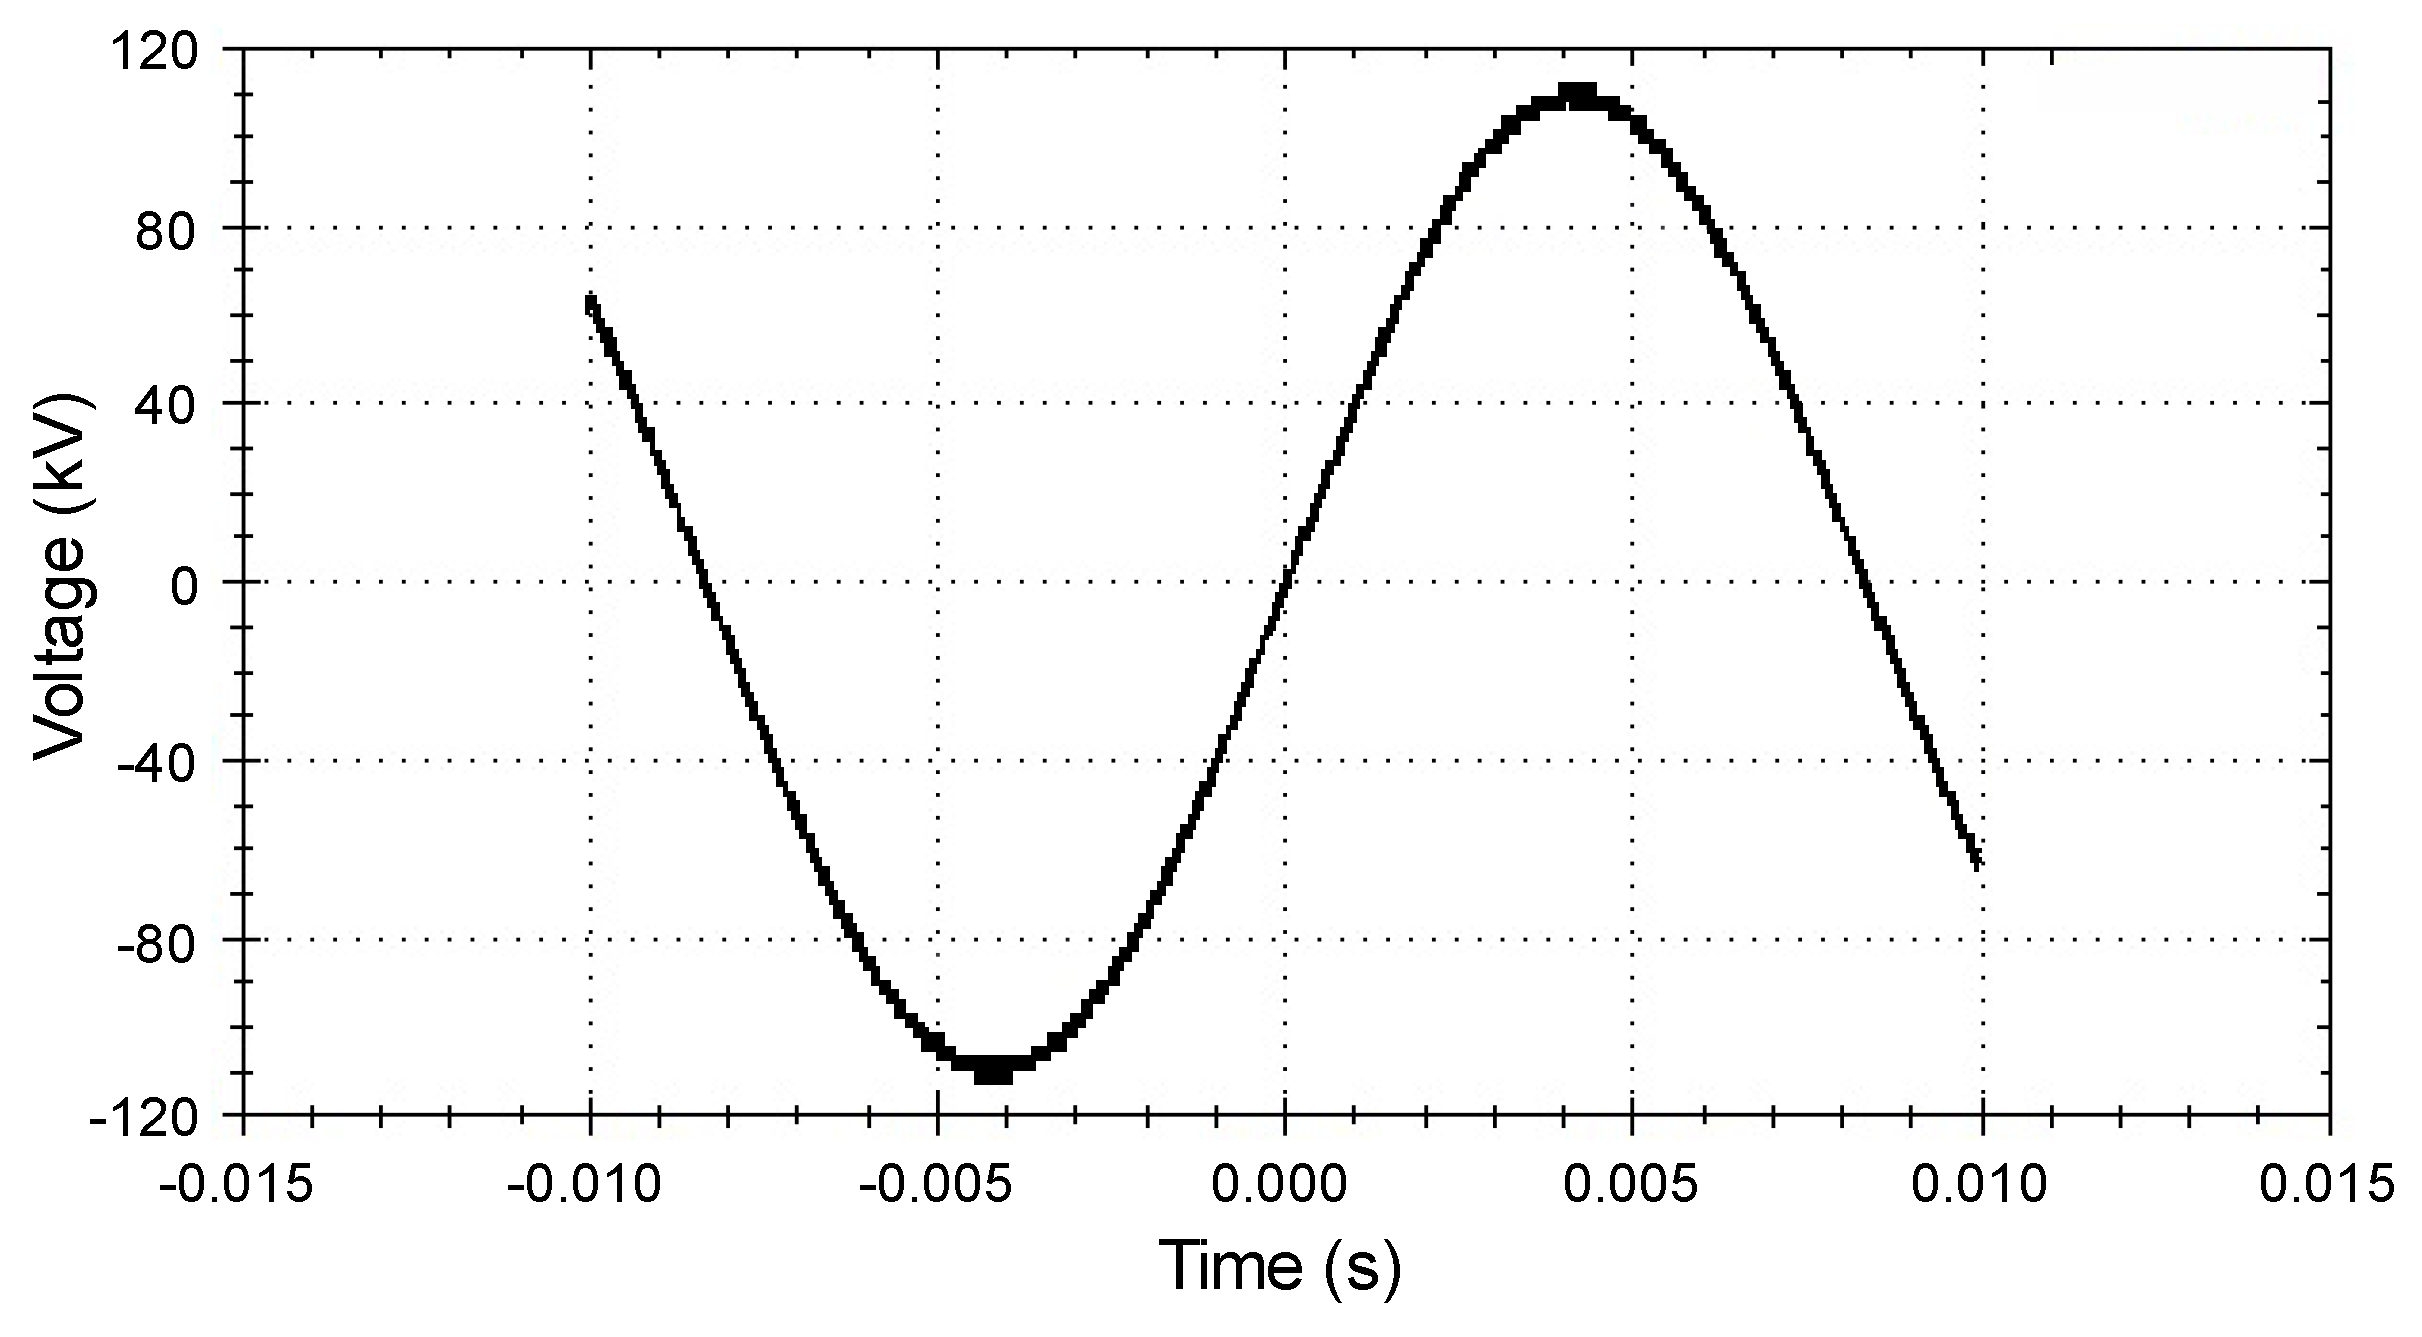
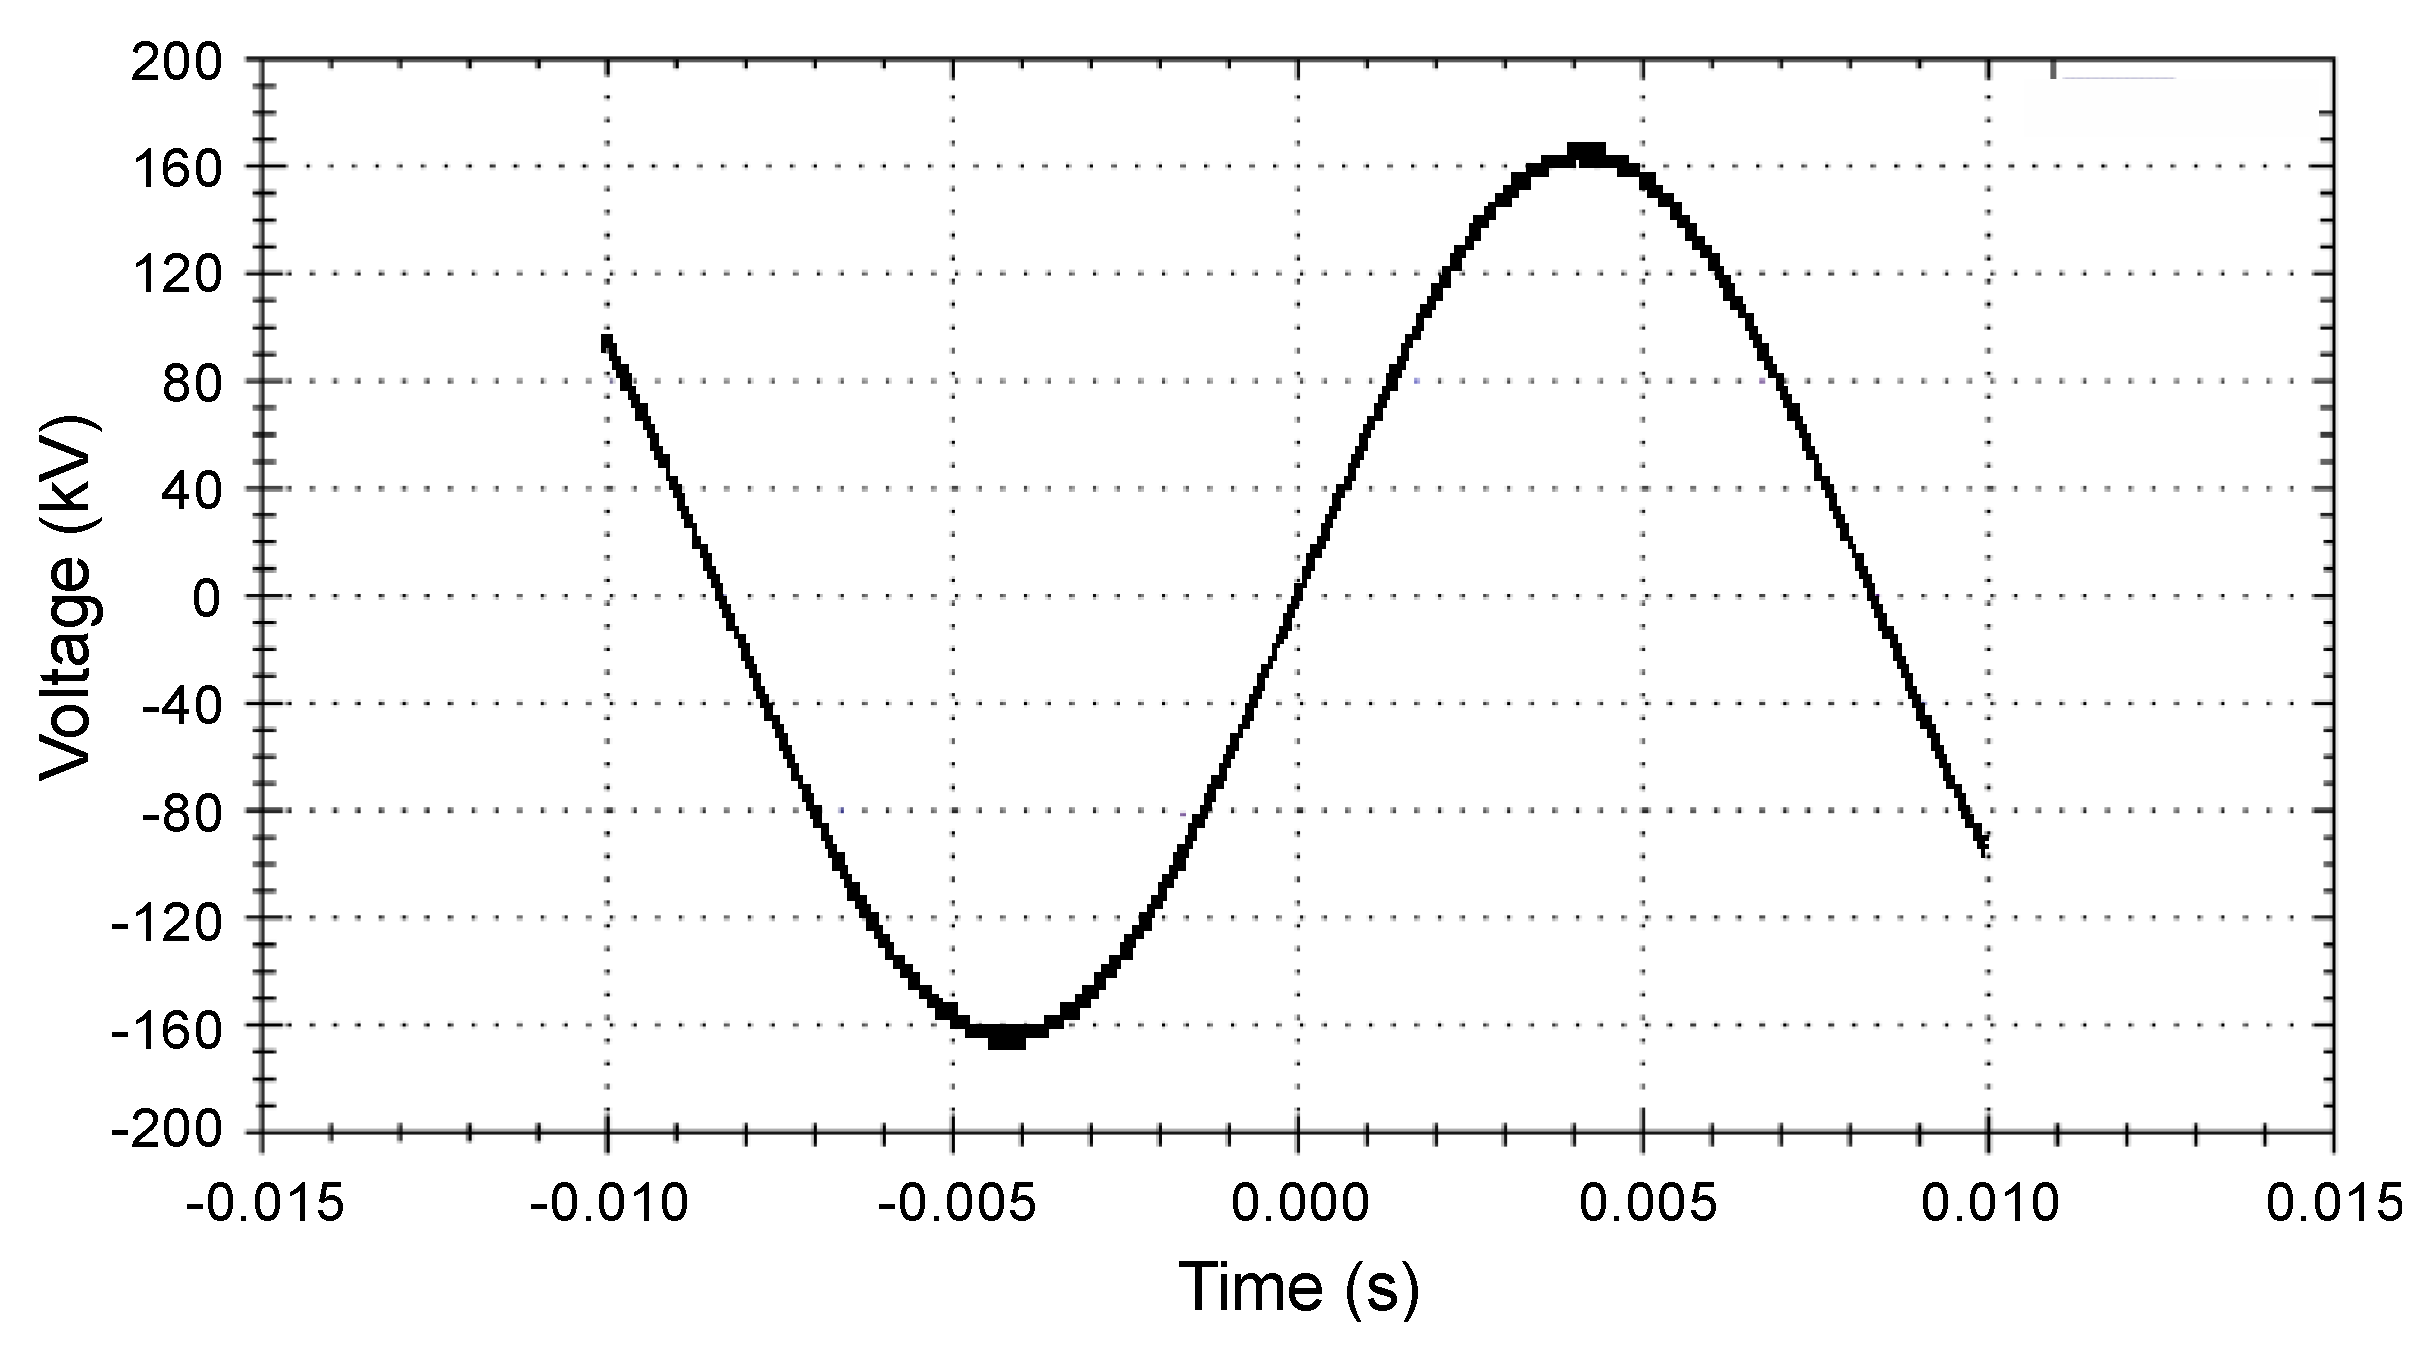
The applied voltage test was carried out on the bushing with the coupling device installed on the tap in two different cases: (i) with nominal phase-to-ground voltage of the bushing (i.e., 79.8 kV); and (ii) with an overvoltage of 50% of the phase-to-ground voltage (i.e., 119.5 kV). The results of this test are shown in Figure 14 and Figure 15. Therefore, as no disruptive discharges were observed on the voltage read, it can be pointed out that the developed coupling device did not damage the capacitive insulation of either the bushing or the acquisition unit.
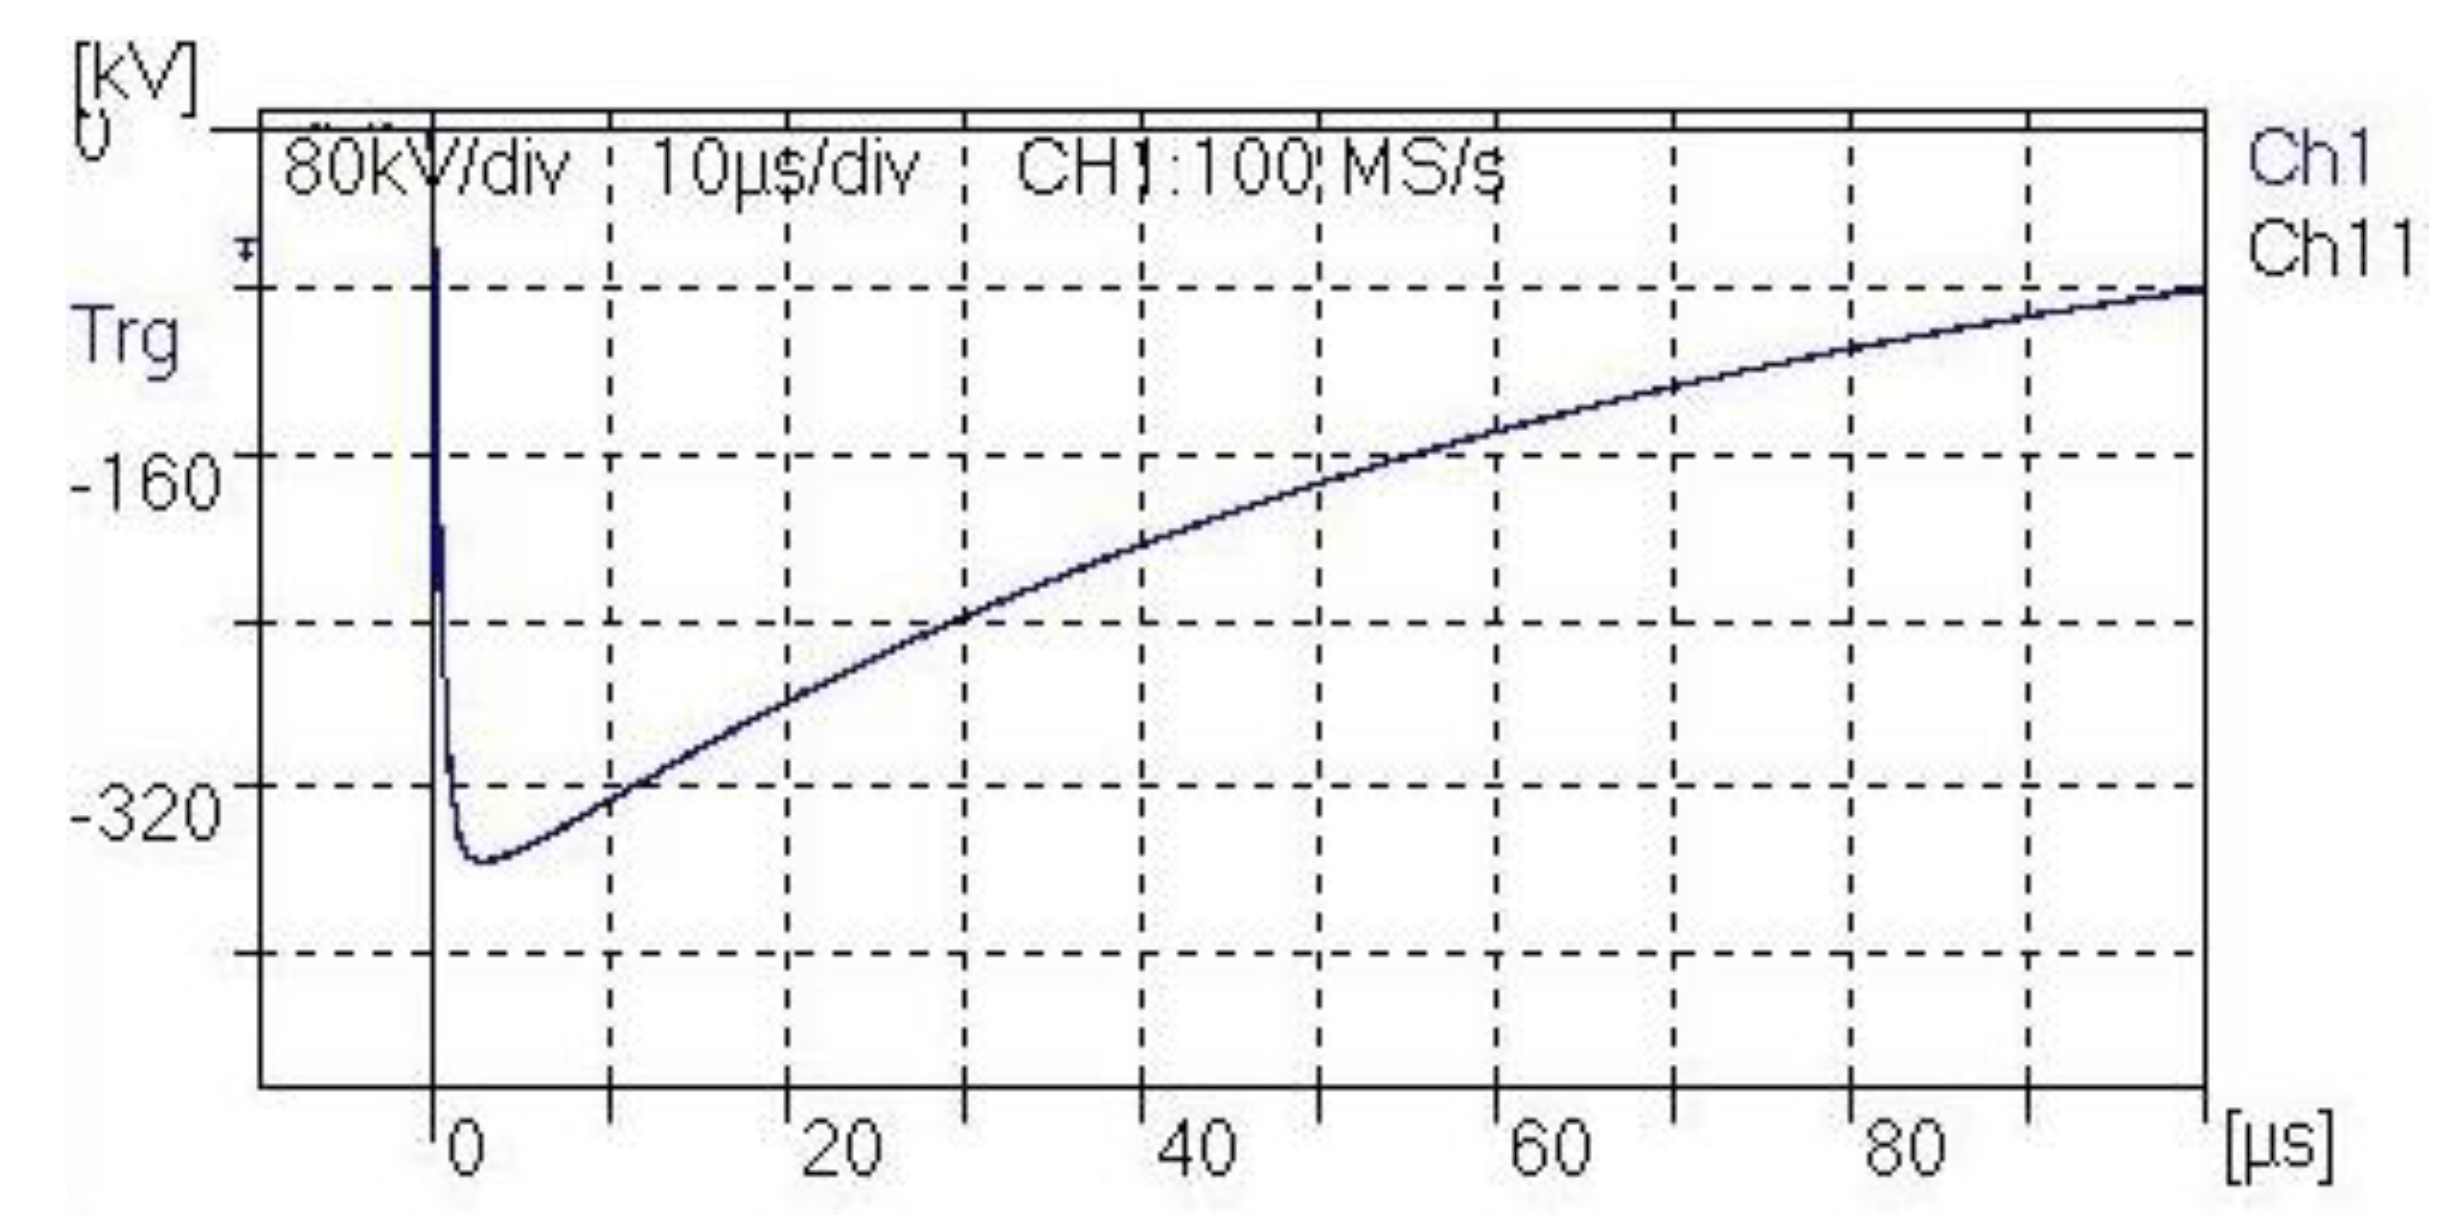
Regarding the lightning impulse test, a series of 1.2/50 µs voltage impulses with peak values between −50 kV and the Basic Insulation Level (BIL) were applied at the bushing’s terminal using the coupling device connected to the test tap. For all impulses applied, it was possible to verify that there was no rupture of the insulation of the bushing and, therefore, the coupling device did not weaken its service conditions. An example of applying a −356 kV pulse obtained directly from the oscilloscope is shown in Figure 16. Impulses with other peak values resulted in curves similar to the one shown in Figure 16 and, for this reason, other curves are not shown.
Complementing the high voltage impulse test, an 8/20 µs current impulse was applied to the bushing. In this case, it was possible to observe that the protection circuit worked as designed for peak values up to 40 kA. Above this value, there may be a burning of some protection device; however, when this situation occurs, the current surge is directed to the ground without reaching the measurement system. This result is important to prove the reliability of the protection scheme implemented.
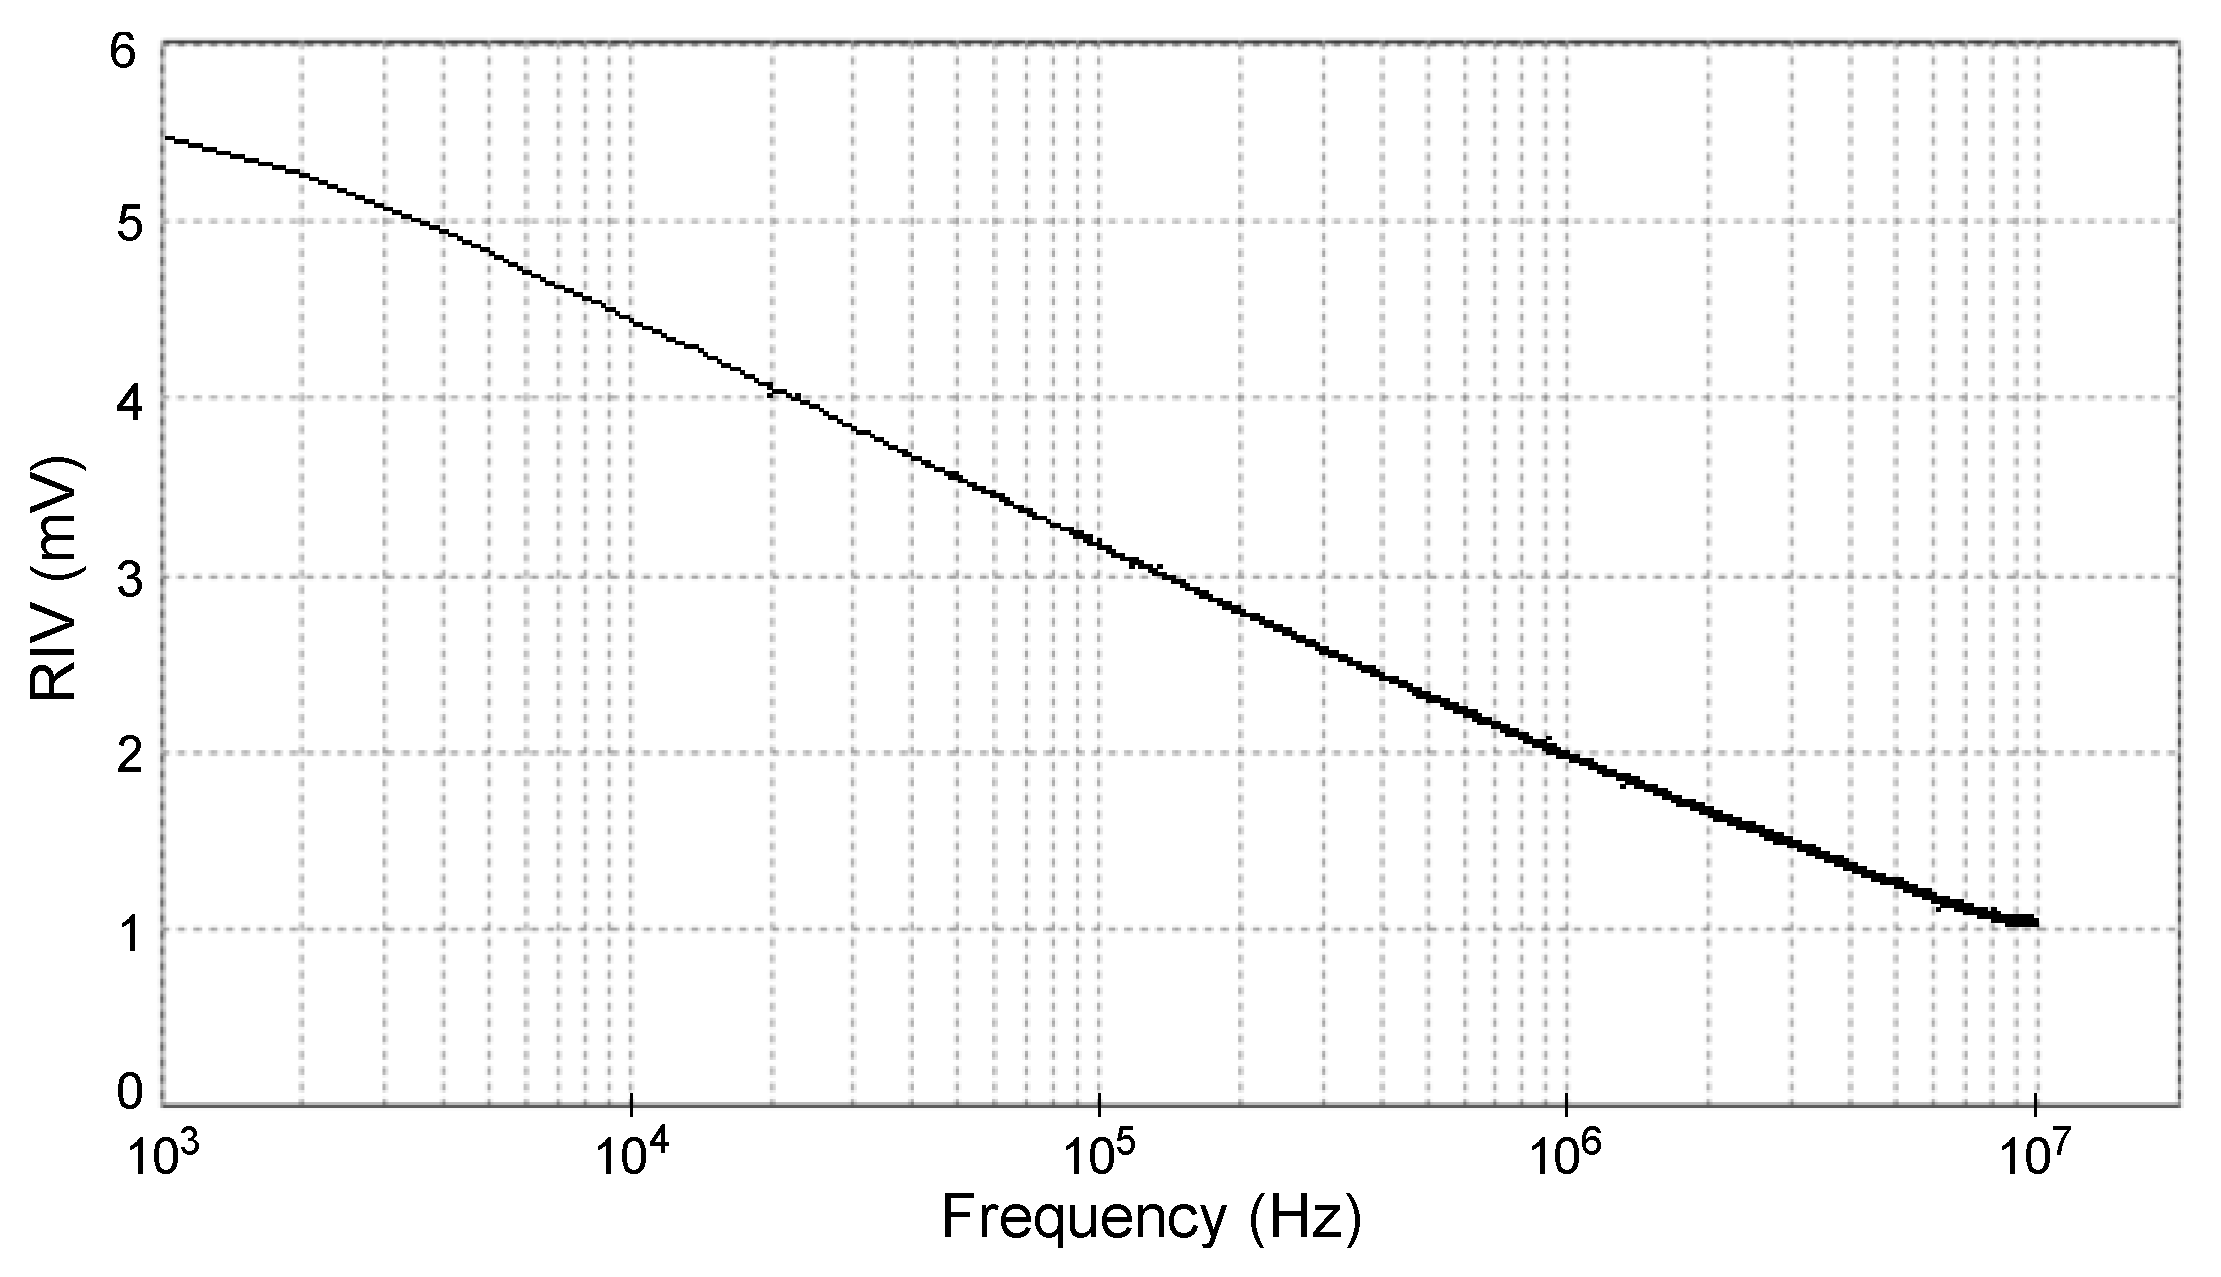
One of the concerns for the field application of the monitoring system is to ensure that the signal collected from the bushings is not polluted due to external interference. Thus, a radio interference voltage (RIV) test was performed to measure the amount of EM emissions in the radio frequency (RF) spectrum that can cause interference in the coupling device. RF covers signals with a frequency spectrum between 3 kHz and 30 GHz. However, as the electrical pulses of PDs are limited to a few MHz [16], the RIV test was performed for the frequency range from 1 kHz to 10 MHz in two situations: firstly, with nominal phase-to-ground voltage on the bushing (with the coupling device connected to the test tap) and, afterwards, considering a 50% overvoltage. The results are shown in Figure 17 and Figure 18.
From these results it can be pointed out that for both test situations the coupling device maintained remarkable immunity to EM interference in the RF spectrum, since the voltage amplitude induced by such interference was very low. This observation is more evident when analyzing the decreasing behavior of the voltage at higher frequency values.
Obtaining low values of EM interference is a key requirement for the real application of this work. Among other reasons, it can be mentioned that this task was achieved due to the geometry of the coupling device; the reliability of the components of the internal circuit; the direct connection to the test tap; and the short length between the coupling device and the measurement system.

3.2. Installation and Operation in Substation

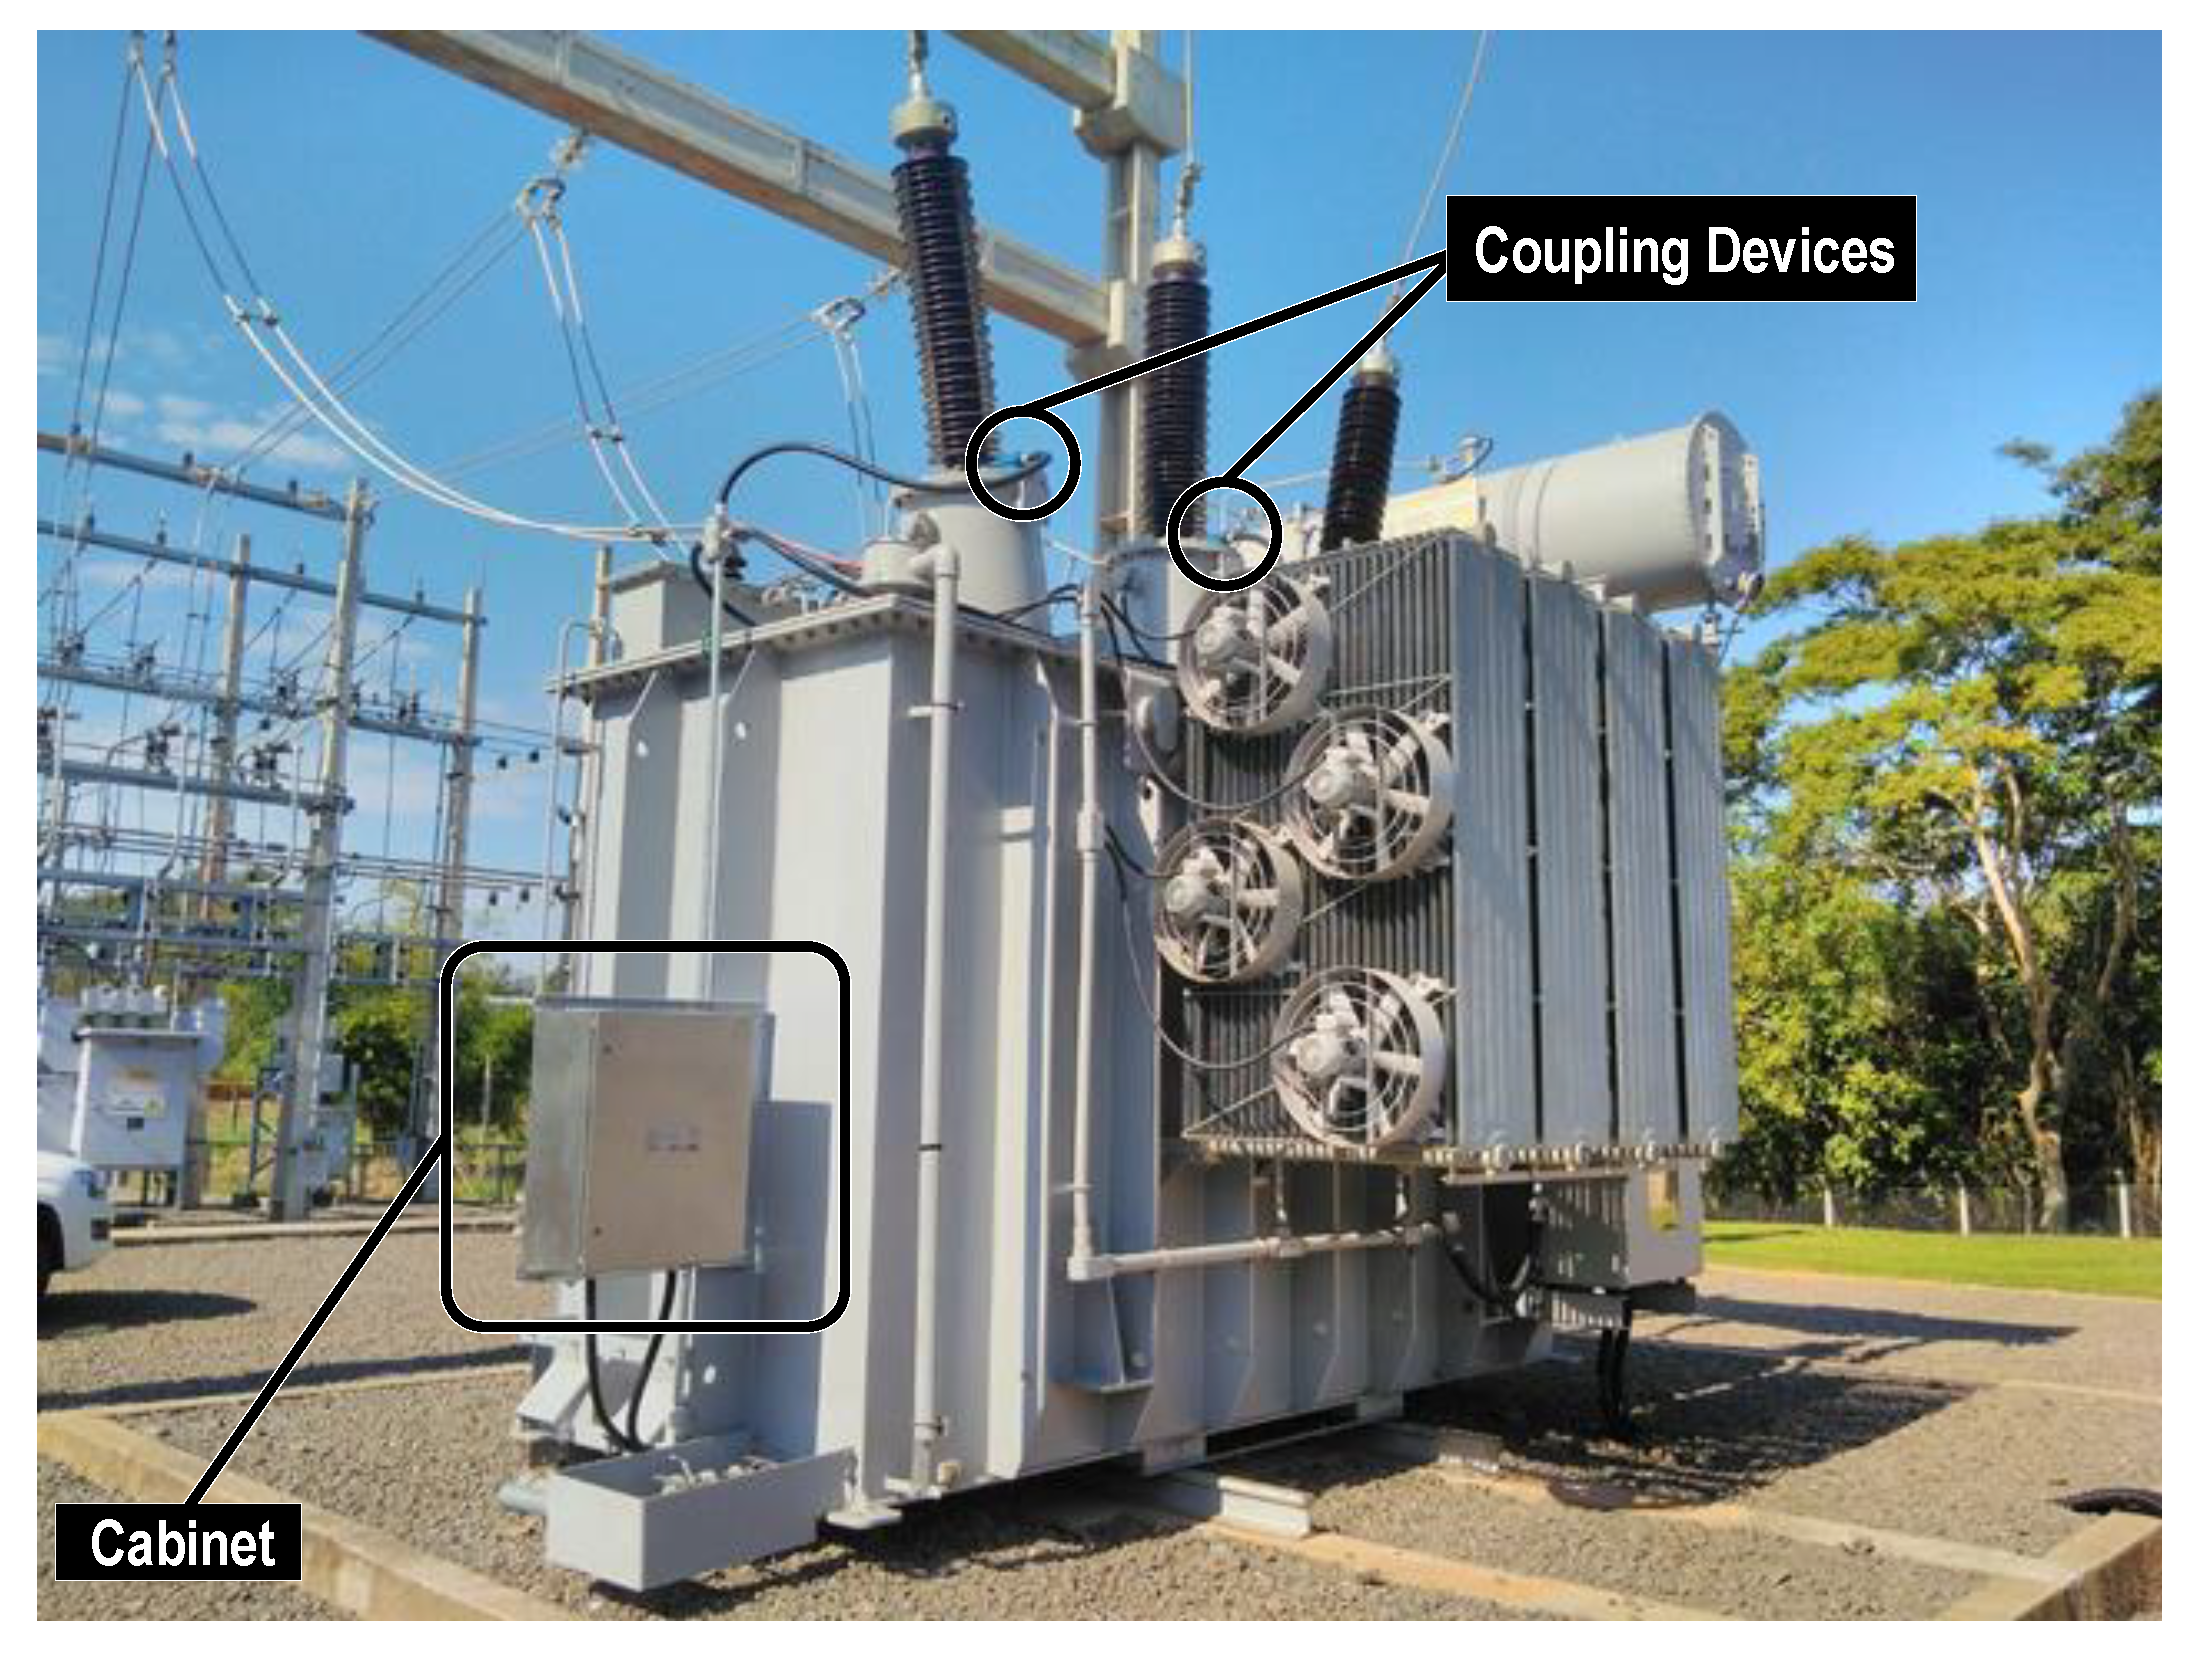
The developed monitoring system was applied to different oil-insulated power transformers equipped with condenser bushings in HV terminals at different substations, as shown in Figure 19.
In Figure 20 and Figure 21 it is possible to observe the coupling devices connected in the HV bushings and an internal view of the cabinet, respectively. In Figure 20 it is important to highlight that the metallic case of the coupling device and the shielded tube, which surrounds the conductor between the coupling device and the acquisition unit, form a Faraday cage and prevent the penetration of unwanted electrical fields that could interfere with the measurements.
In order to validate the proposed monitoring system, the following sections present different application cases that demonstrate the system’s efficiency in detecting partial discharges online, as well as how these measures can be used to assess the real conditions of a power transformer. It should be noted that, in all cases presented, measurements were obtained on dry days and with the transformer operating at steady state.

3.2.1. Case I: PD Pulses Detected by Coupling Device

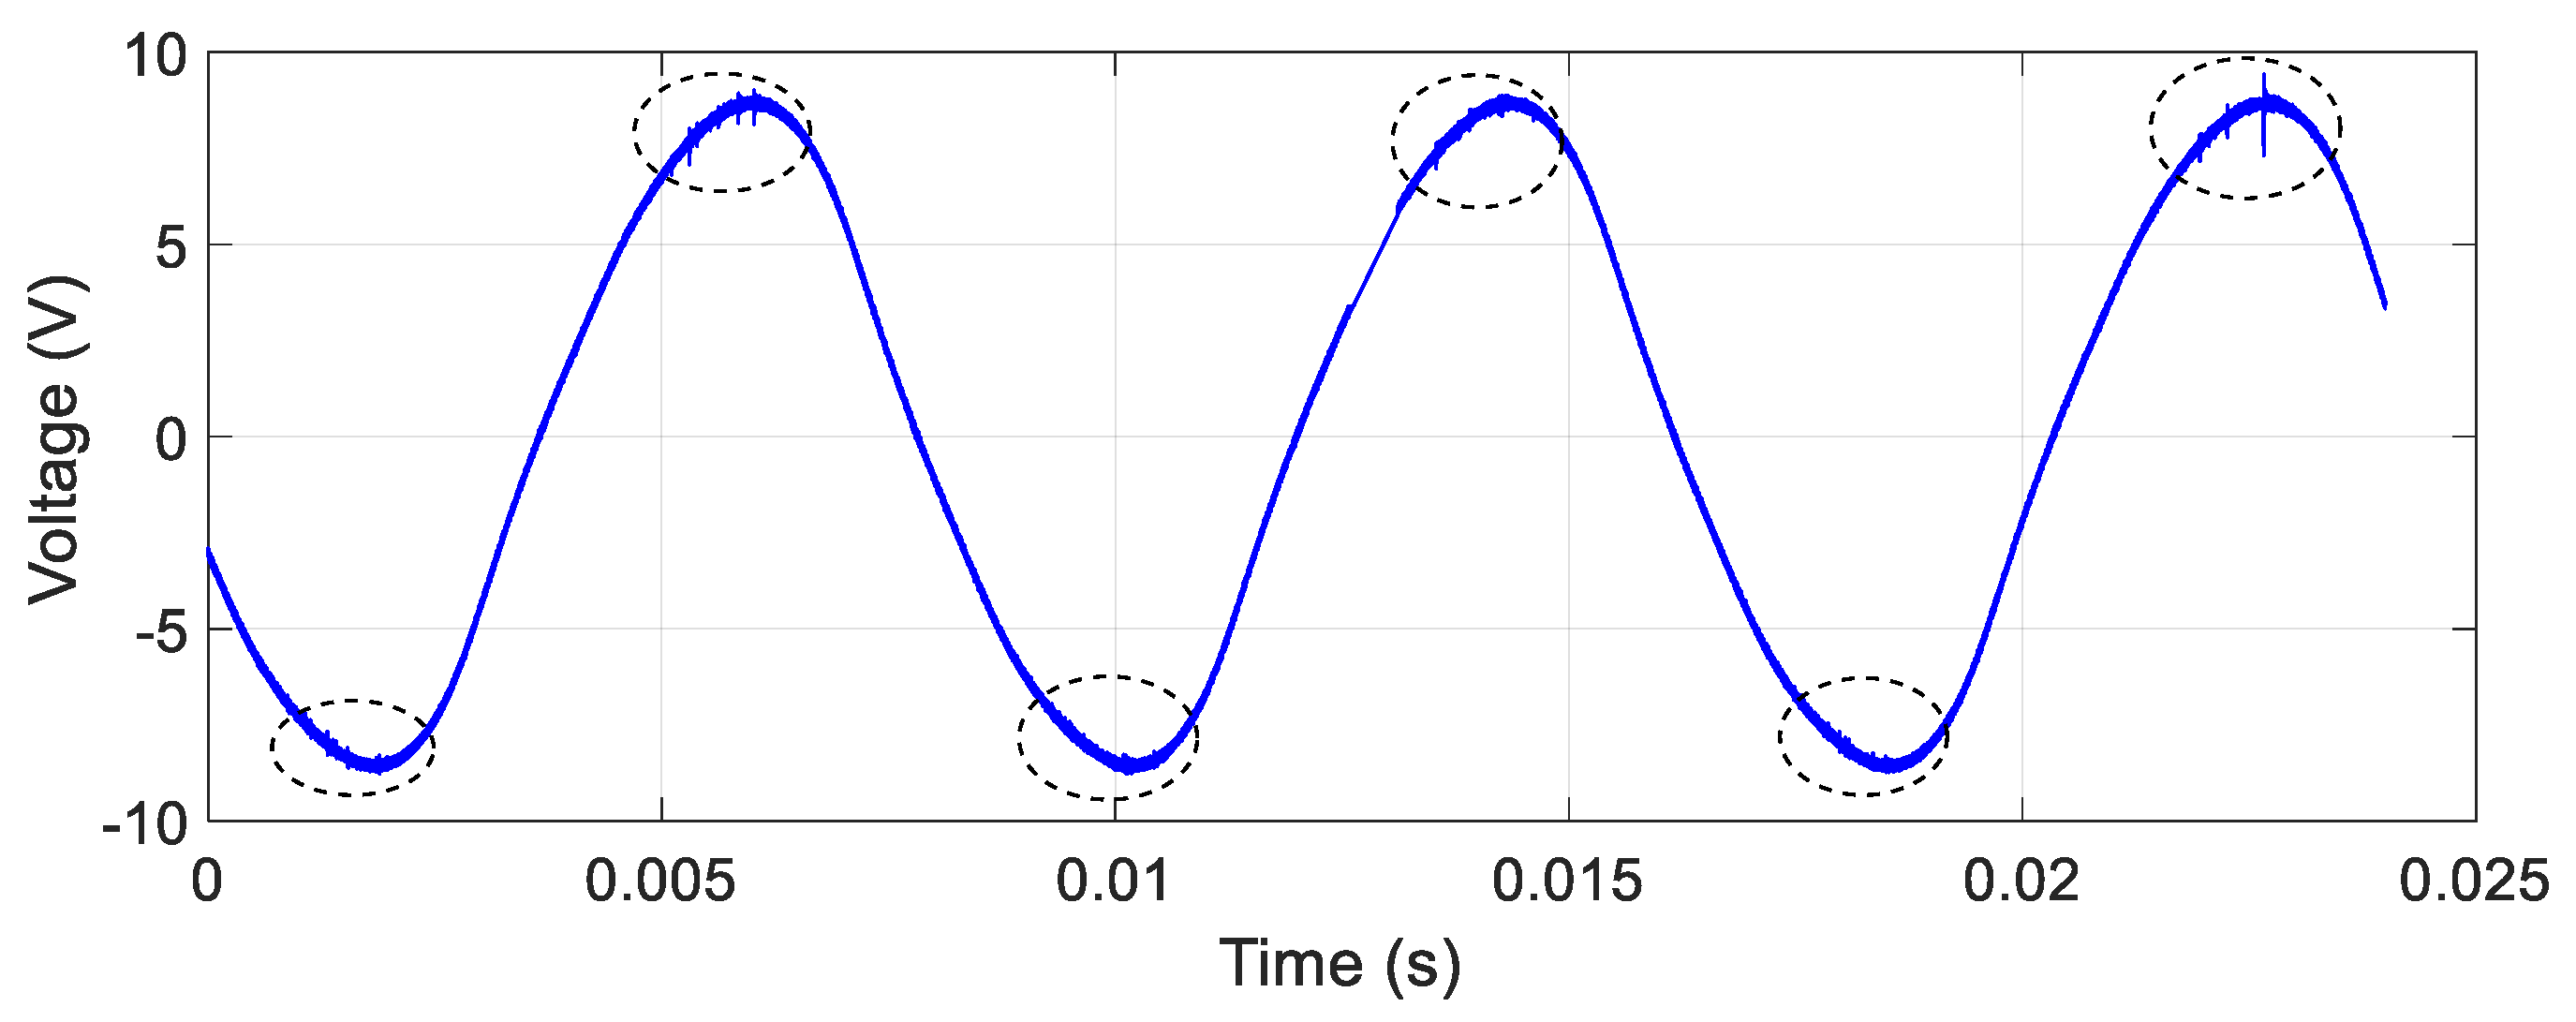
In the first practical application, the developed monitoring system was applied to a power transformer in order to verify its capability for detecting activities of internal partial discharges. Thus, once the device was connected to the test tap, it was possible to capture the voltage signal present in the insulation of the condenser bushings, as shown in Figure 22 for the bushing of phase A. The readings obtained from others bushings were similar to those shown in Figure 22 and, for this reason, are not shown.
The voltage signal measured had components in addition to the 60 Hz sinusoidal signal, which included harmonics, interharmonics, and partial discharges. Particularly with respect to the PDs, it is worth noting that their activities were perceived due to the low-amplitude and high-frequency pulses present in 1–2.5, 5–6, 9–11, 13.4–14.6, 17.5–18.6, and 22–23 ms, as indicated by the circled areas in Figure 22.
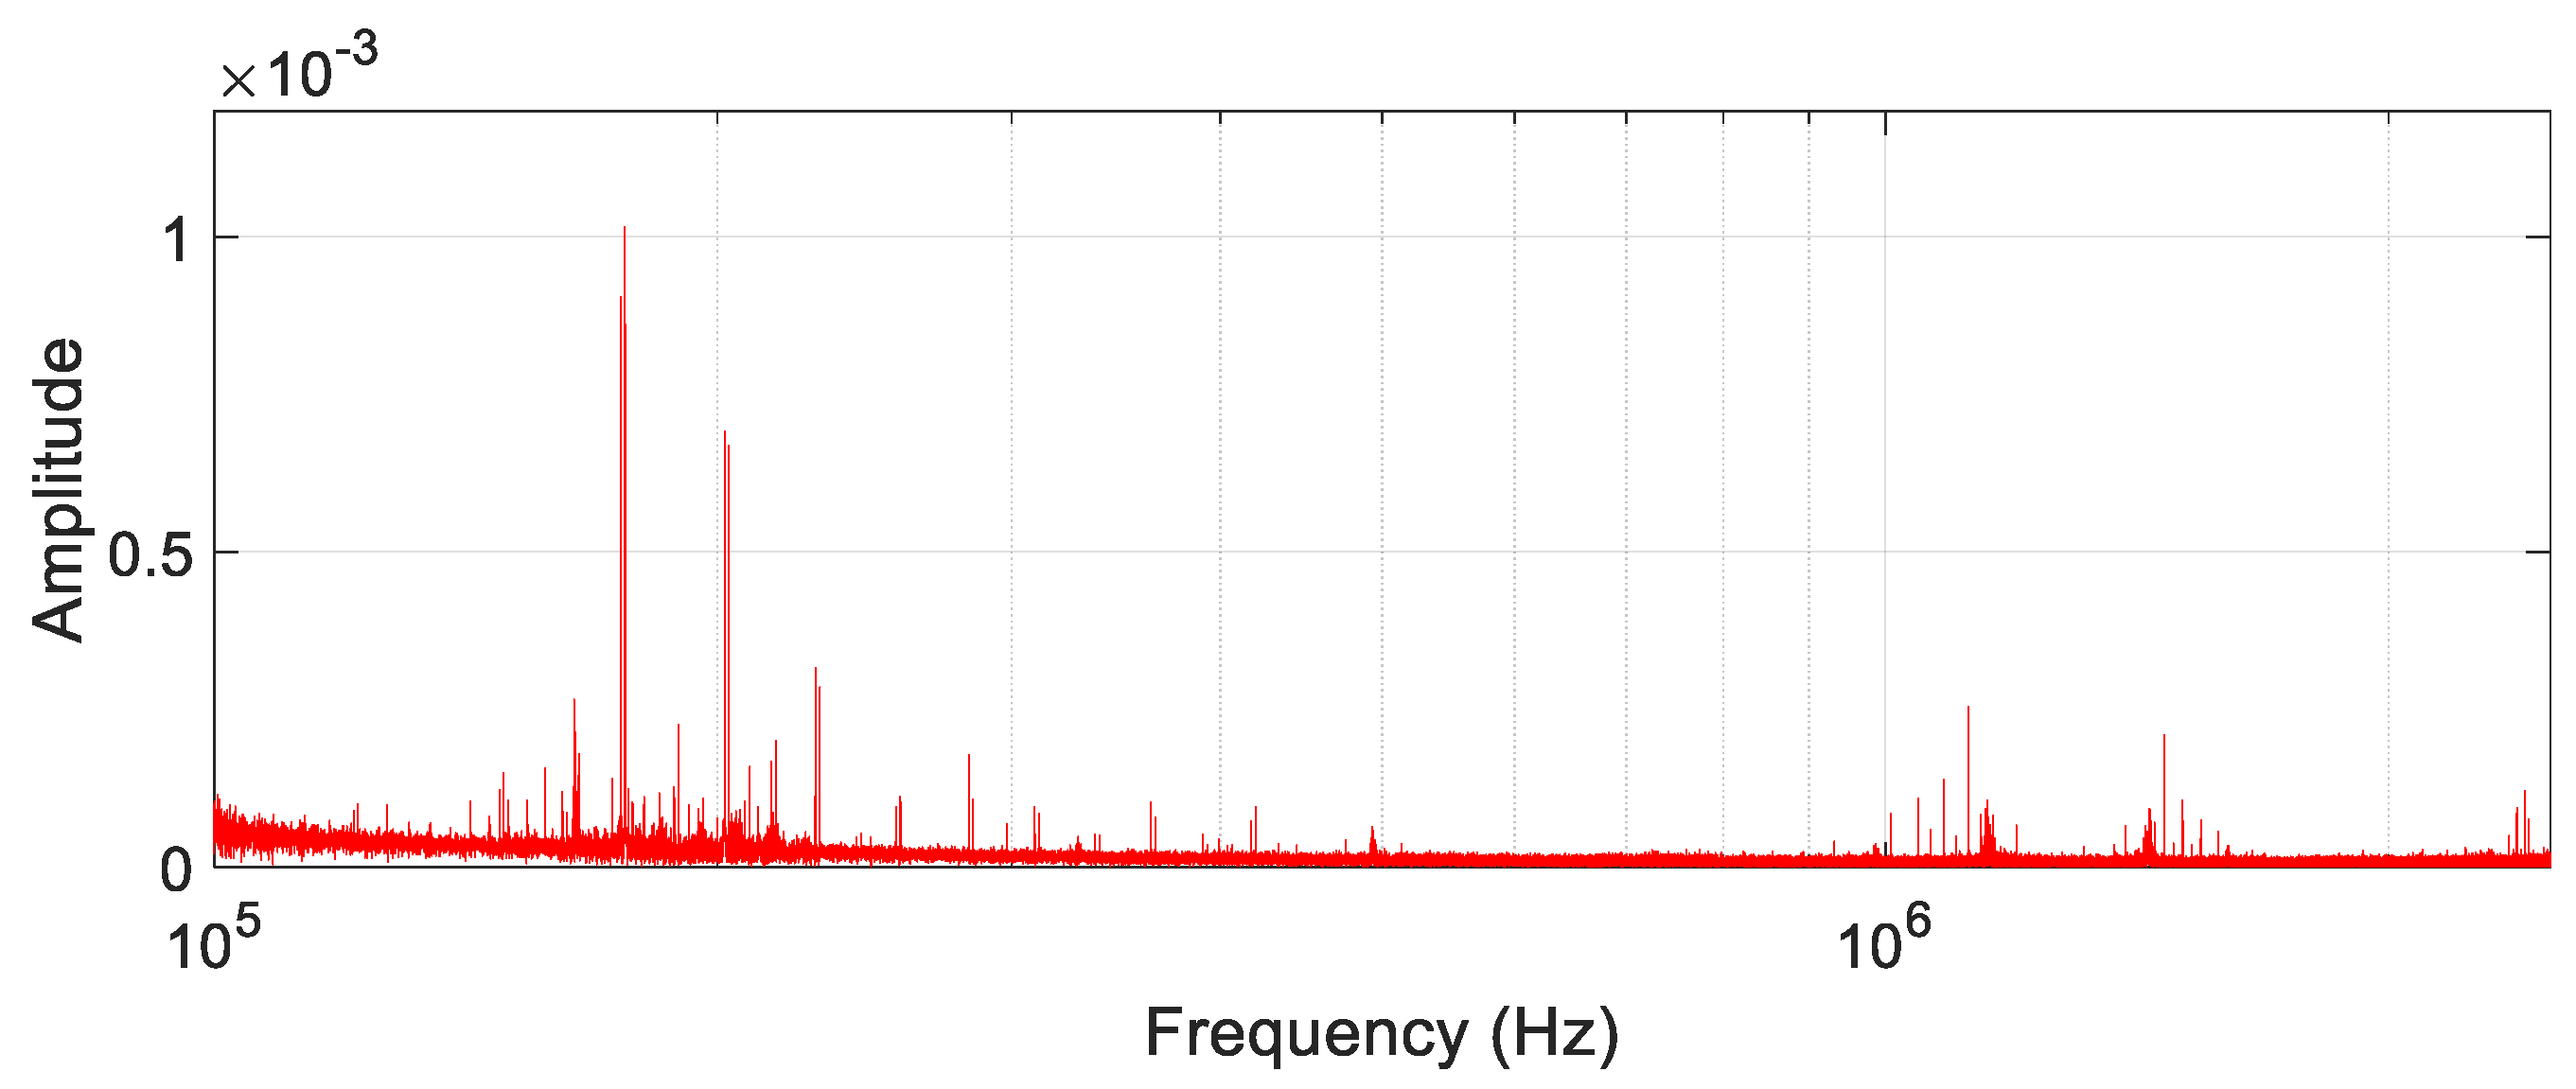
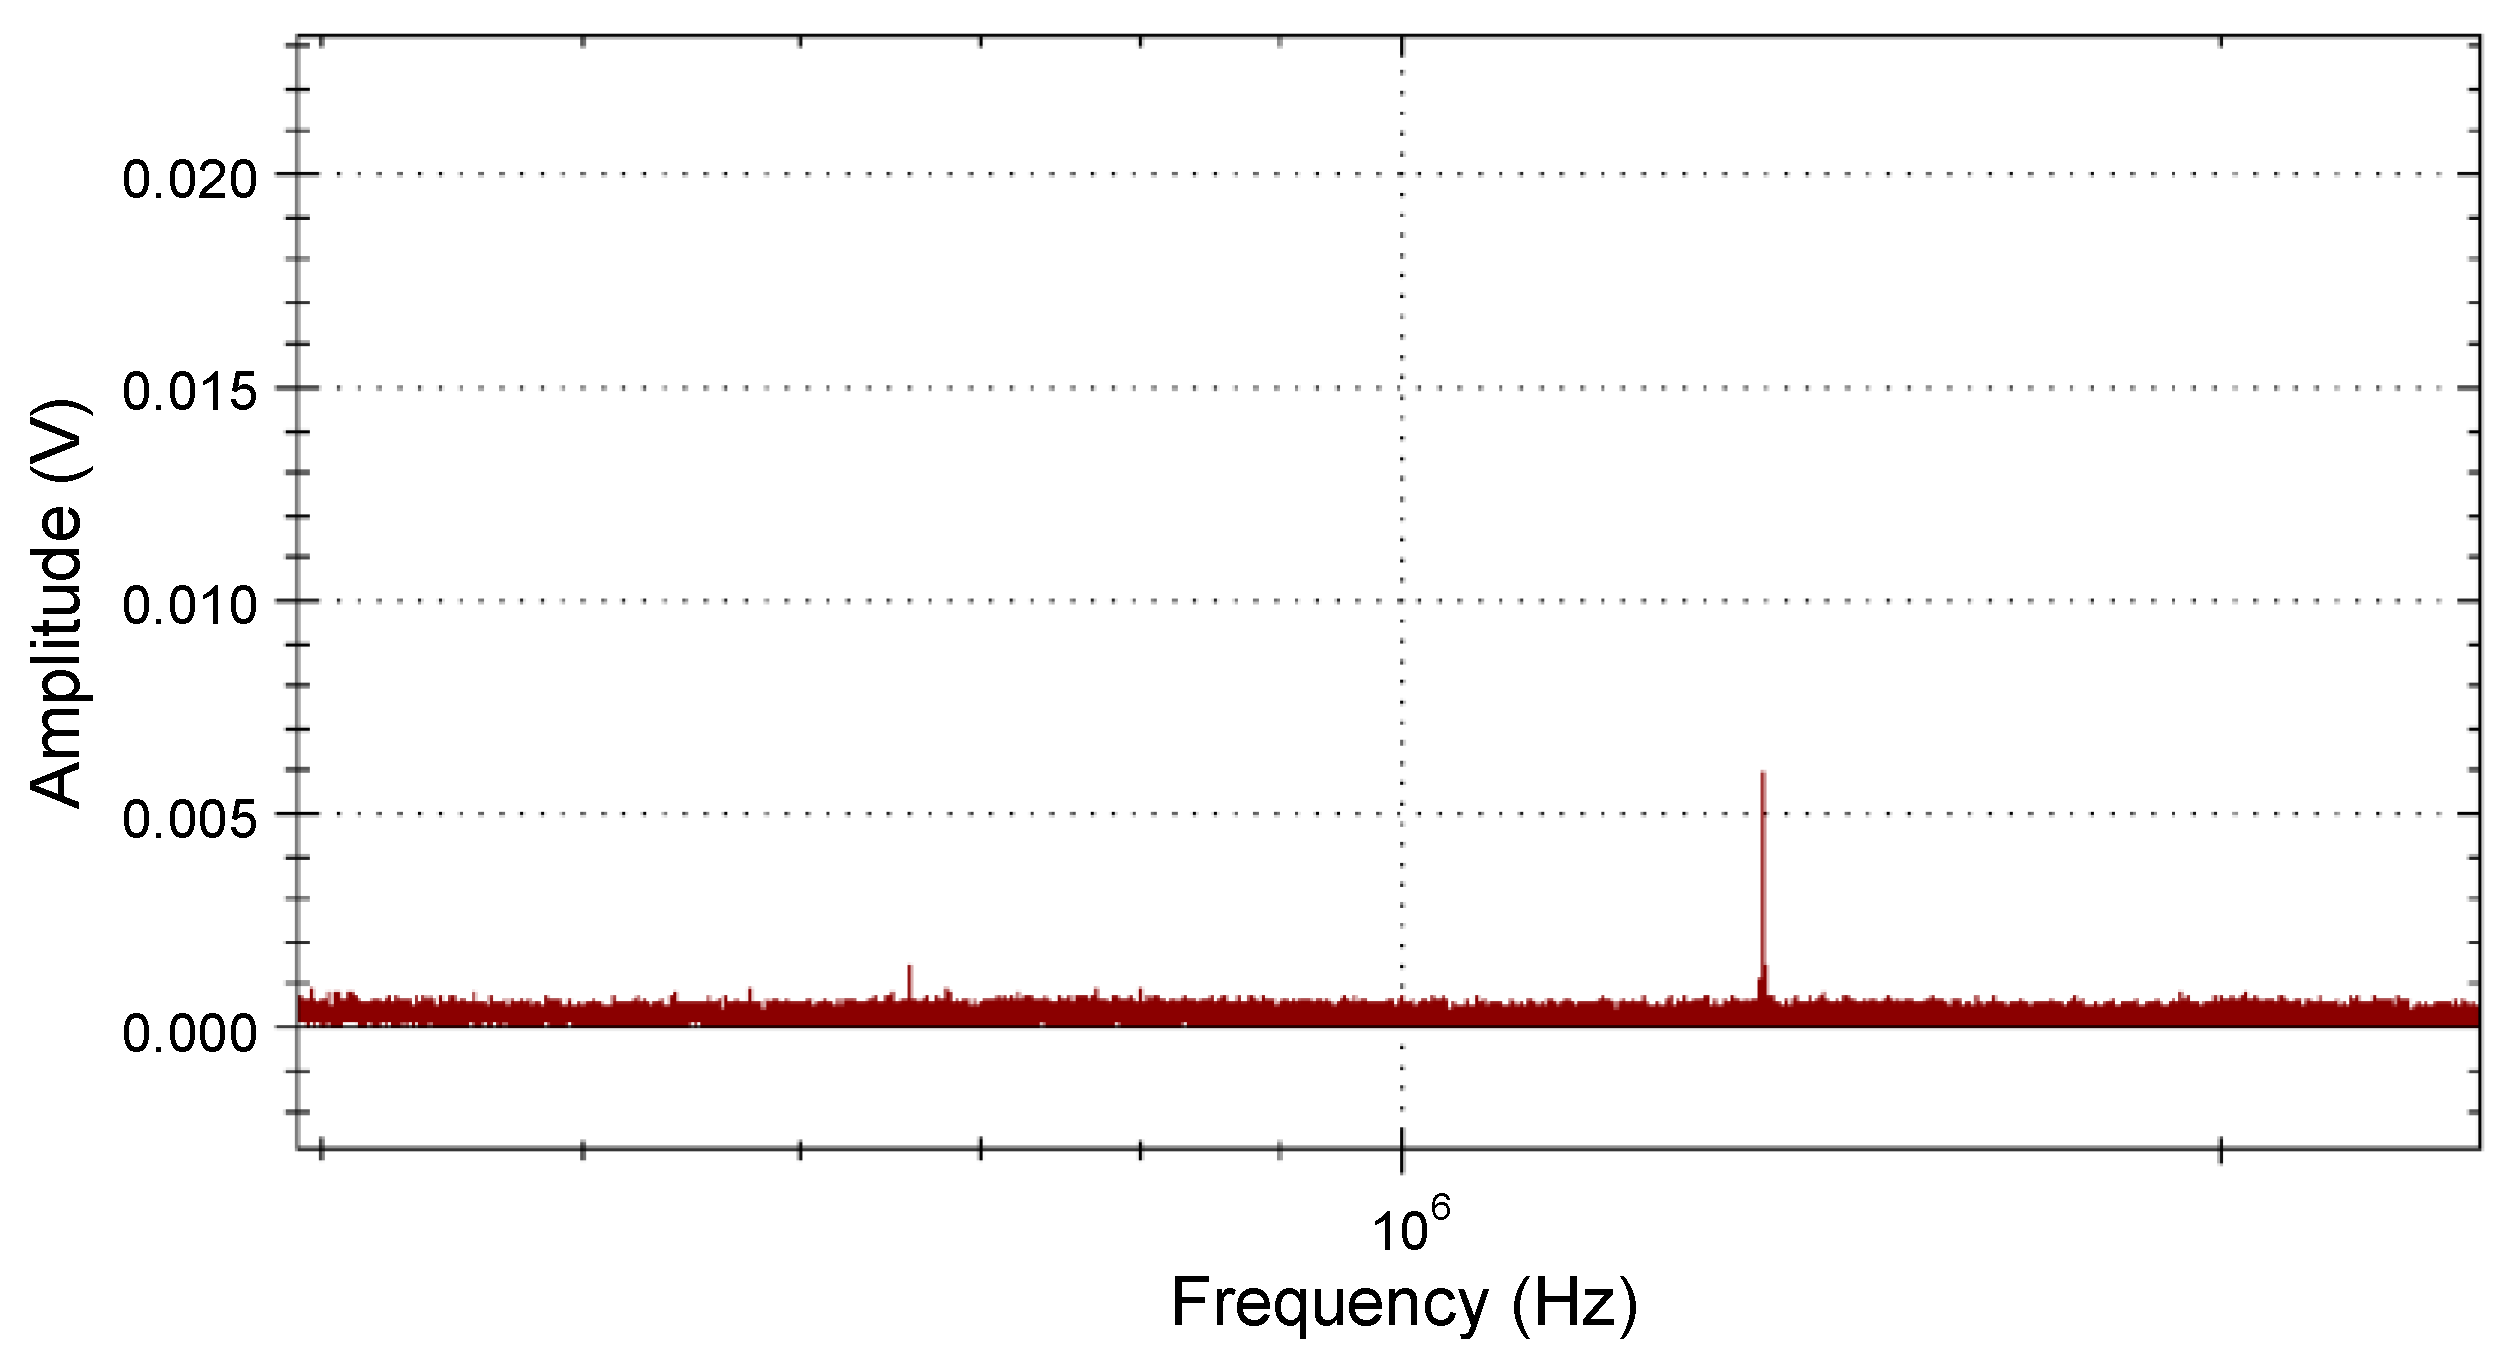
In a broader analysis, the partial discharges could also be perceived due to their distribution in the frequency spectrum. In this sense, when transforming the captured signal to the frequency domain, as shown in Figure 23, it is possible to observe that the PDs are evident in a high-frequency band spread mainly in the following intervals: 120–500 kHz, 0.9–1.5 MHz, and 2.2–2.5 MHz.
Complementing the investigation, it is important to highlight that the PD signature observed in Figure 22, which is characterized by pulses concentrated close to positive and negative peaks of the sinusoidal signal, is a pattern already known in the literature. Therefore, based on this pattern, it is possible to diagnose that the monitored transformer has a defect in the oil-paper insulation or gas bubble in some dielectric component of the insulation [30]. This diagnostic is important for issues related to the asset management of a utility.

3.2.2. Case II: PD Monitoring over a 24-Hour Interval

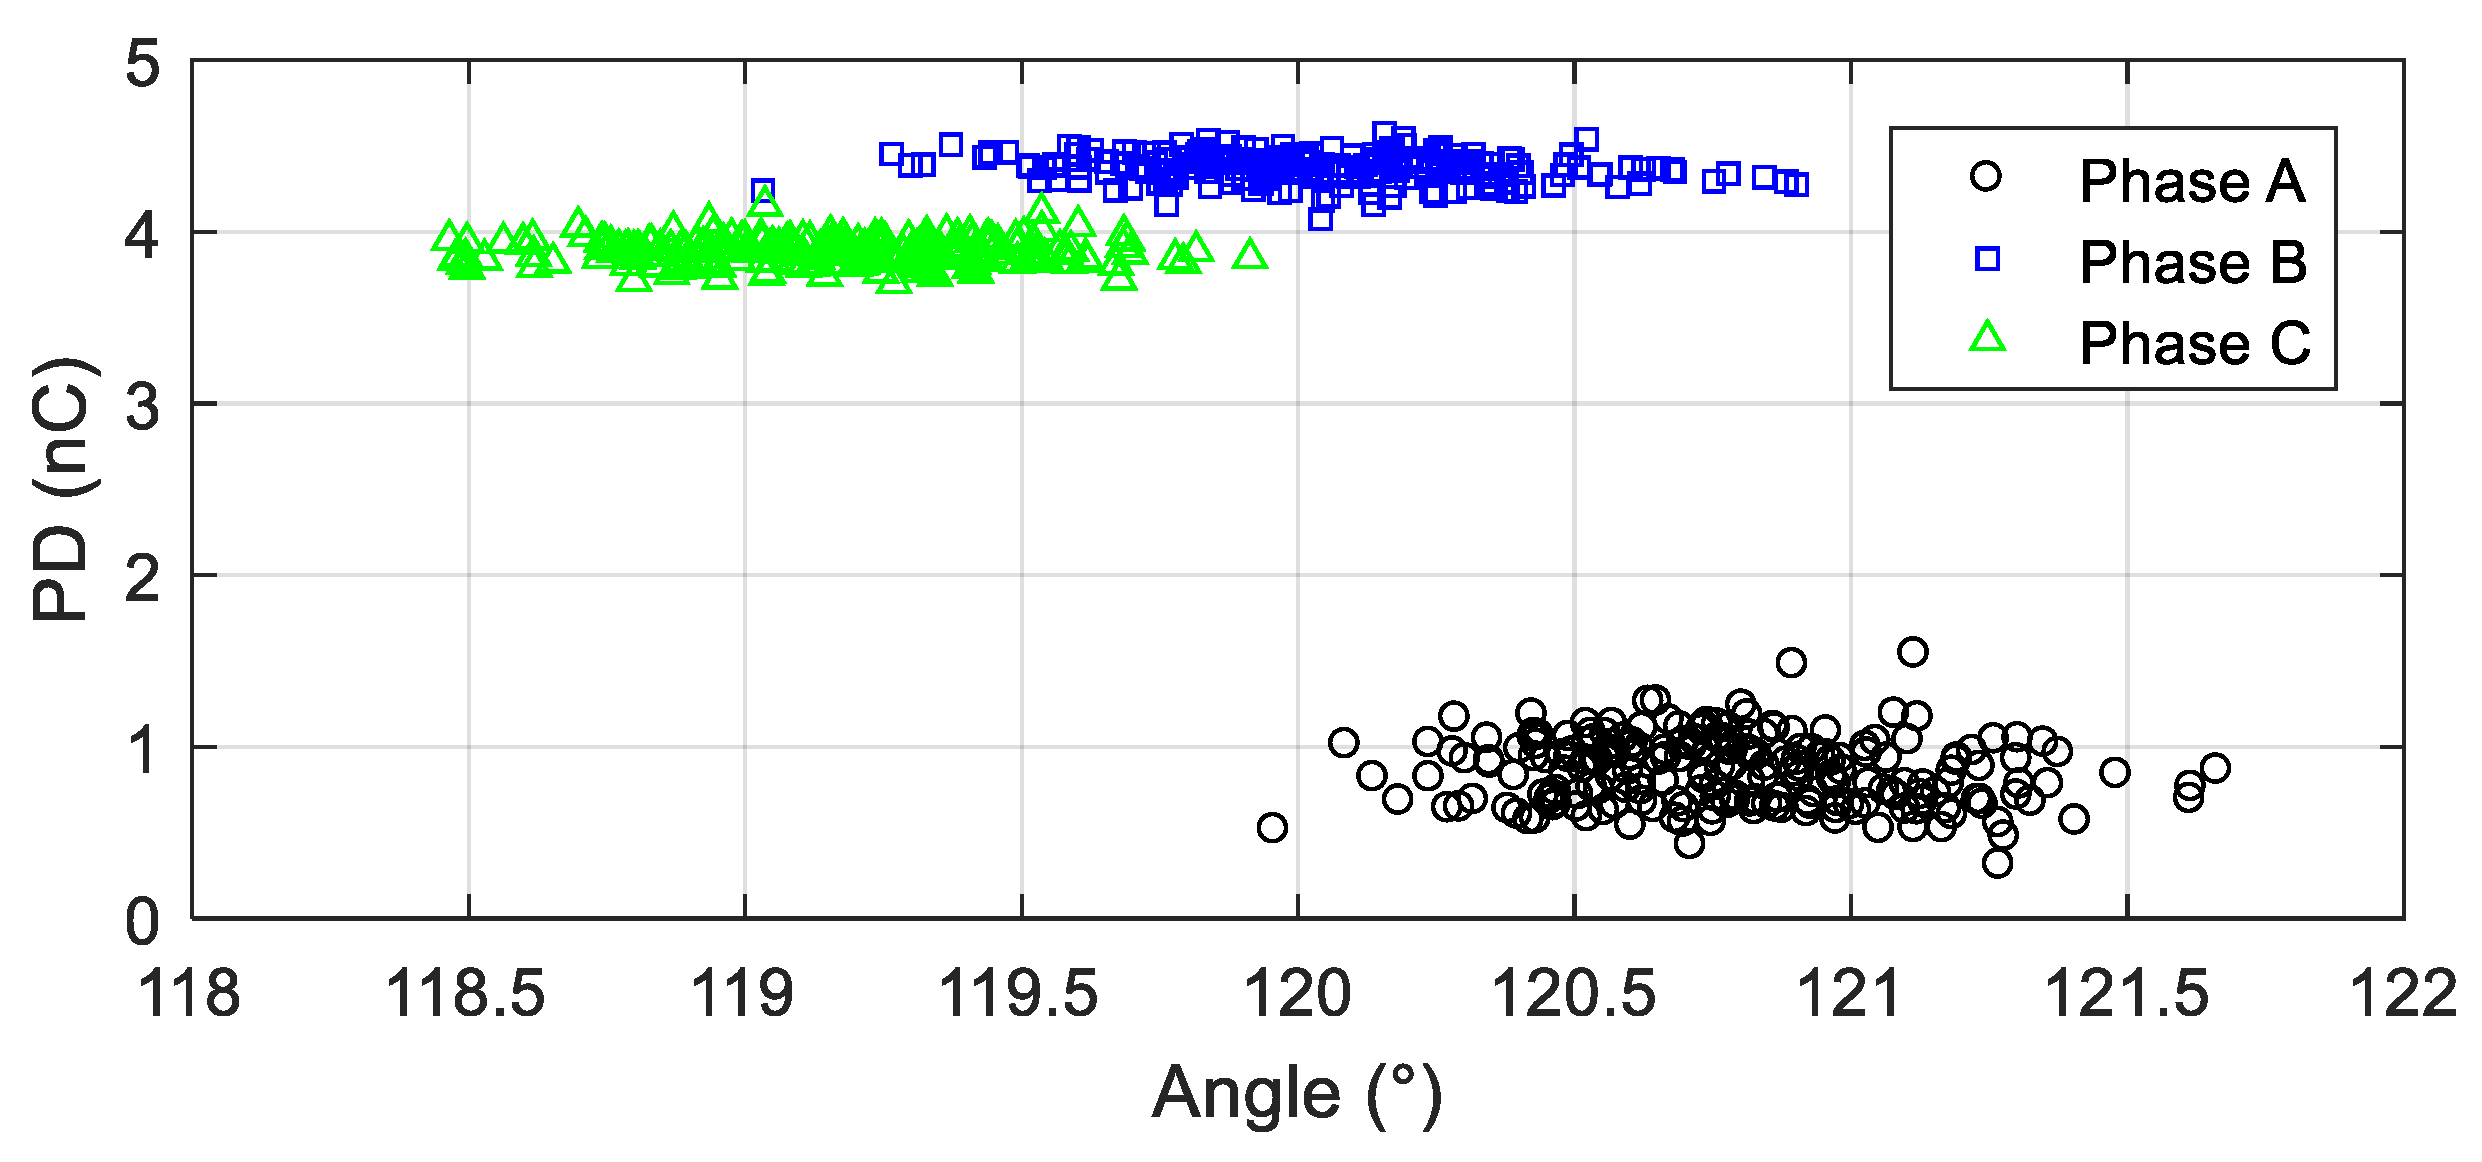
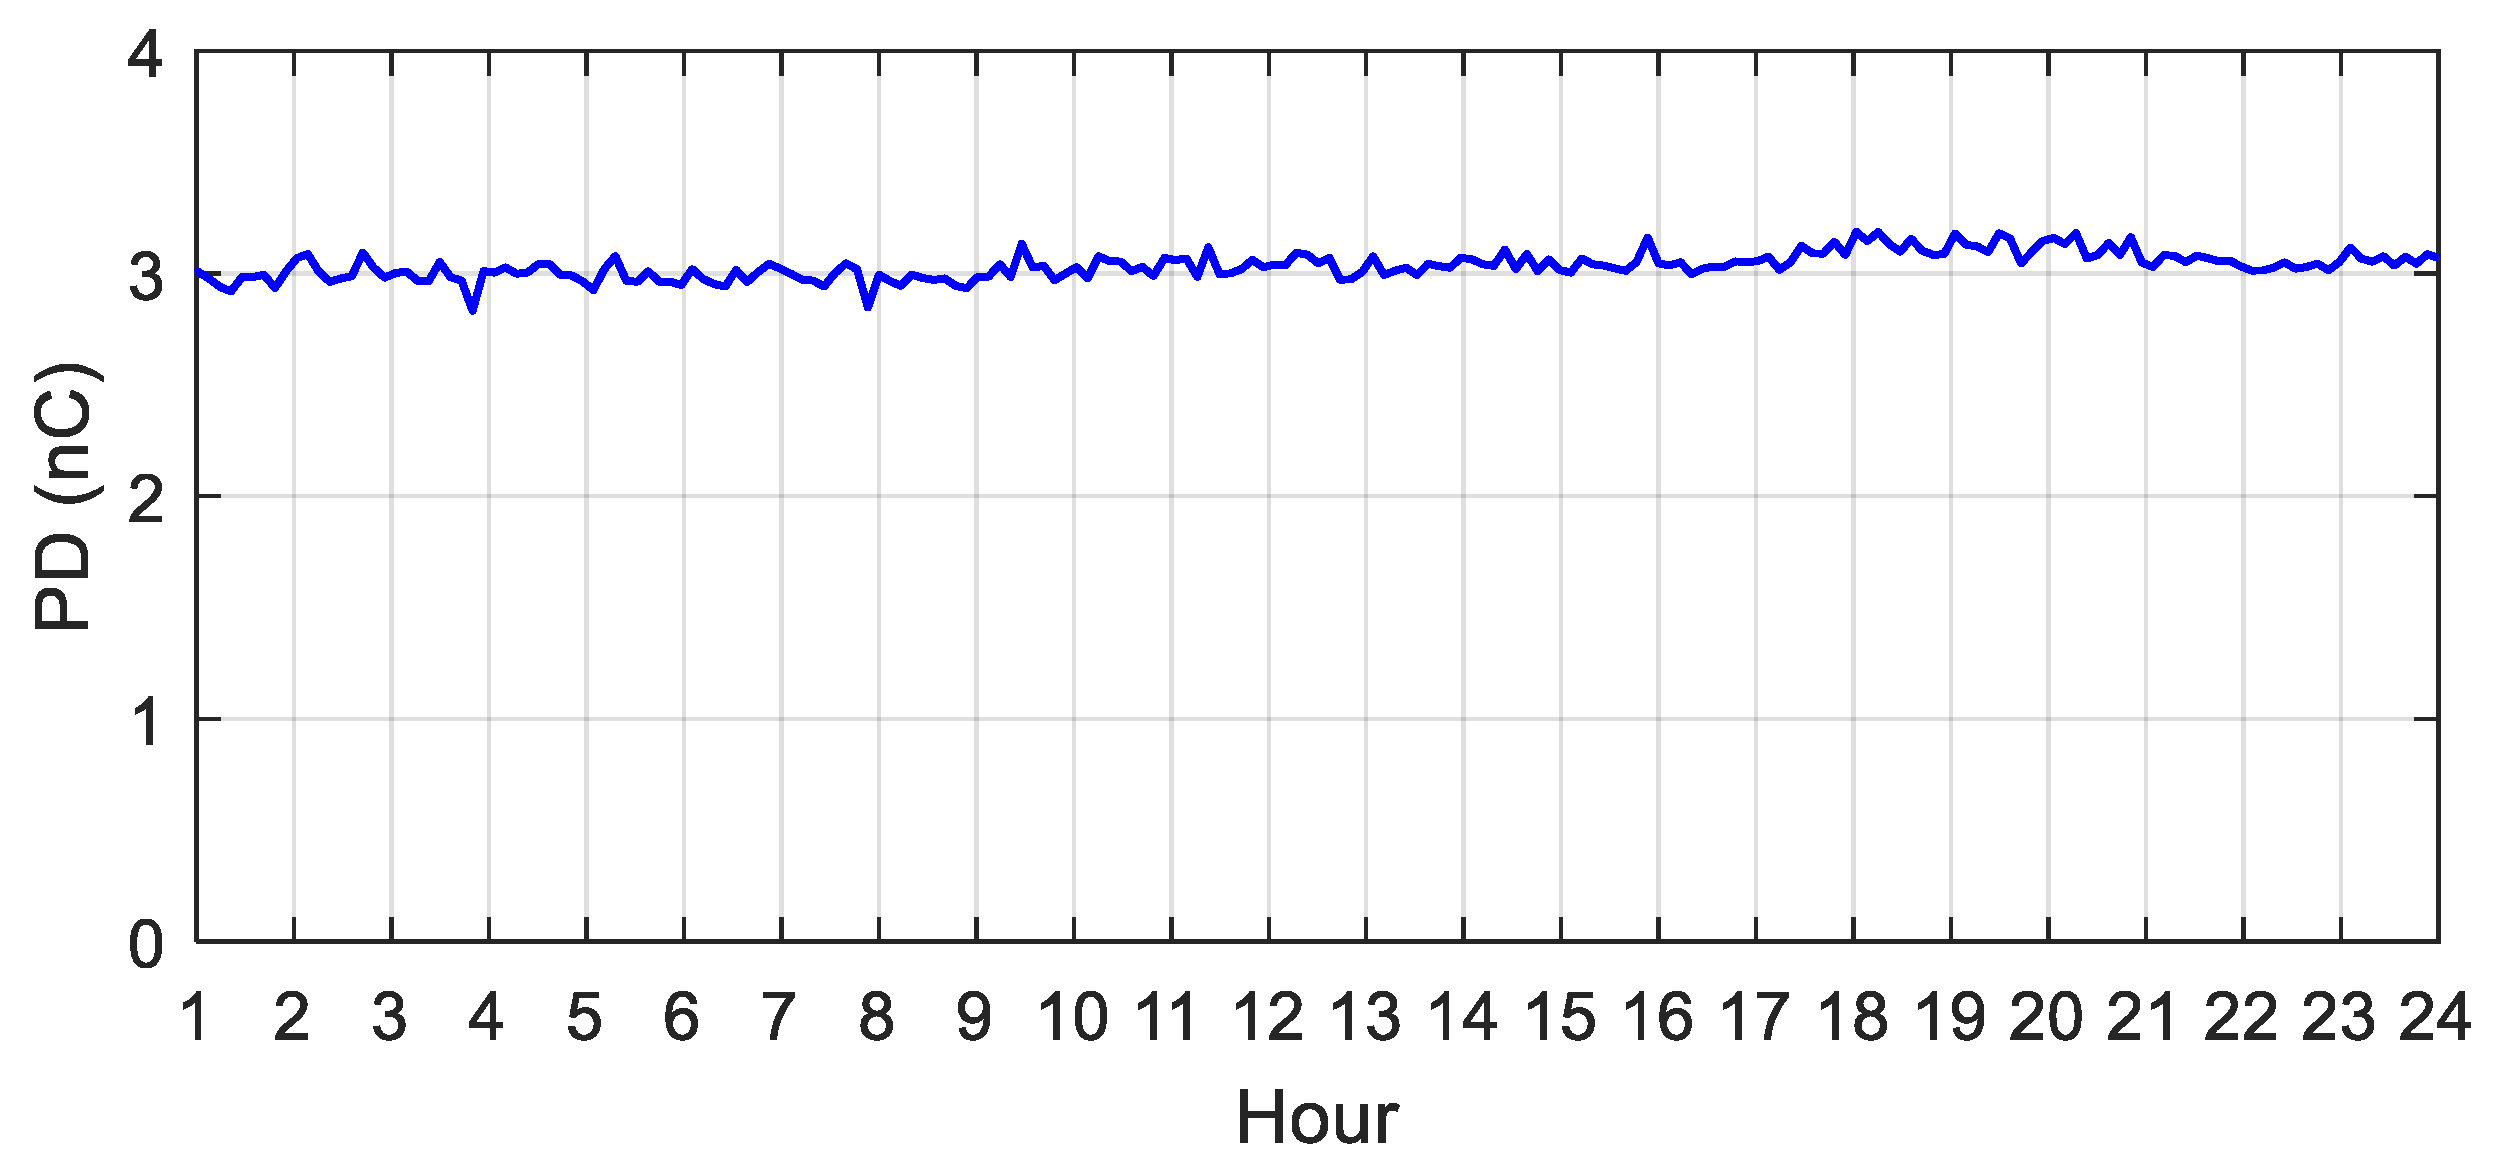
In this case, partial discharge activities were monitored by the developed system over a 24-h horizon. Figure 24 depicts the PD magnitude versus the phase angle among the reading channels recorded over the course of a day. Additionally, Figure 25 shows the average value of the PDs for the same observation period.
From the figures, a high level of PDs can be observed in the insulation of the transformer. Nevertheless, in a broader analysis of the measurements, it is important to verify that the apparent charge of the PDs was stable throughout the day (with some variations due to the oscillation of the transformer load and temperature) and, in addition, the phase angle of occurrence was practically constant, close to 120°. In this way, it can be attested that the transformer had a moderate level of insulation degradation; however, as the occurrences of partial discharges do not present great variations in the observed period, it is unlikely that an imminent failure would occur.
In cases like this, a failure can occur in a matter of years and, therefore, it is not necessary to take the equipment out of service immediately. In fact, a good practice in this situation is to continuously monitor the level of partial discharges to detect any changes in the insulation conditions of the transformer. Thus, in addition to partial discharges, other parameters, such as changes in gases dissolved in oil, can corroborate for diagnostic purposes. A specific example of this is detailed in the next case.

3.2.3. Case III: Detection of PDs and Correlation with DGA

To complement the application of this work, the proposed monitoring system was installed in a transformer whose insulation was in critical condition. In this case, the monitored transformer was equipped with a DGA monitor that detected a rapid and abnormal increase in the concentration of gases dissolved in the transformer oil over three consecutive days, as shown in Table 4.
An analysis of the Duval triangle [5] for key gas concentrations measured on the third day indicates a thermal problem in the transformer. Although this problem is not necessarily caused by partial discharges, this abnormal increase in dissolved gases in oil generates effects that, in turn, produce internal PDs in the insulation of the transformer. In order to confirm this situation, the developed monitoring system was applied to this case. The results of the measurements, obtained on the third day for each HV bushing, are shown in Table 5.
In Table 5, a discrepancy can be seen among the apparent charge detected on the bushing of phase B and the values detected on the bushings of phases A and C. Such a discrepancy, with high PD values on the bushings of phases A and C, is an indicative of a defect in some part of the transformer.
Figure 26 shows the characteristics in the frequency domain of the signal collected from the bushing of phase C, where a formation of discharge pulses in the high frequency spectrum was evident in the 1.5 MHz range. This observation is useful in order to corroborate the indication of a weakness in the insulation of the monitored asset. This same conclusion can be obtained from an analysis of the frequency domain in the bushing of phase B.
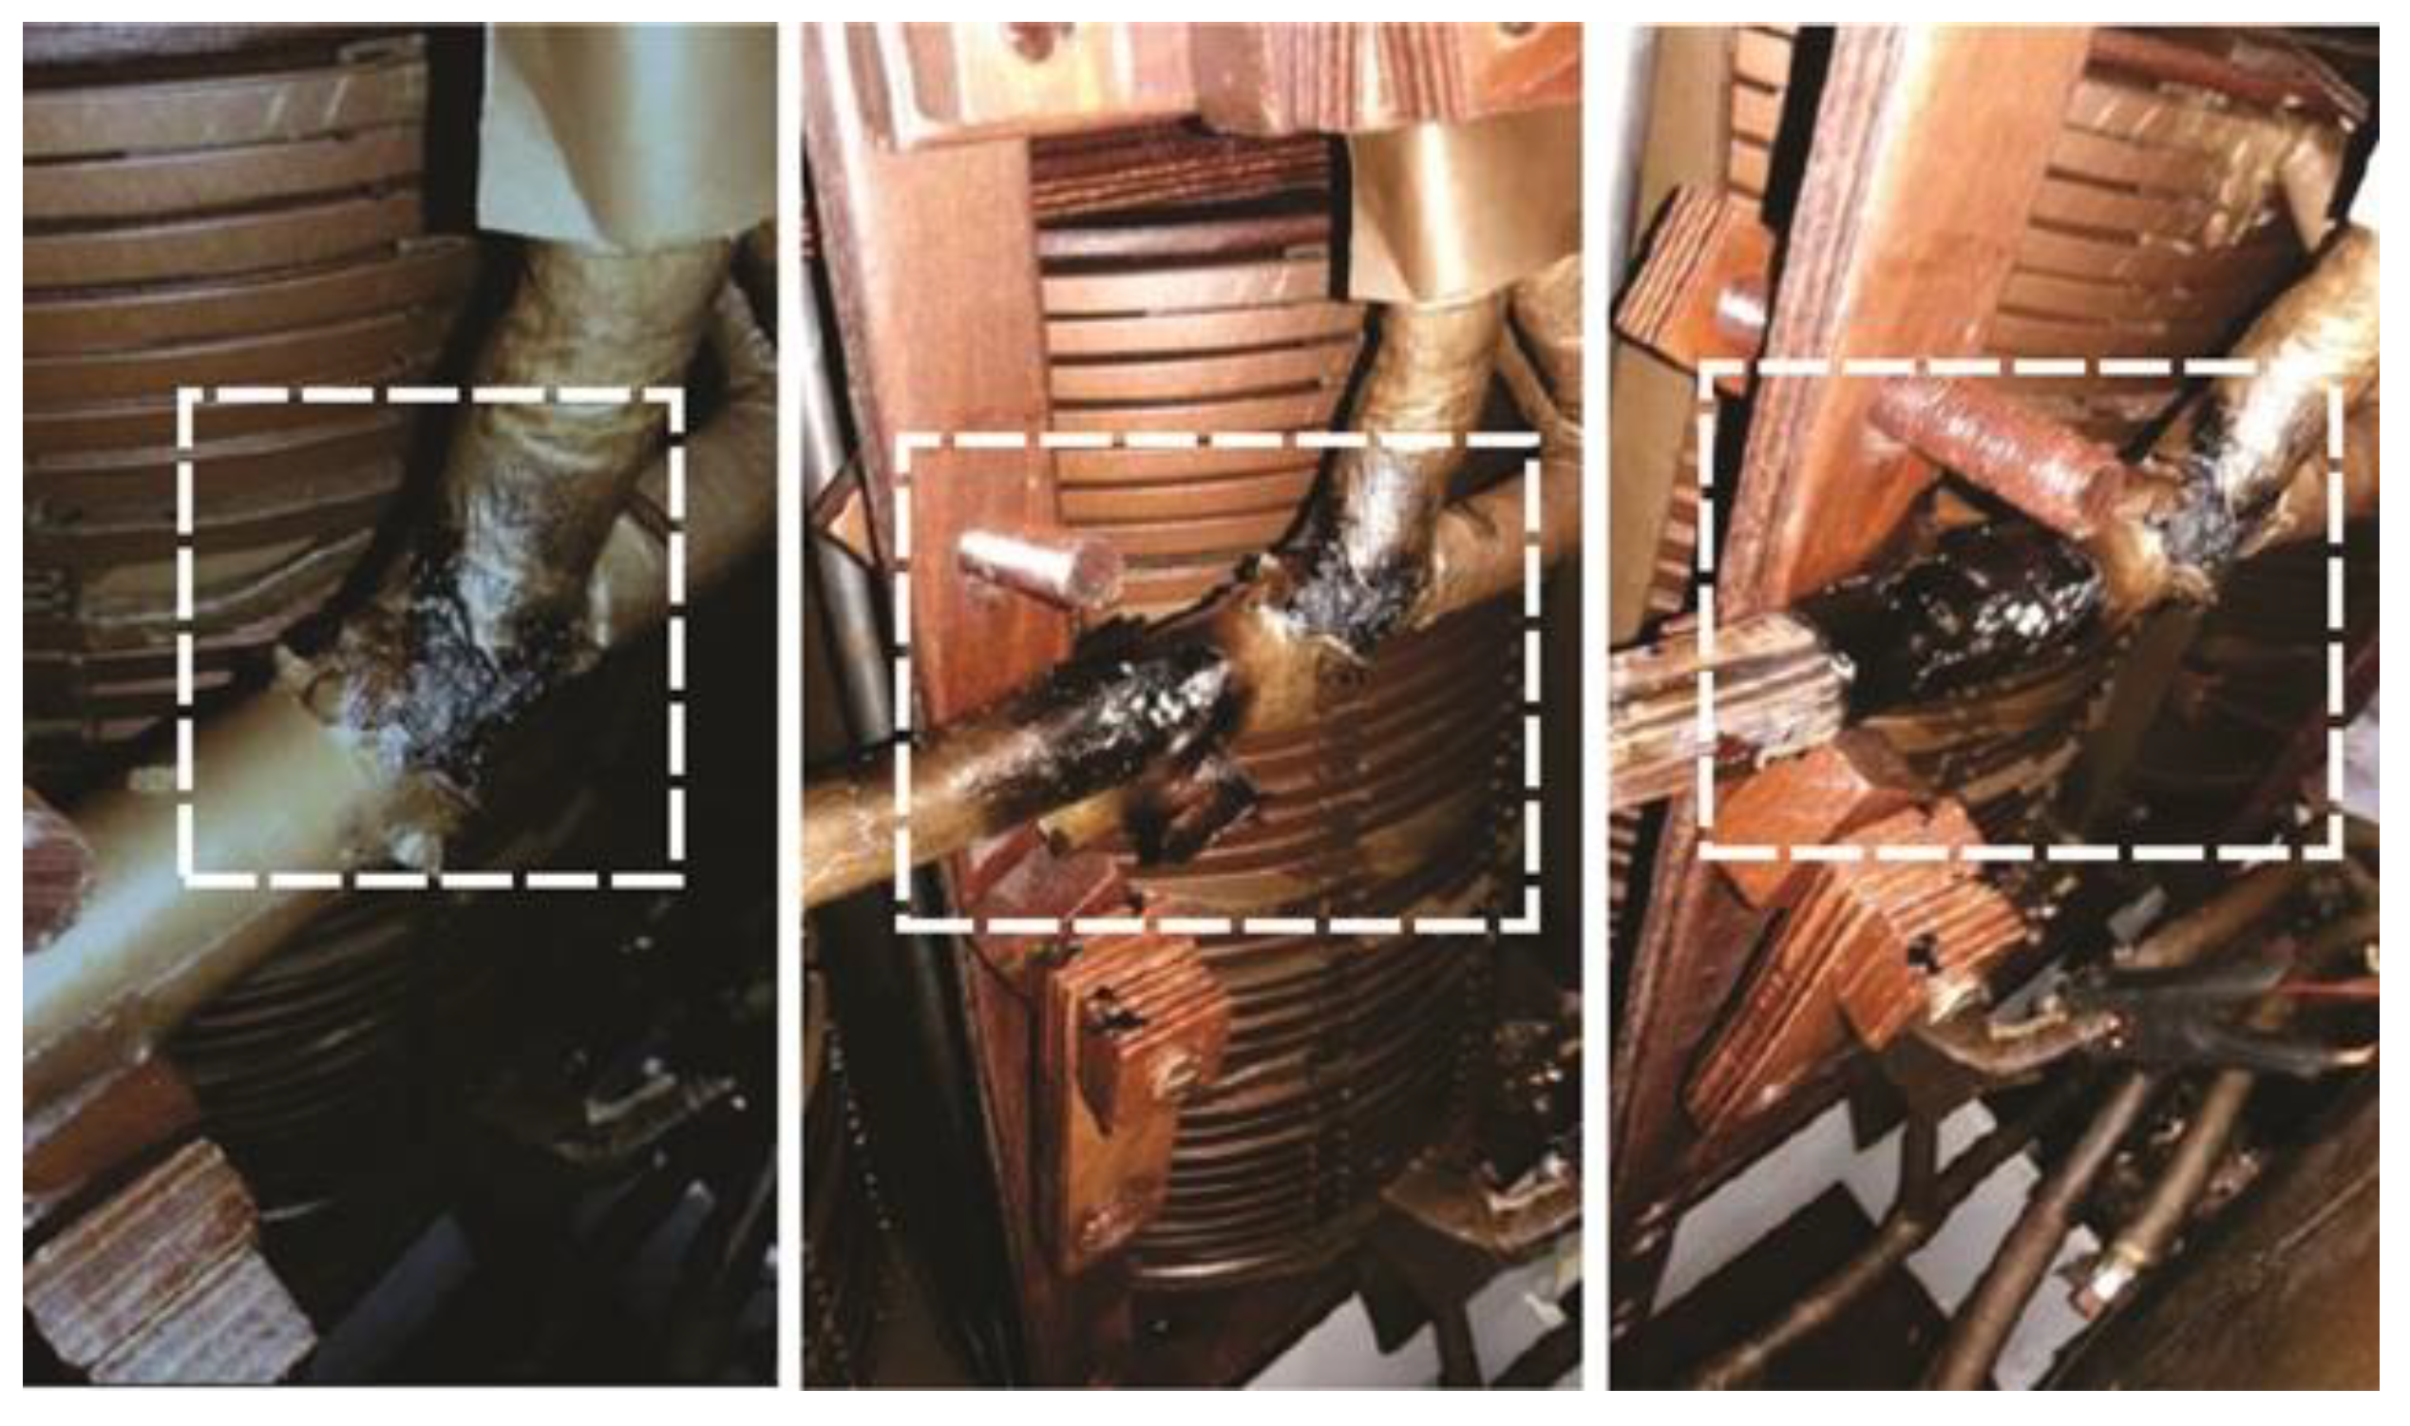
It is noteworthy that the monitoring system presented in this work detected the PDs, but not their origins in the asset. The same observation can be made for the DGA monitor. Thus, as a way of proving that the measurements indicated internal problems in the transformer, a tear-down analysis was conducted. Once this process was carried out, it was possible to identify signs of degradation in the Y connection of the low voltage (LV) windings, as shown in the Figure 27.
This case is interesting to consider, because the discharges detected in the bushings are consequences of a process that has occurred inside the transformer tank. The explanation for this is that the degradation of the LV winding connections caused a deposit of particles in the insulating oil. When this occurs, a series of chemical reactions are initiated inside the transformer tank, increasing the concentration of dissolved gases, as shown in Table 4, and generating small bubbles filled with gases in the insulation. These bubbles, when subjected to an electric field, undergo an ionization process that triggers the formation of PDs inside the tank. Thus, due to the coupling of the internal circuit of the transformer, it is possible to detect such discharges at the tap terminal of the condenser bushings.

4. Conclusions

A monitoring system for detecting partial discharges in power transformers was designed and validated in practical situations. The developed monitoring system is based on the electrical method and uses a capacitive coupling on the test tap of transformer bushings to perform a reading of partial discharges. The measurements were carried out onsite and online; that is, with the equipment in service inside the substation.
For this development to be feasible, a set of restrictions about reliability and data processing were considered. Reliability was achieved by the development of a protection scheme sufficient to guarantee the integrity of the bushing, even in the face of extreme situations caused by lightning surges. Another important development for reliability was the design of the coupling device that guarantees a secure connection to the tap (i.e., that it be free of moisture and contaminating particles). Regarding data processing, it should be highlighted that the proposed methodology was useful in eliminating all events that occur outside the expected frequency range for a PD, improving the assertiveness of the detection.
Based on laboratory tests and field applications, the feasibility of the developed monitoring system to be applied in the continuous monitoring of PDs was noted without any interference or damage to the insulation of the monitored asset. This aspect is one of the biggest concerns in projects that involve connections to the test tap of condenser bushings.
Author Contributions

Conceptualization, L.D.; methodology, L.D., J.G., and G.F.; software, G.F.; validation, L.D., G.F., R.R., E.B., R.C., R.S., and E.T.; formal analysis, R.R. and E.B.; investigation, L.D. and G.F.; resources, J.G. and G.F.; data curation, L.D. and G.F.; writing—original draft preparation, L.D.; visualization, R.R., E.B., R.C., R.S., and E.T.; supervision, J.G., G.F., and E.B.; project administration, J.G., G.F., R.C., and R.S.; funding acquisition, J.G. All authors have read and agreed to the published version of the manuscript.

Funding

This research was funded by Brazilian Electricity Regulatory Agency and Energisa, grant number R&D 05216-1808.

Conflicts of Interest

The authors declare no conflict of interest.

References

  1. Meira, M.; Ruschetti, C.R.; Álvarez, R.E.; Verucchi, C.J. Power Transformers Monitoring Based on Electrical Measurements: State of the Art. IET Gener. Transm. Distrib. 2018, 12, 2805–2815. [Google Scholar] [CrossRef]
  2. Islam, M.M.; Lee, G.; Hettiwatte, S.N. A Review of Condition Monitoring Techniques and Diagnostic Tests for Lifetime Estimation of Power Transformers. Electr. Eng. 2018, 100, 581–605. [Google Scholar] [CrossRef]
  3. Aizpurua, J.I.; Stewart, B.G.; McArthur, S.D.; Lambert, B.; Cross, J.G.; Catterson, V.M. Improved Power Transformer Condition Monitoring under Uncertainty through Soft Computing and Probabilistic Health Index. Appl. Soft Comput. 2019, 85, 1–15. [Google Scholar] [CrossRef]
  4. Tang, W.H.; Wu, Q.H. Condition Monitoring and Assessment of Power Transformers Using Computational Intelligence, 1st ed.; Springer Science & Business: London, UK, 2011; pp. 1–218. [Google Scholar]
  5. Chakravorti, S.; Dey, D.; Chatterjee, B. Recent Trends in the Condition Monitoring of Transformers, 1st ed.; Springer: London, UK, 2013; pp. 1–289. [Google Scholar]
  6. Christina, A.J.; Salam, M.A.; Rahman, Q.M.; Wen, F.; Ang, S.P.; Voon, W. Causes of Transformer Failures and Diagnostic Methods—A Review. Renew. Sustain. Energy Rev. 2018, 82, 1442–1456. [Google Scholar]
  7. Korobeynikov, S.M.; Ovsyannikov, A.G.; Ridel, A.V.; Karpov, D.I.; Lyutikova, M.N.; Kuznetsova, Y.A.; Yassinskiy, V.B. Study of Partial Discharges in Liquids. J. Electrost. 2020, 103, 1–10. [Google Scholar] [CrossRef]
  8. International Electrotechnical Commission (IEC). High-Voltage Test Techniques—Partial Discharge Measurements; Technical Report No. IEC 60270; International Electrotechnical Commission (IEC): Geneva, Switzerland, 2000. [Google Scholar]
  9. Bag, S.; Pradhan, A.K.; Das, S.; Dalai, S.; Chatterjee, B. S-Transform Aided Random Forest Based PD Location Detection Employing Signature of Optical Sensor. IEEE Trans. Power Deliv. 2018, 34, 1261–1268. [Google Scholar] [CrossRef]
  10. Zhou, H.Y.; Ma, G.M.; Wang, Y.; Qin, W.Q.; Jiang, J.; Yan, C.; Li, C.R. Optical Sensing in Condition Monitoring of Gas Insulated Apparatus: A Review. High Volt. 2019, 4, 259–270. [Google Scholar] [CrossRef]
  11. Ma, G.M.; Zhou, H.Y.; Zhang, M.; Li, C.R.; Yin, Y.; Wu, Y.Y. A High Sensitivity Optical Fiber Sensor for GIS Partial Discharge Detection. IEEE Sens. J. 2019, 19, 9235–9243. [Google Scholar] [CrossRef]
  12. Boczar, T.; Cichoń, A.; Wotzka, D.; Kunicki, M.; Kozioł, M. Indicator Analysis of Partial Discharges Measured Using Various Methods in Paper-Oil Insulation. IEEE Trans. Dielectr. Electr. Insul. 2017, 24, 120–128. [Google Scholar] [CrossRef]
  13. Nagi, Ł.; Kozioł, M.; Kunicki, M.; Wotzka, D. Using a Scintillation Detector to Detect Partial Discharges. Sensors 2019, 19, 4936. [Google Scholar] [CrossRef] [PubMed] [Green Version]
  14. Samimi, M.H.; Ilkhechi, H.D. Survey of Different Sensors Employed for the Power Transformer Monitoring. IET Sci. Meas. Tech. 2019, 14, 1–8. [Google Scholar] [CrossRef]
  15. Zhang, X.; Shi, M.; Cai, J.; Li, J. A Novel Partial Discharge Detection Method for Power Transformers on Site Adopting Its Component as Ultra-High Frequency Sensor. IEEE Trans. Power Deliv. 2019, 34, 2269–2271. [Google Scholar] [CrossRef]
  16. Kunicki, M.; Cichoń, A.; Borucki, S. Measurements on Partial Discharge in On-Site Operating Power Transformer: A Case Study. IET Gen. Trans. Dist. 2018, 12, 2487–2495. [Google Scholar] [CrossRef]
  17. Firuzi, K.; Vakilian, M.; Phung, B.T.; Blackburn, T. Transformer Components Impact on Compatibility of Measured PDs: Comparison of IEC60270 and RF Methods. High Volt. 2019, 4, 33–40. [Google Scholar] [CrossRef]
  18. Xu, Y.; Liu, W.; Gao, W.; Zhang, X.; Wang, Y. Comparison of PD Detection Methods for Power Transformers-Their Sensitivity and Characteristics in Time and Frequency Domain. IEEE Trans. Dielectr. Electr. Insul. 2016, 23, 2925–2932. [Google Scholar] [CrossRef]
  19. Fuhr, J.; Aschwanden, T. Identification and Localization of PD-Sources in Power-Transformers and Power-Generators. IEEE Trans. Dielectr. Electr. Insul. 2017, 24, 17–30. [Google Scholar] [CrossRef]
  20. Tostrud, M. Analysis of Partial Discharges Detected in 420kV OIP Bushings. In Proceedings of the 2017 INSUCON—13th International Electrical Insulation Conference (INSUCON), Birmingham, UK, 16–18 May 2017; pp. 1–5. [Google Scholar]
  21. Wang, H.; Cheng, J.; Ding, D.; Liu, W.; He, L. A Feasibility Study on Bushing Tap UHF Sensing Method for Partial Discharge in Transformer. In Proceedings of the 2018 Condition Monitoring and Diagnosis (CMD), Perth, WA, Australia, 23–26 September 2018; pp. 1–4. [Google Scholar]
  22. Nekahi, A.; Stewart, B.G.; McMeekin, S.G. Electric Field Distribution on the Outer Surface of Lower Porcelain of an OIP Transformer Bushing-Accumulation of Metal-Contained Colloid. In Proceedings of the 2015 IEEE 11th International Conference on the Properties and Applications of Dielectric Materials (ICPADM), Sydney, NSW, Australia, 19–22 July 2015; pp. 632–635. [Google Scholar]
  23. Cigrè. Transformer Bushing Reliability. In Technical Brochures; Cigrè: Paris, France, 2019; pp. 1–24. [Google Scholar]
  24. Setayeshmehr, A.; Akbari, A.; Borsi, H.; Gockenbach, E. On-Line Monitoring and Diagnoses of Power Transformer Bushings. IEEE Trans. Dielectr. Electr. Insul. 2006, 13, 608–615. [Google Scholar] [CrossRef]
  25. Kuffel, E.; Zaengl, W.S.; Kuffel, J. High Voltage Engineering: Fundamentals, 2nd ed.; Butterworth-Heinemann: Woburn, MA, USA, 2000; pp. 1–552. [Google Scholar]
  26. IEEE Std. C57.113-2010. IEEE Recommended Practice for Partial Discharge Measurement in Liquid-Filled Power Transformers and Shunt Reactors. Available online: https://ieeexplore.ieee.org/document/5557722 (accessed on 20 June 2020).
  27. Wang, D.; Zhou, L.; Dai, C.; Guo, L.; Liao, W. Insulation Defect Diagnostic Method for OIP Bushing Based on Multiclass LS-SVM and Cuckoo Search. IEEE Trans. Instrum. Meas. 2019, 69, 163–172. [Google Scholar] [CrossRef]
  28. Wang, D.; Zhou, L.; Liao, W.; Wang, A.; Xu, X.; Guo, L. Moisture Estimation for Oil-Immersed Bushing Based on FDS Method: Field Application. IET Gen. Trans. Dist. 2018, 12, 2762–2769. [Google Scholar] [CrossRef]
  29. Mikulecky, A.; Stih, Z. Influence of Temperature, Moisture Content and Ageing on Oil Impregnated Paper Bushings Insulation. IEEE Trans. Dielectr. Electr. Insul. 2013, 20, 1421–1427. [Google Scholar] [CrossRef]
  30. IEEE Std. C57.113–1991. IEEE Guide for Partial Discharge Measurement in Liquid-Filled Power Transformers and Shunt Reactors. Available online: https://ieeexplore.ieee.org/document/8705054 (accessed on 20 June 2020).
Figure 1. Internal structure of a condenser bushing.
Energies 13 04351 g001
Figure 2. Electrical method scheme for partial discharge measurement.
Energies 13 04351 g002
Figure 3. Structure of an online monitoring system.
Energies 13 04351 g003
Figure 4. Coupling device.
Energies 13 04351 g004
Figure 5. Rubber O-rings on the coupling device to prevent moisture during the test tap.
Energies 13 04351 g005
Figure 6. Circuit implemented in the printed circuit board (PCB) for the acquisition of partial discharges (PDs) and protection against surges.
Energies 13 04351 g006
Figure 7. Internal circuit of the coupling device with equivalent representations of the protective elements and cable.
Energies 13 04351 g007
Figure 8. AC transfer characteristics of the coupling device.
Energies 13 04351 g008
Figure 9. Scheme for communication.
Energies 13 04351 g009
Figure 10. Identification of peaks of partial discharges.
Energies 13 04351 g010
Figure 11. Flowchart for the calculation of apparent charge.
Energies 13 04351 g011
Figure 12. Laboratory tests. (a) Testing structure. (b) Coupling device connected to the transformer bushing.
Energies 13 04351 g012
Figure 13. Phase resolved partial discharge (PRPD) in laboratory test.
Energies 13 04351 g013
Figure 14. Application of RMS 79.8 kV to the bushing.
Energies 13 04351 g014
Figure 15. Application of RMS 119.5 kV to the bushing.
Energies 13 04351 g015
Figure 16. Application of a 1.2/50 µs impulse at bushing’s terminal with peak of −356 kV.
Energies 13 04351 g016
Figure 17. Radio interference voltage (RIV) in coupling device for nominal phase-to-ground voltage on the bushing.
Energies 13 04351 g017
Figure 18. RIV in coupling device for overvoltage on the bushing.
Energies 13 04351 g018
Figure 19. Online monitoring system installed in a 30 MVA power transformer.
Energies 13 04351 g019
Figure 20. Coupling devices connected in high voltage (HV) bushings.
Energies 13 04351 g020
Figure 21. Internal components of the cabinet.
Energies 13 04351 g021
Figure 22. Signal with PD acquired from the test tap of bushing of phase A.
Energies 13 04351 g022
Figure 23. PDs in frequency domain.
Energies 13 04351 g023
Figure 24. Phase angles of PD occurrences.
Energies 13 04351 g024
Figure 25. Apparent charge monitored over a day for a defect-free transformer.
Energies 13 04351 g025
Figure 26. PD pulse at 1.5 MHz.
Energies 13 04351 g026
Figure 27. Degradation in the physical connection of the low voltage (LV) windings.
Energies 13 04351 g027
Table 1. Component specifications of the printed circuit board (PCB).
Component V D R M   ( V ) I P P   ( A )
TH115400
TH2302500
TH31405000
GDT25040,000
Table 2. Equivalent capacitance of PCB components.
ComponentCapacitance
TH172 pF
TH2150 pF
TH3650 pF
GDT2 pF
Cable101 pF/m
Table 3. Specifications of the acquisition unit.
CharacteristicValue
Sample rate2.5 GS/s
Vertical resolution10-bit
BandwidthUp to 200 MHz
Temperature0–50 °C
Table 4. Gases dissolved in oil.
GasConcentration Dissolved in Oil (ppm)
Day 1Day 2Day 3
Hydrogen (H2)59276327
Oxygen (O2)3980923014,700
Nitrogen (N2)15,65060,14052,620
Methane (CH4)58296280
Carbon monoxide (CO)100258256
Carbon dioxide (CO2)97227101756
Ethylene (C2H4)16389564
Ethane (C2H6)19180132
Acetylene (C2H2)-46
Table 5. PD measurements on day 3.
HV BushingMaximum Positive PD (pC)Maximum Negative PD (pC)Number of PDsAverage Value of PDs (pC)
Phase A2164.50−2811.391758950.89
Phase B74.25−82.2059439.83
Phase C8664.31−8721.3516064294.83