1. Introduction
Power transformers constitute one of the main devices in a Transmission and Distribution (T&D) infrastructure, since they demand high financial investment and represent a link between different voltage classes [
1,
2]. Therefore, the reliability of these assets, which is related to their fault-free operation, is an important aspect to be considered in the system operation [
3].
Faults in power transformers are generally catastrophic and lead to internal damage, which may be irreversible, since they occur mainly in the insulation systems of the equipment and may interrupt the power flow [
4]. In this context, a crucial issue for ensuring the reliability of a power transformer and, consequently, its safe operation, is the monitoring of the insulation of this asset and its ancillary equipment such as bushings or load tap changers, which may involve, for example, dissolved gas analysis (DGA), partial discharge (PD) detection, and thermal analysis [
5,
6].
Monitoring of T & D equipment covers the measurement of basic parameters that influence the proper functioning of the asset. Typical monitoring systems perform the integration and data collection of sensors to detect evidence of failures, issue warnings of abnormal level quantities, design trend curves, and correlate events to trigger maintenance staff [
6]. Particularly, this work focuses on partial discharge monitoring that is largely efficient in the analysis of the insulation conditions [
7].
Partial discharges may occur under normal operating conditions of the equipment, due to small cavities filled by gases present in a solid dielectric [
7], which are usually caused by the following factors: (i) design failures, which can cause dielectric stresses; (ii) failures in the lamination process; (iii) inadequate transportation and installation; (iv) dielectric contamination; and (v) natural wear of insulation layers. The existence of these cavities causes ionization of the gases when the material is subjected to an electric field, causing a high-frequency discharge of less than 1 µs duration, which, depending on its intensity, can be highly destructive [
5]. Thus, according to IEC-60270 [
8], a PD is defined as a localized electrical discharge that only partially bridges the insulation between conductors and which may or may not occur adjacent to a conductor. When PD occurs, several physical phenomena are generated. This fact allows the PD activity to be detected by several methods [
4].
In the optical method, light-sensing devices are applied to identify the optical signals emitted by PDs, whose wavelengths can vary in the spectrum from ultraviolet to infrared [
9]. In this technique, the main advantages are low interference from electromagnetic (EM) waves and high sensitivity [
10]. These characteristics, however, may vary according to the technology of the applied sensors. Regarding the disadvantages, the invasive characteristics of this method, specifically the necessity to position the optical sensor in the vicinity of the PD, should be mentioned. This can be a difficult task because this area is generally not known and the locations of installation of a sensor inside a transformer tank can be limited by its construction characteristics [
11,
12]. Additionally, an important peculiarity regarding the optical method is that the condition of the dielectric material influences the sensitivity of the measurement. Thus, as power transformers have oil in the insulation system and the oil can suffer contamination by gases or solid particles throughout its lifetime, detecting light signals emitted by PDs can become a difficult task [
13].
In the acoustic method, suitable sensors are used to capture the acoustic effects of partial discharge activities that generally occur in the 20–500 kHz frequency range. However, most sensors currently used operate in the central frequency range equal to 60–150 kHz, the latter being more appropriate for field applications [
14]. The main advantages of this method are the great immunity to EM interferences, its non-invasiveness (since that sensors can be installed on the surface of the transformer tank), and the potential to locate PDs when several sensors are employed. On the other hand, the disadvantages are the impossibility of calibration, attenuations that occur in the acoustic waves, and time consumption [
5].
The Ultra High Frequency (UHF) method is based on the detection of EM emissions that originated by PD activities via specific antennas [
14]. In this case, the main advantages presented are the high immunity to noise, which facilitates field application, and the ability to locate PDs. However, the difficulties are related to the impossibility of calibration, the lack of flexibility for installation of the antennas (which often depend on the structure of the transformer), and the high costs of the measurement components [
5,
15].
Finally, the electrical method allows the detection of PDs in the insulation through current or voltage pulses that occur within a limited frequency range, which is typically limited to a few MHz [
16]. This method stands out for its high sensitivity, and presents the benefit of allowing the calibration of the measurements so that it is possible to accurately determine the severity of the detected PD occurrences. However, to ensure such accuracy, the calibration should be performed in a reliable range of the transformer’s response. This is important in order to avoid attenuations or unknown reflections in PD signals. Regarding the difficulties, they relate to the presence of noise in the signal acquisition and the inability to locate defect points [
17,
18].
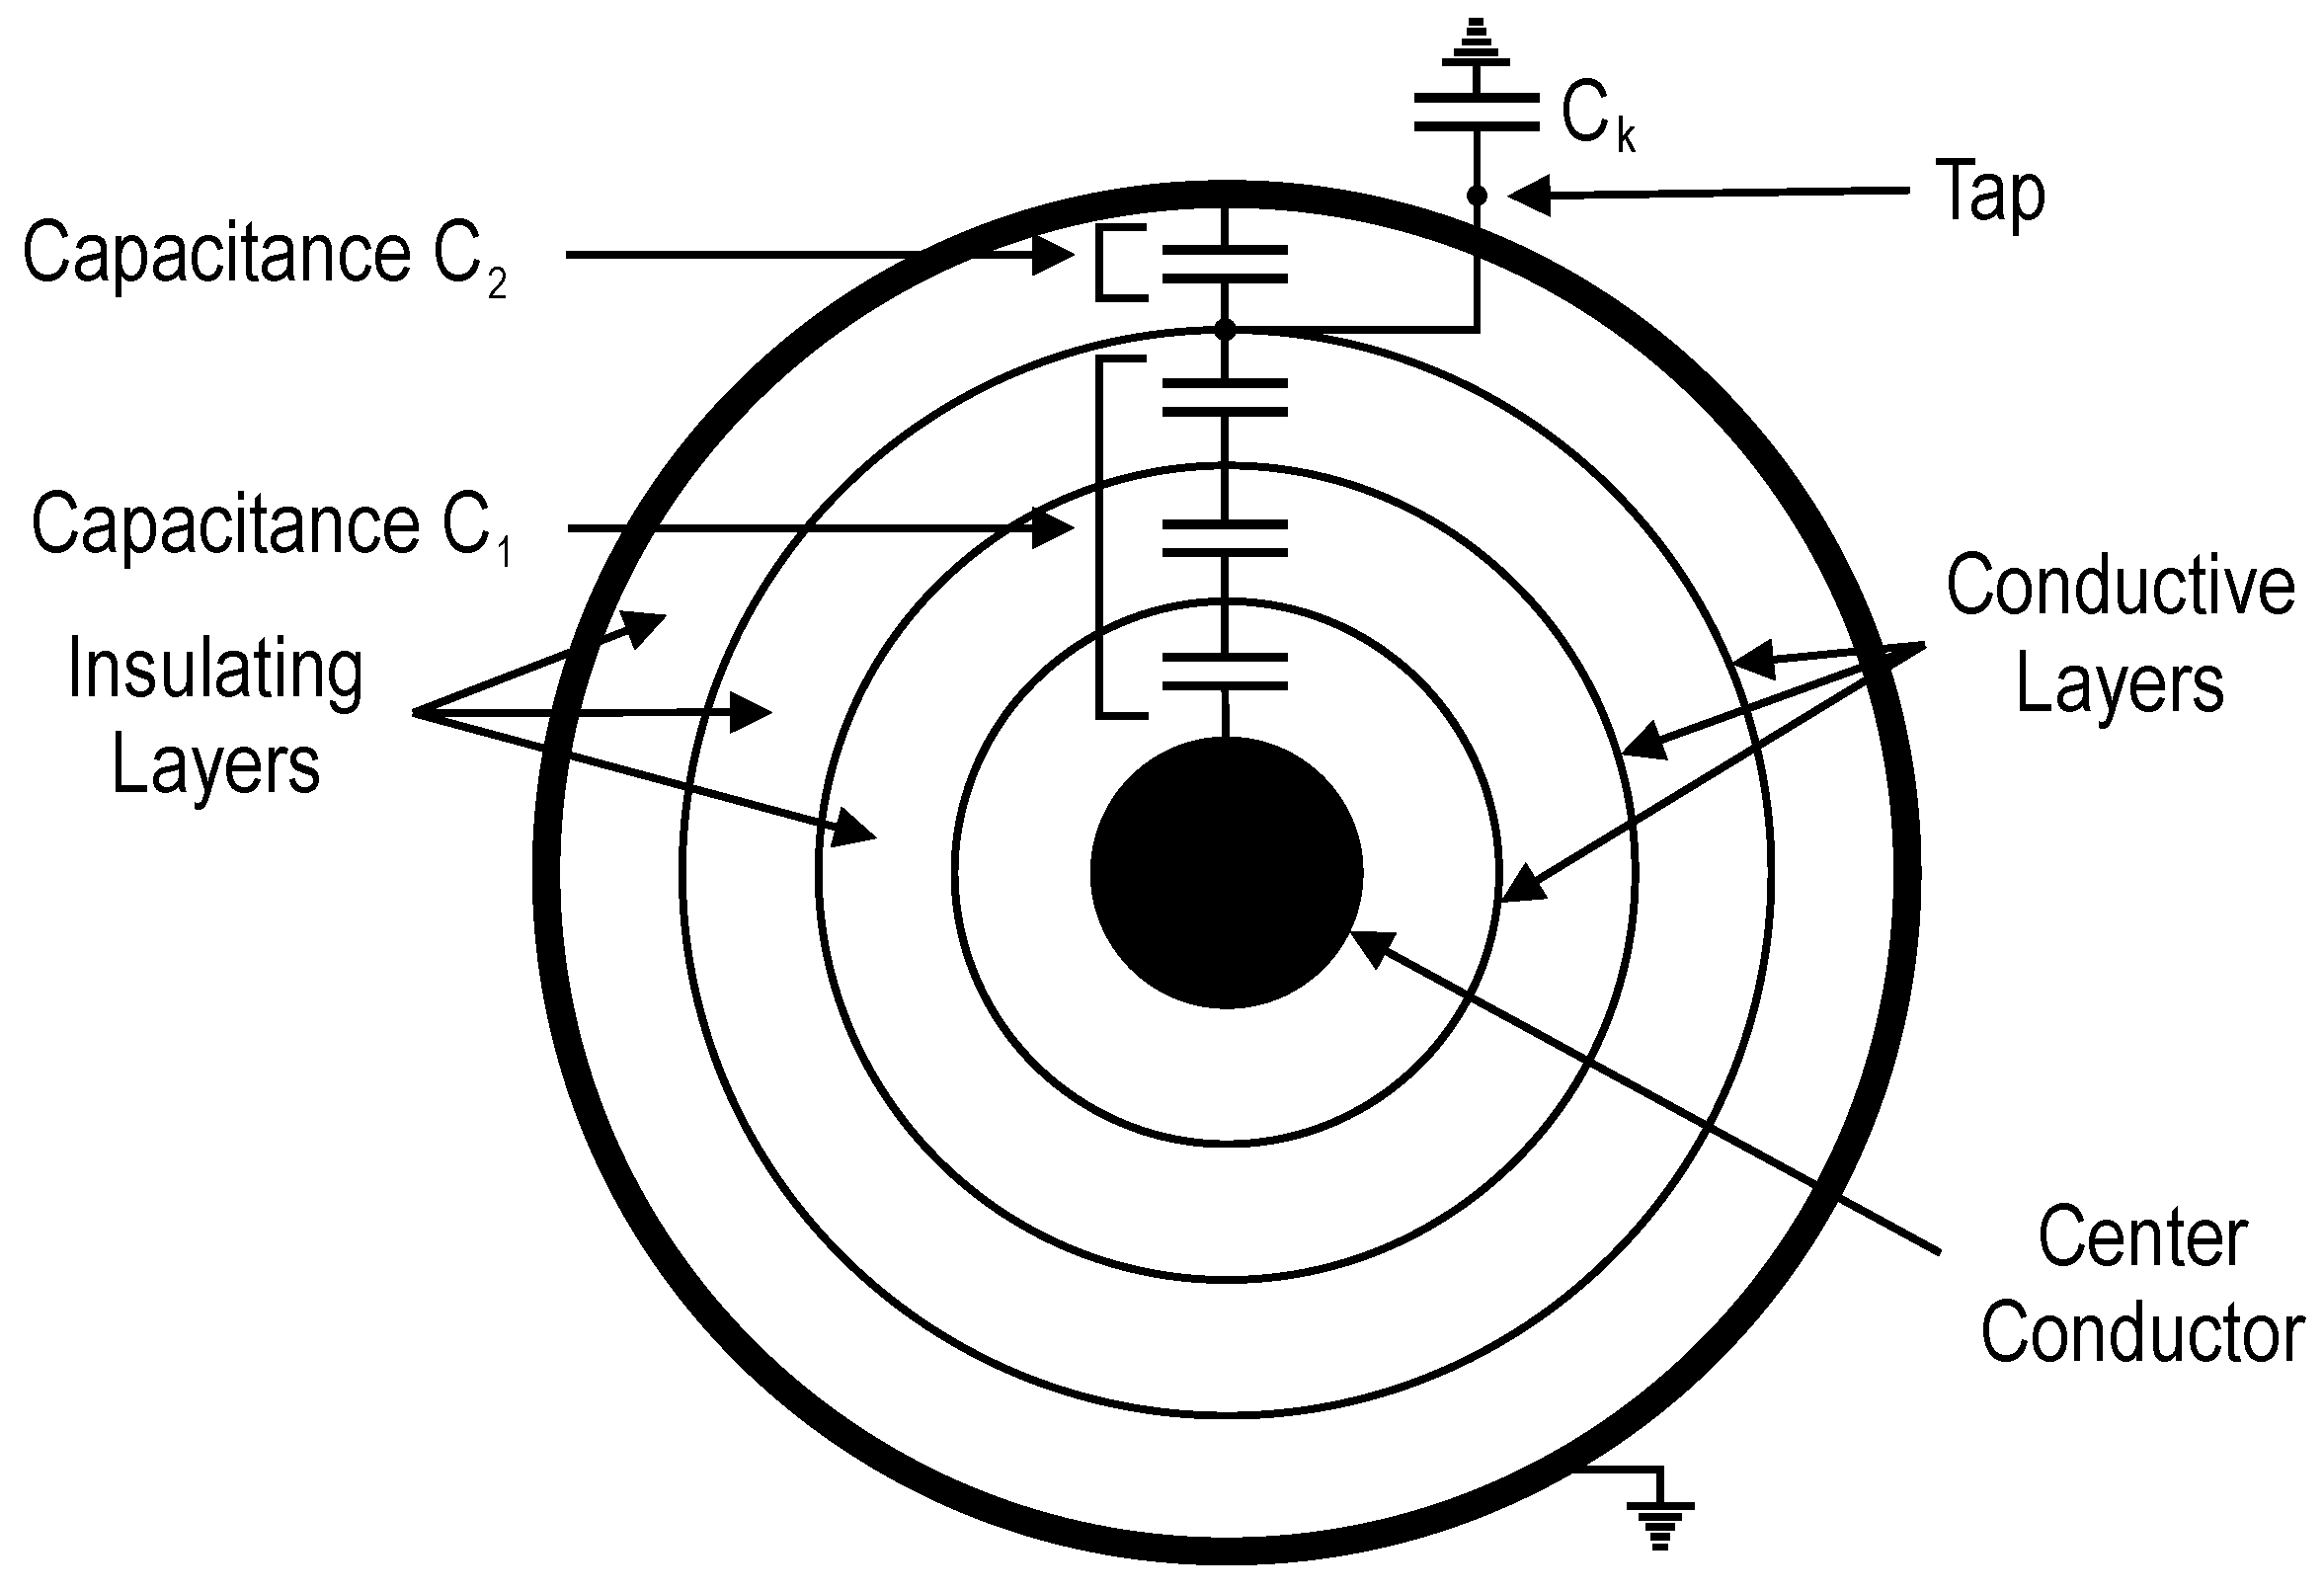
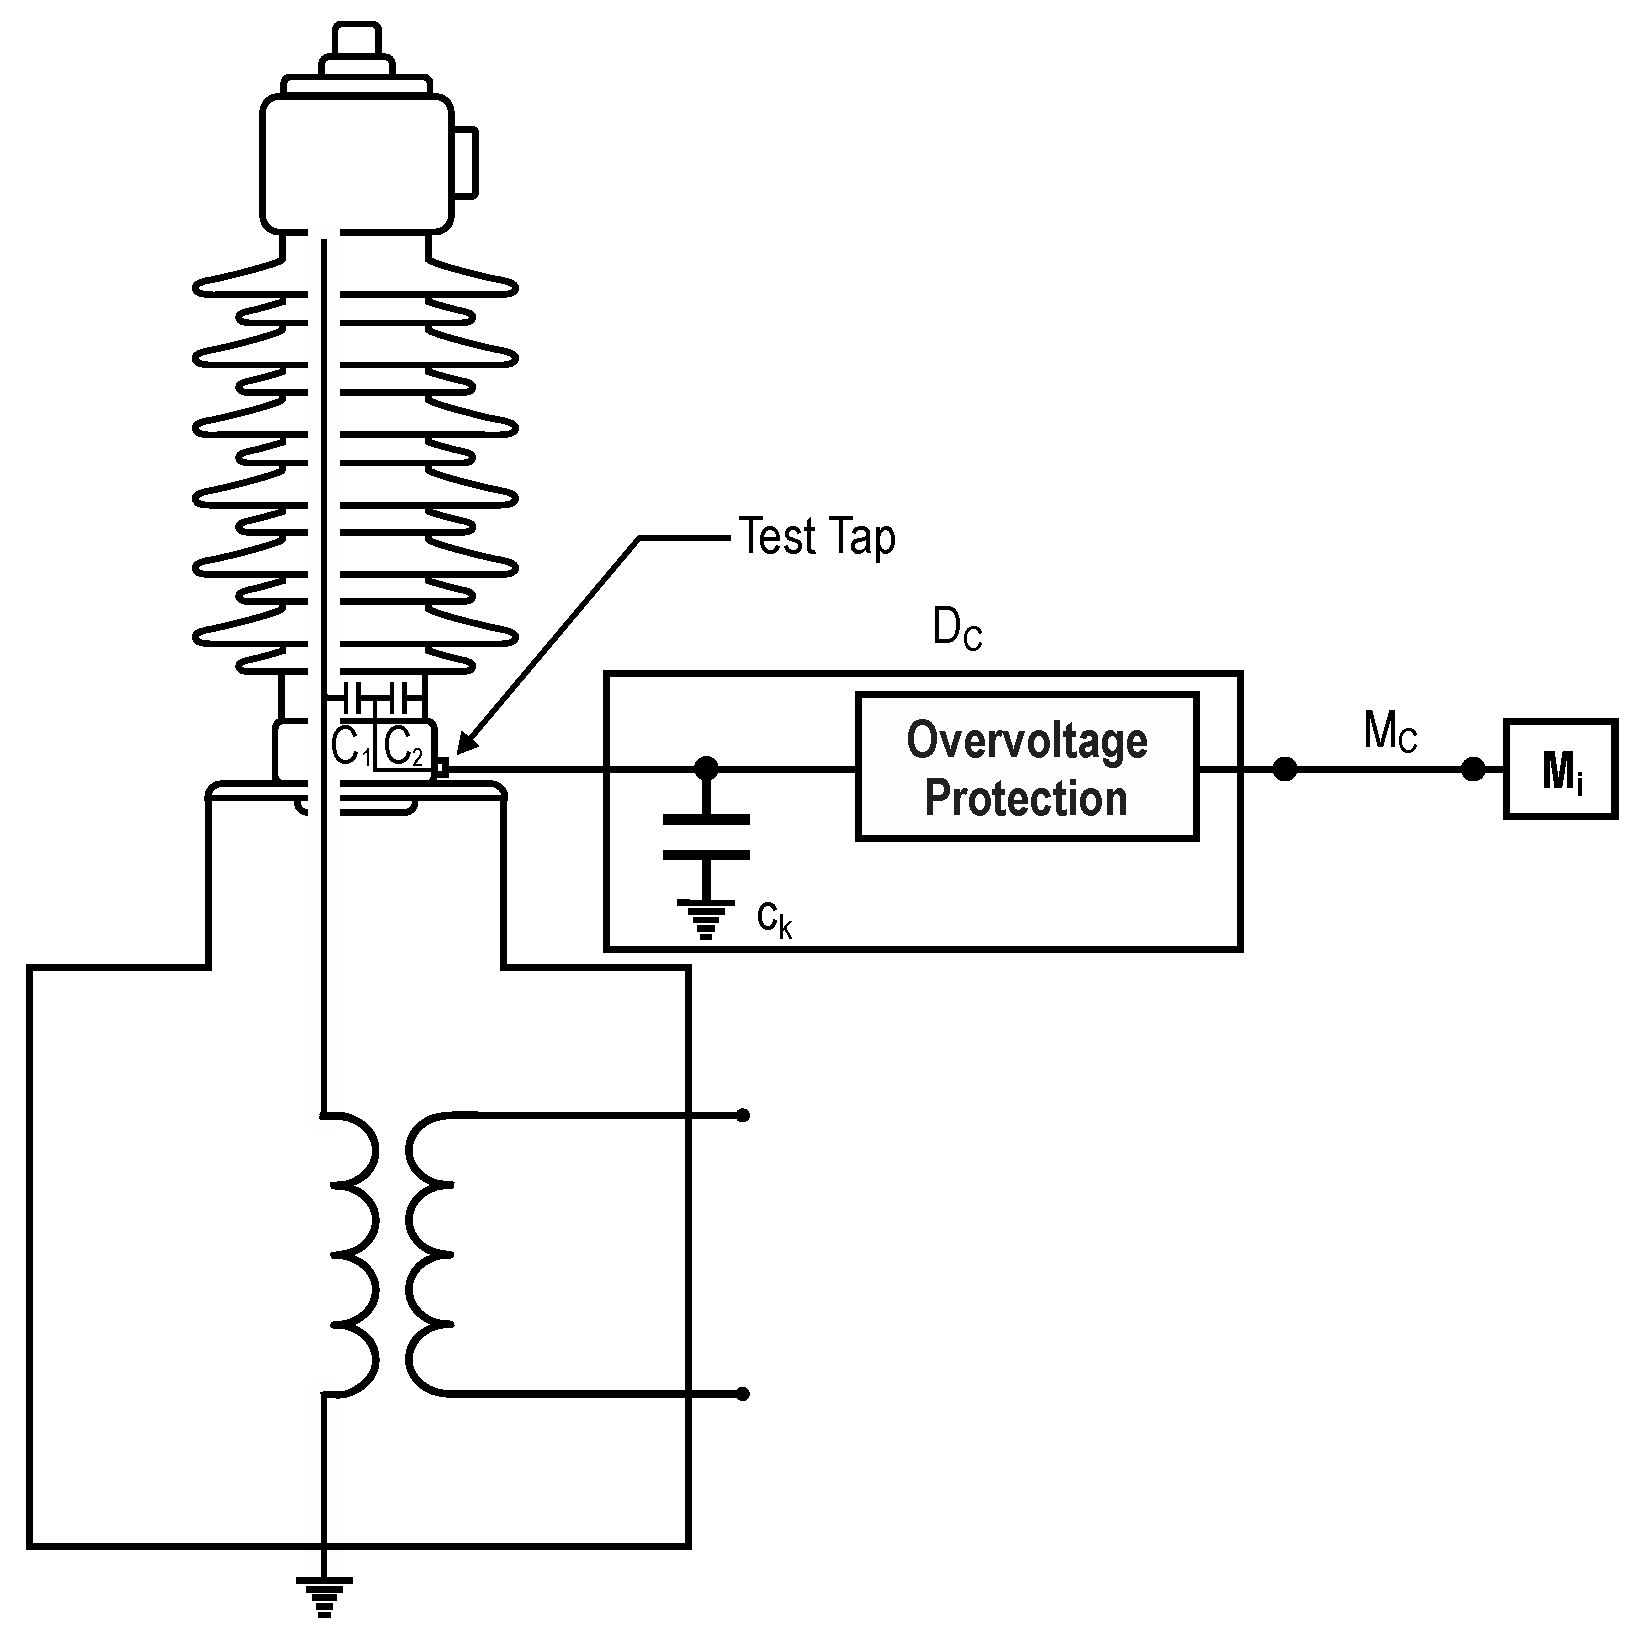
By using the latter method, this work presents the development of an online monitoring system with a high sampling rate and vertical resolution that can detect PD activities in power transformers from the capacitive coupling in the test taps of high voltage (HV) condenser bushings. Performing measurements from the tap terminal has the key benefit of detecting the occurrence of PDs not only in the insulation of the bushings but also in the insulation of the windings due to the capacitive and inductive coupling of the intrinsic elements of a transformer.
Since the electrical method is commonly used for the acceptance of equipment in a laboratory environment due to its accuracy and sensitivity [
18], it is a good practice to adapt it for online monitoring. For this, however, some special aspects such as reducing external interference in data processing and ensuring the reliability of the designed equipment must be considered.
Thus, an important contribution of this work is the application of a methodology that can differentiate the PDs from external noise through a computational routine that does not cause attenuation in the measured signal and demonstrates fast processing (because it does not require the use of cascade filters or transform calculations). This is a relevant task for practical online monitoring applications since data must be processed repeatedly.
Another contribution is the presentation of an exceptionally reliable coupling device for condenser bushings that guarantees the integrity of the monitored asset even in extreme situations in the power system, such as lightning surges. Such protection in the tap coupling is a fundamental requirement so that the monitoring system can operate continuously in substations. As there has been a lack of developments of this type in the literature, this work can complement the developments presented in [
19,
20,
21], which also deal with coupling on the tap of transformer bushings.
In order to validate the development, the monitoring system was subjected to intense high voltage tests in laboratory and then applied in substations for monitoring different 30 MVA power transformers with primary voltages of 138 kV.
3. Results and Discussion
3.1. Laboratory Tests
Prior to field application of the monitoring system, a set of tests was performed to: (i) validate PD detection; (ii) assess whether inserting the coupling device would weaken the dielectric property of the bushing under high voltage stress; and (iii) check whether EM interference can impair the acquisition of signals collected from the test tap.
The structure used to perform the tests is shown in
Figure 12.
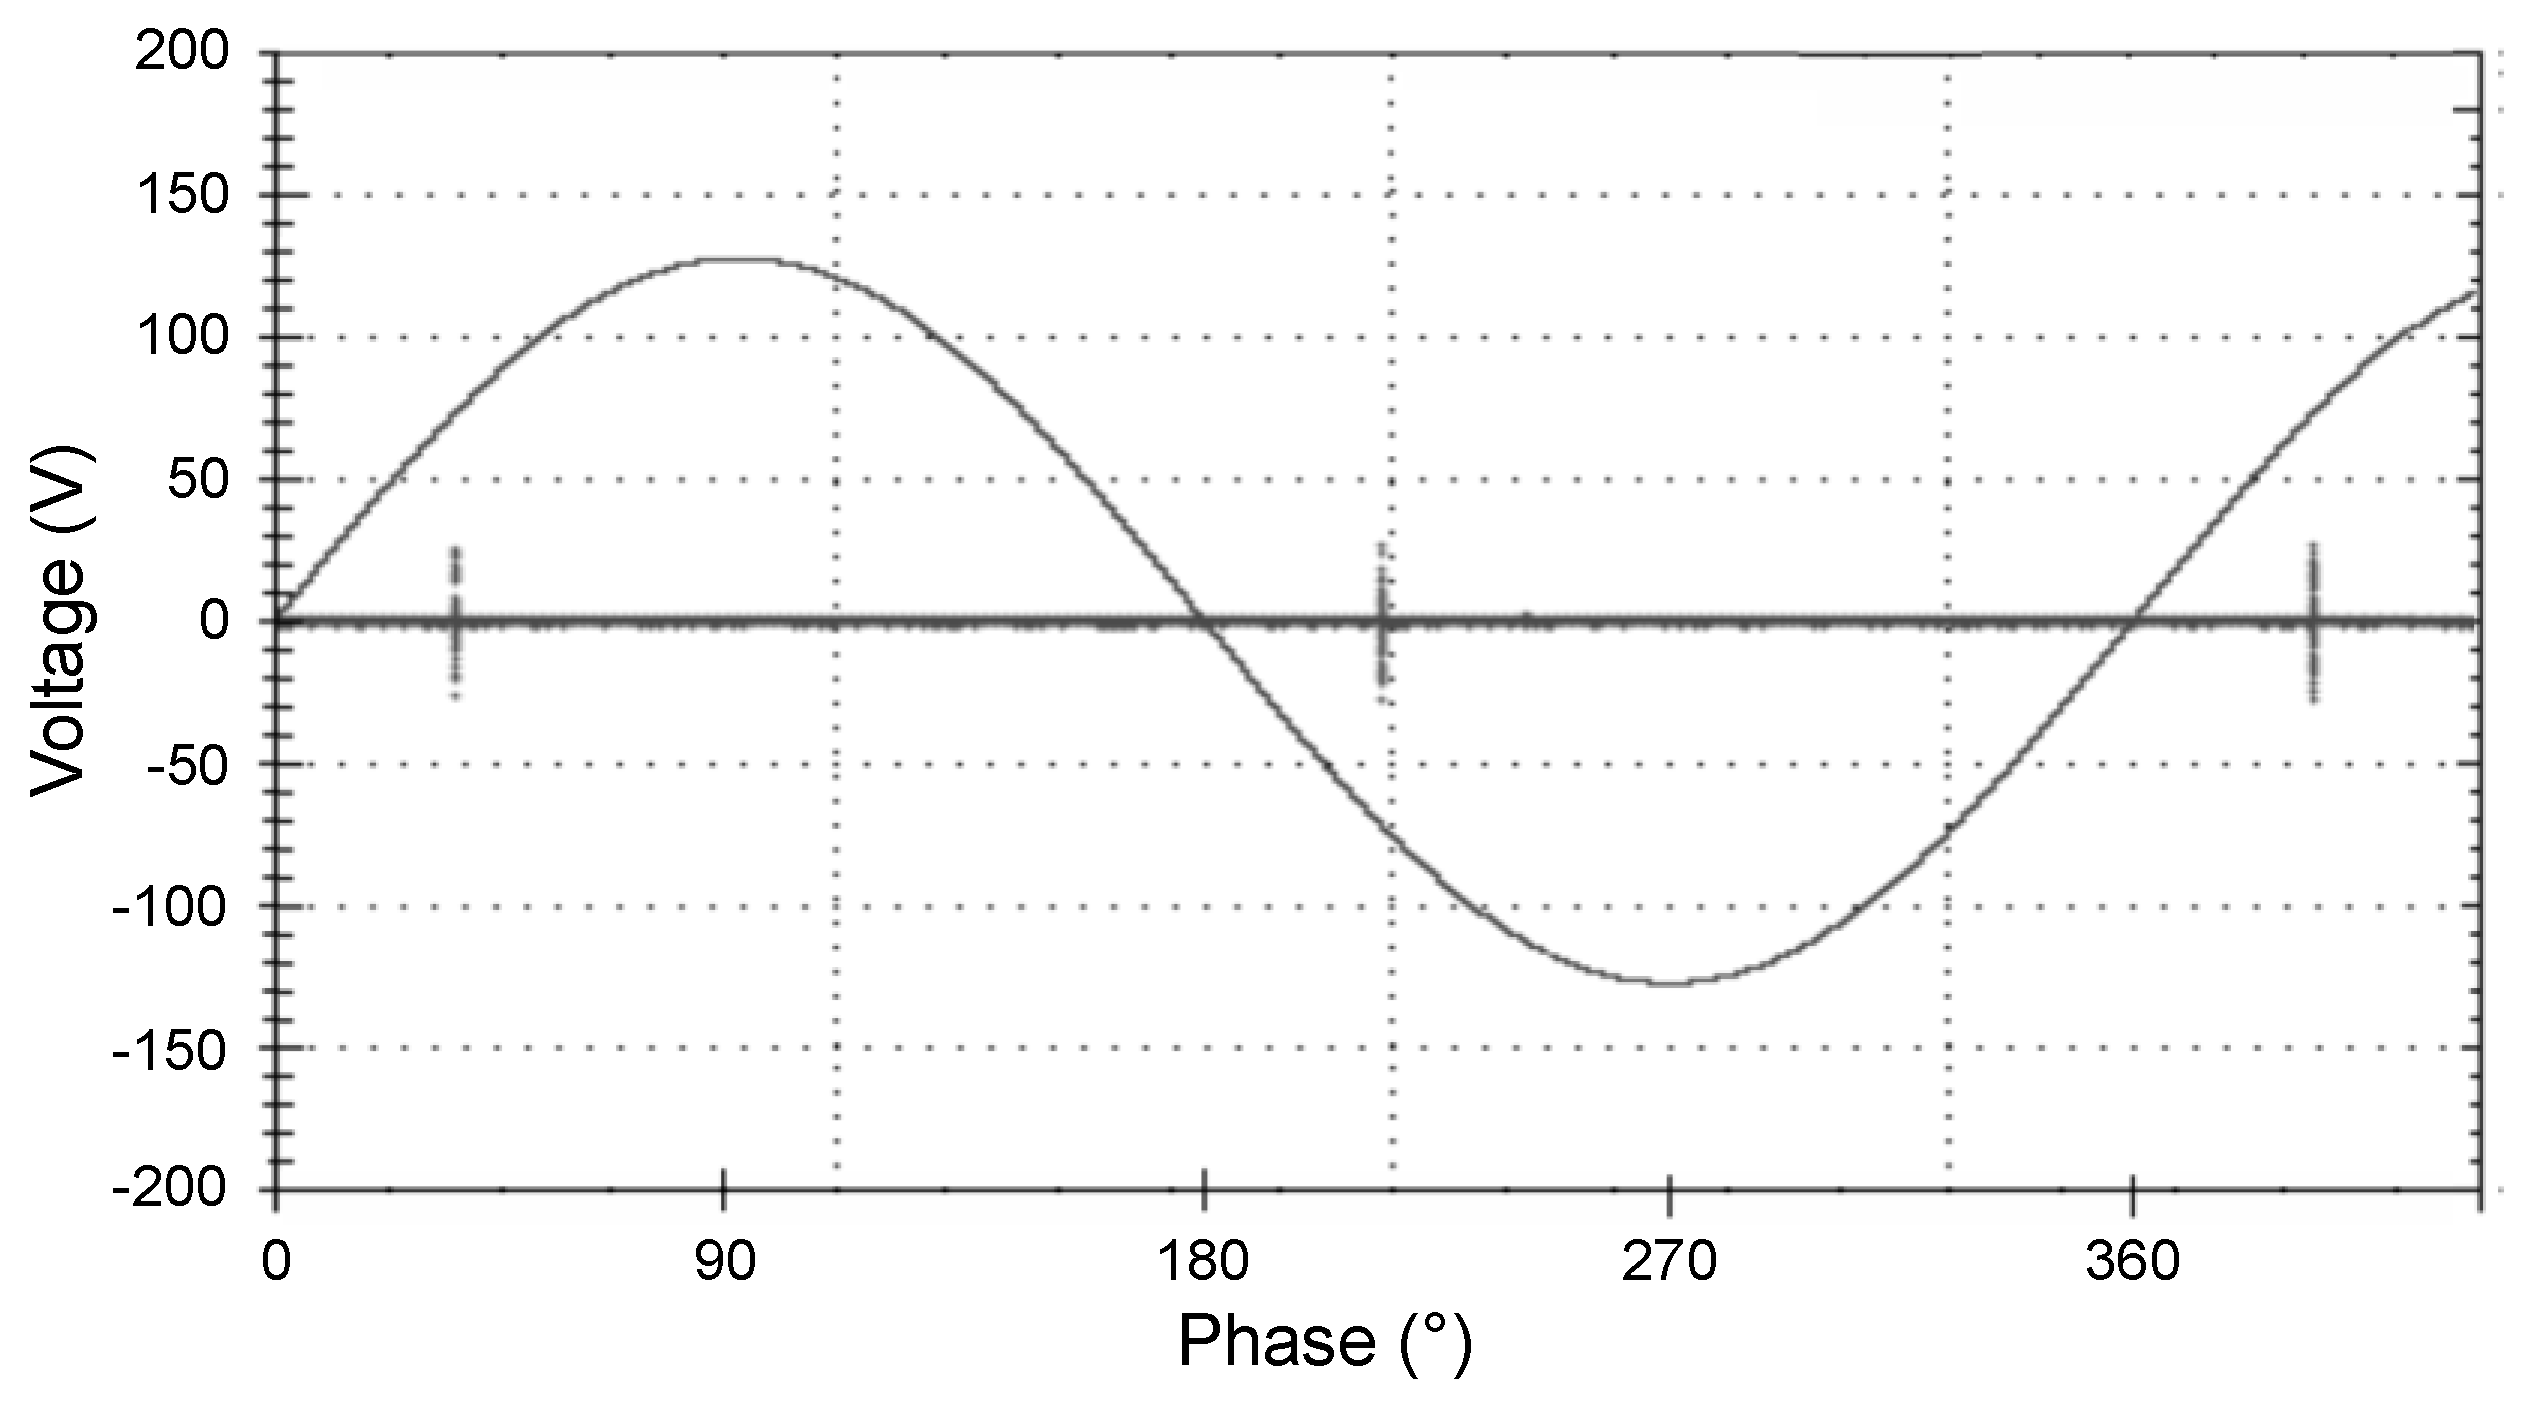
In order to validate the sensing of high-frequency signals through the coupling device as well as the proposed methodology to identify the PD peaks, a partial discharge test was carried out in a laboratory. For this purpose, a current pulse generator was connected to the bushing’s terminal to simulate PDs in the insulation. As an example of the PD detection, a phase resolved partial discharge (PRPD) graph is shown in
Figure 13 that was obtained during the test, from which it is possible to verify the capability of the developed equipment to detect narrow discharges.
In addition to the efficiency in detecting partial discharges, a fundamental issue for the application of an online monitoring system relates to its supportability to electrical stresses that can occur in the monitored asset. Thus, the applied voltage and lightning impulse tests were conducted in order to verify the reliability of the equipment in the face of 60 Hz overvoltage and electrical transients.
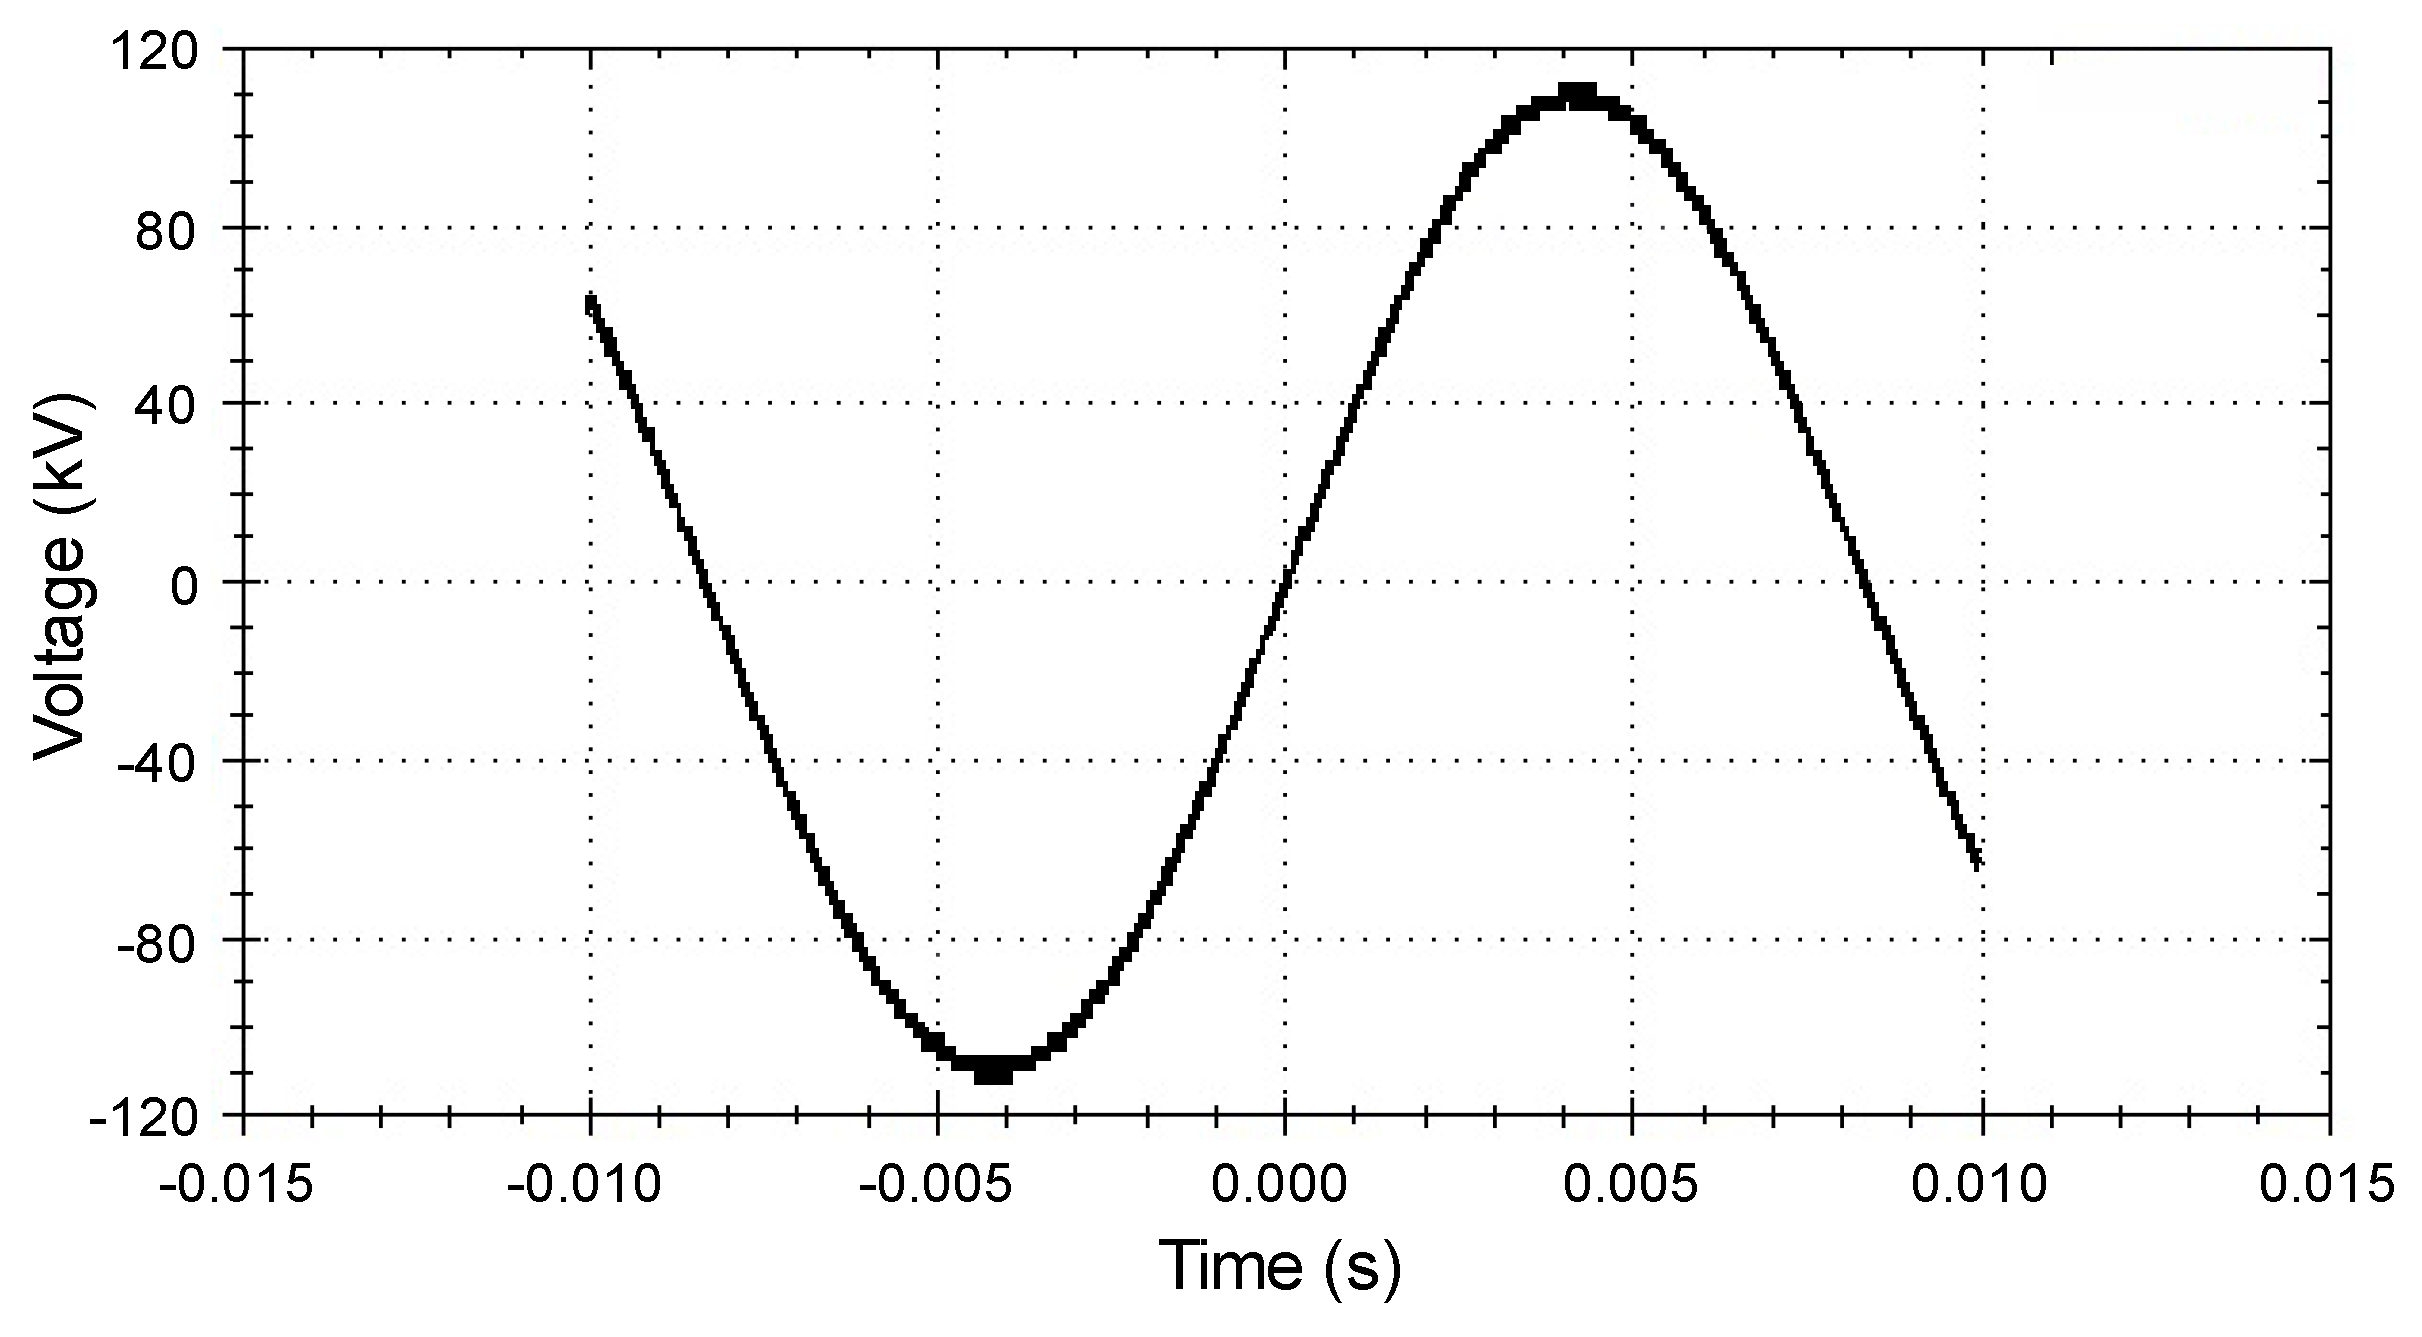
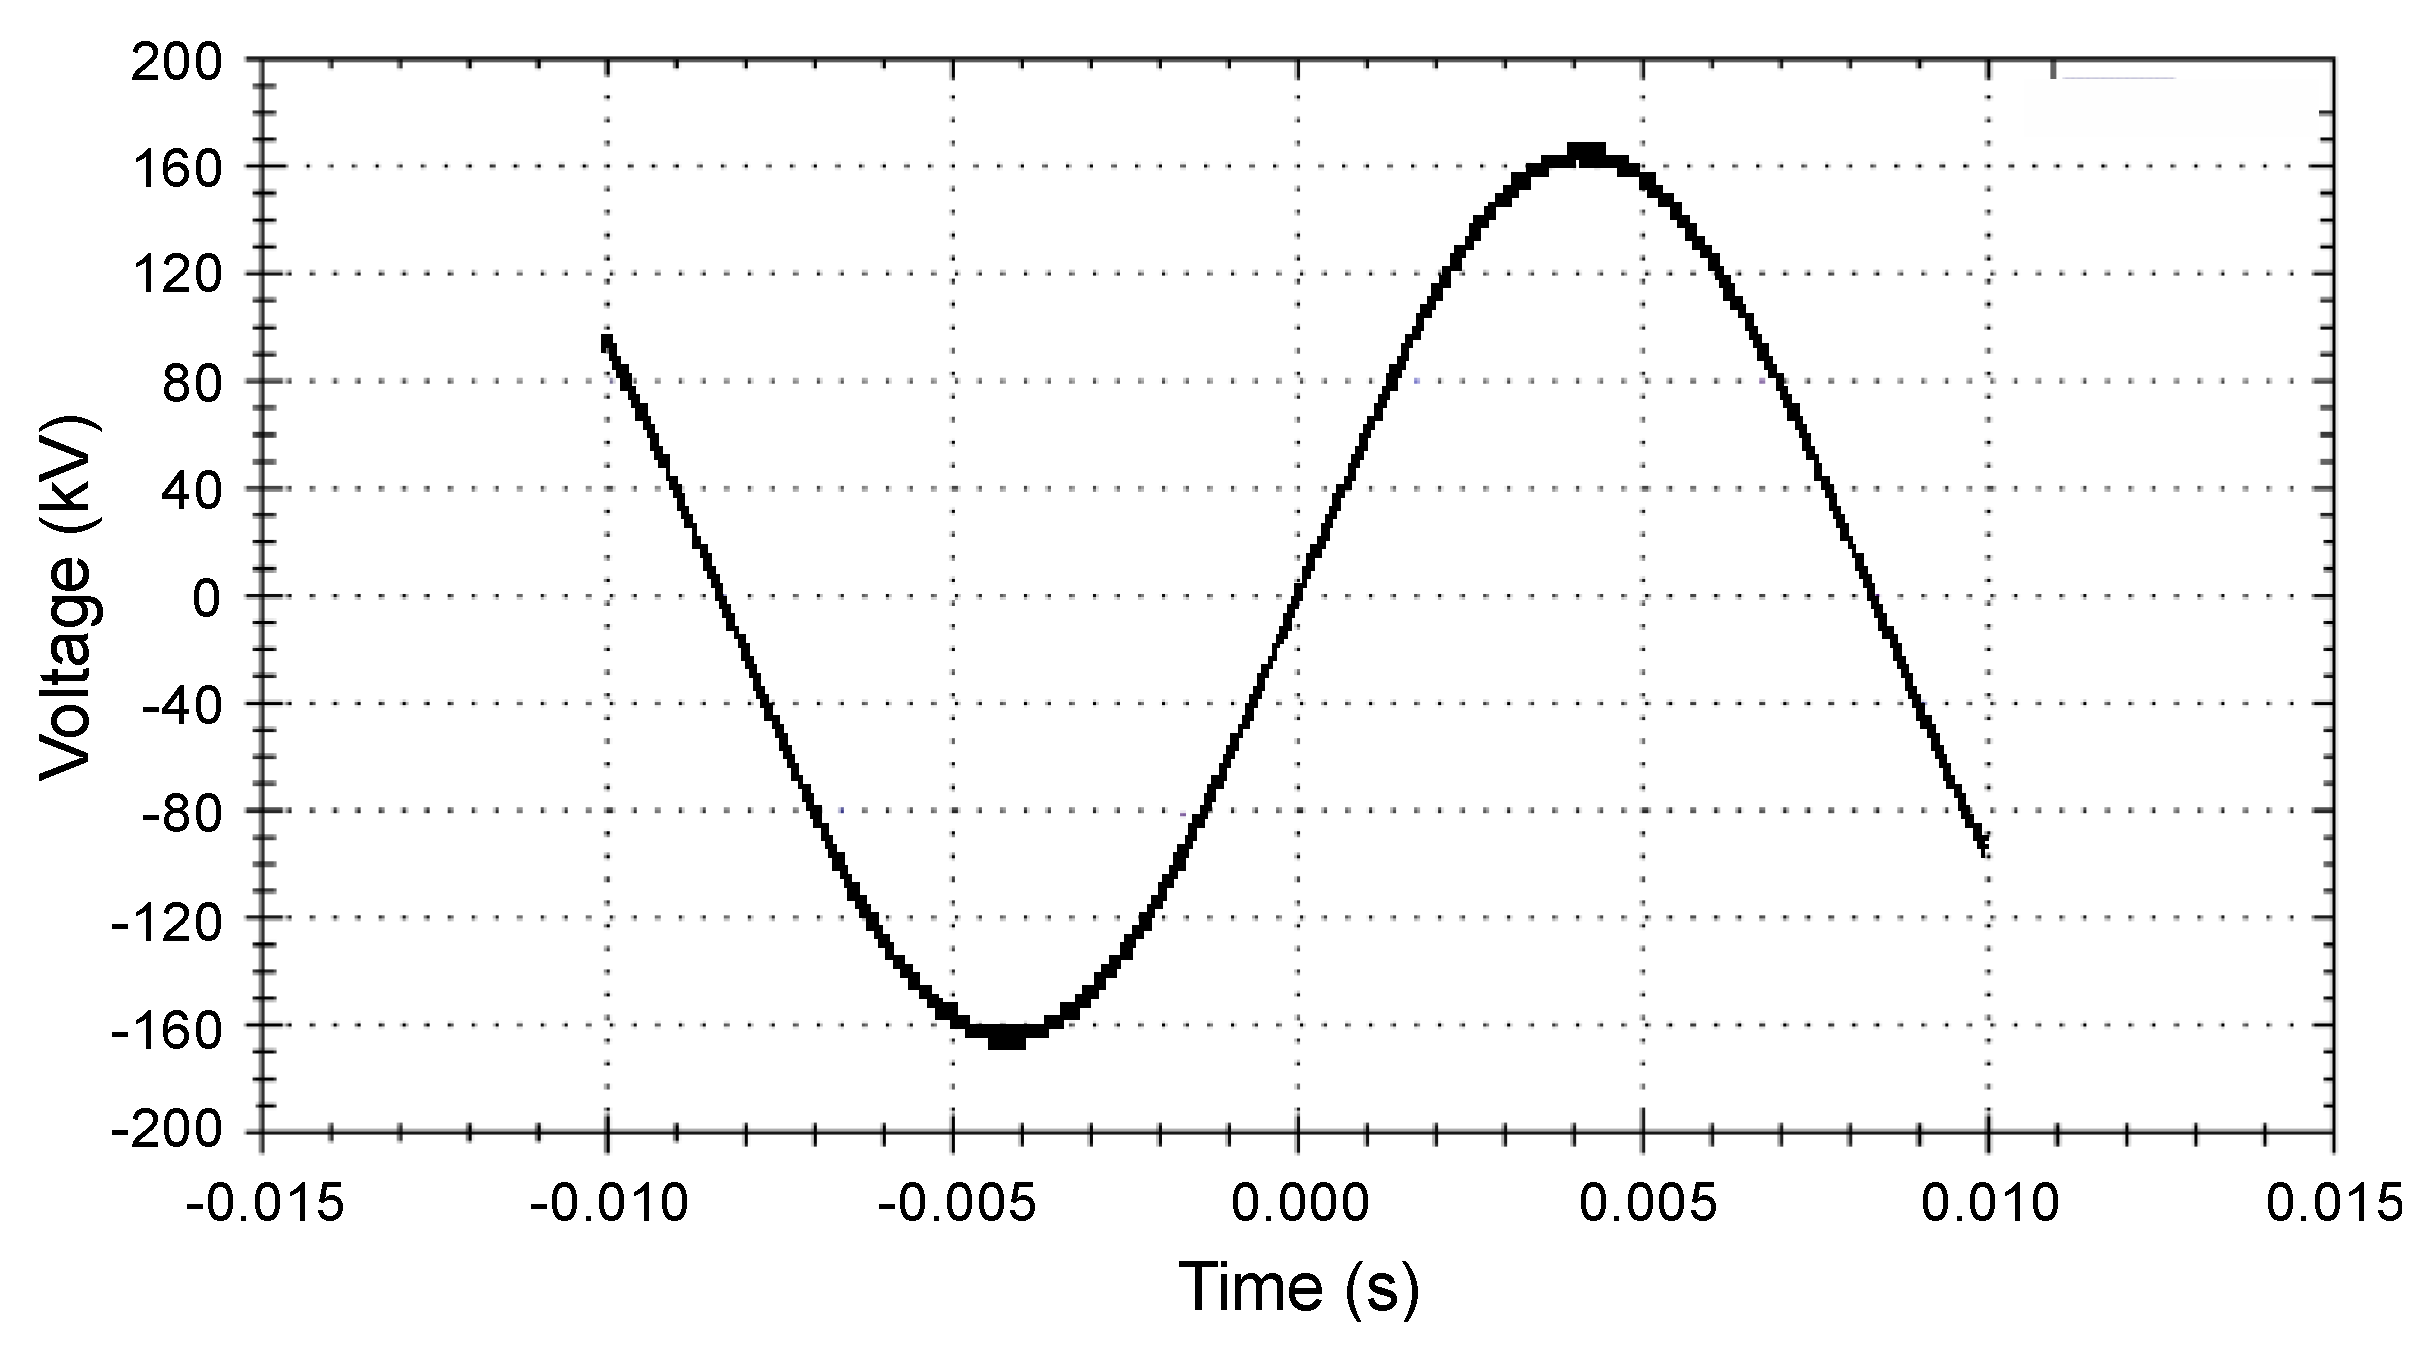
The applied voltage test was carried out on the bushing with the coupling device installed on the tap in two different cases: (i) with nominal phase-to-ground voltage of the bushing (i.e., 79.8 kV); and (ii) with an overvoltage of 50% of the phase-to-ground voltage (i.e., 119.5 kV). The results of this test are shown in
Figure 14 and
Figure 15. Therefore, as no disruptive discharges were observed on the voltage read, it can be pointed out that the developed coupling device did not damage the capacitive insulation of either the bushing or the acquisition unit.
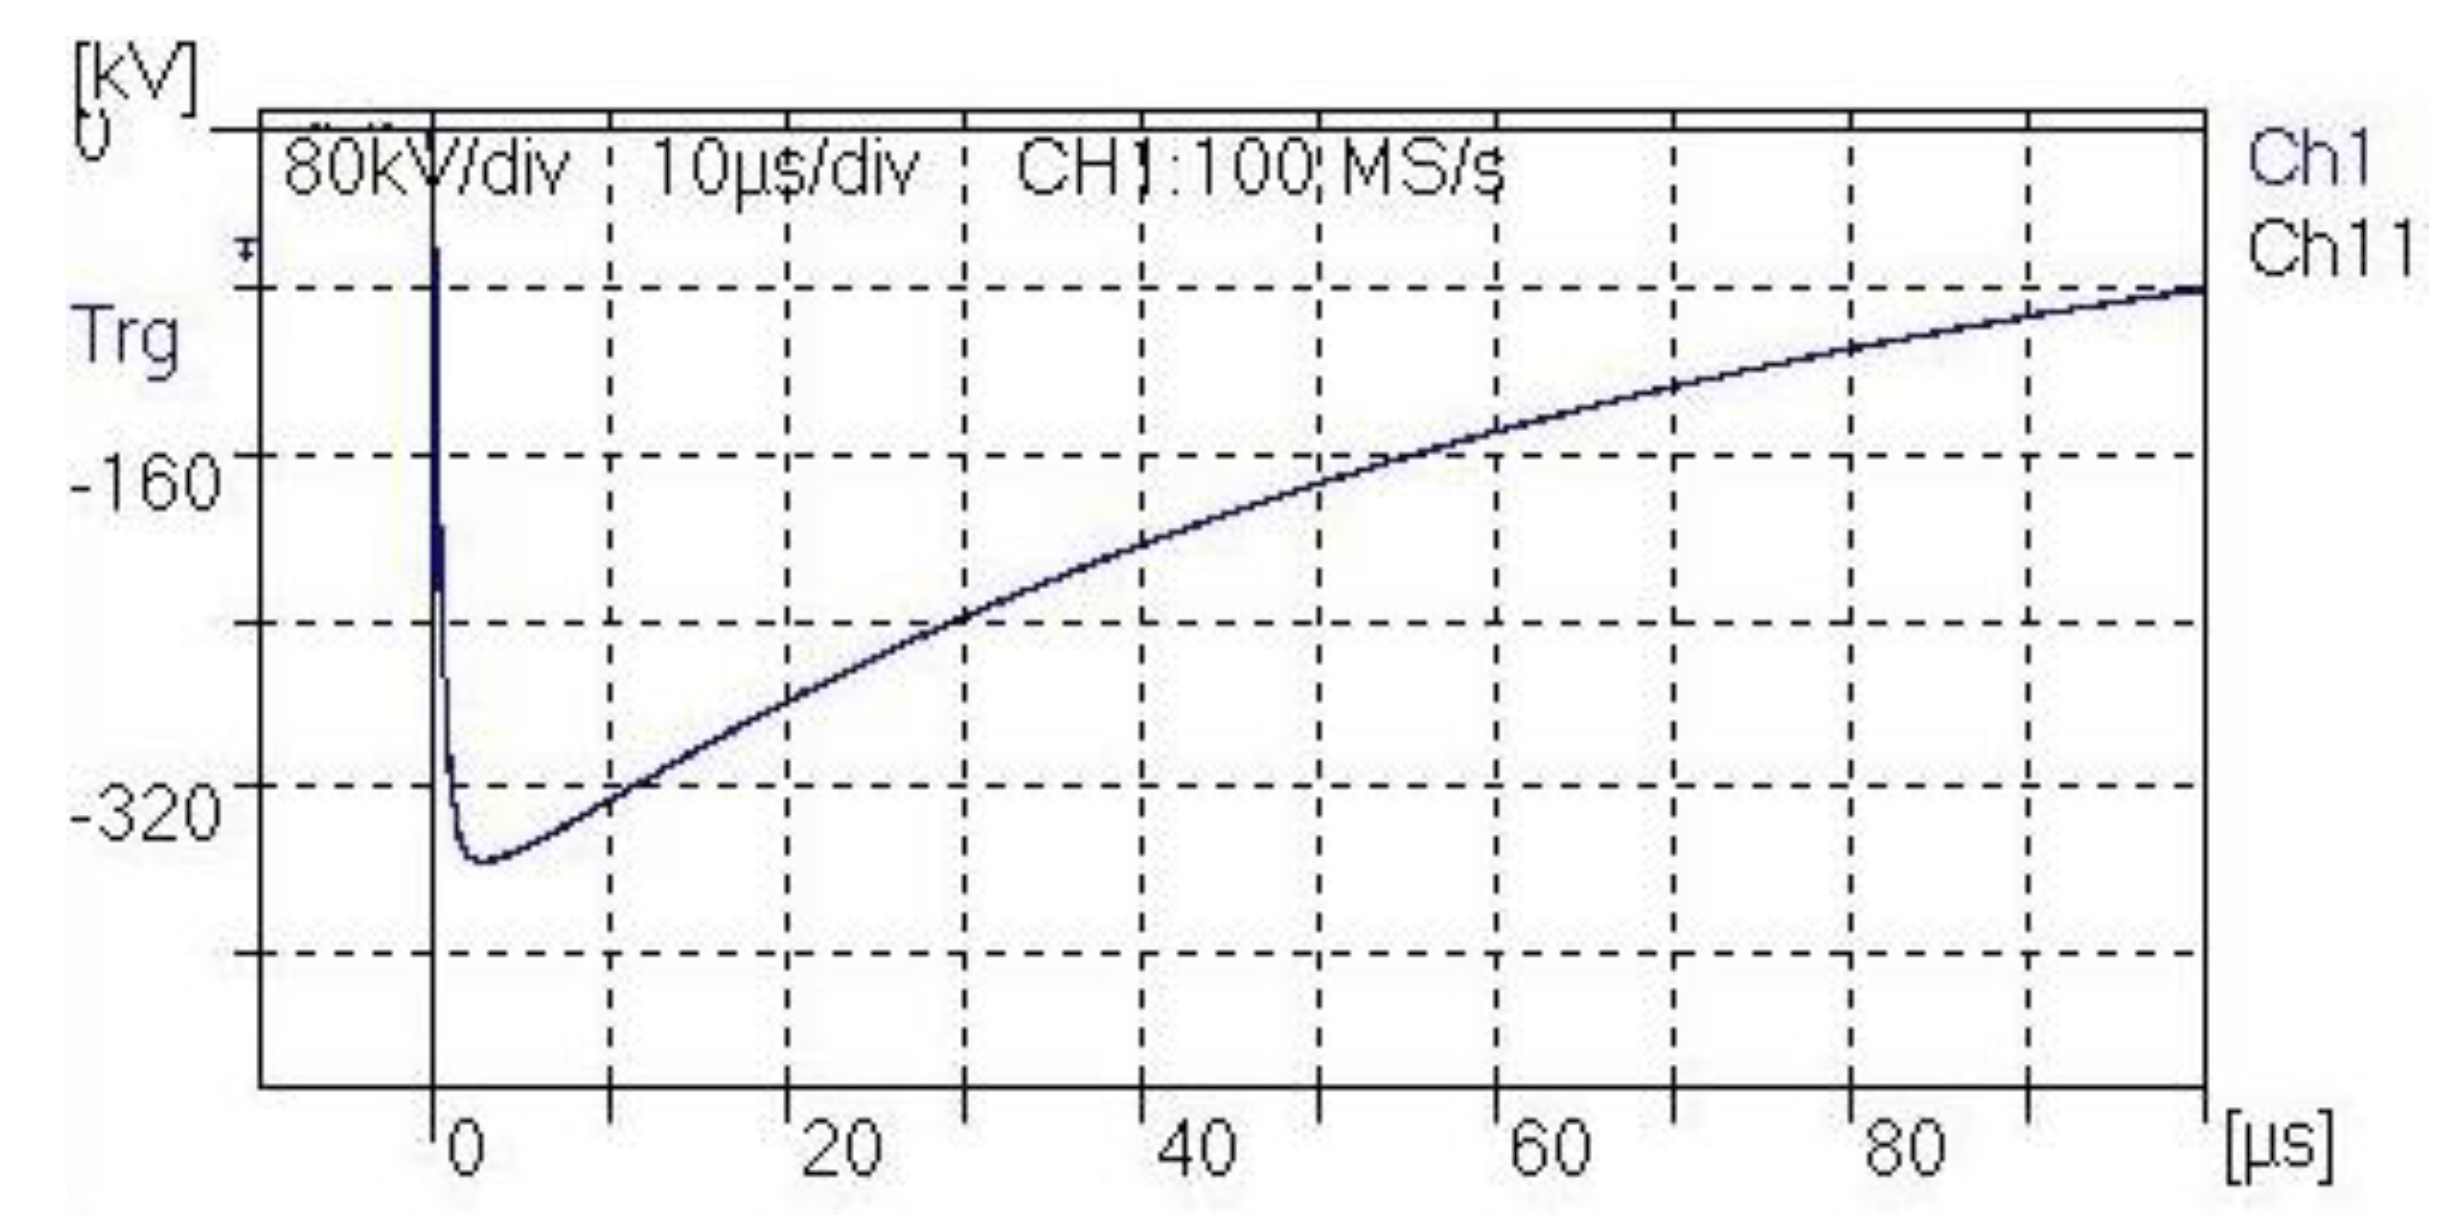
Regarding the lightning impulse test, a series of 1.2/50 µs voltage impulses with peak values between −50 kV and the Basic Insulation Level (BIL) were applied at the bushing’s terminal using the coupling device connected to the test tap. For all impulses applied, it was possible to verify that there was no rupture of the insulation of the bushing and, therefore, the coupling device did not weaken its service conditions. An example of applying a −356 kV pulse obtained directly from the oscilloscope is shown in
Figure 16. Impulses with other peak values resulted in curves similar to the one shown in
Figure 16 and, for this reason, other curves are not shown.
Complementing the high voltage impulse test, an 8/20 µs current impulse was applied to the bushing. In this case, it was possible to observe that the protection circuit worked as designed for peak values up to 40 kA. Above this value, there may be a burning of some protection device; however, when this situation occurs, the current surge is directed to the ground without reaching the measurement system. This result is important to prove the reliability of the protection scheme implemented.
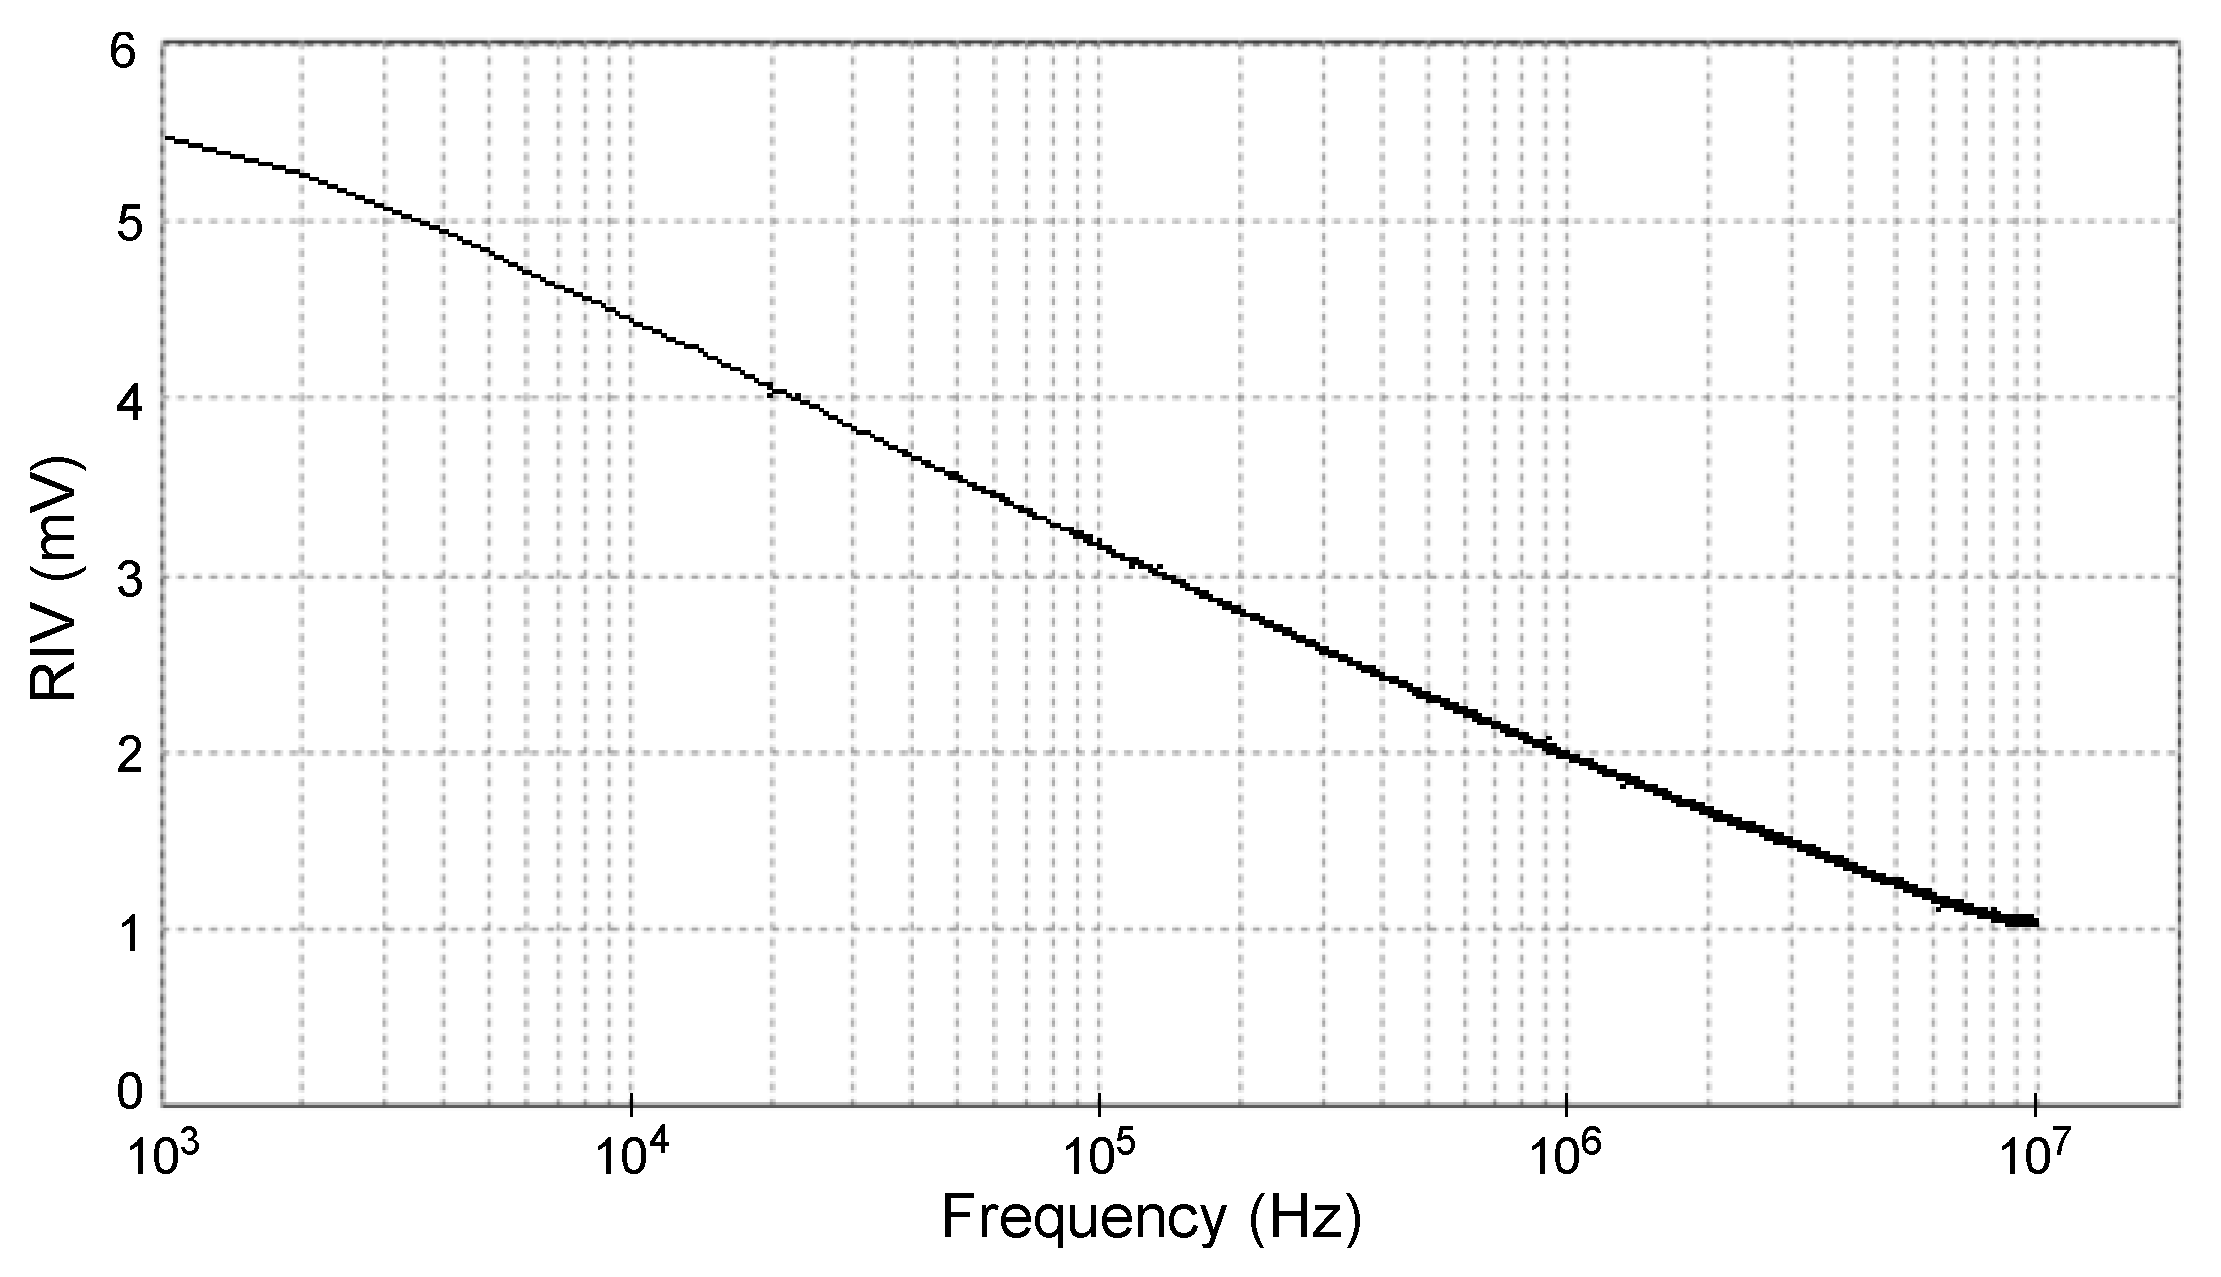
One of the concerns for the field application of the monitoring system is to ensure that the signal collected from the bushings is not polluted due to external interference. Thus, a radio interference voltage (RIV) test was performed to measure the amount of EM emissions in the radio frequency (RF) spectrum that can cause interference in the coupling device. RF covers signals with a frequency spectrum between 3 kHz and 30 GHz. However, as the electrical pulses of PDs are limited to a few MHz [
16], the RIV test was performed for the frequency range from 1 kHz to 10 MHz in two situations: firstly, with nominal phase-to-ground voltage on the bushing (with the coupling device connected to the test tap) and, afterwards, considering a 50% overvoltage. The results are shown in
Figure 17 and
Figure 18.
From these results it can be pointed out that for both test situations the coupling device maintained remarkable immunity to EM interference in the RF spectrum, since the voltage amplitude induced by such interference was very low. This observation is more evident when analyzing the decreasing behavior of the voltage at higher frequency values.
Obtaining low values of EM interference is a key requirement for the real application of this work. Among other reasons, it can be mentioned that this task was achieved due to the geometry of the coupling device; the reliability of the components of the internal circuit; the direct connection to the test tap; and the short length between the coupling device and the measurement system.
3.2. Installation and Operation in Substation
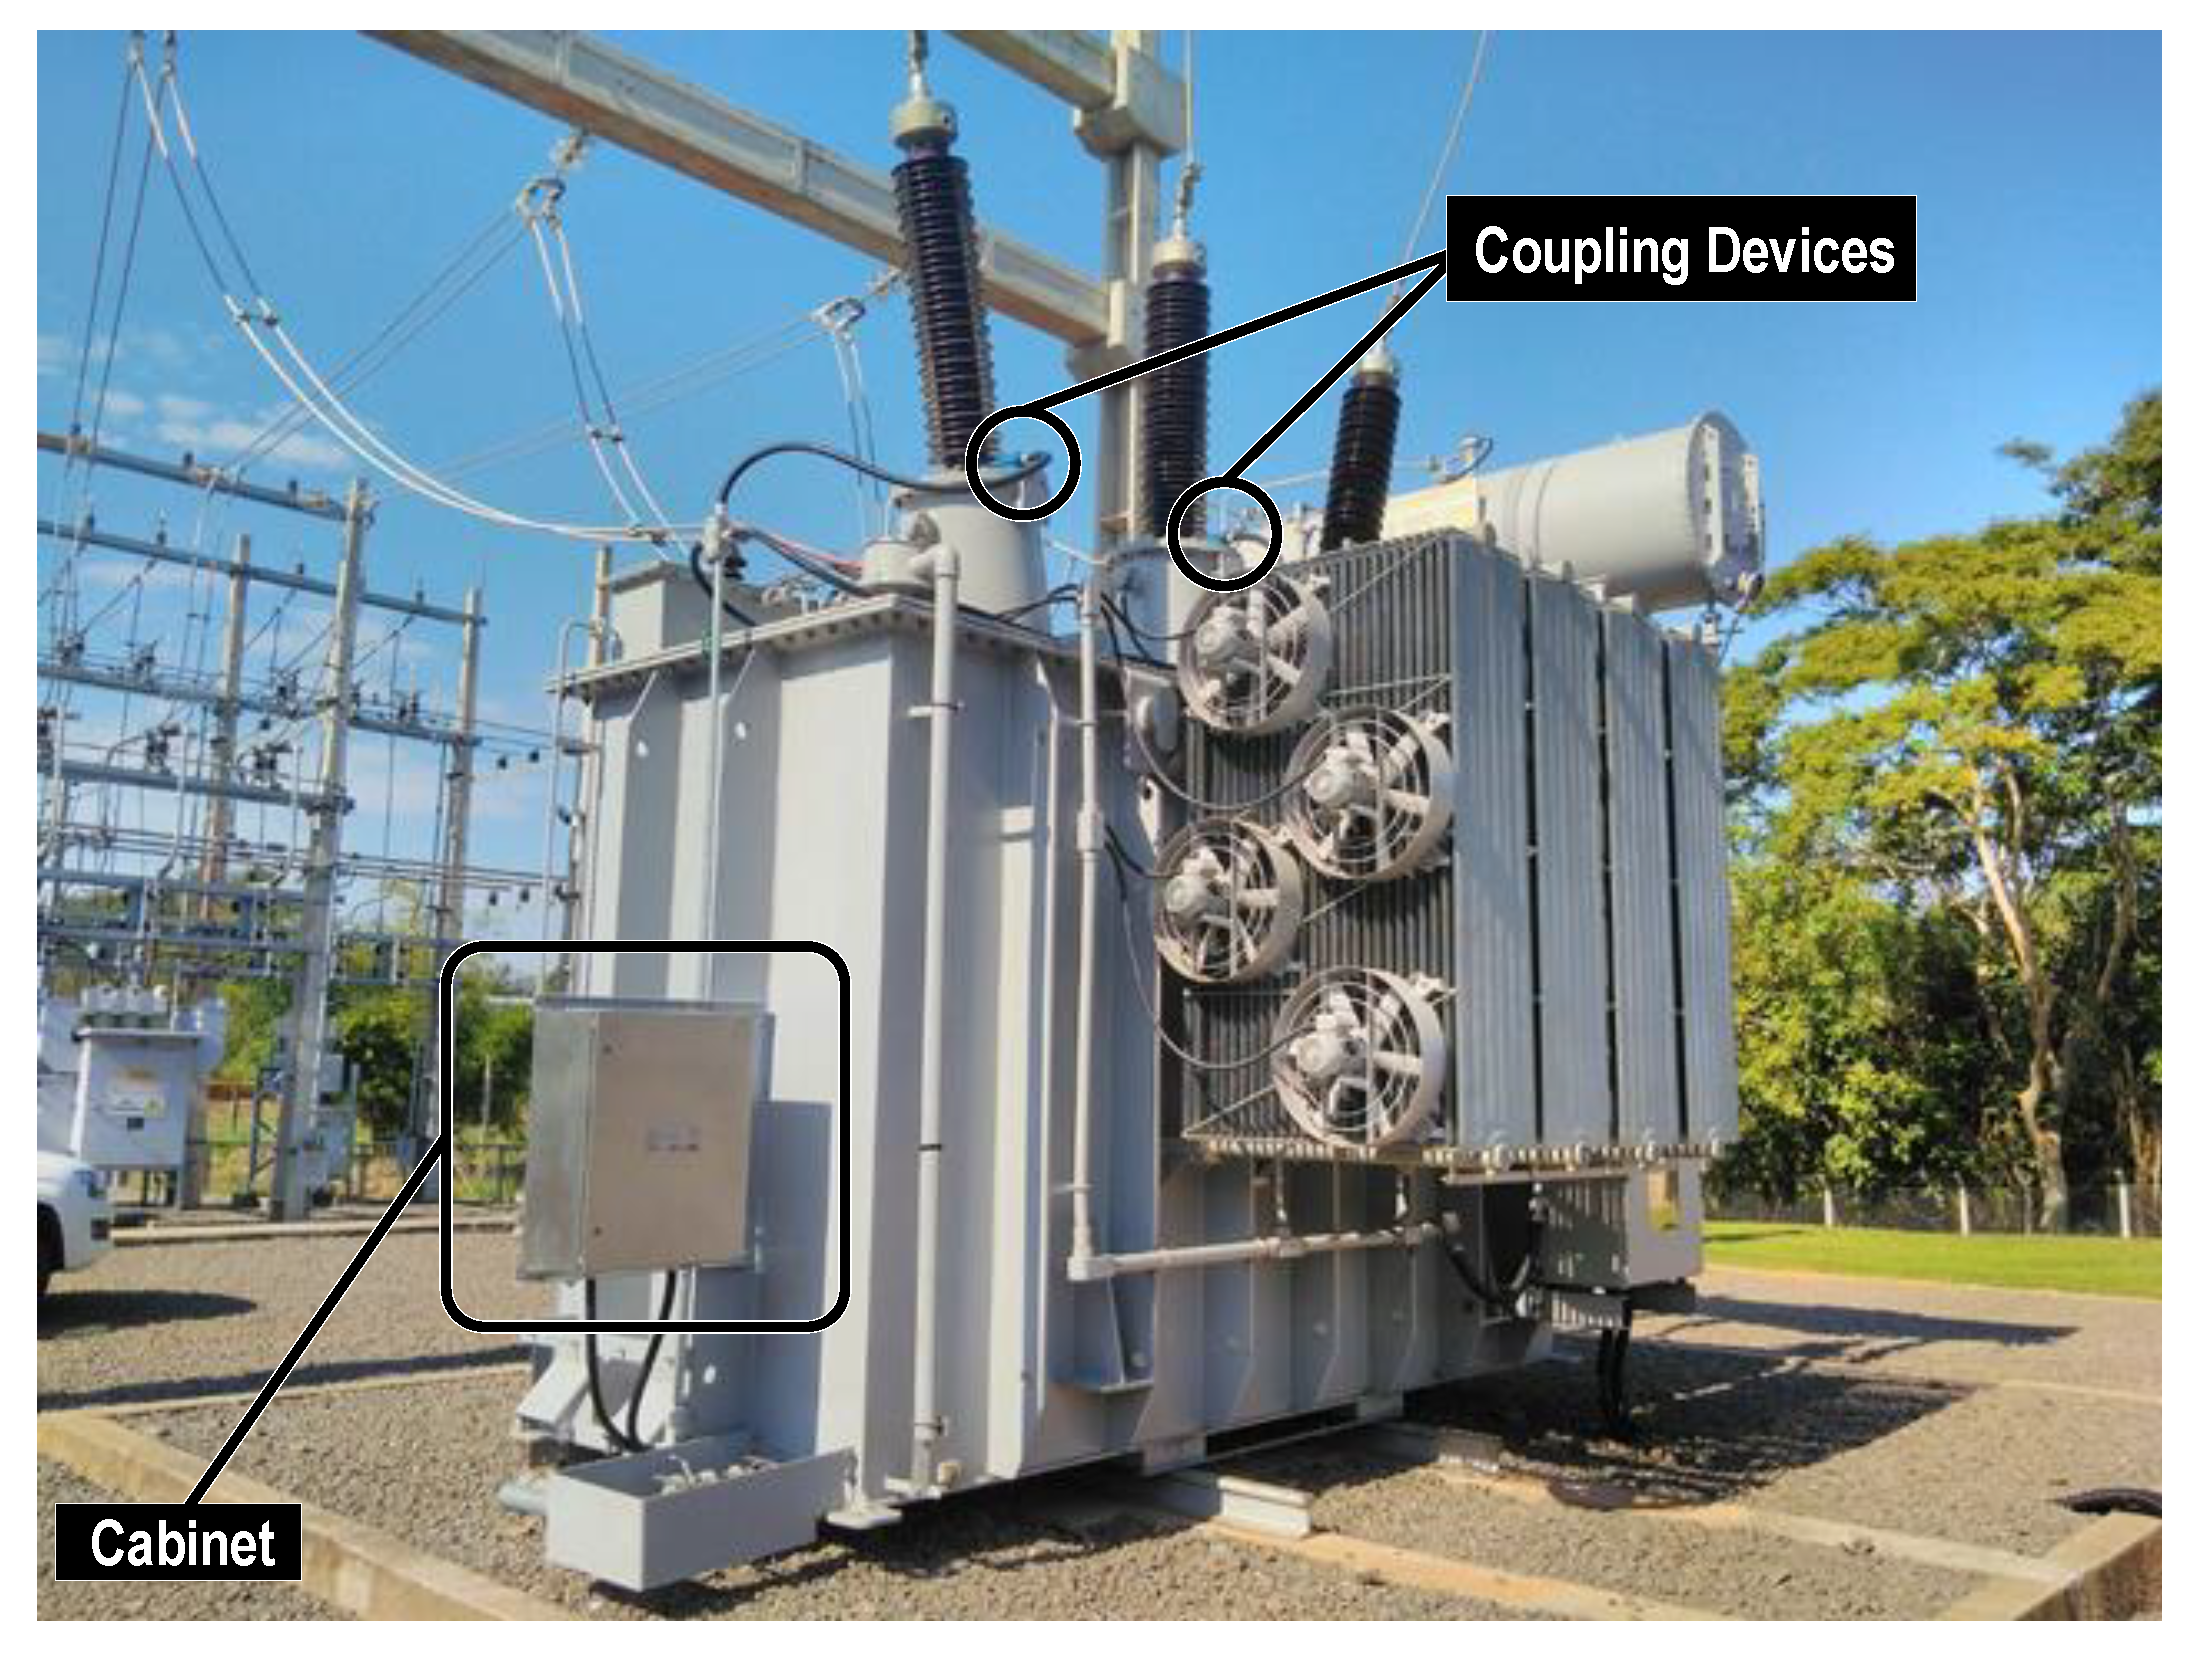
The developed monitoring system was applied to different oil-insulated power transformers equipped with condenser bushings in HV terminals at different substations, as shown in
Figure 19.
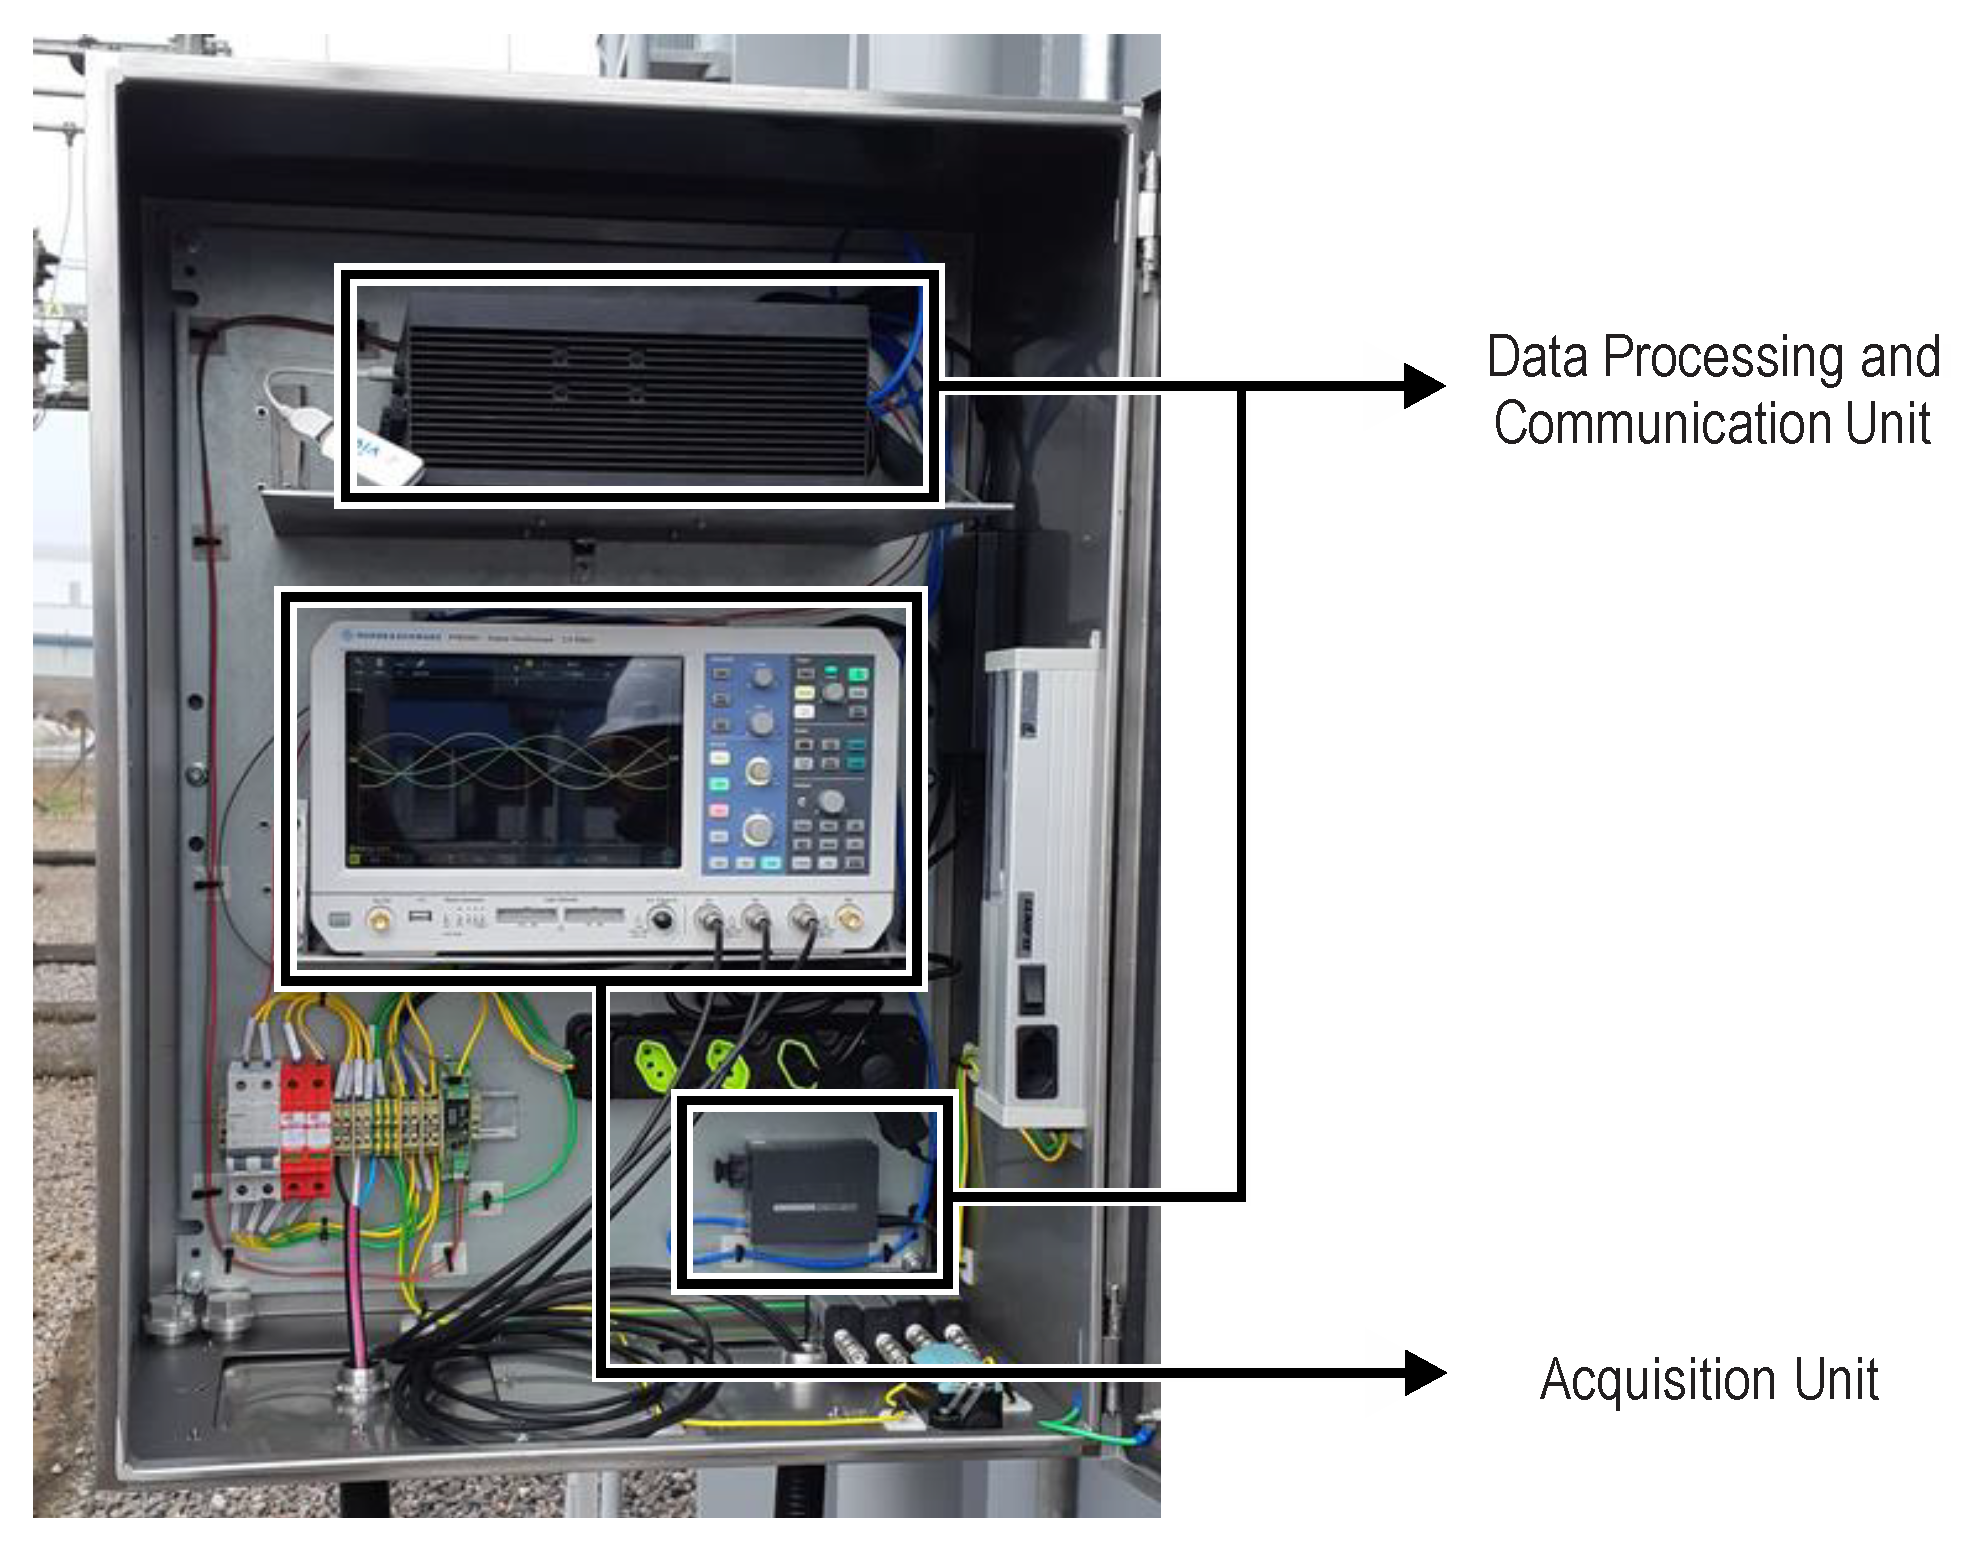
In
Figure 20 and
Figure 21 it is possible to observe the coupling devices connected in the HV bushings and an internal view of the cabinet, respectively. In
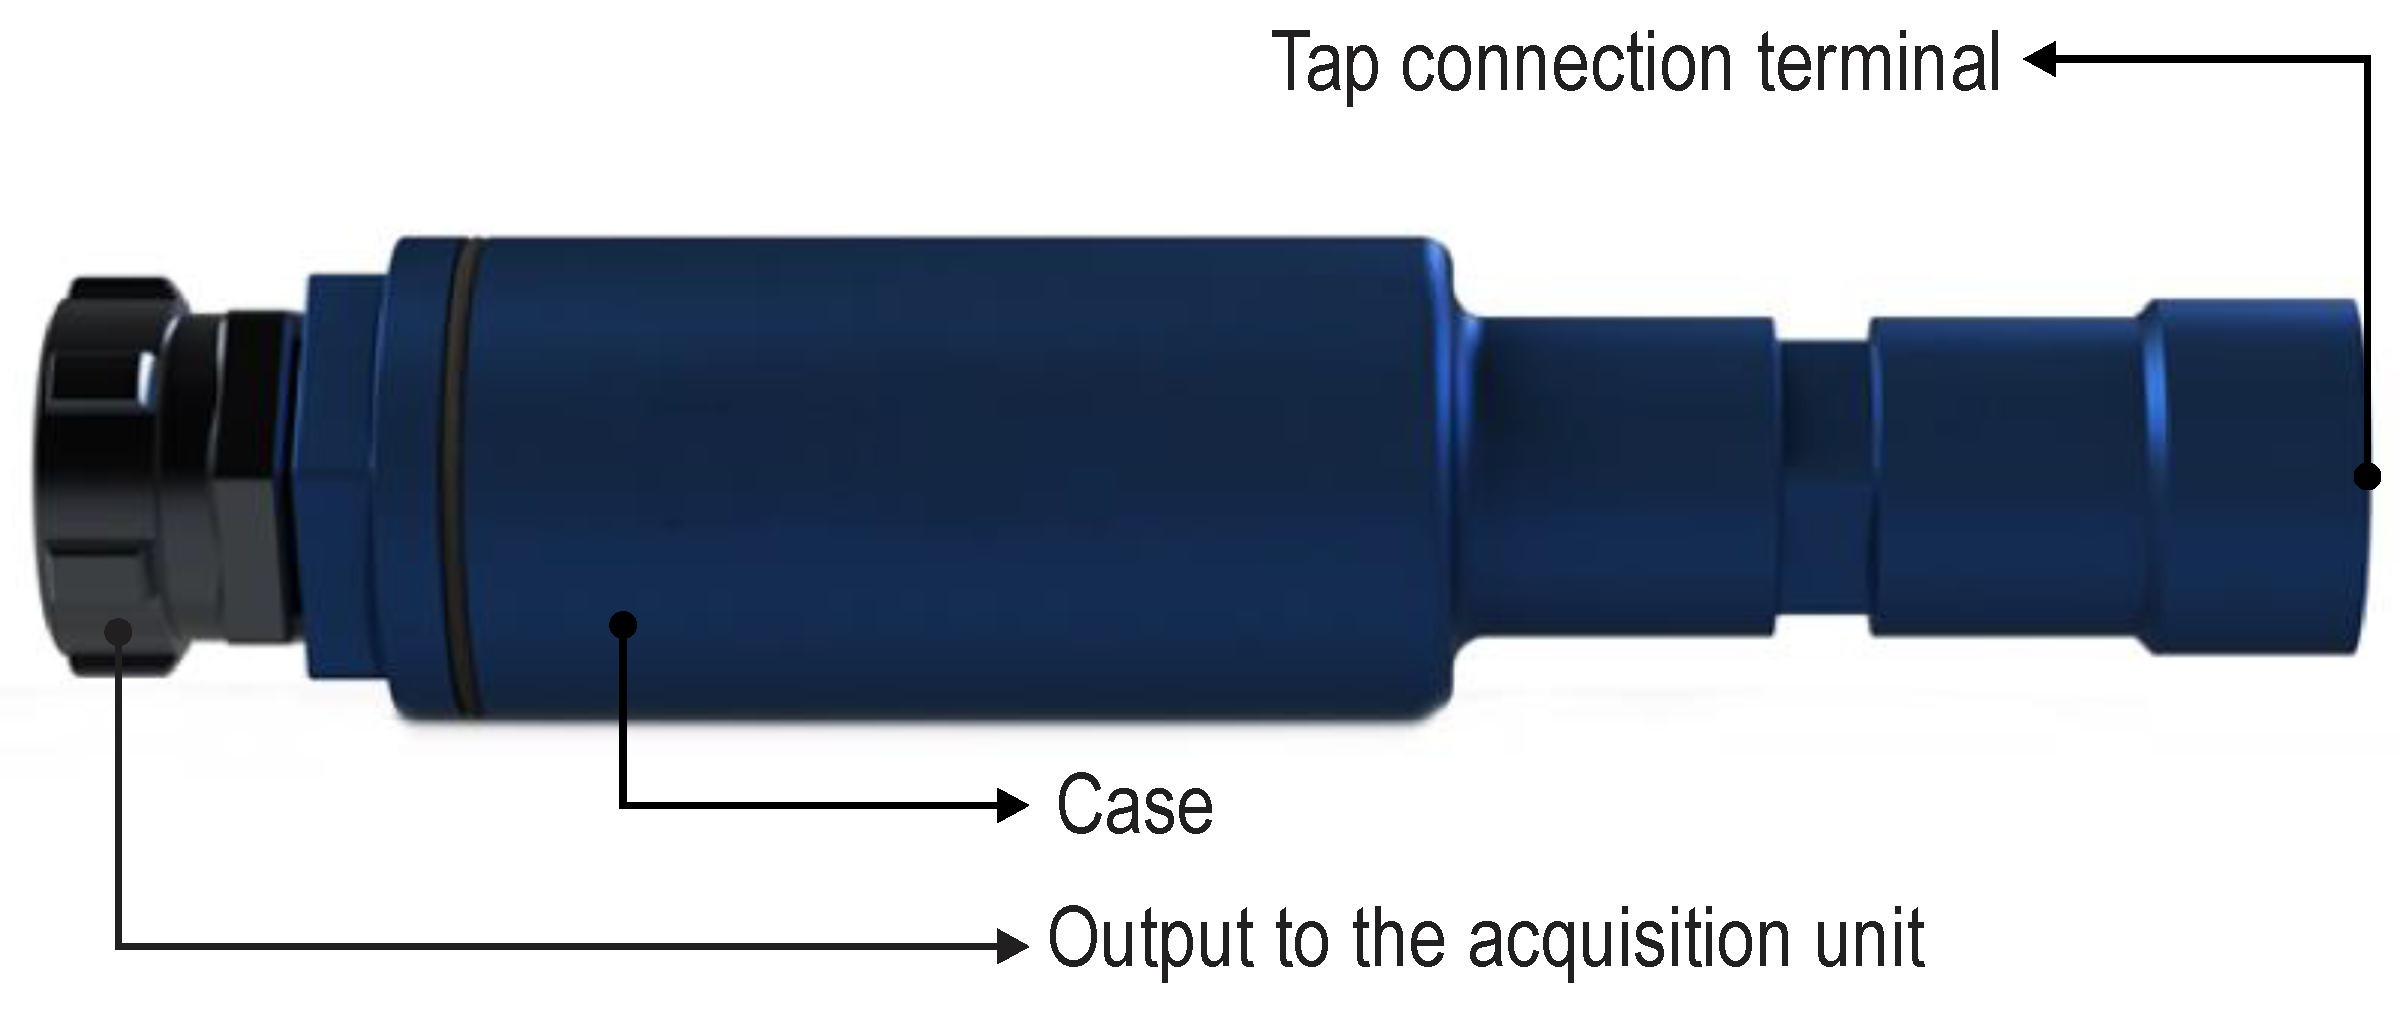
Figure 20 it is important to highlight that the metallic case of the coupling device and the shielded tube, which surrounds the conductor between the coupling device and the acquisition unit, form a Faraday cage and prevent the penetration of unwanted electrical fields that could interfere with the measurements.
In order to validate the proposed monitoring system, the following sections present different application cases that demonstrate the system’s efficiency in detecting partial discharges online, as well as how these measures can be used to assess the real conditions of a power transformer. It should be noted that, in all cases presented, measurements were obtained on dry days and with the transformer operating at steady state.
3.2.1. Case I: PD Pulses Detected by Coupling Device
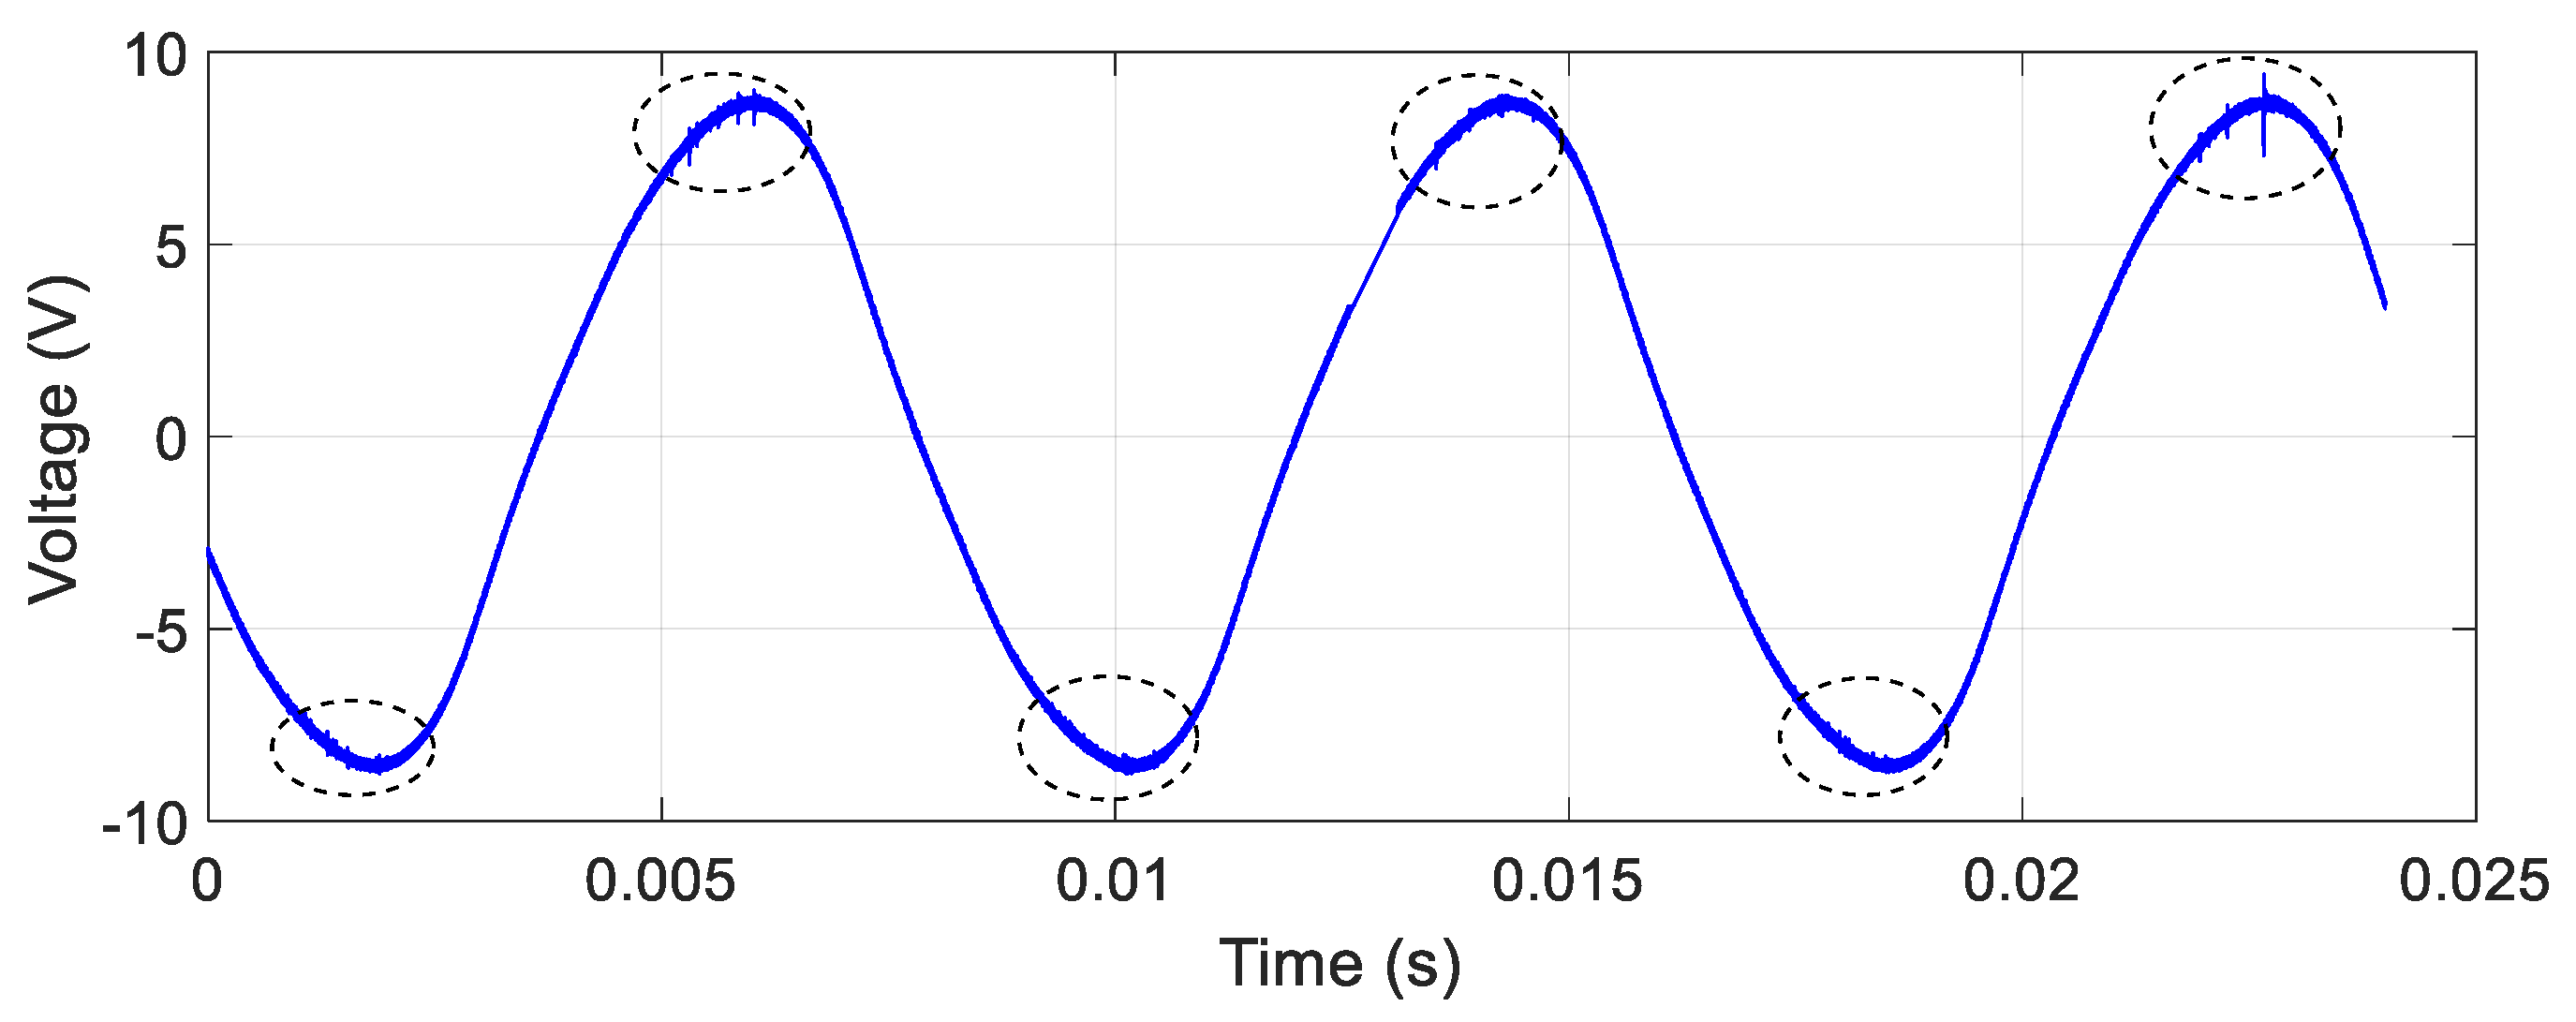
In the first practical application, the developed monitoring system was applied to a power transformer in order to verify its capability for detecting activities of internal partial discharges. Thus, once the device was connected to the test tap, it was possible to capture the voltage signal present in the insulation of the condenser bushings, as shown in
Figure 22 for the bushing of phase A. The readings obtained from others bushings were similar to those shown in
Figure 22 and, for this reason, are not shown.
The voltage signal measured had components in addition to the 60 Hz sinusoidal signal, which included harmonics, interharmonics, and partial discharges. Particularly with respect to the PDs, it is worth noting that their activities were perceived due to the low-amplitude and high-frequency pulses present in 1–2.5, 5–6, 9–11, 13.4–14.6, 17.5–18.6, and 22–23 ms, as indicated by the circled areas in
Figure 22.
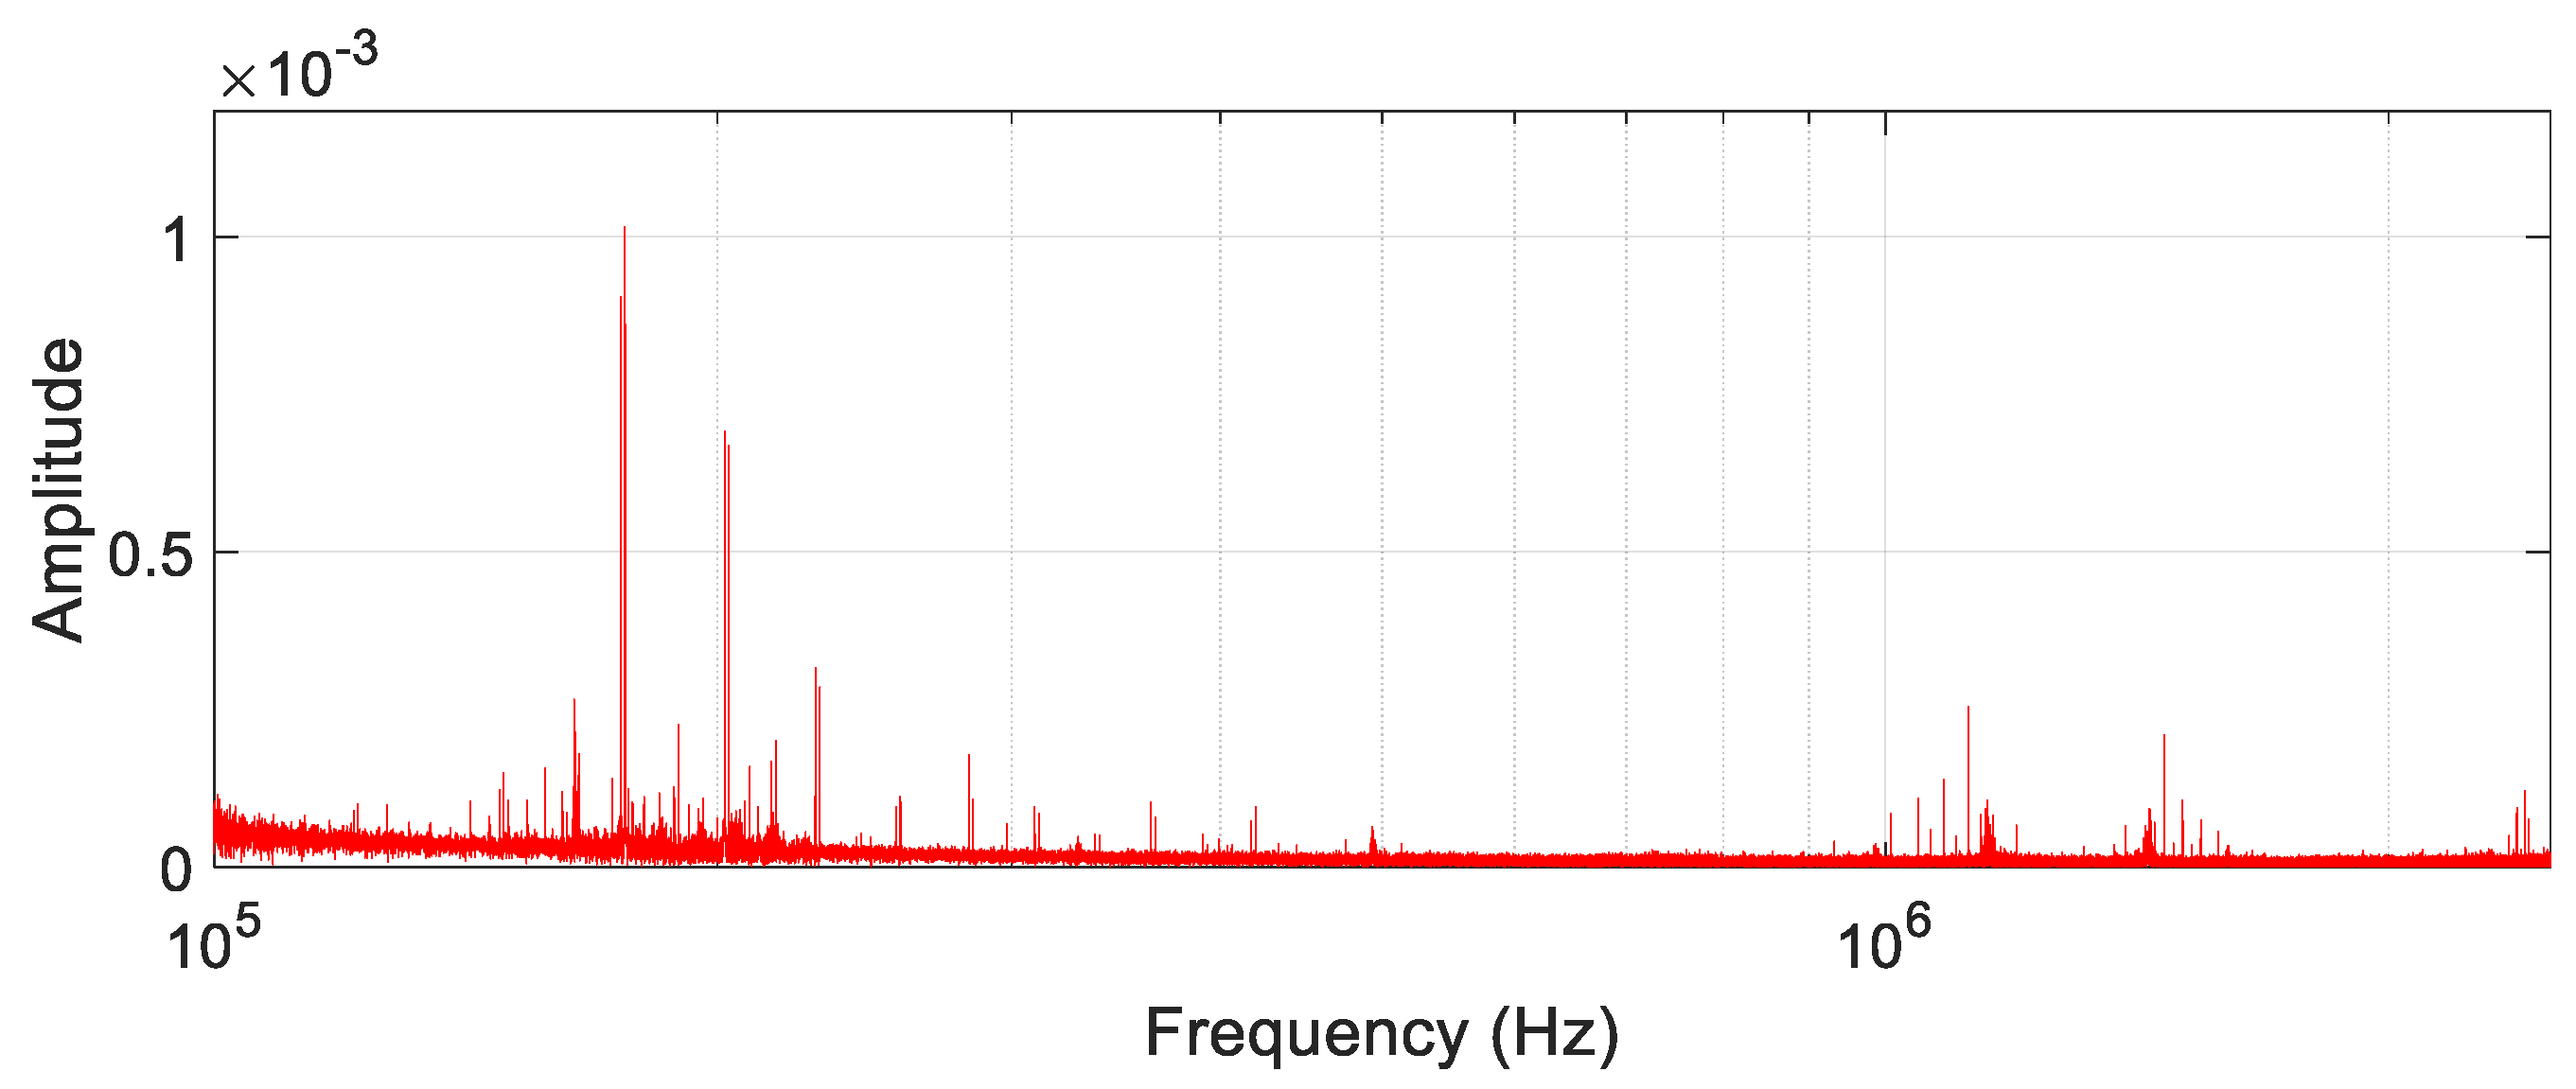
In a broader analysis, the partial discharges could also be perceived due to their distribution in the frequency spectrum. In this sense, when transforming the captured signal to the frequency domain, as shown in
Figure 23, it is possible to observe that the PDs are evident in a high-frequency band spread mainly in the following intervals: 120–500 kHz, 0.9–1.5 MHz, and 2.2–2.5 MHz.
Complementing the investigation, it is important to highlight that the PD signature observed in
Figure 22, which is characterized by pulses concentrated close to positive and negative peaks of the sinusoidal signal, is a pattern already known in the literature. Therefore, based on this pattern, it is possible to diagnose that the monitored transformer has a defect in the oil-paper insulation or gas bubble in some dielectric component of the insulation [
30]. This diagnostic is important for issues related to the asset management of a utility.
3.2.2. Case II: PD Monitoring over a 24-Hour Interval
In this case, partial discharge activities were monitored by the developed system over a 24-h horizon.
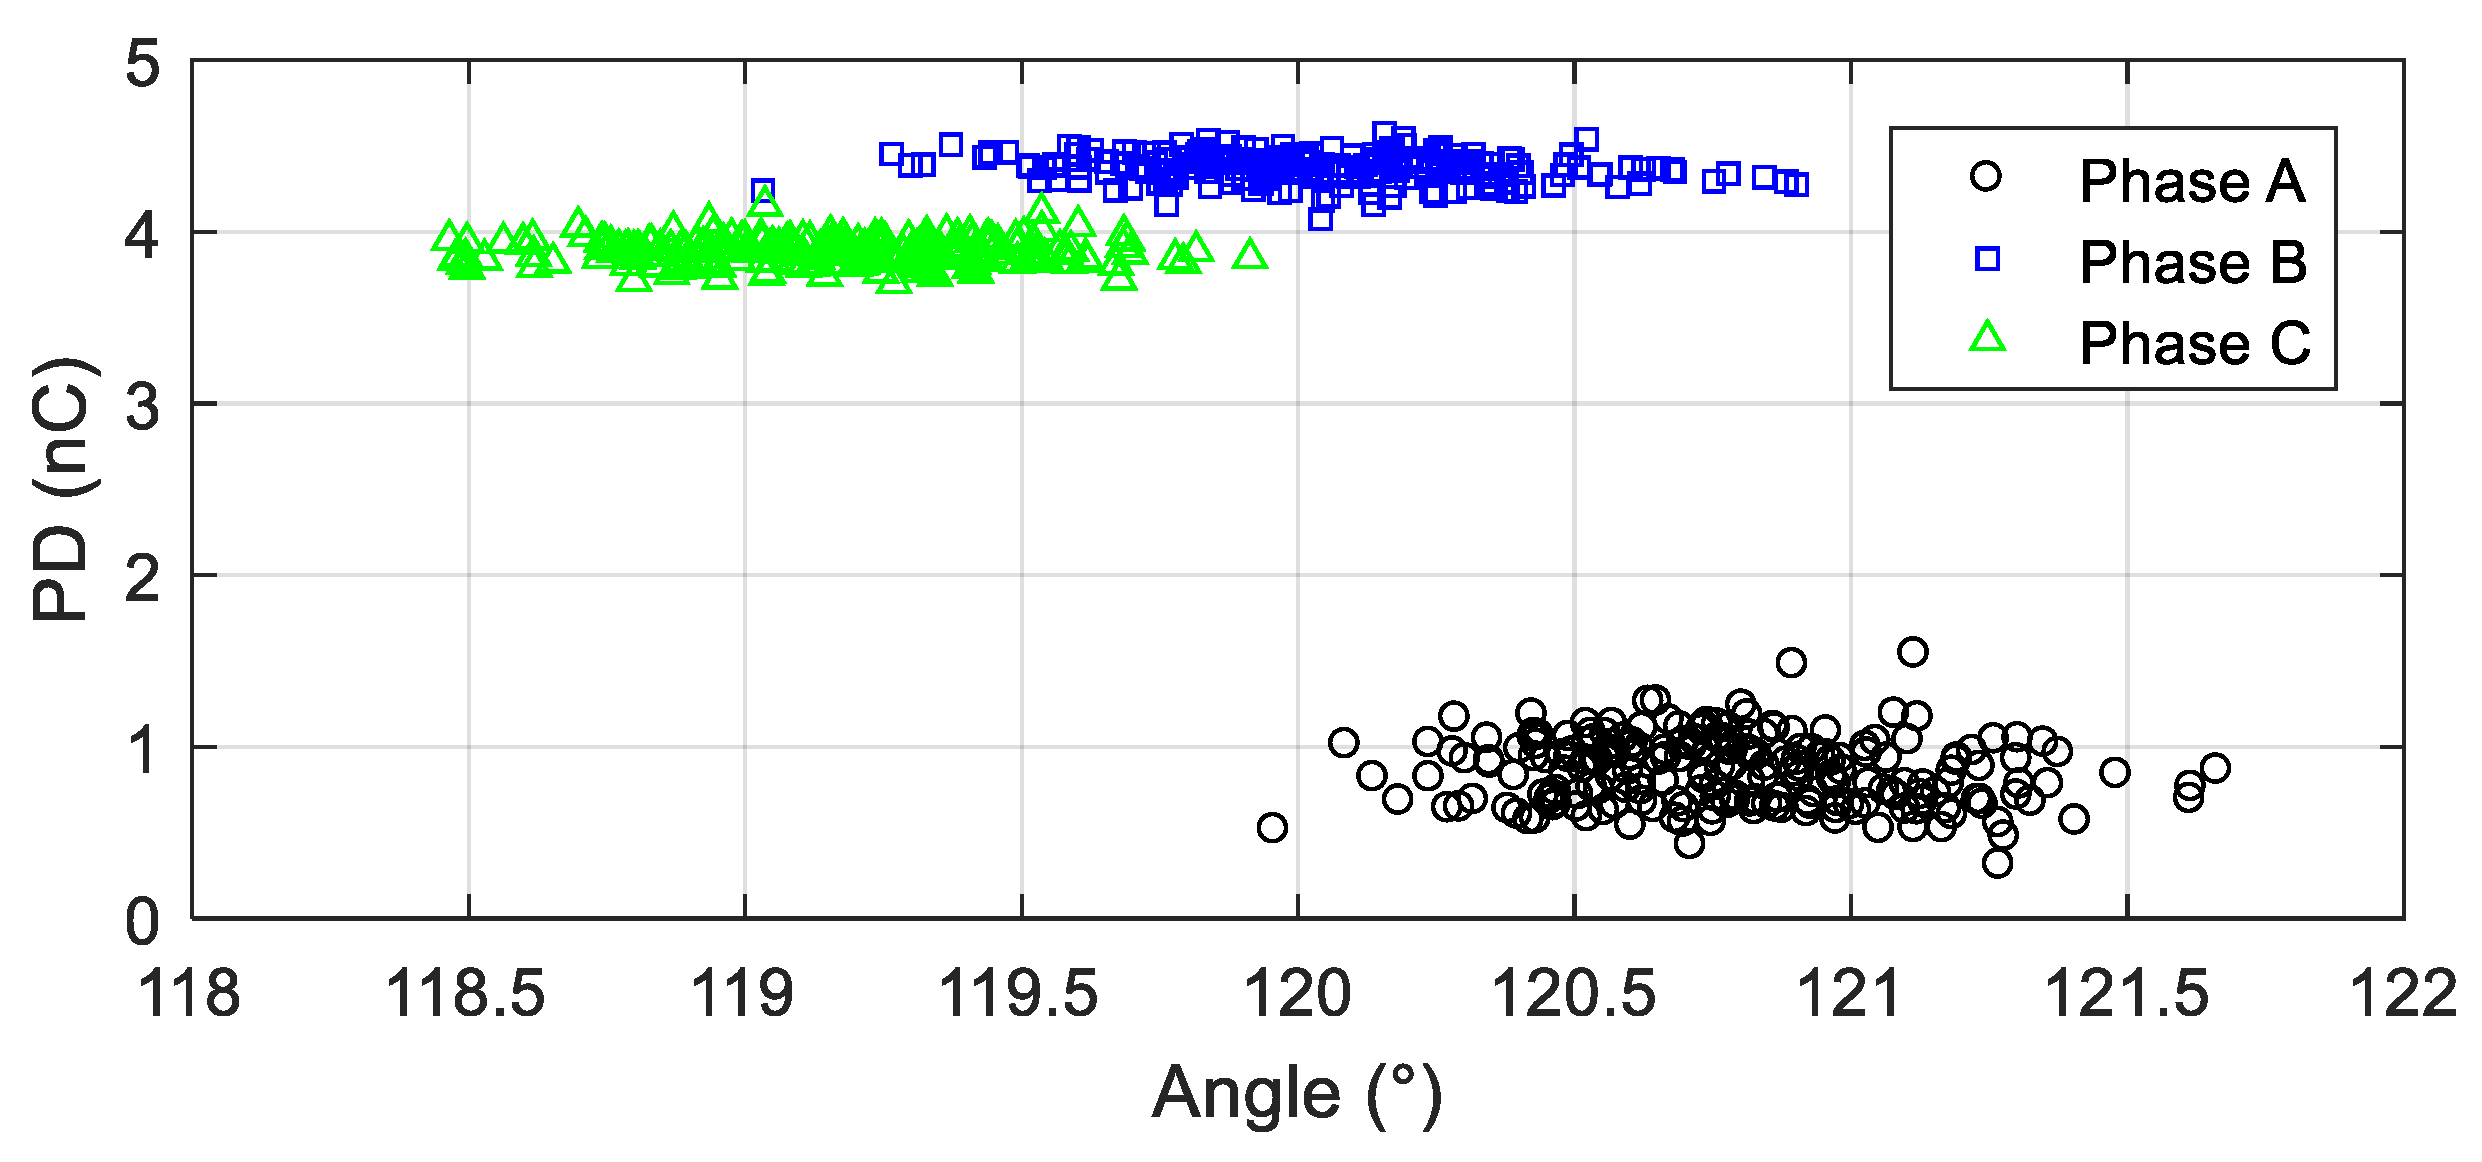
Figure 24 depicts the PD magnitude versus the phase angle among the reading channels recorded over the course of a day. Additionally,
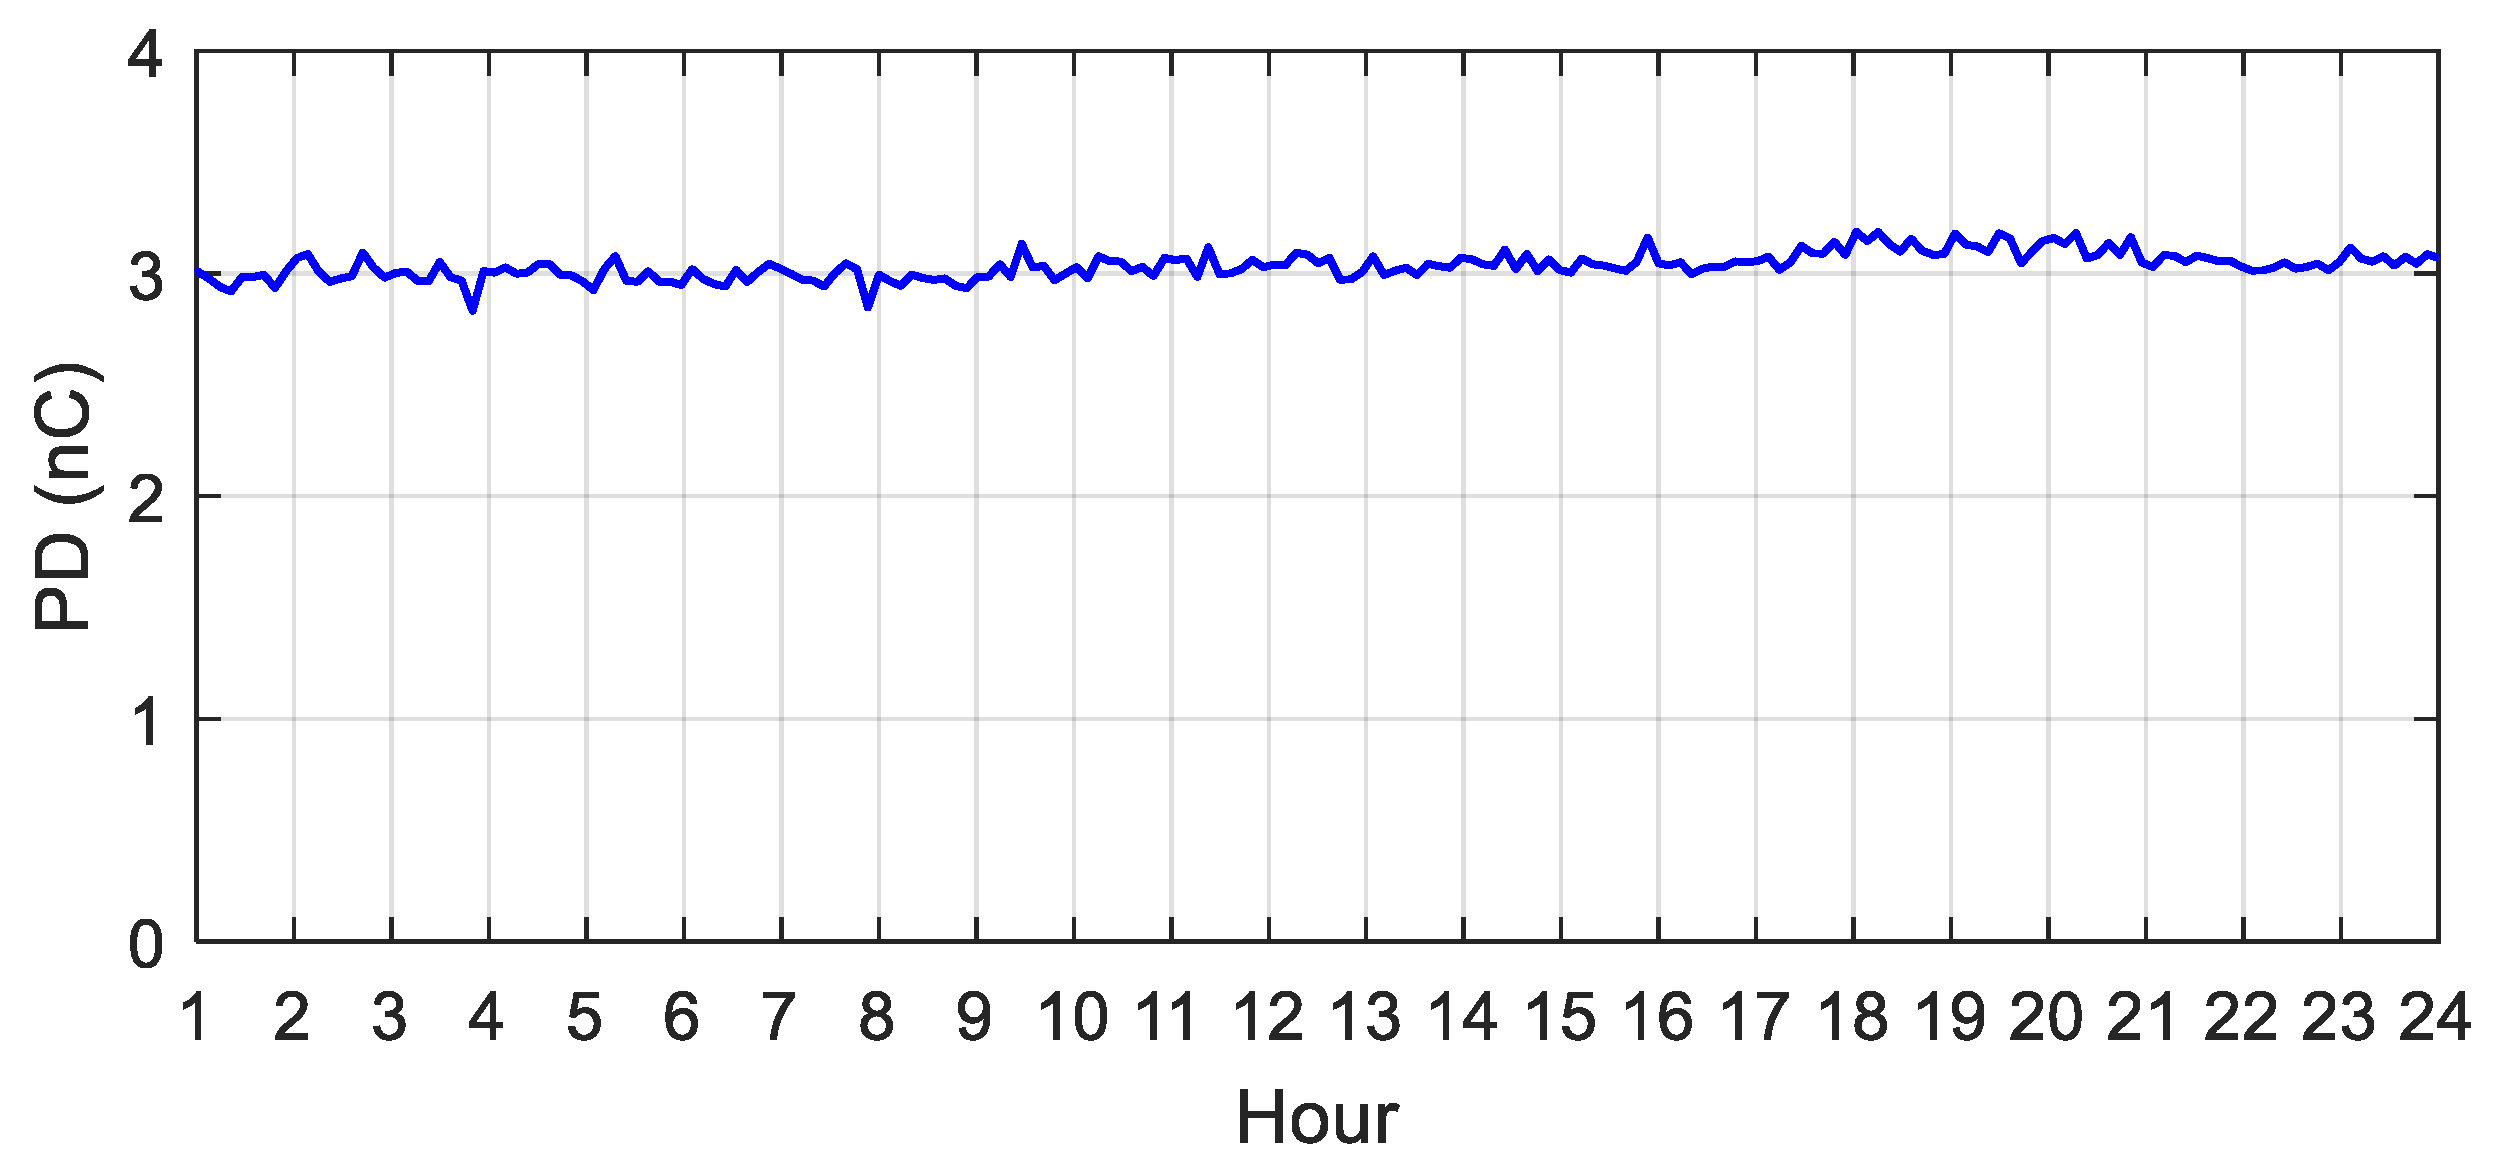
Figure 25 shows the average value of the PDs for the same observation period.
From the figures, a high level of PDs can be observed in the insulation of the transformer. Nevertheless, in a broader analysis of the measurements, it is important to verify that the apparent charge of the PDs was stable throughout the day (with some variations due to the oscillation of the transformer load and temperature) and, in addition, the phase angle of occurrence was practically constant, close to 120°. In this way, it can be attested that the transformer had a moderate level of insulation degradation; however, as the occurrences of partial discharges do not present great variations in the observed period, it is unlikely that an imminent failure would occur.
In cases like this, a failure can occur in a matter of years and, therefore, it is not necessary to take the equipment out of service immediately. In fact, a good practice in this situation is to continuously monitor the level of partial discharges to detect any changes in the insulation conditions of the transformer. Thus, in addition to partial discharges, other parameters, such as changes in gases dissolved in oil, can corroborate for diagnostic purposes. A specific example of this is detailed in the next case.
3.2.3. Case III: Detection of PDs and Correlation with DGA
To complement the application of this work, the proposed monitoring system was installed in a transformer whose insulation was in critical condition. In this case, the monitored transformer was equipped with a DGA monitor that detected a rapid and abnormal increase in the concentration of gases dissolved in the transformer oil over three consecutive days, as shown in
Table 4.
An analysis of the Duval triangle [
5] for key gas concentrations measured on the third day indicates a thermal problem in the transformer. Although this problem is not necessarily caused by partial discharges, this abnormal increase in dissolved gases in oil generates effects that, in turn, produce internal PDs in the insulation of the transformer. In order to confirm this situation, the developed monitoring system was applied to this case. The results of the measurements, obtained on the third day for each HV bushing, are shown in
Table 5.
In
Table 5, a discrepancy can be seen among the apparent charge detected on the bushing of phase B and the values detected on the bushings of phases A and C. Such a discrepancy, with high PD values on the bushings of phases A and C, is an indicative of a defect in some part of the transformer.
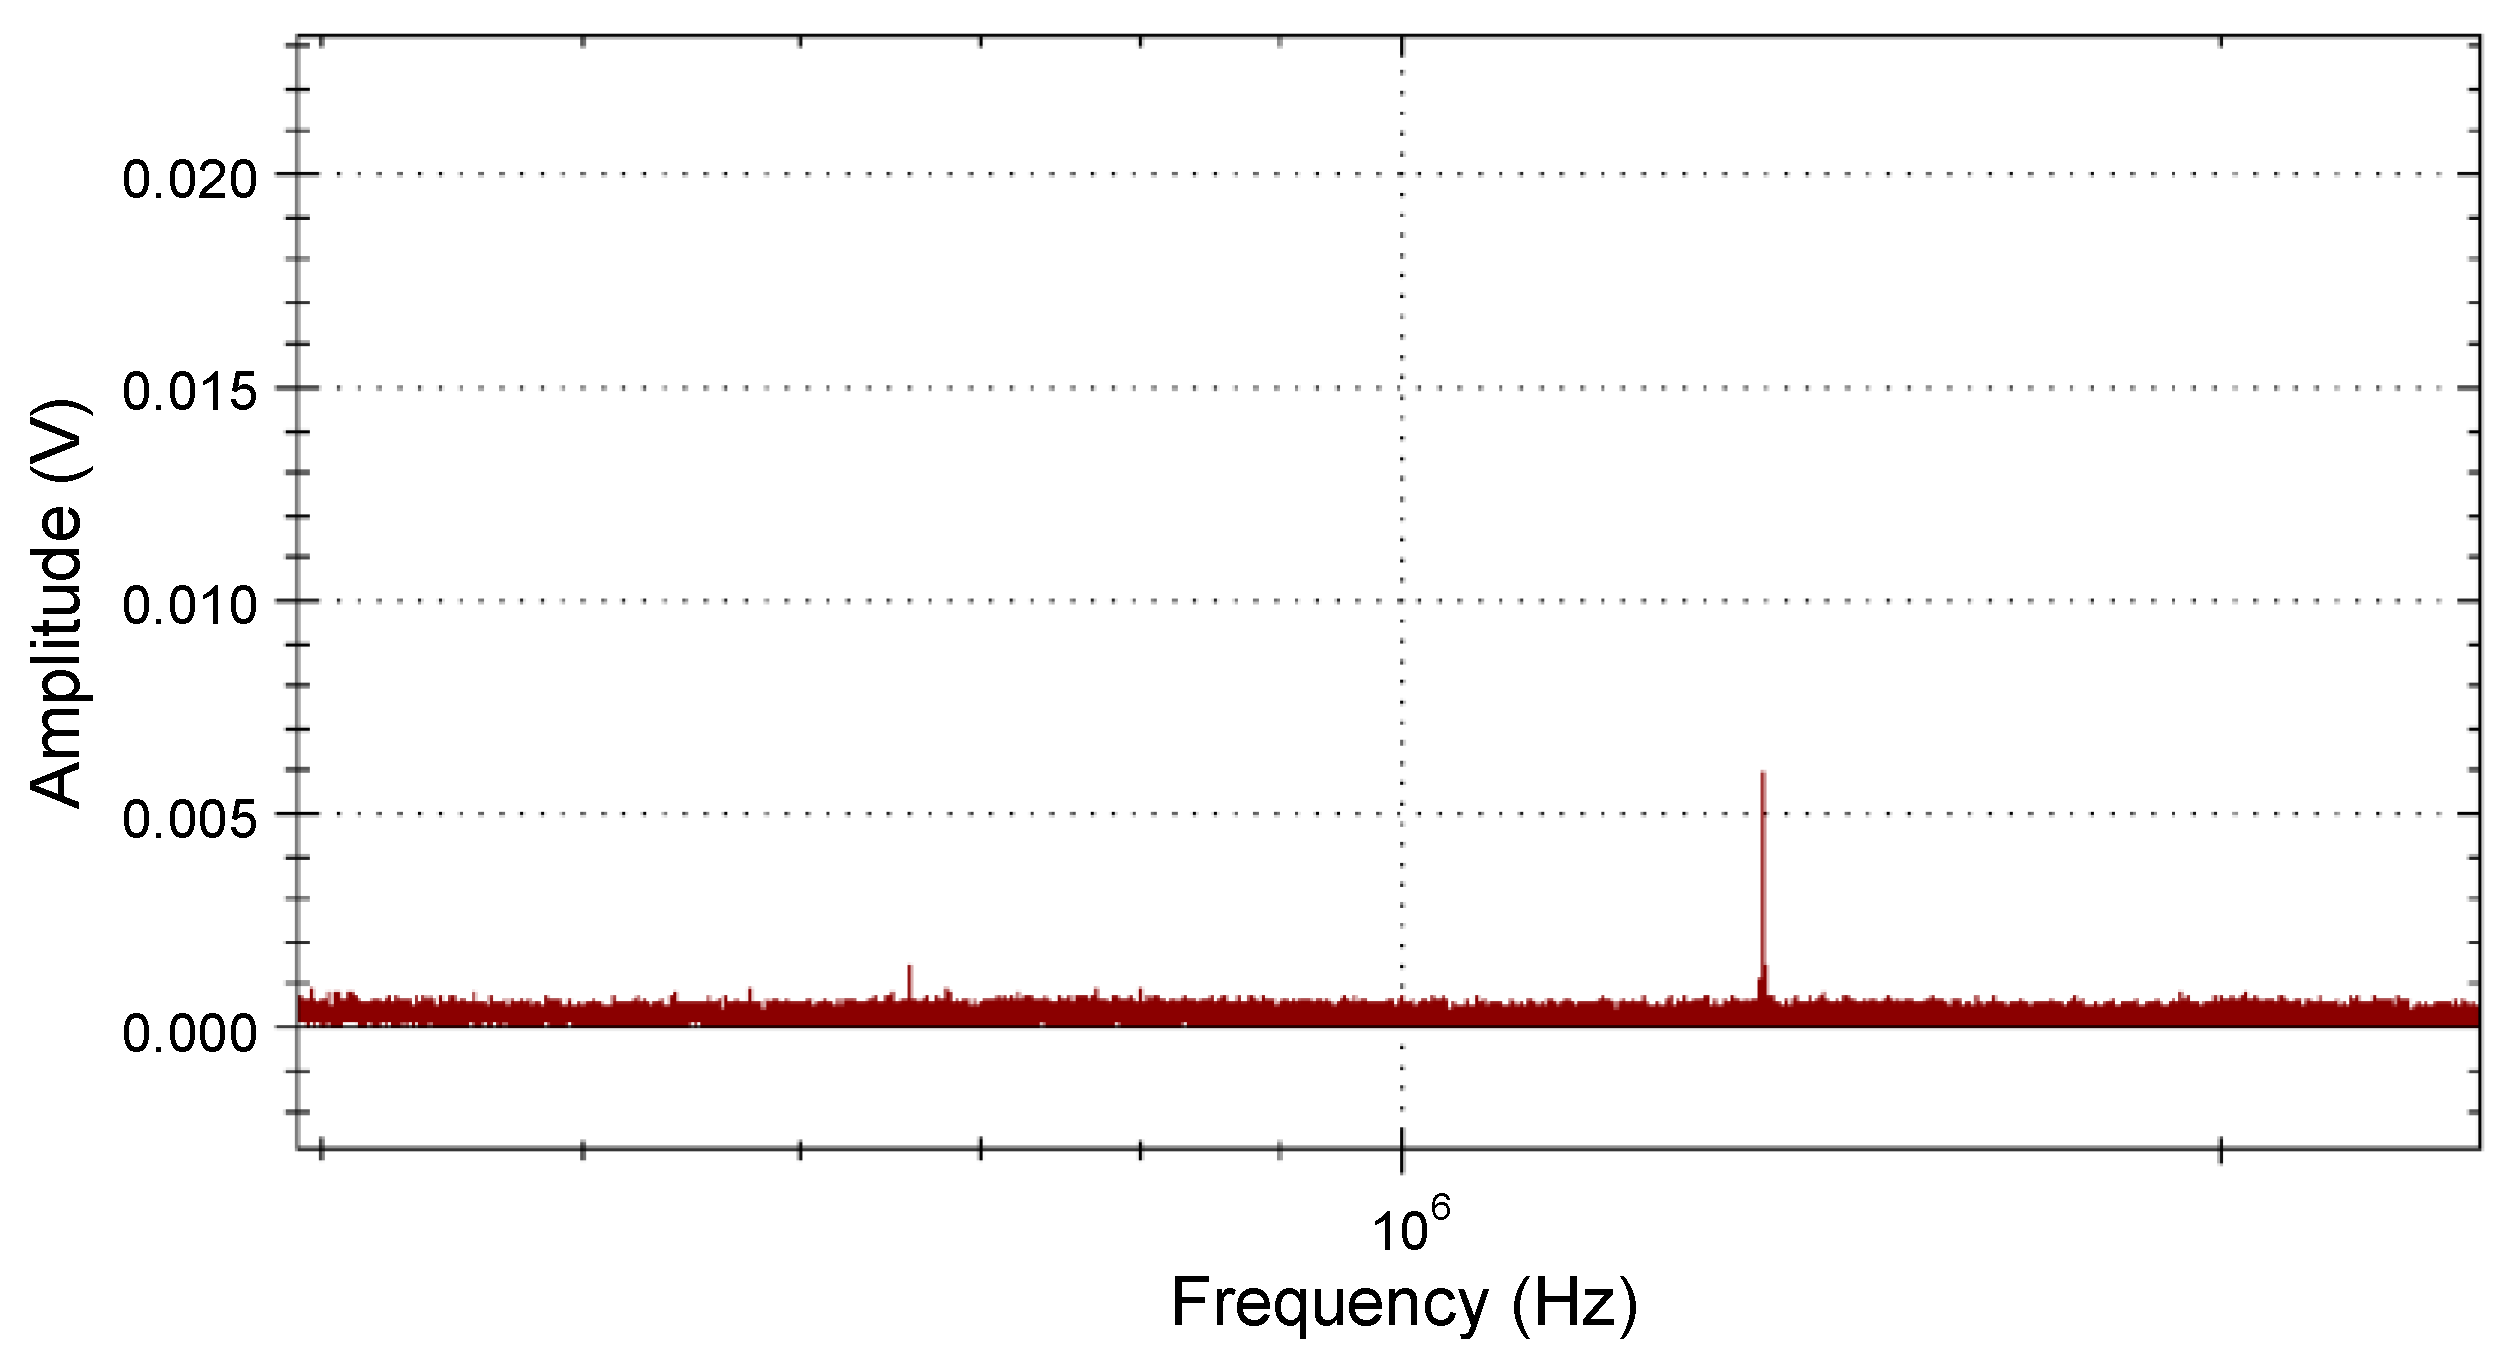
Figure 26 shows the characteristics in the frequency domain of the signal collected from the bushing of phase C, where a formation of discharge pulses in the high frequency spectrum was evident in the 1.5 MHz range. This observation is useful in order to corroborate the indication of a weakness in the insulation of the monitored asset. This same conclusion can be obtained from an analysis of the frequency domain in the bushing of phase B.
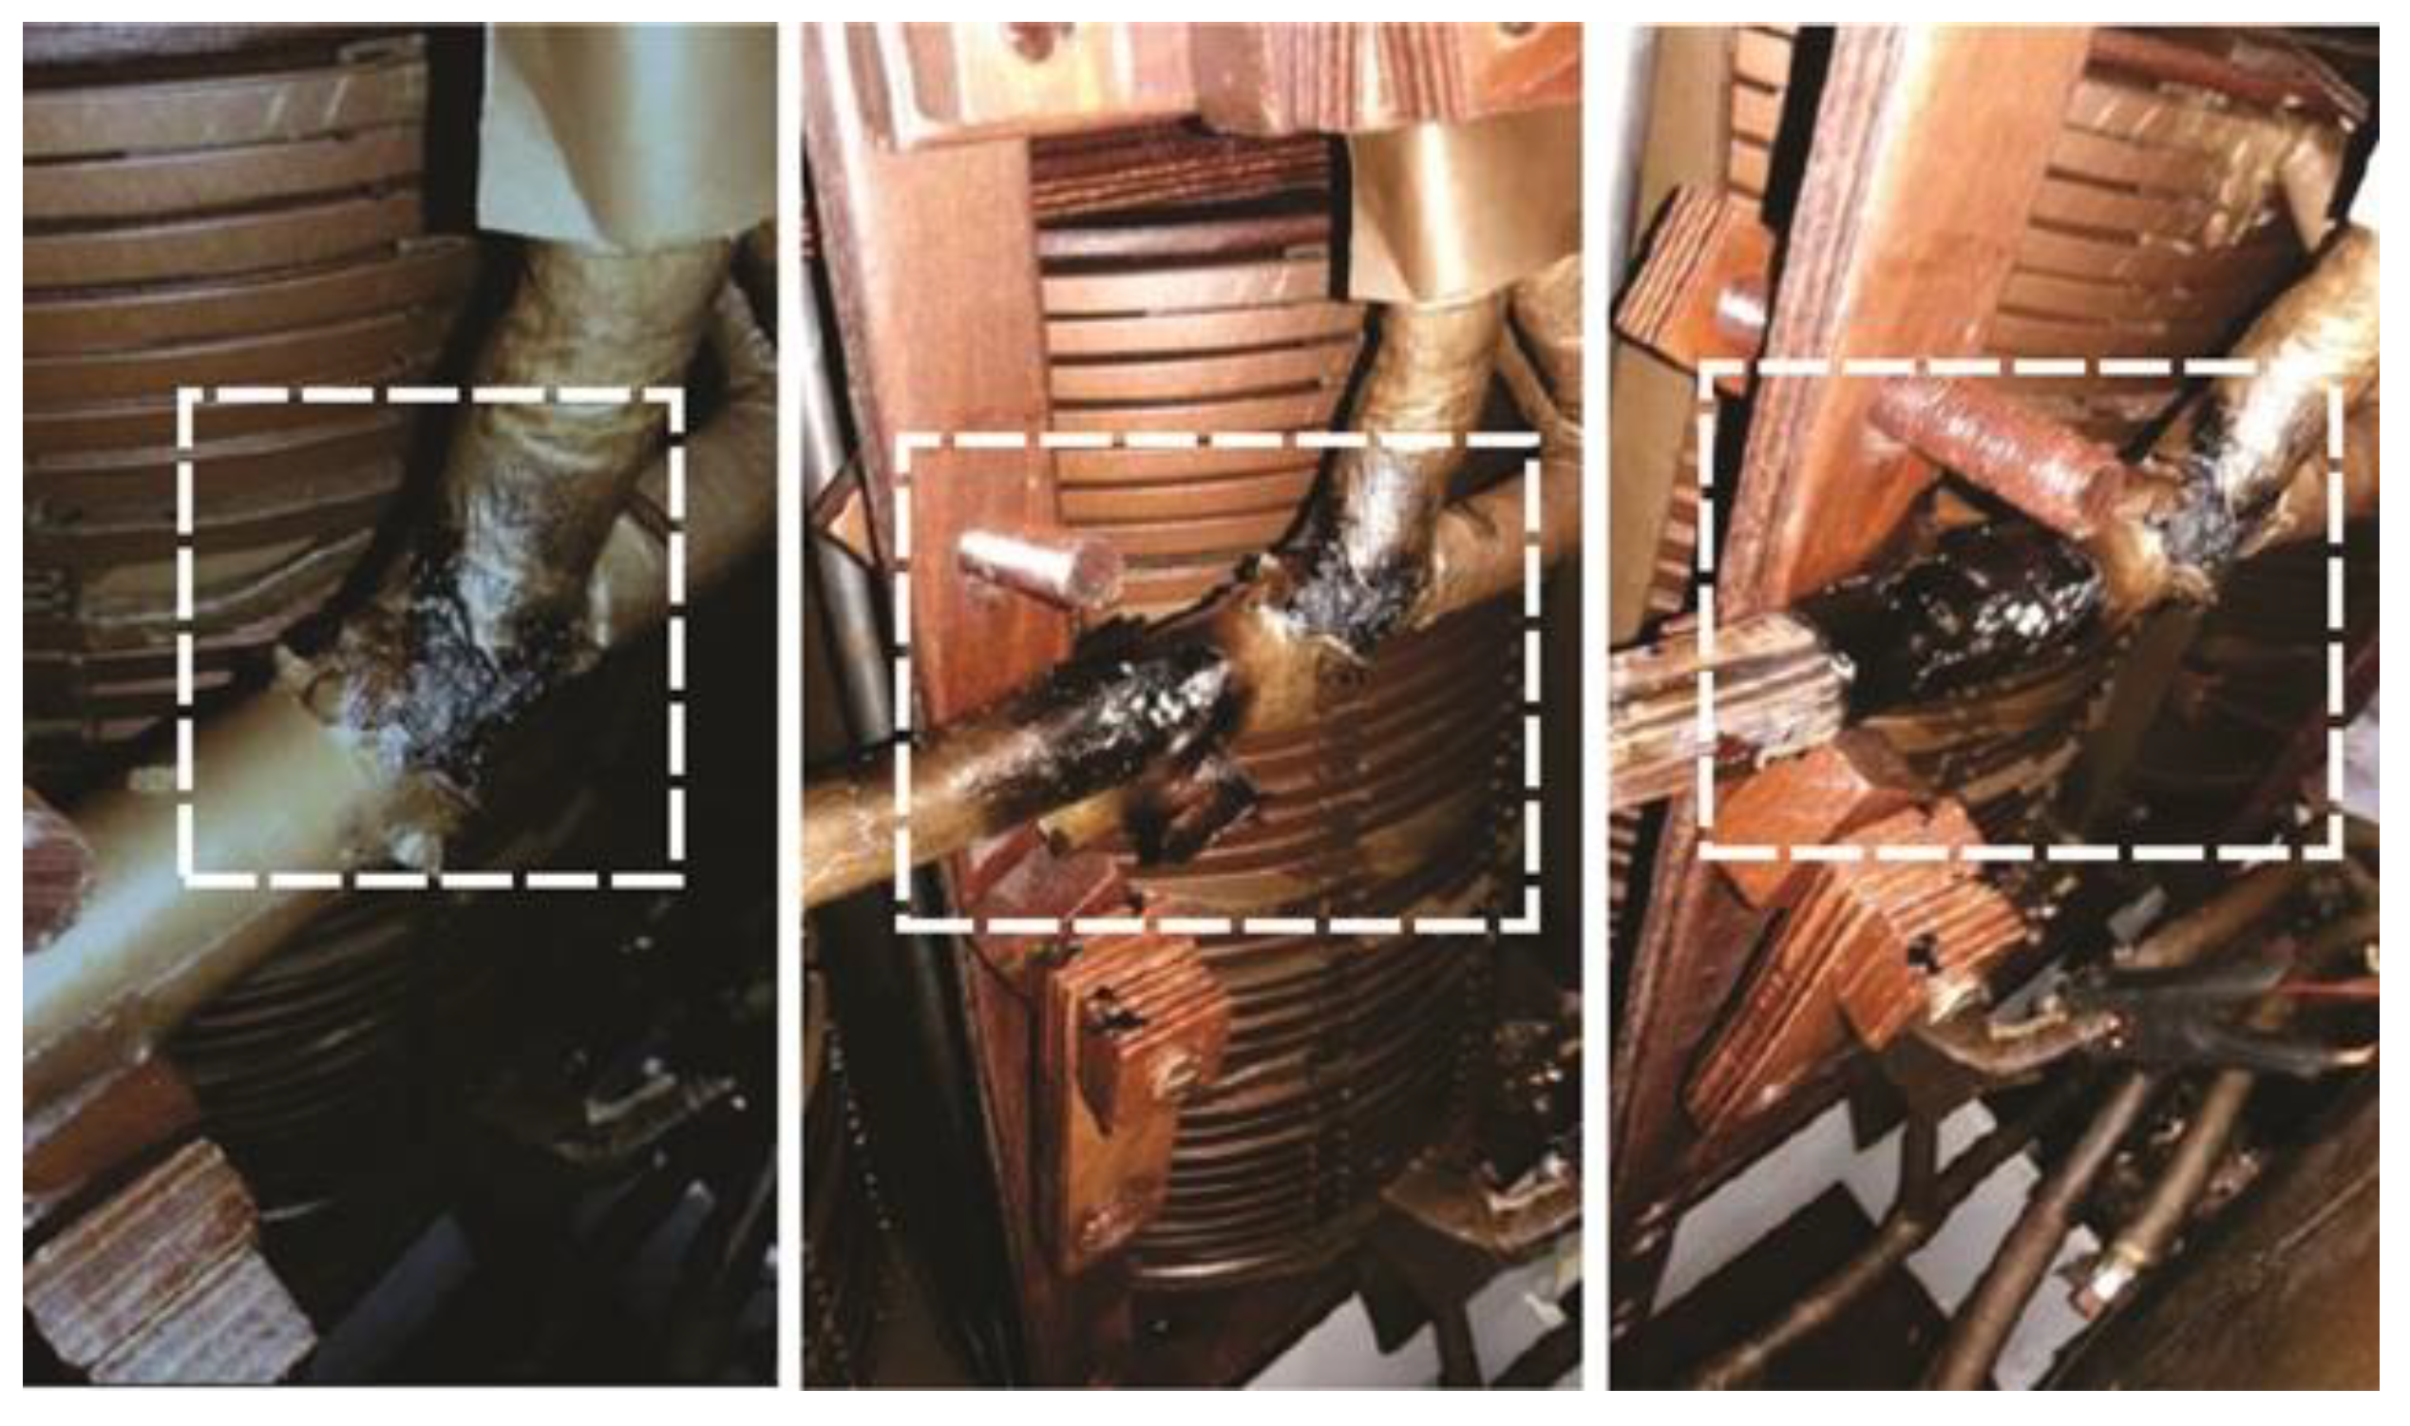
It is noteworthy that the monitoring system presented in this work detected the PDs, but not their origins in the asset. The same observation can be made for the DGA monitor. Thus, as a way of proving that the measurements indicated internal problems in the transformer, a tear-down analysis was conducted. Once this process was carried out, it was possible to identify signs of degradation in the Y connection of the low voltage (LV) windings, as shown in the
Figure 27.
This case is interesting to consider, because the discharges detected in the bushings are consequences of a process that has occurred inside the transformer tank. The explanation for this is that the degradation of the LV winding connections caused a deposit of particles in the insulating oil. When this occurs, a series of chemical reactions are initiated inside the transformer tank, increasing the concentration of dissolved gases, as shown in
Table 4, and generating small bubbles filled with gases in the insulation. These bubbles, when subjected to an electric field, undergo an ionization process that triggers the formation of PDs inside the tank. Thus, due to the coupling of the internal circuit of the transformer, it is possible to detect such discharges at the tap terminal of the condenser bushings.
4. Conclusions
A monitoring system for detecting partial discharges in power transformers was designed and validated in practical situations. The developed monitoring system is based on the electrical method and uses a capacitive coupling on the test tap of transformer bushings to perform a reading of partial discharges. The measurements were carried out onsite and online; that is, with the equipment in service inside the substation.
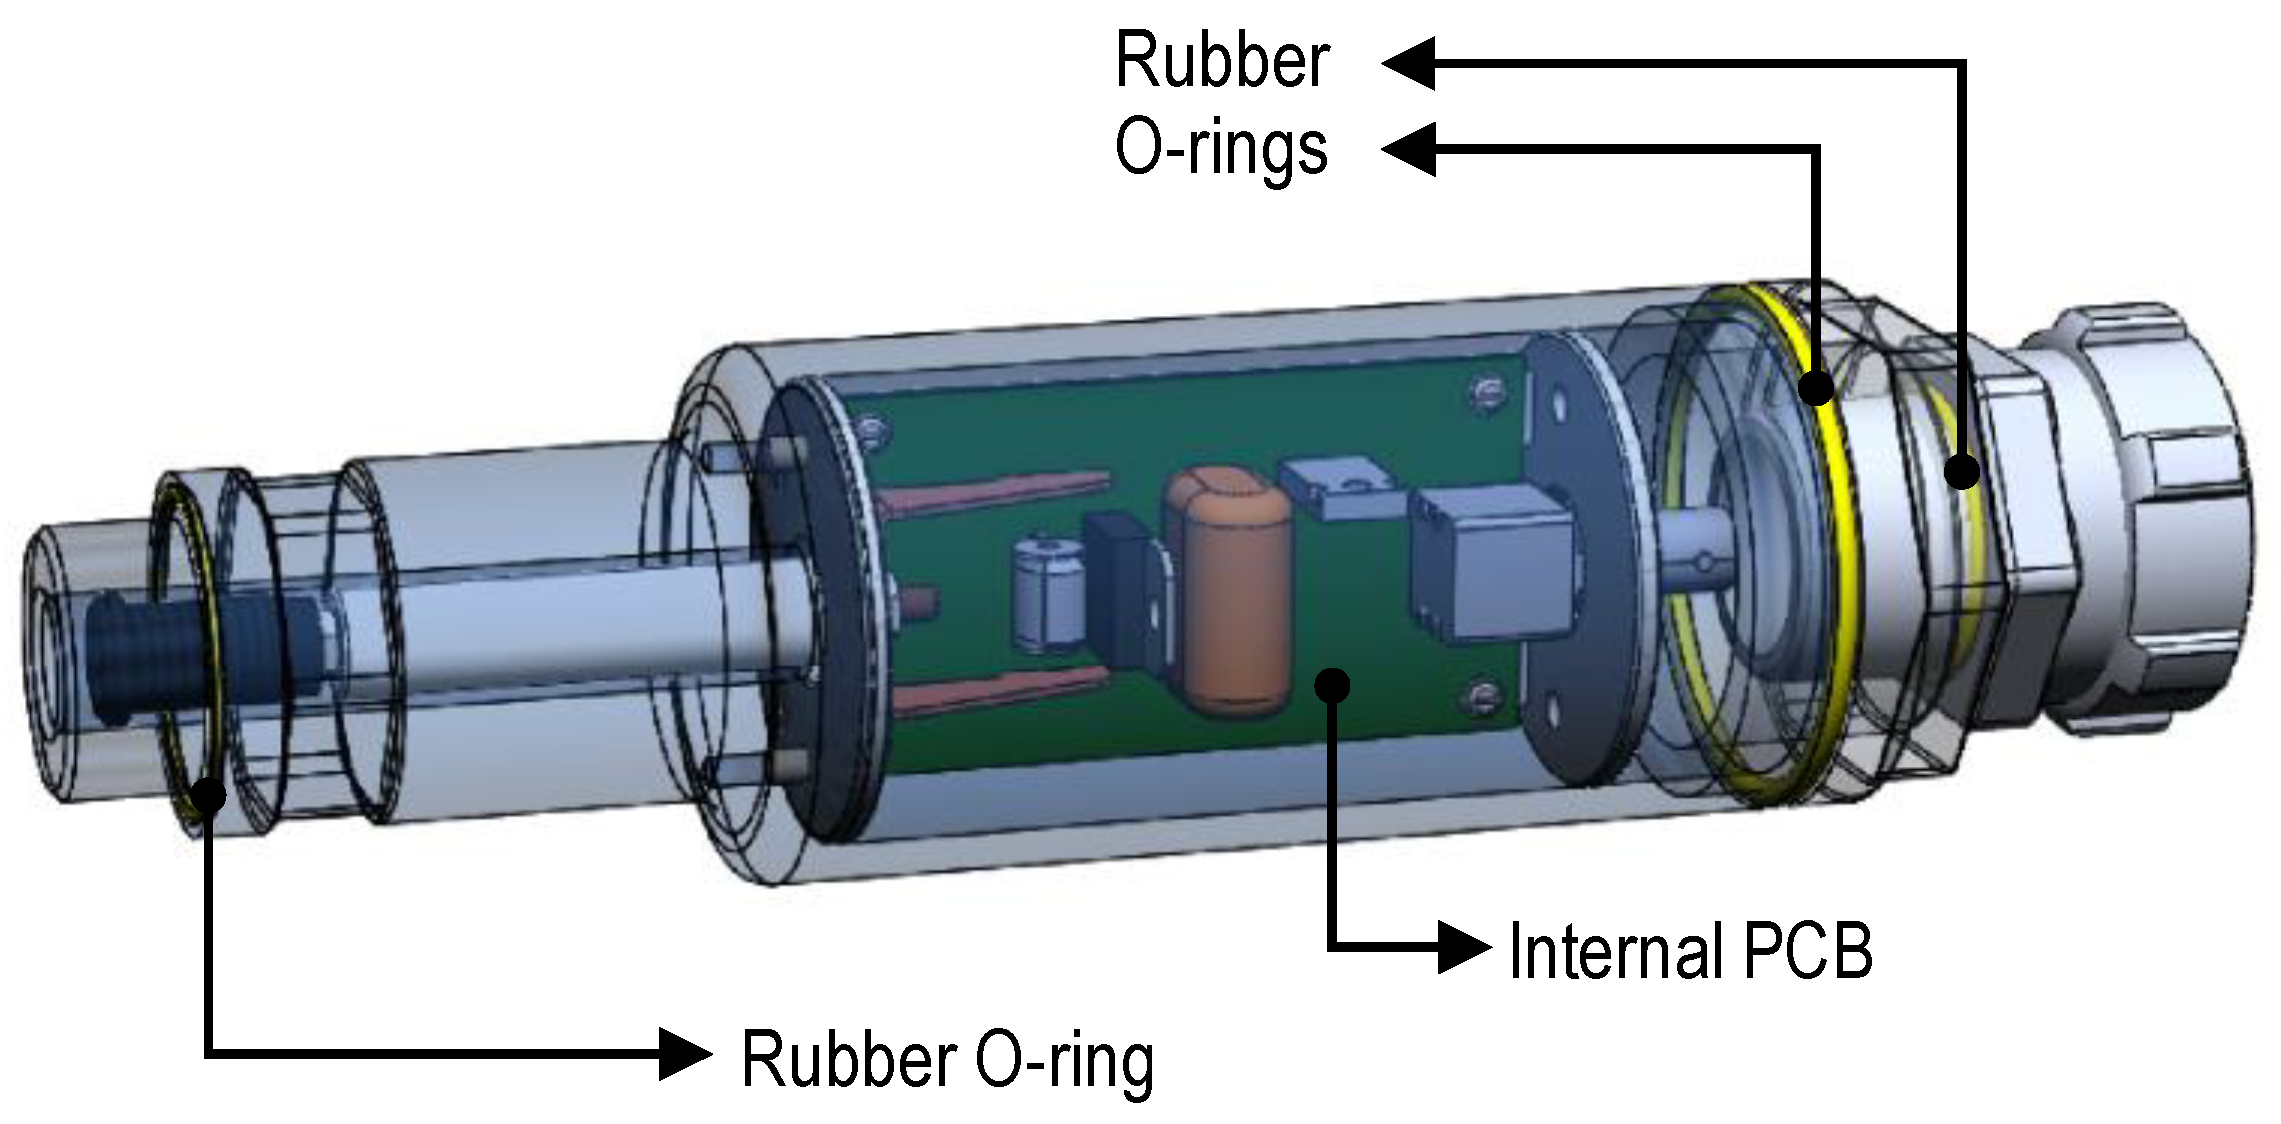
For this development to be feasible, a set of restrictions about reliability and data processing were considered. Reliability was achieved by the development of a protection scheme sufficient to guarantee the integrity of the bushing, even in the face of extreme situations caused by lightning surges. Another important development for reliability was the design of the coupling device that guarantees a secure connection to the tap (i.e., that it be free of moisture and contaminating particles). Regarding data processing, it should be highlighted that the proposed methodology was useful in eliminating all events that occur outside the expected frequency range for a PD, improving the assertiveness of the detection.
Based on laboratory tests and field applications, the feasibility of the developed monitoring system to be applied in the continuous monitoring of PDs was noted without any interference or damage to the insulation of the monitored asset. This aspect is one of the biggest concerns in projects that involve connections to the test tap of condenser bushings.
