1. Introduction
Environmental sustainability represents one of the main drivers for the future development of the automotive industry. As a matter of fact, in the European Union (EU), to guarantee a significant reduction in the contribution of passenger cars to greenhouse gas emissions, more challenging targets will be introduced. For instance, the target of 95 grams of CO
2 per kilometer issued for 2020 [
1] is expected to be reduced by 15% and 37.5% by 2025 and 2030, respectively [
2]. Moreover, the introduction of Real Driving Emissions (RDE) for vehicle tests will force automotive manufacturers to keep criteria pollutant emissions low throughout the whole engine operating map [
3].
In this scenario, downsized and turbocharged gasoline engines are currently increasing their market share thanks to their noteworthy potential for fuel consumption reduction [
4]. As a matter of fact, engine displacement reduction allows the shifting of load points towards higher efficiency regions of the operating map, while performance is preserved or even enhanced thanks to turbocharging [
5,
6,
7]. Nevertheless, the search for continuously increasing boost levels [
8] has led to a dramatic increment of the knock likelihood, requiring quite often spark timing retards, mixture enrichment and/or compression ratio reductions, which can jeopardize the expected CO
2 emissions benefits [
9]. Therefore, the development of effective knock mitigation techniques is crucial to extend efficiency improvements enabled by downsizing at high loads. Several innovative techniques have already been investigated to meet this target, such as Miller cycles [
10,
11,
12], Variable Compression Ratios (VCR) [
13,
14,
15], cooled Exhaust Gas Recirculation (EGR) [
16,
17,
18] or the employment of alternative fuels with higher octane numbers [
19,
20,
21].
Besides the abovementioned technologies, Water Injection (WI) is also nowadays rising as one of the most promising solutions for knock mitigation. WI, taking advantage of the high latent heat of vaporization of the water introduced into the cylinders, allows effective cooling of the charge, thus reducing knock tendency. Moreover, thanks to the increase in the heat capacity of the cylinder charge, an additional cooling effect can be exploited during compression and combustion.
Water Injection technology has been thoroughly examined in the last decade, as has emerged from the literature, where various experimental activities and numerical studies are available. For instance, several papers have assessed the pros and cons of direct and indirect water injection strategies [
22,
23,
24]. Indirect water injection, thanks to its simplicity and cost-effectiveness, seems to be the best candidate for series production. Several studies have focused on the optimization of the Port Water Injection system (PWI): the careful optimization of both operating and design parameters such as water spray Sauter Mean Diameter (SMD), spray targeting, injection timing and pressure has been demonstrated to play a key-role in reducing water consumption [
22,
25,
26,
27,
28,
29]. In a previous work of the authors [
30], issues related to both liquid film formation and oil dilution were discussed. Paltrinieri et al. [
31] analyzed through both a numerical simulation and experimental activities the effects on engine performance of several calibrations of a Port Water Injection system integrated in a single cylinder high specific power engine. The potential of a PWI system was also demonstrated in [
32], where a two cylinder turbocharged spark ignition engine could be operated at a stoichiometric Air-to-Fuel (A/F) ratio in a wide range of operating conditions at high loads with a significant reduction in the Indicated Fuel Consumption (ISFC). Moreover, Khatri et al. [
33] showed the capability of water injection to counterbalance the engine performance reduction related to the use of low octane gasolines, while Wilson [
34] estimated a considerable Brake Specific Fuel Consumption (BSFC) reduction coupling PWI and increased Compression Ratio (CR). Moreover, both Cazzoli et al. [
35] and Bozza et al. [
36] studied the impact of water vapors on Laminar Flame Speed and auto-ignition delay time, while Gern et al. [
37] investigated the effect of water injection on Particulate Matter (PM) emissions.
Based on the above literature overview, 3D-CFD models proved to be very useful in better understanding and in predicting with high accuracy the influence of water on the in-cylinder phenomena. Nevertheless, in order to foresee possible synergies between WI and other promising technologies (e.g., high CR configuration and Miller cycle) by means of a virtual test rig, a reliable 1D model of the whole engine appears to be the most suitable numerical tool. In the scientific literature, different studies on WI technology have been carried out by adopting a 1D approach, which affords the achievement of a reliable prediction of the whole system behavior with reduced computational effort. For example, Cavina et al. [
38] investigated through 1D-CFD simulations the effects of Port Water Injection and Direct Water Injection (DWI) on exhaust gas temperature and knock intensity, subsequently validating their numerical results with an experimental campaign. Furthermore, Bozza et al. developed a 1D model to generate BSFC maps of a downsized turbocharged 2-cylinder engine under wet and dry operating conditions; the computed maps were then embedded in a vehicle model with the aim of estimating the potential CO
2 reduction achievable through WI over a worldwide harmonized light-duty test procedure (WLTP) cycle [
36,
39] and to define the proper sizing of the water tank [
40].
The 1D approach for WI modelling requires reliable sub-models that allow for a physically based reproduction in turbulence, combustion, wall film formation, heat transfer, Cycle to Cycle Variability (CCV) and knock phenomena. Only in this way can a preliminary engine calibration with an enhanced knock resistance be numerically identified, together with realistically expected performance improvements.
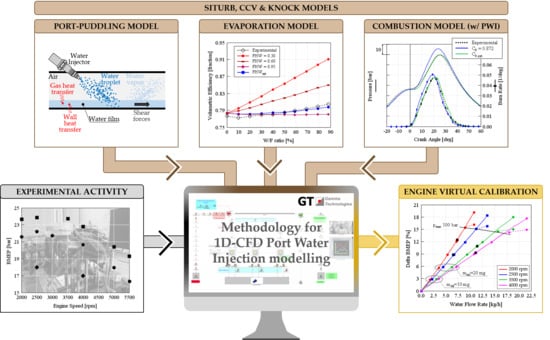
Based on the above considerations, this paper aims to describe a quasi-dimensional approach to model a PWI system integrated in a state-of-the-art Turbocharged Direct Injection Spark Ignition engine [
41]. After a brief introduction to the experimental set-up, the authors describe the main features of the numerical model, which was preliminary calibrated and validated in dry operating conditions. Afterwards, the methodology for PWI modelling is presented and discussed in detail, in three sub-sections. The first describes the integration of the port-puddling model, which allows the proper replication of transient phenomena of water wall film formation in the intake ports. The second focuses on the water evaporation model, calibrated with the aim to correctly account for the fraction of in-cylinder water that evaporates by absorbing heat from walls. The third examines the combustion model, which requires a further refinement in order to accurately predict the effects of water vapors on the burn rate. A final section, in addition to reporting the PWI model validation, assesses the capability of the proposed approach to create a virtual test bench for the optimization of the engine operating parameters at different values of water flow rate.
2. Case Study
The research activities described in this paper were carried out on a state-of-the-art 3-cylinder 1.0L Turbocharged Direct Injection Spark Ignition engine, the main characteristics of which are reported in
Table 1 (see also [
41] for more details). The engine features a very high Compression Ratio for efficiency maximization and is equipped with an electro-hydraulic Variable Valve Actuation (VVA) MultiAir system [
42] on the intake side for gas exchange optimization. A Miller cycle strategy with Late Intake Valve Closing (LIVC) is also exploited both at low and high engine speed to decrease the knock likelihood and to reduce the exhaust gas temperature, respectively.
For the experimental campaign, the engine was installed on the test bench in its standard configuration. It was equipped with three piezoelectric pressure transducers integrated in the spark-plugs to detect in-cylinder pressure signal within each cylinder. A linear lambda sensor was mounted downstream of the turbine to measure the relative Air-to-Fuel ratio. Furthermore, several piezo-resistive pressure transducers and K-type thermocouples were used to monitor pressure and temperature along both intake and exhaust lines. Knocking cycles were experimentally detected on the basis of the value of their knock intensity, measured by means of the Maximum Amplitude of Pressure Oscillations (MAPO) knock index [
43]: cycles for which MAPO was exceeding a proper threshold value were classified as knocking cycles. Knock Limited Spark Advance (KLSA) was experimentally identified as the spark timing for which approximately 2–3% of engine cycles were knocking.
A Port Water Injection system was then integrated into this base layout (see
Figure 1).
The water used for the experiments was de-ionized distilled water stored in a tank at 25 °C. A recirculating pump delivered water at a pressure of 6 bar to the rail, which in turn was connected to three injectors, which were located in the intake runners, one for each cylinder.
During all the tests, the engine was operated at the stoichiometric Air-to-Fuel ratio and was fueled with gasoline with a Research Octane Number (RON) of 95 and a Lower Heating Value (LHV) of 42.5 MJ/kg. Furthermore, water injection timing was kept constant with an End of Injection (EOI) equal to 360 a Crank Angle degree (i.e., equal to gas exchange Top Dead Center). For all measurements, experimental data were recorded and evaluated over 300 consecutive engine cycles, in order to gather a significant statistical sample for knock-limited spark advance operating conditions, where few percent of engine cycles are typically knocking.
Experimental Measurements
A summary of the experimental campaign is depicted in
Figure 2. At first, a set of tests were carried out in dry conditions (i.e., with a Water-to-Fuel ratio (W/F) equal to 0) at Wide Open Throttle (WOT) to define the engine reference performance (red circles). Afterwards, two-part load conditions, namely 2500 rpm–18 bar Brake Mean Effective Pressure (BMEP) and 4000 rpm–17 bar BMEP (green rhombuses), were chosen to analyze the effects of water injection on the combustion process. In particular, different values of Water-to-Fuel ratio, from 0% to 90% at steps of 10%, were tested: for each level of W/F, the spark timing was advanced until knock onset, and the boost level was adjusted in order to keep the engine load constant. Finally, the increase in engine performance enabled by PWI knock suppression capabilities were assessed at WOT exploiting a Water-to-Fuel ratio between 50% and 60% (blue squares).
3. Numerical Set-Up
At first, a detailed 1D-CFD model of the reference engine was built by means of GT-POWERTM, a one-dimensional fluid-dynamic code developed by Gamma Technologies Inc. for engine performance simulation. In particular, a simple injector model was adopted to control the injected fuel mass in order to guarantee a stoichiometric combustion. Concerning water injection, it was performed via multiple profile injectors connected to the intake runners, while the injected water mass was imposed equal to the experimental one. A model-based controller was then introduced to actuate the waste-gate opening diameter in order to match the experimental boost pressure.
After a thorough calibration of the gas-exchange processes, a predictive combustion model, the so-called SITurb [
44,
45,
46], was implemented in the code for the prediction of the burn rate at various operating conditions. Knock detection was instead accomplished through a Kinetics-Fit model, which had been tuned on the basis of a CCV-replicating model.
The following paragraphs contain a detailed description of SITurb, CCV and Knock model calibration processes, which were carried out considering only the experimental tests without the Port Water Injection system.
3.1. Calibration of the Combustion Model
Following a well-assessed hierarchical 1D/3D approach, as a first step a turbulence sub-model was calibrated on the basis of 3D-CFD results obtained at various valve strategies and engine speeds [
44]. The second step of the tuning procedure concerned the optimization of the SITurb combustion model constants. The main characteristics of the SITurb model are briefly summarized in the following sub-section. More details can be found in [
45,
46].
3.1.1. SITurb Model
The entrained mass (
) rate of the unburned air-fuel mixture in the flame front is dependent on the flame area (
), the unburned gas density (
) and the sum of the Turbulent and Laminar Flame Speeds, as expressed by Equation (1):
, namely the Turbulent Flame Speed, is calculated through Equation (2), where
,
and
are, respectively, flame radius, turbulent intensity and turbulent length scale.
In Equation (2), two calibration parameters are present: the Flame Kernel Growth Multiplier (), which scales the flame front evolution, and the Turbulent Flame Speed Multiplier (), which globally scales the Turbulent Flame Speed.
A further calibration parameter, the Dilution Effect Multiplier (
), is instead adopted to tune the effect of diluents such as exhaust residuals, EGR or water on the Laminar Flame Speed (
), which is calculated by Equation (3):
where
is the in-cylinder equivalence ratio,
is the temperature of the unburned gas,
is the in-cylinder pressure and
is the mass fraction of the diluents in the unburned zone.
,
,
,
,
,
and
are model constants.
Finally, Equation (4) is used to determine the burn rate of the entrained unburned mass (
):
where
is assumed to be the time needed by the Laminar Flame Speed to cover the Taylor Microscale (
) of turbulence, expressed by Equation (5).
, the Taylor Length Scale Multiplier, is a further calibration parameter inversely proportional to the burnup rate.
3.1.2. SITurb Model Calibration Results
Six engine operating points at Full-Load, the ones shown with red circles in
Figure 2, were chosen for the tuning of the four SITurb calibration parameters (see
Section 3.1.1). By imposing the experimental spark timing, a Design of Experiment (DoE) methodology, integrated with a Genetic Algorithm optimum search, was used to identify the best set of SITurb constants aimed at minimizing the error between experimental and predicted burn rates for the selected operating conditions [
44]. Once the optimal SITurb calibration parameters have been defined (see
Table 2), the results of the complete engine model were compared with experimental data in order to assess its accuracy and reliability. The values of BMEP, BSFC and Volumetric Efficiency (referred to the air conditions in the intake manifold), depicted in
Figure 3a–c, respectively, highlight a very good agreement with an error below 2%. Moreover, the simulated pressure cycle and burn rate profile reported in
Figure 3d also show a satisfactory correlation with experimental measurements.
3.2. Calibration of CCV Model
Since knock is heavily dependent on Cycle-to-Cycle variability (CCV), its occurrence cannot be predicted by analyzing the average cycle only. However, to physically reproduce the CCV, it would be necessary to accurately model the stochastic behavior of in-cylinder charge motion, the local inhomogeneities of the Air-to-Fuel ratio inside the cylinder, etc. as discussed in detail in [
47]. As a result, the adoption of a 0D phenomenological combustion model does not allow a rigorous modelling of CCV, which instead must be “injected” into the model using a statistically-based approach [
48]. In this research work, the GT CCV model [
49] developed by Gamma Technologies was adopted. Such an approach, after the simulation of some preliminary cycles to achieve the convergence of the flow solution, perturbs two variables of the SITurb combustion model, namely the Turbulent Flame Speed Multiplier
and the Taylor Length Scale Multiplier
, for 300 cycles in a row.
and
assume random values from Gaussian distributions whose standard deviations represent the calibration parameters of the CCV model. Similarly to the approach adopted for SITurb calibration, a DoE methodology integrated with a Genetic Algorithm optimum search was used to calculate the standard deviations of
and
that minimized the error between the experimental and simulated Coefficient of Variation (COV) of the Indicated Mean Effective Pressure (IMEP) (see
Table 3). Afterwards, the average IMEP and its COV resulting from the CCV-run were compared against experimental outcomes. As it can be seen in
Figure 4, the CCV model provides a good estimation of these quantities for almost the entire engine speed range, with the only exception of the 2000 rpm operating condition, for which the simulation underestimates the COV. The root cause of this deviation could be attributed to an overestimation of the scavenging air, due to the particular intake valve lift profile adopted at 2000 rpm; as a consequence, the residuals are underestimated and so is the COV.
3.3. Calibration of Knock Model
Most of the models developed for knock prediction are based on the approach proposed by Livengood and Wu [
50] which states that the auto-ignition of the end gas occurs when:
where
is the induction time of the Air-Fuel mixture and
is the time corresponding to the auto-ignition instant (computed from the start of compression).
Several empirical relationships for induction time calculation have been developed in the scientific literature [
51,
52,
53]. Most of them, however, do not take into account induction time dependence from mixture composition in terms of diluents, such as water, and are not capable of reproducing the Negative Temperature Coefficient (NTC) behavior [
54,
55]. For these reasons, the so-called Kinectics-Fit model, proposed by Gamma Technologies [
49], was preferred for this work; it calculates the induction time on the basis of Equation (7):
where ON is the fuel Octane Number, [Fuel] and [
] are the concentrations in [mol/m
3] of fuel and oxygen, respectively;
is the temperature of the unburned gas;
is the sum of
,
, and
concentrations in [mol/m
3]. The knock Induction Time Multiplier (
) and the Activation Energy Multiplier (
) are the knock calibration parameters while quantities from
to
are model constants.
After the set-up of the artificial CCV model described in the previous section, which led to the simulation of Cycle to Cycle Variability as shown in
Figure 5a, the knock model was calibrated through a Genetic Algorithm optimum search.
and
were tuned (see
Table 4) so that the percentage of knocking cycles detected by the model during the 300 CCV-cycles was coincident to the experimental one. Optimization results are presented in
Figure 5b. The Knock model demonstrated the capability to reproduce the experimental knocking behavior, with the exception of the operating point at 2000 rpm. This is the direct consequence of CCV-model, which underestimates IMEP COV at 2000 rpm (see
Figure 4), thus underestimating the knock occurrence likelihood.
4. Modelling of Port Water Injection
In this section, the numerical approach adopted for the modelling of Port Water Injection system is presented and discussed in detail, in three sub-sections. The first describes the integration of the port-puddling model, which allows the proper replication of transient phenomena of water wall film formation in the intake ports. The second focuses on the water evaporation model, calibrated to discern the water amount that is directly participating in the charge cooling from that which is evaporating on the walls. Finally, the last sub-section examines the SITurb combustion model, which requires a further refinement in order to accurately describe the effect of water vapor on the burn rate.
The calibration of the PWI model has been carried out considering the experimental outcomes obtained at the operating points of 2500 rpm–18 bar BMEP and 4000 rpm–17 bar BMEP, shown in
Figure 2 with green rhombuses.
4.1. Calibration of Port-Puddling Model
A particular model capable of reproducing the formation of a water wall film was adopted for the intake ports downstream of water injectors. Afterwards, with the aim of describing the roles that water performs during each cycle, Equation (8) was introduced:
As represented in
Figure 6, the entire water mass injected at cycle ‘n’ (
) temporarily becomes part of the wall film. Subsequently, the code models the building-up of the liquid film (see
Figure 6a), along with its transportation under the action of shear forces generated by intake air flow and its evaporation. The latter is governed by the heat transfer between the film and the gas flow and between the film and the port walls. However, because of the intimate contact of the thin fuel film with the pipe wall, the film temperature is close to the port wall temperature.
The liquid film modelling is achieved by the two following parameters: the Circumferential Extent of Wall Wetting (CEWW) and the Puddle Velocity Multiplier (PVM). The first one, as shown in
Figure 6a, defines the fraction of the intake port circumference that is covered by the water puddle: higher values imply a greater amount of water that can be retained by the wall film. On the other hand, PVM represents a multiplier to increase or decrease the effect of shear stresses on the transportation of the water puddle: higher values of PVM cause lower amount of water to be trapped in the wall film.
It follows that just a fraction of the injected mass () remains trapped in the wall film (), while the remaining part escapes from the film and enters into the cylinder. Once reached the combustion chamber, the liquid water starts evaporating by extracting heat either from the surrounding air or from the cylinder walls. Afterwards, some vapor can flow back into the intake ports () due to the LIVC. , as vapor, does not become part of the liquid film and it gets entrained in the cylinder during the following cycle. Finally, represents the amount of water which is present in the cylinder during the combustion process.
With the aim of characterizing the evaporation process of the injected water, an index was defined through 3D-CFD simulations [
30]. This index, as described by Equation (9), represents instant by instant the ratio between the mass of water vapor into the cylinder (
) and the maximum amount of water theoretically available at each engine cycle, that is the sum of the injected water during cycle ‘n’
and of the backflow water from the previous cycle ‘n−1’ (
).
Figure 7 reports an example of Evaporation Index computation: after Intake Valve Opening (IVO), entrained water mass produces a subsequent growth of EI; then, from Bottom Dead Centre (BDC) on, a reduction in EI is observed as a consequence of the high water backflow generated by the Miller cycle (Late Intake Valve Closing). The Evaporation Index, due to the build-up of the wall film, varies from cycle to cycle and achieves its highest value, one, when the wall film is saturated and all the injected water enters into the combustion chamber.
To carry out the calibration of the water wall film model, the results of a previous work of the authors were considered [
30]: in particular, the Evaporation Indexes computed for three different values of Water-to-Fuel ratios, namely 9%, 18% and 50%, at the operating point 4000 rpm–17 bar BMEP, were taken as reference. Such calculations showed that the higher the mass of water injected, the higher the fraction retained by the wall film. Moreover, as depicted in
Figure 8a by dashed lines, none of the computed indexes reached the maximum value of one: indeed, they were recorded during the third cycle in a row of Port Water Injection and therefore during the building-up of the liquid film.
To replicate the 3D-CFD Evaporation Indexes, the water wall film model required a calibration process which was carried out through DoE methodology. In particular, for each Water-to-Fuel ratio, the optimal pairs of CEWW and PVM aimed at minimizing the error between 1D-CFD and 3D-CFD Evaporation Indexes were determined.
Solid lines of
Figure 8a represent the results of the refined water wall film model, while
Figure 8b reports the values of its calibration parameters as a function of the total mass of injected water per cylinder.
Considering the operating point 4000 rpm–17 bar BMEP and a Water-to-Fuel ratio of 50%, the different roles of the injected water were analyzed as a function of the consecutive engine cycles with PWI (see Equation (8)), as depicted in
Figure 9a.
Figure 9b shows instead the impact of the water wall film formation on PWI effectiveness in reducing knock tendency. It can be noticed that during the first cycle of port water injection, almost all injected water remains trapped in the wall film (
Figure 9a), and therefore knock likelihood is not reduced (
Figure 9b). On the other hand, after six cycles, film building-up is almost complete and practically all the injected water gets trapped in the cylinder, thus effectively diminishing knock tendency. Therefore, it can be stated that the PWI system, at the operating point 4000 rpm–17 bar BMEP and with a Water-to-Fuel ratio of 50%, becomes fully effective after six cycles of water injection. In steady state conditions, represented in
Figure 9a,b by cycles ‘k’ and ‘k+1’, the fraction of injected water mass that gets trapped in the wall film is null (i.e., the amount of water that enters the film is equal to that which comes out). Moreover, the backflow water of cycle ‘n−1’ is equal to the one of cycle ‘n’. It follows that, in steady state conditions, the amount of water that takes part in the combustion process (
) is equal to the injected water (
).
4.2. Calibration of Evaporation Model
The engine model governs the water vaporization within the cylinder through a simple phenomenological evaporation model. However, a detailed investigation to quantify the charge cooling effect produced by the phase change of water needs to be carried out. As a matter of fact, when entering the cylinder, the water droplets can impact on either the piston or the liner, thus extracting the heat requested for evaporation from the walls instead of the surrounding gases. The share between these contributions can be tuned through a parameter known as Fraction of Vaporized Heat Taken from Walls (FHW). The latter accounts for the fraction of water whose vaporization occurs on the cylinder walls rather than within the cylinder gases. As shown in
Figure 10a,b, where the in-cylinder temperature at Intake Valve Closing (IVC) and the Volumetric Efficiency are respectively reported, an excessively low value of FHW implies a larger amount of heat adsorbed from surrounding air, thus inducing a significant in-cylinder gases cooling with a consequent overestimation of the Volumetric Efficiency. The increase in FHW improves the calculation of engine airflow: however, a constant value for this parameter does not ensure a satisfactory correlation between numerical and experimental Volumetric Efficiency. Therefore, considering the operating point 4000 rpm–17 bar BMEP, the FHW was optimized as a function of the total amount of liquid water that enters the cylinder, with the objective being to match the experimental air flow rate (Equation (10)).
where
represents the instantaneous mass flow rate of liquid water that passes through the intake valves of a single cylinder.
From Equation (10) it was noticed that, considering a 10% Water-to-Fuel ratio, only around 6% of in-cylinder liquid water vaporizes within the cylinder gases. Furthermore, such a percentage rises along with the increase in the injected water and achieves a value around 15% with a Water-to-Fuel ratio equal to 90%. In accordance with previous findings [
29,
31,
33], these results evidence a poor efficiency of PWI system in reducing the charge air temperature.
The robustness of Equation (10), which was defined for the operating point 4000 rpm—17 bar BMEP, was assessed at the operating point 2500 rpm–18 bar BMEP. As depicted by the blue solid line of
Figure 10, the FHW optimization limits the reduction in in-cylinder temperature produced by the increase in the injected water, allowing the correct reproduction of the experimental Volumetric Efficiency for any Water-to-Fuel ratio.
4.3. Calibration of Dilution Effect Multiplier
Despite replicating the experimental values of boost pressure, spark timing, lambda and intake airflow, the engine model was not capable of satisfactorily predicting the evolution of the combustion process when water was injected. In particular, the higher the water content, the higher the deviation from experimental results: this trend is evident when observing
Figure 11a, where both the center of gravity of the combustion and the in-cylinder pressure peak (p
max) are reported. This error was attributed to an incorrect estimation of the Laminar Flame Speed, the only parameter involved in burn rate calculation which depends on the in-cylinder mass fraction of water (see Equations (1) and (3)). As claimed by several authors [
31,
35,
36], the water dilution of the air–fuel mixture drops the
, thus delaying the combustion duration. This effect, governed in the SITurb model by the
(see Equation (3)), seems to be underestimated, thus resulting in a more advanced MFB
50 (Crank Angle corresponding to 50% of fuel burned) and a consequently higher in-cylinder pressure peak.
Based on the above considerations and similarly to the approach used for FHW,
was calibrated as a function of the total amount of in-cylinder water vapor present at spark timing, in order to minimize the error on the prediction of the combustion center of gravity. FHW optimization, carried out at operating point 4000 rpm–17 bar BMEP, led to definition of Equation (11):
As expected, Equation (11) shows that the greater the water content, the higher the optimal
and therefore the impact on
slows, as described in the scientific literature. It is worth remembering that, at steady state conditions, the amount of water that takes part in the combustion process (
) is equal to the amount of injected water, as already described in
Section 4.1.
The robustness of Equation (11) was then assessed at the operating point 2500 rpm–18 bar BMEP: observing the green line of
Figure 11a, the
optimization led to MFB
50 and maximum in-cylinder pressure values well correlated with the experimental results for the entire Water-to-Fuel ratio sweep, with errors lower than 2%. Moreover, also the simulated pressure cycle and the burn rate profile reported in
Figure 11b for a 90% W/F show a satisfactory correlation with experimental measurements.
6. Conclusions
This paper describes a methodology, based on a quasi-dimensional approach, to model a PWI system and to assess its knock mitigation potential, thus significantly reducing the experimental effort for engine calibration.
In a first stage, experimental investigations were carried out at the engine test bench to characterize the engine behavior under “dry” (i.e., without WI) and “wet” (i.e., with WI) operation. Afterwards, the experimental outcomes obtained without PWI were used to calibrate the combustion (SITurb), CCV and knock models. In particular, knock model constants were tuned by simulating CCV over 300 consecutive engine cycles with the aim of matching the experimental percentage of knocking cycles. In a second stage, the results of 3D-CFD simulations of the PWI were used to calibrate a port-puddling model: the latter, once implemented in the reference engine model, was proven to properly replicate transient phenomena of water wall film formation, catching cycle by cycle the amount of water that enters into the cylinder and is therefore available for knock mitigation. Subsequently, the experimental results collected at medium loads with W/F sweeps were considered for the refinement of both water evaporation and SITurb model. The first one was calibrated to properly discern the fraction of the injected water that is producing the charge cooling through its evaporation from that which is evaporating due to the heating from the walls. Then, the SITurb model was tuned in order to carefully predict the impact of the injected water on the Laminar Flame Speed: in particular, a linear dependence between the in-cylinder vapor content and the Dilution Effect Multiplier was found. The PWI model was then validated against the experimental tests carried out at Wide Open Throttle with PWI, showing the capability to accurately predict the effects of water injection in terms of both burning rate slow down and knock tendency reduction. Finally, the proposed methodology was used to create a virtual test bench, which allowed the evaluation of engine performance improvement as a function of the injected water mass flow rate.
The same methodology will be adopted in a future work in order to determine the water consumption as well as the potential benefits in terms of CO2 emission achievable over RDE cycles.


