Article

Fault Ride through Capability Analysis (FRT) in Wind Power Plants with Doubly Fed Induction Generators for Smart Grid Technologies †

by
Aphrodis Nduwamungu
1,*,
Etienne Ntagwirumugara
1,
Francis Mulolani
2 and
Waqar Bashir
3
1
Africa Centre of Excellency in Energy for Sustainable Development, University of Rwanda, Kigali 4285, Rwanda
2
Department of Electrical and Electronics Engineering, Copperbelt University, Kitwe 10101, Zambia
3
School of Electrical Engineering and Automation, Tianjin Polytechnic University, Tianjin 300160, China
*
Author to whom correspondence should be addressed.
This paper is an extended version of Dynamic grid fault analysis in wind power plant with DFIG by using supervisory control and data acquisition (SCADA) viewer; 2020 5th International Conference on Sustainable and Renewable Energy Engineering (ICSREE 2020); Paris-France, 6–9 May 2020; https://www.e3sconferences.org/articles/e3sconf/abs/2020/41/e3sconf_icsree2020_03006/e3sconf_icsree2020_03006.html.
Energies 2020, 13(16), 4260; https://doi.org/10.3390/en13164260
Submission received: 22 June 2020 / Revised: 27 July 2020 / Accepted: 28 July 2020 / Published: 17 August 2020
(This article belongs to the Section A3: Wind, Wave and Tidal Energy)

Abstract

:
Faults in electrical networks are among the key factors and sources of network disturbances. Control and automation strategies are among the key fault clearing techniques responsible for the safe operation of the system. Several researchers have revealed various constraints of control and automation strategies such as a slow dynamic response, the inability to switch the network on and off remotely, a high fault clearing time and loss minimization. For a system with wind energy technologies, if the power flow of a wind turbine is perturbed by a fault, the intermediate circuit voltage between the machine side converter and line side converter will rise to unacceptably high values due to the accumulation of energy in the DC link capacitor. To overcome the aforementioned issues, this paper used MATLAB simulations and experiments to analyze and validate the results. The results revealed that fault ride through capability with Supervisory Control and Data Acquisition (SCADA) viewer software, Active Servo software and wind sim packages are more adaptable to the variations of voltage sag, voltage swell and wind speed and avoid loss of synchronism and improve power quality. Furthermore, for protection purposes, a DC chopper and a crowbar should be incorporated into the management of excess energy during faults and a ferrite device included for the reduction of the electromagnetic field.

1. Introduction

The worldwide energy consumption and demands are increasing very quickly because of the rapid growth of the population, industrialization and modernization [1]. In response to this growth in demand, different technologies are being applied and implemented in different countries for the purpose of electricity diversification and to increase the rate of electrification. Incorporating distributed energy resources (DERs) technologies in the utility grid is one of the most common methods due to various reasons such as low maintenance requirements, cost saving, economic, environmental and storage capabilities, with rural electrification as one strategy for reducing several households who do not have access to electricity [2].
The wind turbine based on Doubly Fed Induction Generator (DFIG) technology is classified among renewable energy technologies where usable electricity is produced from the driving force of the wind through wind turbines and generators. The DFIGs are induction machines that have windings on both the rotor and the stator. Therefore, the rotor and stator are capable of transferring active power through the shaft and electrical system. The stator winding is usually immediately connected to the utility grid, while the rotor winding is connected to the utility grid via a static transfer switch or power electronic converters. Doubly fed machines are customarily applied in applications requiring variable shaft speed of the machine in a restricted range of the synchronous speed [3].
Due to the variable nature of the wind speed, the reliable, stable and dynamic operation of the power grid networks containing wind farms is a significant challenge for both researchers and utility grid operators. The requirements for voltage and frequency variation within the permissible range given by a country or region’s grid codes and standards must be met to prevent the cessation or suspension of a power grid’s service during the time of dynamic power grid disturbances [4].
The main objective of this paper is to analyze the FRT capability of a grid connected wind power plant with a DFIG through MATLAB simulation and laboratory experiments. The experimental verification was carried out using SCADA viewer software and an Active Servo software package. The paper is arranged as follows: (1) Introduction, (2) Review of DFIG wind turbines, (3) System modelling, (4) Wind power plant concepts, (5) Traditional grid technologies versus smart grid technologies, (6) Analysis and validation of the designed model, (7) Results and interpretations, (8) Conclusion.

2. Review of Wind Turbine Technologies

In its steady state, operation via a Doubly Fed Induction Generator generates or consumes active power (P), which is fed into the utility grid. The consumption and generation of active power may not be balanced during certain circumstances. This results in changes in the active power input, voltage regulation and frequency stability [5]. The dynamic behavior of a wind power plant involves short-term pronounced changes in the mains voltage brought about by grid faults. The requirements for wind power plants in different countries comply with what is termed fault ride through (FRT), as well as dynamic voltage regulation and associated rise times. The dynamic behavior of wind power plants has been analyzed by different researchers when it is synchronized to the utility grid. An overview of their results shows that the DC link can be overloaded due to the lack of a DC chopper and a crowbar [6]. The output of a wind power plant is provided by the blades after being converted from kinetic energy into mechanical energy [7]. A Doubly Fed Induction Generator was used to overcome the issue of voltage fluctuation but the poor communication issue was still there (the grid faults led to voltage sag in short duration at the feed point) [8].The communication issue was partially solved but the overloading issue for an intermediate electronic circuit located between the machine side converter (MSC) and the line side converter (LSC) was not resolved [9].Voltage dips are classified based on magnitude and phase with different controllers even if the excess energy is still not solved [10].
The utility grid containing wind power plants requires a tangible method for controlling any disturbance with the best fault clearing time. The FRT is one of them and focuses on differently sized voltage dips on a wind power plant so that the wind farm can stay synchronized in any circumstance to increase the reliability and power quality [11].

3. Design, Modelling and Operating Characteristics of Wind Turbine Technologies

Figure 1 is simulated in MATLAB/Simulink. In the steady state, Figure 1 shows that reactive power can be supplied via the MSC to the generator. Throughout a voltage sag, the current can also be supplied via the LSC to guarantee the required dynamics. Because the LSC is primarily responsible for regulating the intermediate circuit voltage, a limited reactive current can be fed in this case. It is mandatory to decouple voltages and currents to control reactive power and active power [12]. Consequently, the current and voltage of rotor windings and stator windings are required to be decoupled into components to calculate reactive power and active power for wind turbines in the synchronous reference frame [13].

3.1. Mathematical Modelling of DFIG Under Balanced Conditions of Utility Grid Voltages

The Doubly Fed Induction Generator (DFIG) is represented in the synchronous reference frame. Referring to Figure 2, the electrical equations for the stator voltages in the synchronous reference frame may be written as a function of magnetizing currents and stator flux as [13,14,15]:
V ds = R s i ds + d φ sd dt ω s φ sq
V qs = R s i qs + d φ sq dt + ω s φ sd .
The voltages at the rotor side are expressed as follows:
V rd = R r i rd + d φ rd dt ω r φ rq
    V rq = R r i rq + d φ rq dt + ω r φ rd   .
The magnetic equations for stators and rotors are written as follows:
{ φ s d = L s i s d + M i r d φ s q = L s i s q + M i q φ r d = L r i r d + M i s d φ r q = L r i r q + M i s q .
The calculation of active power and reactive power in the stator winding are determined using the following equations and assuming that the stator resistance ( R s ) is negligible, the stator flux φ s is constant and the stator voltage V s is constant and aligned along the direct axis so the following equations may be deduced as shown:
{ P s = V sd i sd + V sq i sq Q s = V sq i sd V sd i sq . { φ sd = φ s   = c te φ sq = 0 .
Equations (1) and (2) become:
{ V sd = 0 V sq = V s = ω S φ S V rd = R r i rd + d φ rd dt ω r φ rq   V rq = R r i rq + d φ rq dt + ω r φ rd .
The flux equations become:
{ φ sd = φ s = L s L sd + M i rd 0 = L s i sq + M i rq φ rd = L r i rd + M i sd φ rq = L r i rq + M i sq .
The stator currents are written as follows:
{ i sd = φ s L s Mi rd L s i sq = Mi rq L s .
By the considering Equation (9) the active power and reactive power are mathematically calculated as:
{ P s = V sq i sq = MV s i rq L s Q s = V sq i sd = V s φ s L s i rd .
By substituting Equation (9) into Equation (8) the flux equations becomes:
{ φ rd = ( L r M L s ) i rd + M φ s L s = ( L r M 2 L s ) i rd + MV s ω s L s φ rd = ( L r M 2 L s ) i rq .
Finally, the new direct axis and quadrature axis voltage on the rotor side are calculated as follows:
{ V rd = R r i rd + ( L r M 2 L s ) d i rd dt g ω s ( L r M 2 L s ) i rq V rq = R r i rq + ( L r M 2 L s ) d i rq dt + g ω s ( L r M 2 L s ) i rd + g MV s L s
Since the stator winding is an open circuit, which means that the current is not passing, before synchronization the stator currents are zero ( i d s = i q s = 0 ).

3.2. Mathematical Modelling of Active and Reactive Power for Wind Turbines Based on DFIG during Transmission Line

The active and reactive power that is produced at a certain distance from the wind energy source to the utility grid can be determined mathematically and thus, defines if the induction machine is working as a generator or a motor. These mathematical equations are based on mathematical power transfer equations [13]. The mathematical equations are as follows:
P = U s   U r sin δ X L
Q = U s ( U s   U r cos δ )   X L .
Squaring both Equations (13) and (14) and separating all terms containing sine and cosine we obtain the following equations:
( P ) 2 = ( U s U r X L sin   δ ) 2
From Equation (14) the voltage terms are multiplied and grouped together to give Equation (16)
Q = U s U s U s U r cos δ X L   Q   = U s 2 X L U s U r cos δ X L ( Q U s 2 X L ) 2 = ( U s U r cos δ X L ) 2 P 2 + ( Q U s 2 X L ) 2 = ( U s U r X L ) 2 .
Adding Equations (15) and (16) give Equation (17)
P 2 + ( Q U s 2 X L ) 2 = ( U s U r X L ) 2 ( cos 2 δ +   sin 2 δ )
recalling that ( cos 2 δ +   sin 2 δ ) = 1 .
Assuming that Q = 0 , Equation (17) becomes
P 2 + ( U s 2 X L ) 2 =   ( U s U r X L ) 2 .
  P = ±   ( U s U r X L ) 2 ( U s 2 X L ) 2   .
Through Equation (18) the following range can approximately give the range of active power that may be supplied or consumed from the utility grid
( U s U r X L ) 2 ( U s 2 X L ) 2   P   ( U s U r X L ) 2 ( U s 2 X L ) 2   .
The reactive power that can be supplied or consumed from the utility grid can approximately be determined optional from Equation (17) as follows:
( Q U s 2 X L ) 2 = ( U s U r X L ) 2 P 2   ( Q U s 2 X L ) 2 = ( U s U r X L ) 2 P 2   ( Q U s 2 X L ) = ( U s U r X L ) 2 P 2 .
The reactive power (Q) is then approximately calculated as follows:
Q = ( U s U r X L ) 2 P 2 U s 2 X L .
Therefore, from Equation (22) the range of reactive power can be given as:
( U s U r X L ) 2 P 2 U s 2 X L   Q ( U s U r X L ) 2 P 2 U s 2 X L .
U s is a sending voltage; U r is a receiving voltage.
X L is a transmission line, δ angle.

3.3. Mathematical Modelling of DFIG under Unbalanced Conditions of Utility Grid Voltages

Assuming that the Doubly Fed Induction Generator ground point is not synchronized to the utility grid, the flux, current vectors and asymmetric voltages may be decoupled into positive and negative sequences and expressed in a space vector [16,17]. As shown in Figure 3, the reference frame transformation of the space vector F between ( α β ) ,   ( α r β r ) , ( d q ) +   and   ( d q ) reference frames may be described by
F α β ( t ) = F ( α β ) + ( t ) + F ( α β ) ( t ) .
In the positive and negative sequences, the equations are developed as follows:
[ V α ( t ) V β ( t ) ] = [ V α + ( t ) + V α ( t ) V β + ( t ) + V β ( t ) ] = [ V + cos ( ω t + φ + ) + V cos ( ω t + φ ) V + sin ( ω t + φ + ) + V sin ( ω t + φ ) ]
where the positive sign (+) and negative sign (−) are positive and negative sequences, respectively and φ + is symbolized as the positive and φ is symbolized as the negative sequence phase shifts, respectively. The relationship between the positive and negative sequences in direct ( d ) and quadrature ( q ) axes are described in the stator voltage reference frame as shown in Figure 3.
The positive sequence rotates at an angular speed ω s aligned with a synchronous reference frame, while the negative sequence rotates at the ω s speed in the opposite direction of the synchronous reference frame. The negative sequence in the synchronous reference frame leads to components oscillating at twice the fundamental frequency that leads to computational and control issues. The voltages, flux and currents equations are developed mathematically as follows:
{ V dqs + = V dqs + + V dqs + + = V dqs + + + V dqs · e 2 j ω s · t i dqs + = i dqs + + + i dqs + = i dqs + + + i dqs + · e 2 j ω s · t λ dqs + = λ dqs + + + λ dqs + = λ dqs + + + λ dqs + · e 2 j ω s · t V dqr + = V dqr + + V dqr + + = V dqr + + + V dqr + · e 2 j ω s · t i dqr + = i dqr + + + i dqr + = i dqr + + + i dqr + · e 2 j ω s · t λ dqr + = λ dqr + + + λ dqr + = λ dqr + + + λ dqr + · e 2 j ω s · t   } .
The negative sequence (NEG) in the synchronous reference frame and also the equations of the positive (POS) and negative (NEG) sequences of the rotational direct and quadrature axes (dq) frame are calculated as follows:
{ V dqs = V dqs + + V dqs = V dqs + V dqs + + · e 2 j ω s · t i dqs = i dqs + + i dqs = i dqs + i dqs + + · e 2 j ω s · t λ dqs = λ dqs + + λ dqs = λ dqs + λ dqs + · e 2 j ω s · t V dqr = V dqr + + V dqr = V dqr + V dqr + + · e 2 j ω s · t i dqr = i dqr + + i dqr = i dqr + i dqr + + · e 2 j ω s · t λ dqr = λ dqr + + λ dqr = λ dqr + λ dqr + · e 2 j ω s · t   } .
The flux linkages of the stator and rotor for positive sequences are expressed as follows:
{ λ dqs + = L s i dqs + + L m i dqr + λ dqs + = L r i dqr + + L m i dqs + } .

3.4. The Main Novelties and Contribution of the Proposed Method are Summarized Here

i.
The control and automation strategy obtained by using a SCADA viewer, wind sim (software for emulating wind behavior in different scenarios) and an Active Servo software package is very important to emulate and analyze the fault ride through capability for wind power plants to stay connected to a network when a fault occurs. The aforementioned software packages have revealed that some of them can be used in an HVDC system, Photovoltaic system (PV) and storage management.
ii.
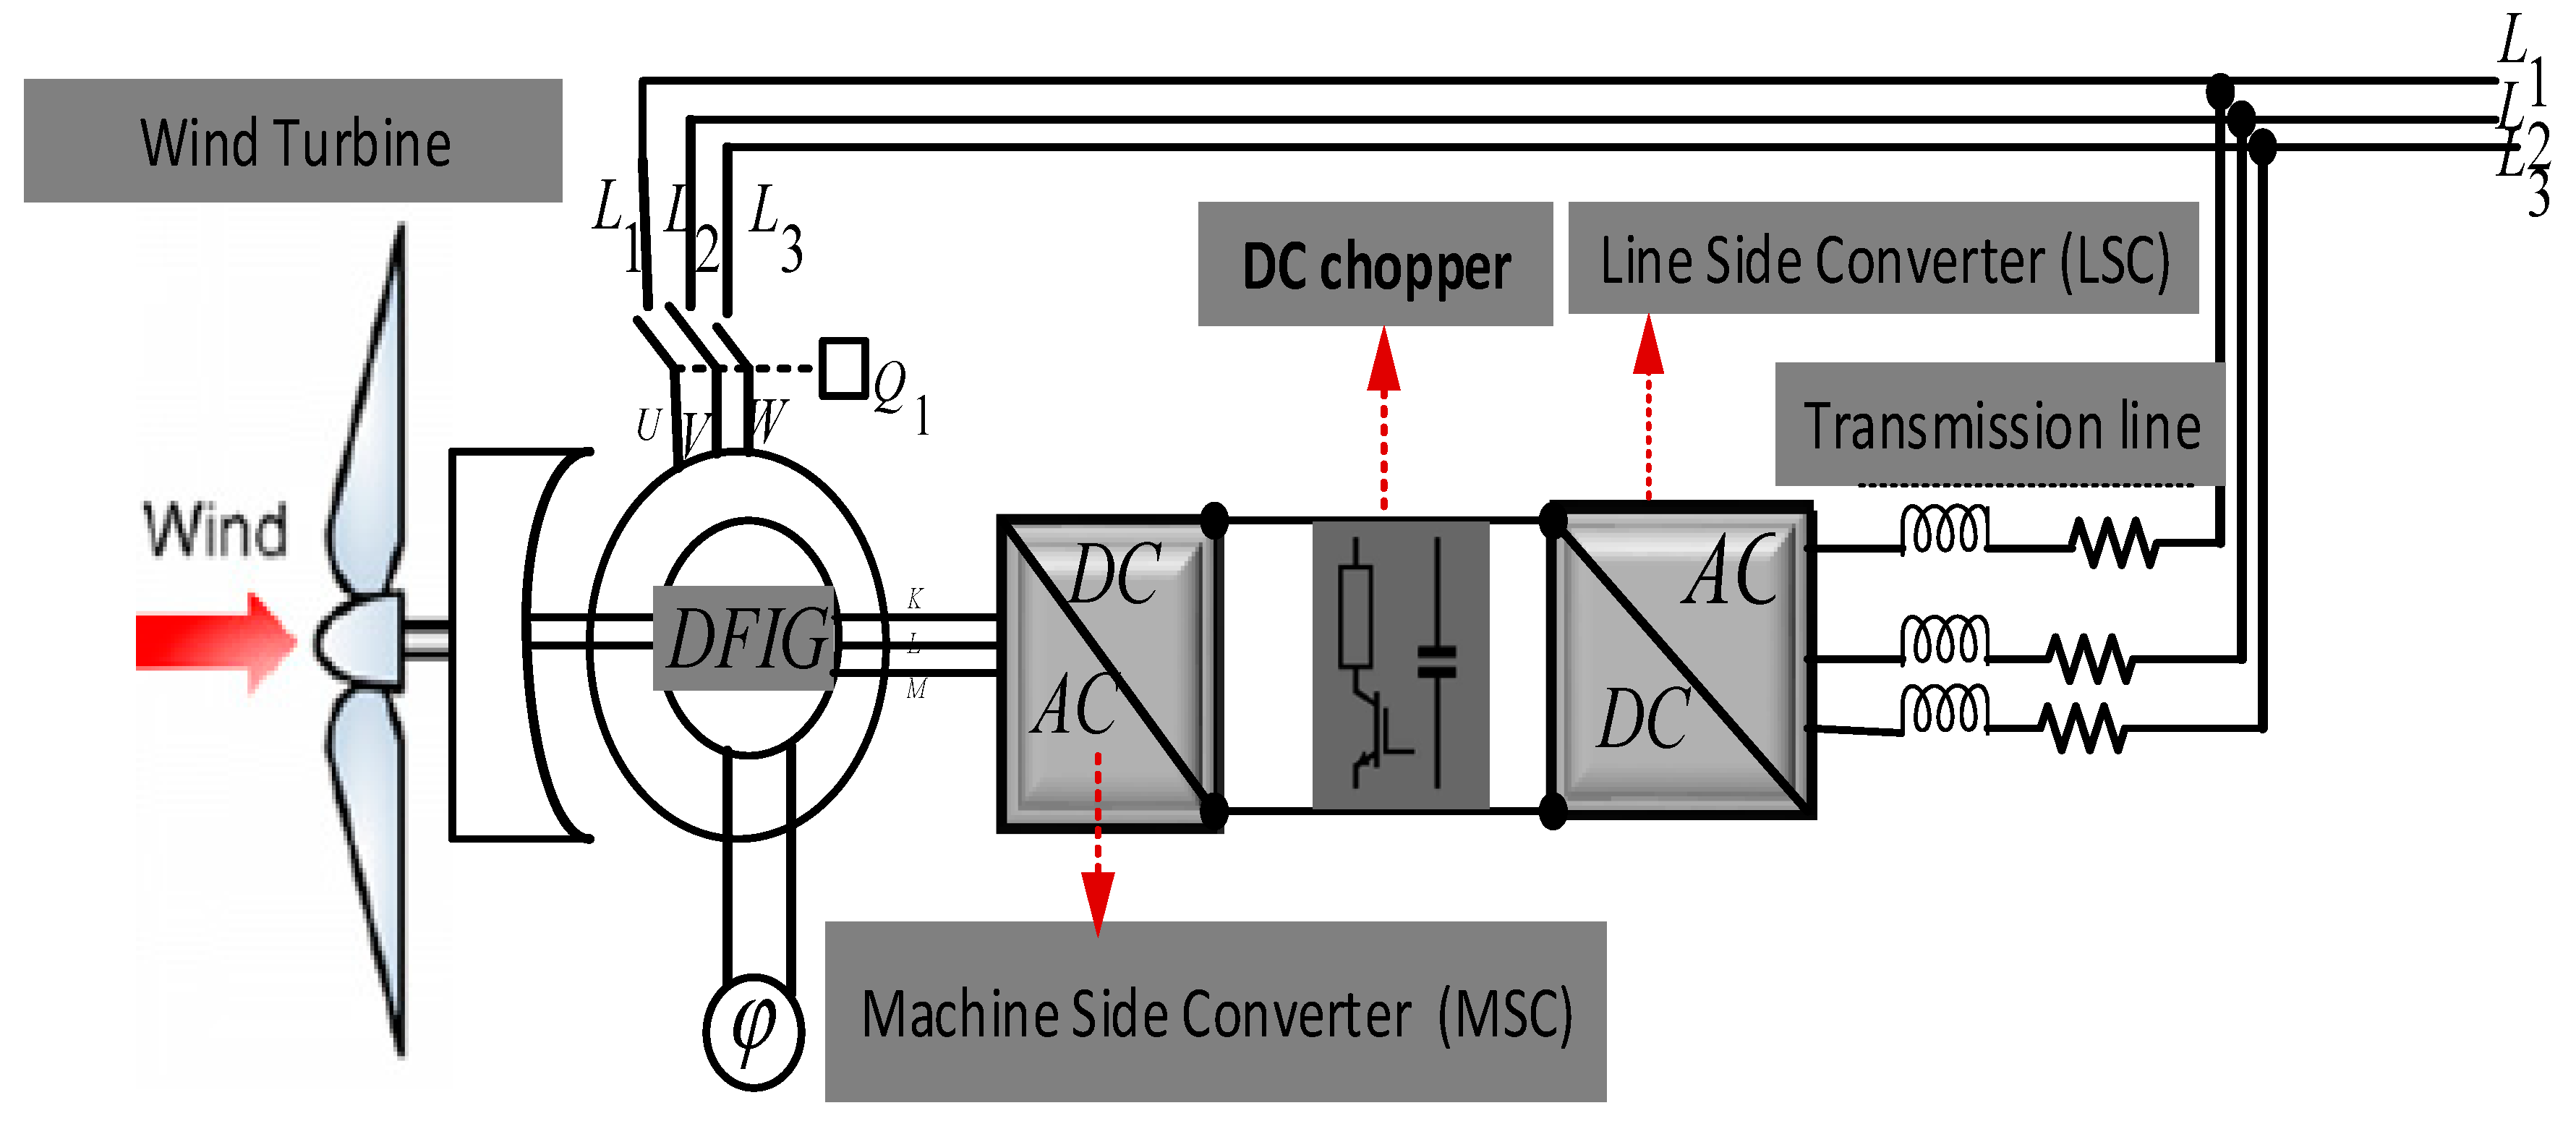
The excess energy flowing from the rotor circuit into the machine side converter may be dissipated through a DC chopper when the power flow is interrupted by a fault because the intermediate circuit voltage between the machine side converter and line side converter can attain unacceptably high values. A DC chopper basically consists of an IGBT that discharges the intermediate circuit via several brake resistors. The energy stored in this circuit is converted into heat so that the voltage drops.
iii.
The use of a crowbar device in the event of a serious fault when the DC chopper may no longer suffice to limit the intermediate circuit voltage. In such situations, an AC crowbar should be used instead in wind power plants.
iv.
The use of a ferrite device can be one method for reducing electromagnetic interference.

4. The Principal Concepts of Wind Power Plants Technologies

Each wind power plant is designed and optimized according to the conditions prevailing at its installation site; the plant normally fits into one of three main concepts as illustrated in Figure 4.

4.1. Fixed Speed Wind Power Plants

A constant speed wind turbine consists of an asynchronous squirrel cage induction generator (SCIG) and is synchronized to the utility grid through a step up transformer and passes through a static transfer switch (STS) that has the ability of islanded mode detection and grid connected mode. The squirrel cage induction generator always draws reactive power, which means the network operator needs to install capacitor banks as reactive power compensators. Smooth grid connection requires a soft starter as shown in Figure 5. The variations of voltage in constant speed wind turbines always results in a fluctuation of reactive power and line losses that require loss minimization strategies. The advantages of fixed speed wind turbines are that they are low cost, have a good dynamic response and simplicity whereas the disadvantages are fixed frequency and voltage.
Wind usually impinges at a variety of speeds on a wind power plant. It is better to utilize the wind power plant associated with every speed as efficiently as possible. Modern wind power plants are equipped with a power control method, which can be considered to encompass the rotor and generator. Constant speed and variable speed power control systems are available [14,15].

4.2. Variable Speed Wind Power Plants

Synchronous generators are frequently used for variable speed wind turbine applications due to their low rotational synchronous speeds that produce the voltage at utility grid frequency. Synchronous generators may be an appropriate selection for the variable speed operation of wind turbines [15]. Dynamic loads can only be reduced by means of a variable speed range for the rotor vis-à-vis the grid frequency. Though a slight flexibility in terms of speed can mitigate such loads, at least 40% of the entire rated speed range is needed for the operation of a fully-fledged wind power plant. This may only be achieved by means of a variable speed generator in conjunction with a frequency converter. Such systems can be produced using synchronous or asynchronous generators [11].
If a synchronous generator is employed, all the generated electrical power must be converted. By contrast, an asynchronous generator only requires part of the generated electrical power to be converted by the frequency converter. The asynchronous generator’s slip is used for this purpose: In the case of an intentionally high slip value, lost energy (slip power) is fed back to the stator power flow via suitable converters. In this case, a squirrel cage rotor is no longer suitable for the asynchronous generator, instead needing to be replaced by a slip-ring rotor. However, this is more expensive and requires more maintenance [19].

4.2.1. Synchronous Generator with a Fully Rated Converter

Technically, the variable speed operation by a wind power plant incorporating a synchronous generator may be achieved by means of a frequency converter with a DC link. The variable frequency alternating current produced by the generator is rectified before being fed via an inverter to the power grid as shown in Figure 6 [20].
The rectifier is controlled via different means and the inverter is controlled by using a voltage control loop and a current control loop and sinusoidal pulse width modulation (SPWM) is used to control the switch operation. The inverter output is filtered and stepped up by a transformer before interfacing with the utility grid.

4.2.2. Doubly Fed Induction Generators

Variable speed operation of a wind power plant incorporating a doubly fed asynchronous generator may be realized, as described next. The machine’s slip power is fed into the power grid and back from the power grid to the rotor. This enables the machine to function in super-synchronous and sub-synchronous modes where it may supply or consume active power depending upon circumstances. The frequency provided by the converter is dependent on the rotor field’s frequency. The speed range is controlled by the frequency supplied to the rotor. This configuration requires very elaborate control requirements. An advantage of this configuration is the ability to separately manage the active and reactive power. Furthermore, just one-third of the generator’s rated power is transmitted via the rotor circuit and frequency converter so in Figure 7 the parameters from the MSC should pass through rectifier and then be stabilized by DC chopper circuit before reaching the inverter [21,22].

4.2.3. Slip Control Strategy for Wind Turbines Based on DFIG

The rotor’s magnetic field serves to couple the rotor to the stator, which is connected to the grid. This coupling depends on the rotor currents. The slip control diverts a portion of these currents via resistors, thereby weakening the magnetic field and coupling and increasing the machine’s slip. Wind power plants employ this mechanism to offset gusts of wind [22]. If a gust impinges on the rotor, its torque increases sharply, thereby also tending to raise the system’s power very quickly. To give the pitch control time to readjust the blade angle, the generator’s slip is increased to up to 10%. While outputting a constant power level to the grid, the system accelerates and part of its excess energy is stored as rotational energy by the rotor and drive train. As the wind turbine speed decreases again, the slip is reduced and the drive train slows down as a result. In this process, the stored energy is fed into the grid too. This smoothens the plant’s power output characteristics. The increased slip reduces the generator’s efficiency and causes the involved resistors to produce a lot of heat thus necessitating effective cooling in this operating mode, as schematized in Figure 8 [23,24].

4.2.4. Speed Control Strategy for Wind Turbines Based on DFIG

In the DFIG, the rotor’s speed may be changed up to 30% of the rated speed. This upraises power levels under changing wind conditions. It may also minimize undesirable variations in the power grid and stresses exerted on the structure’s crucial electrical power components [25]. To attain this, the rotor windings are routed out via slip rings and connected to the utility grid via special smart inverters. The generator is hence connected to the rotor as well as the stator, because of the term dual (or double) feed. This permits the controllers to immediately influence the magnetic conditions inside the rotor. The inverters can convert alternating current (AC) in both directions and convert direct current (DC) into alternating current of any required frequency with switch operations means [26]. At low wind turbine speeds, the drive train’s rotation is slow moving compared with the utility grid’s operation. In this mode, showed by Figure 9, a rotary field is fed into the rotor and is fortuitous on its rotation frequency.
In this circumstance, the machine magnetically attains its rated slip, even if the rotor’s mechanical operation is slow compared with the utility grid’s operation. In that situation, energy is drawn from the utility grid to generate the rotor field. Nonetheless, this amount of energy is significantly lower compared with the stator’s output energy. This enables the coverage of the plant generator for a speed in a wide range. When the wind speed grows, this rotary field’s frequency is lowered correspondingly, hence keeping the magnetic slip constant. To offset gusts and high wind turbine speeds, the rotor field’s direction of rotation is backed. This makes it feasible to increase the mechanical speed at a constant magnetic slip. So as to obtain this, the converters feed portions of the rotor currents to the utility grid, resulting in a flow of energy in this direction. About 10% of the plant’s power is thus produced in the rotor and fed via the converters to the grid. Since the machine’s excitation takes place through the converters, reactive power from the utility grid is not completely needed. With the control strategies described in [27], it is possible to provide capacitive and inductive reactive power within the utility grid operator’s specifications. The plant therefore contributes toward stabilizing the grid.

5. Traditional Grid Technologies Versus Smart Grid Technologies

Smart grid technologies require a high level of technology including automation methods and distributed energy generation as well power supply reliability. Meanwhile, traditional grid technologies do not [27]. Table 1 shows the differentiation between them.

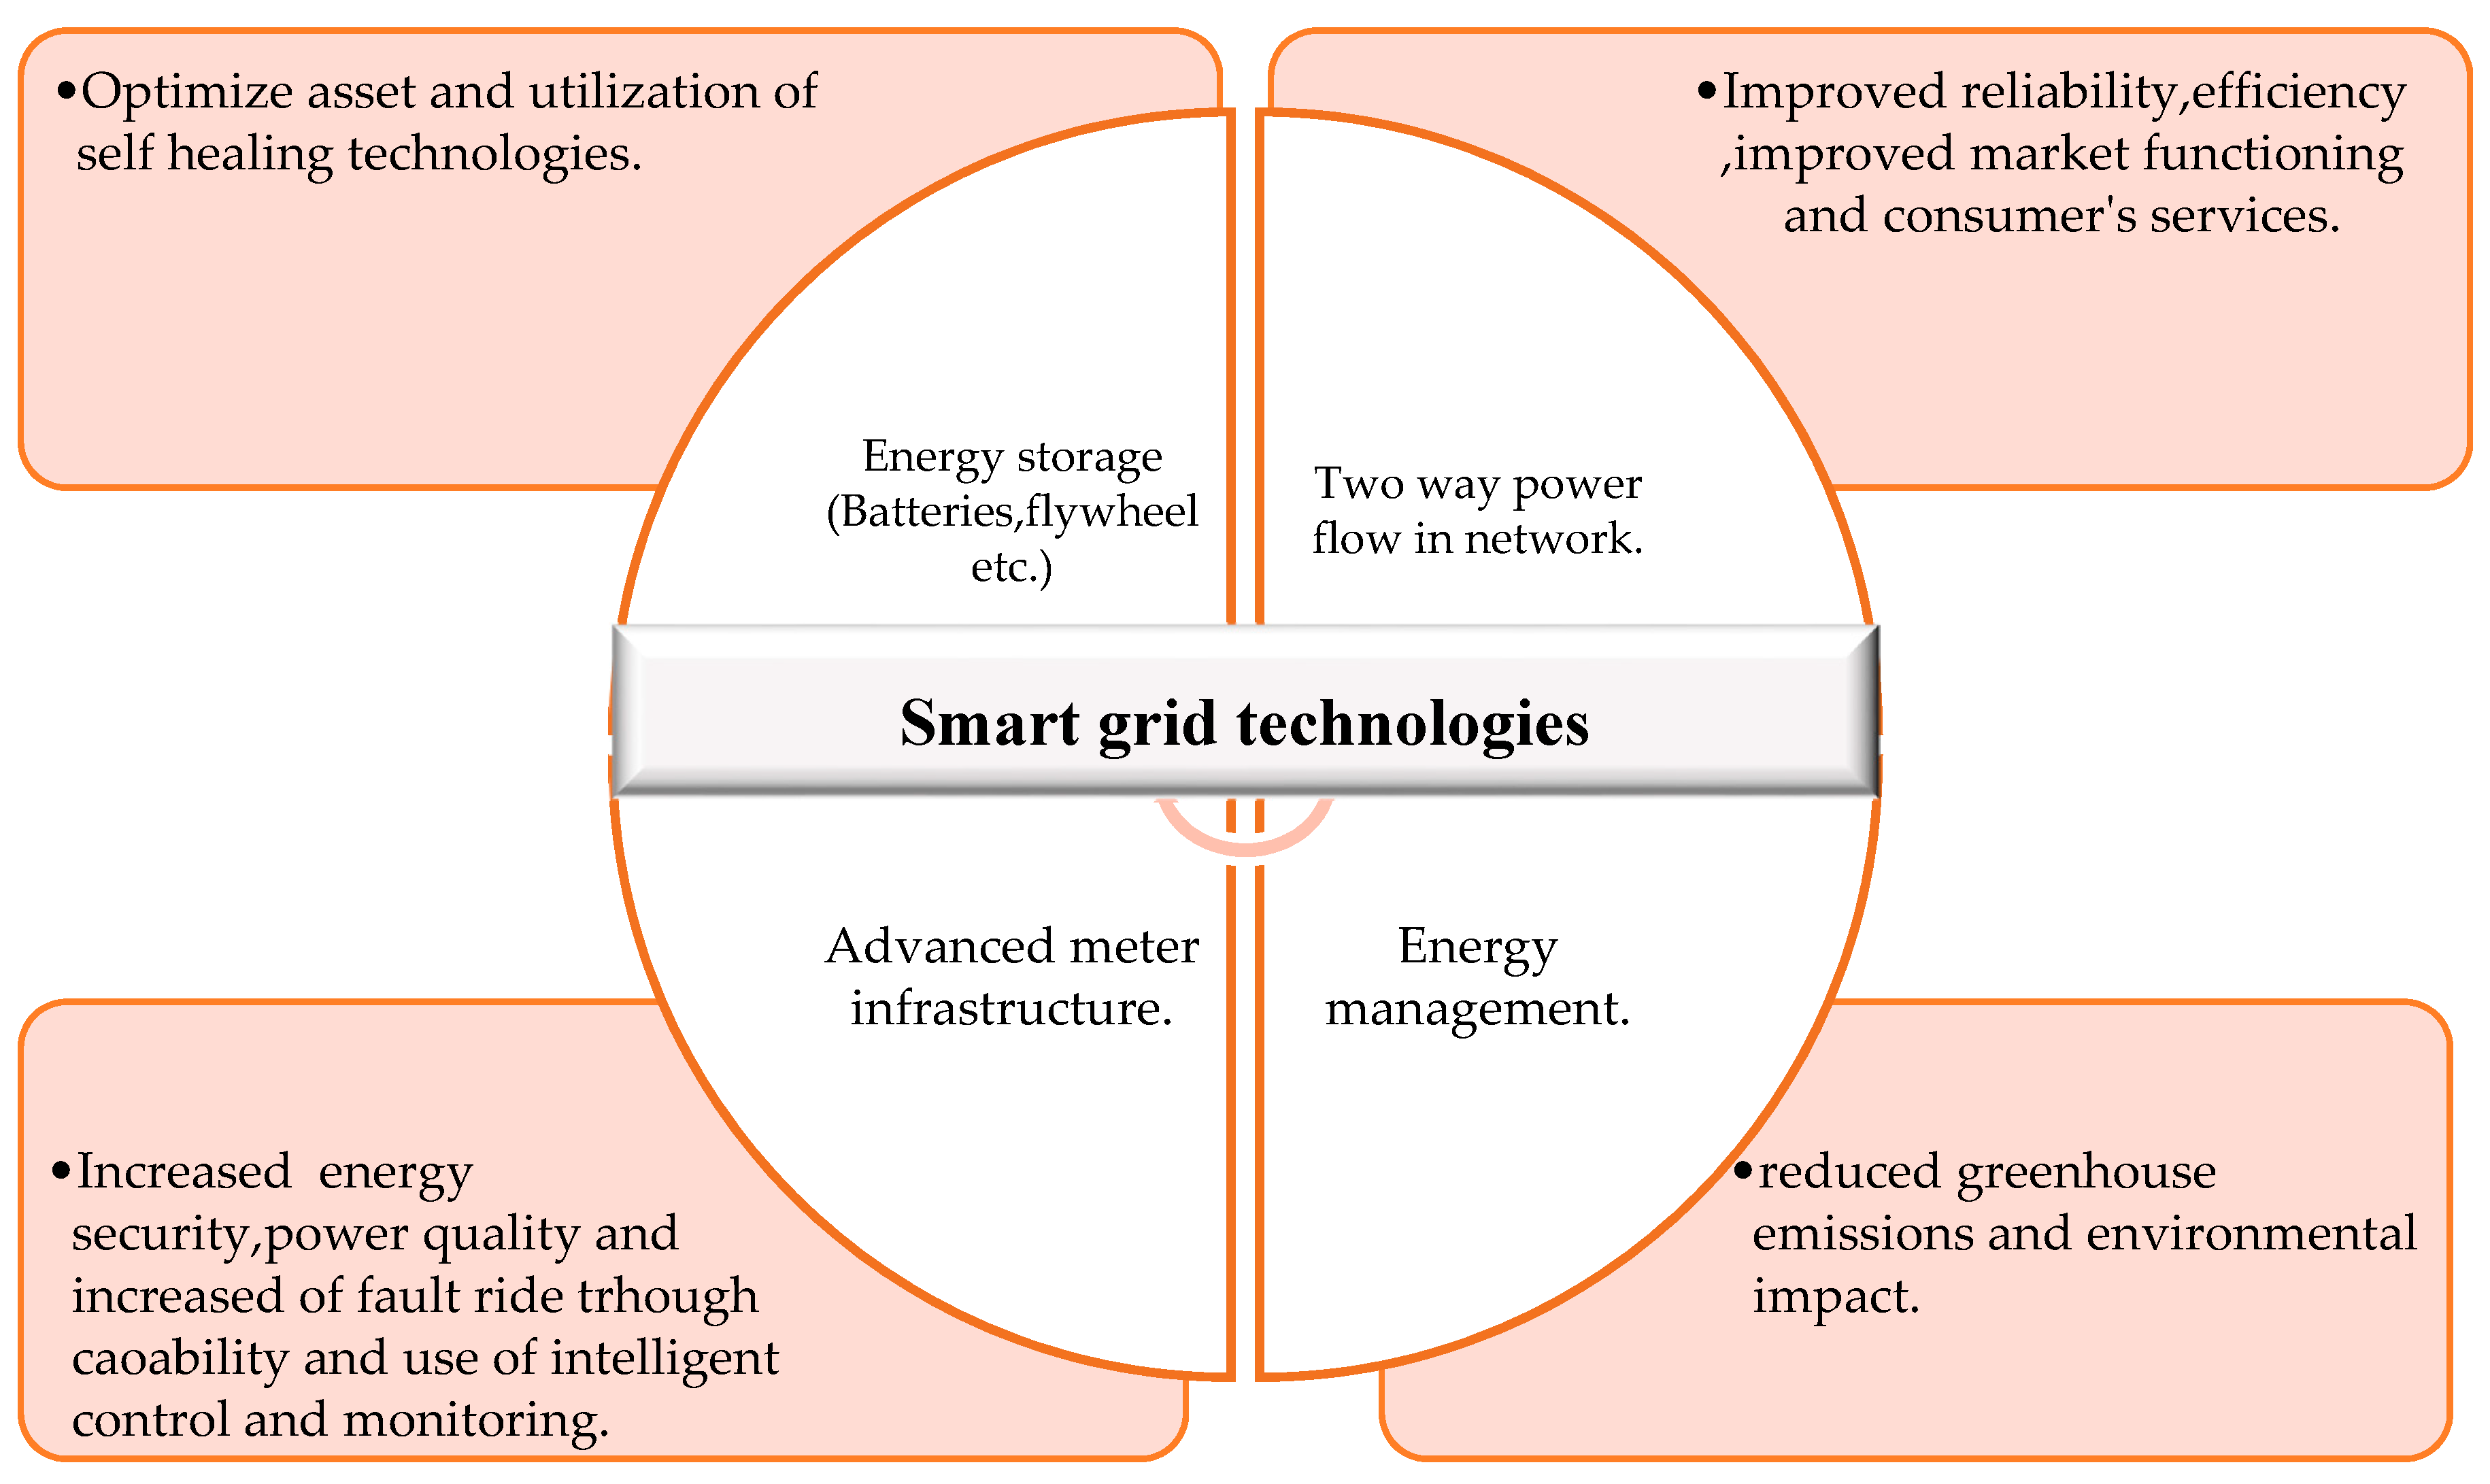
5.1. Smart Grid Technologies’ Challenges and Benefits

Smart grid technologies have different challenges and benefits, which are listed in Figure 10.

5.2. Dynamic Voltage Regulation Strategies

Alongside FRT of utility grid faults, some countries, including Germany, have developed grid connection regulations that requires a dynamic voltage regulation in the form of a brief, which defines the input supply of a reactive current [33,34].
Regarding voltage deviations with a negative Δ U in the casse of low-voltage ride-through (LVRT), a capacitive reactive current is supplied to increase the voltage.Whereas the positive Δ U (high-voltage ride-through = HVRT), the voltage is lowered through a supply of inductive reactive current. The gain factor, abbreviated k in this case, is calculated from the slope of the characteristics [34]. The set point reactive current may be calculated as follows: I B = ( Δ U Δ U d e a d ) K , where current ( I ) is expressing the set point reactive current, ΔU = voltage difference, k = g a i n   f a c t o r and Δ U = d e a d   b a n d . The system service ordinance for wind power plants defines rise times for reactive power supply in the event of a severe fault or network transient. The voltage control strategy and its characteristics are summed up in Figure 11.generally wind turbines have to supply at least 1.0   p e r   u n i t   ( p . u ) reactive current already when the voltage sag under the 50 % to avoid the loose of synchronism from utility grid. So a dead band of 10 % is instigated orderly to keep away from some technical problems. Although wind turbine based on DFIG synchronized to the high voltage utility grid incessant voltage control strategy without dead band is also under control as well and depicted in Figure 11 [11,33,35,36,37].

5.3. Fault Ride Through (FRT) Capability in Wind Farms

Fault ride through is one of grid codes established by some countries. A few researchers have stated that offshore wind farms are electrically connected to the utility grid by a cable circuit and have showed that it is not feasible to use High Voltage AC (HVAC) but it is possible in HVDC systems from economic and technical perspectives [38,39,40,41]. The FRT in HVDC has revealed some advantages such as competition and markets and security of supply compared with the HVAC [42]. However, bidirectional is one of devices in onshore HVDC-VSC and is responsible for connecting HVDC to the grid and the grid codes’ requirements. The control loops based on direct and quadrature axes are essential and a droop controller is selected as it is among the best controllers [43,44,45,46]. An energy management strategy has been proposed by using a DC chopper but it is not specified how excess energy will be handled. This paper proposes to use a crowbar circuit.
In a hierarchical voltage imbalance control for a single-/three-phase hybrid multimicrogrid, researchers have shown that multimicrogrids composed of different distributed energy resources (DERs) such as PV systems and storage can be controlled by a modified traditional droop control and PQ controller as well. However, the type of PQ controller was not specified and did not mention an issue regarding storage [47,48]. Moreover, the fault ride through and SCADA viewer software can be used in multimicrogrids as long as master and slave micro sources are specified with different outputs and different controllers. The analysis based on FRT with a SCADA viewer and wind sim software package with protective and energy management devices may be applied in multimicrogrids excluding HVAC due its drawbacks and levelized cost of energy (LCOE) and should be analyzed specifically for PV [49,50].

6. Analysis and Validation of the Designed Model in Software Packages

To better analyze the dynamic utility grid fault, MATLAB/Simulink was used to design the model as shown in Figure 1. Validation of the model was carried out using the experimental step up as shown in Figure 2. However, the integration of renewable energy (including wind) into an electrical network creates problems in case of grid connected and islanded operational mode. Modern wind plants need to help the utility grid in the way that they respond to breakdowns. This means that they need to be able to carry out a number of additional functions such an automation technology.
The modelling of this model was designed by using MATLAB/Simulink and validated by using an experimental set up. Figure 2 is composed of the following devices: a dynamic grid fault simulator (used to simulate voltage dips in three-phase networks, thus making it feasible to study the response of devices connected downstream with different features) and a control unit for DFIG (modern wind turbines use DFIG to supply power via the utility grids). The SCADA viewer software package allowed the control and operation of the principle concepts of wind power plants through different scenarios. The wind sim software and control unit made it possible to emulate realistically and study all scenarios of practical relevance. The included software packages were easy to operate and enabled convenient visualization of the measured values. Isolating a transformer for wind power plants with its switch (the three-phase transformer ( 3 ) for coupling the doubly fed wind power plant to the utility grid) and an incremental encoder was used for controlling the variation of angular speed. The servo-machine test bench was a complete testing system for examining and controlling electrical machines and drives.
It is equipped with a digital controller, a brake and the Active Servo software (Active Servo is a program designed for recording the characteristics of machines and for determining static and dynamic operating points. It imitates seven different loads for which the parameters may be individually configured and managed. The power feed for the electrical machine is the utility grid and can supply AC, DC and three-phase machines and the excitation for the synchronous machine. The DC chopper circuit is located between the machine side converter (MSC) and line side converter (LSC) so when the power flow is perturbed due to a fault or another technical problem the intermediate circuit voltage increases to unacceptably high values and the excess energy is dissipated through a DC chopper circuit.
However, in the case of a severe fault, the DC chopper may no longer suffice to limit and manage the intermediate circuit voltage. In those circumstances, an AC crowbar should be used instead. Figure 12 represents the experimental set up carried out in a laboratory and composed by the following devices: dynamic grid faults simulator, modern wind turbine with DFIG, incremental encoder SCADA viewer software package, wind sim software, power quality meters, synchronization measurements devices, utility grid, transformer, switch, servo machine test bench with 10 selectable operational modes including a digital controller brake and Active Servo software and a three phase motor with the ability to function as a generator with 800   Watts and a speed of 1500   r . p . m . A ferrite device was used for reducing electromagnetic fields.

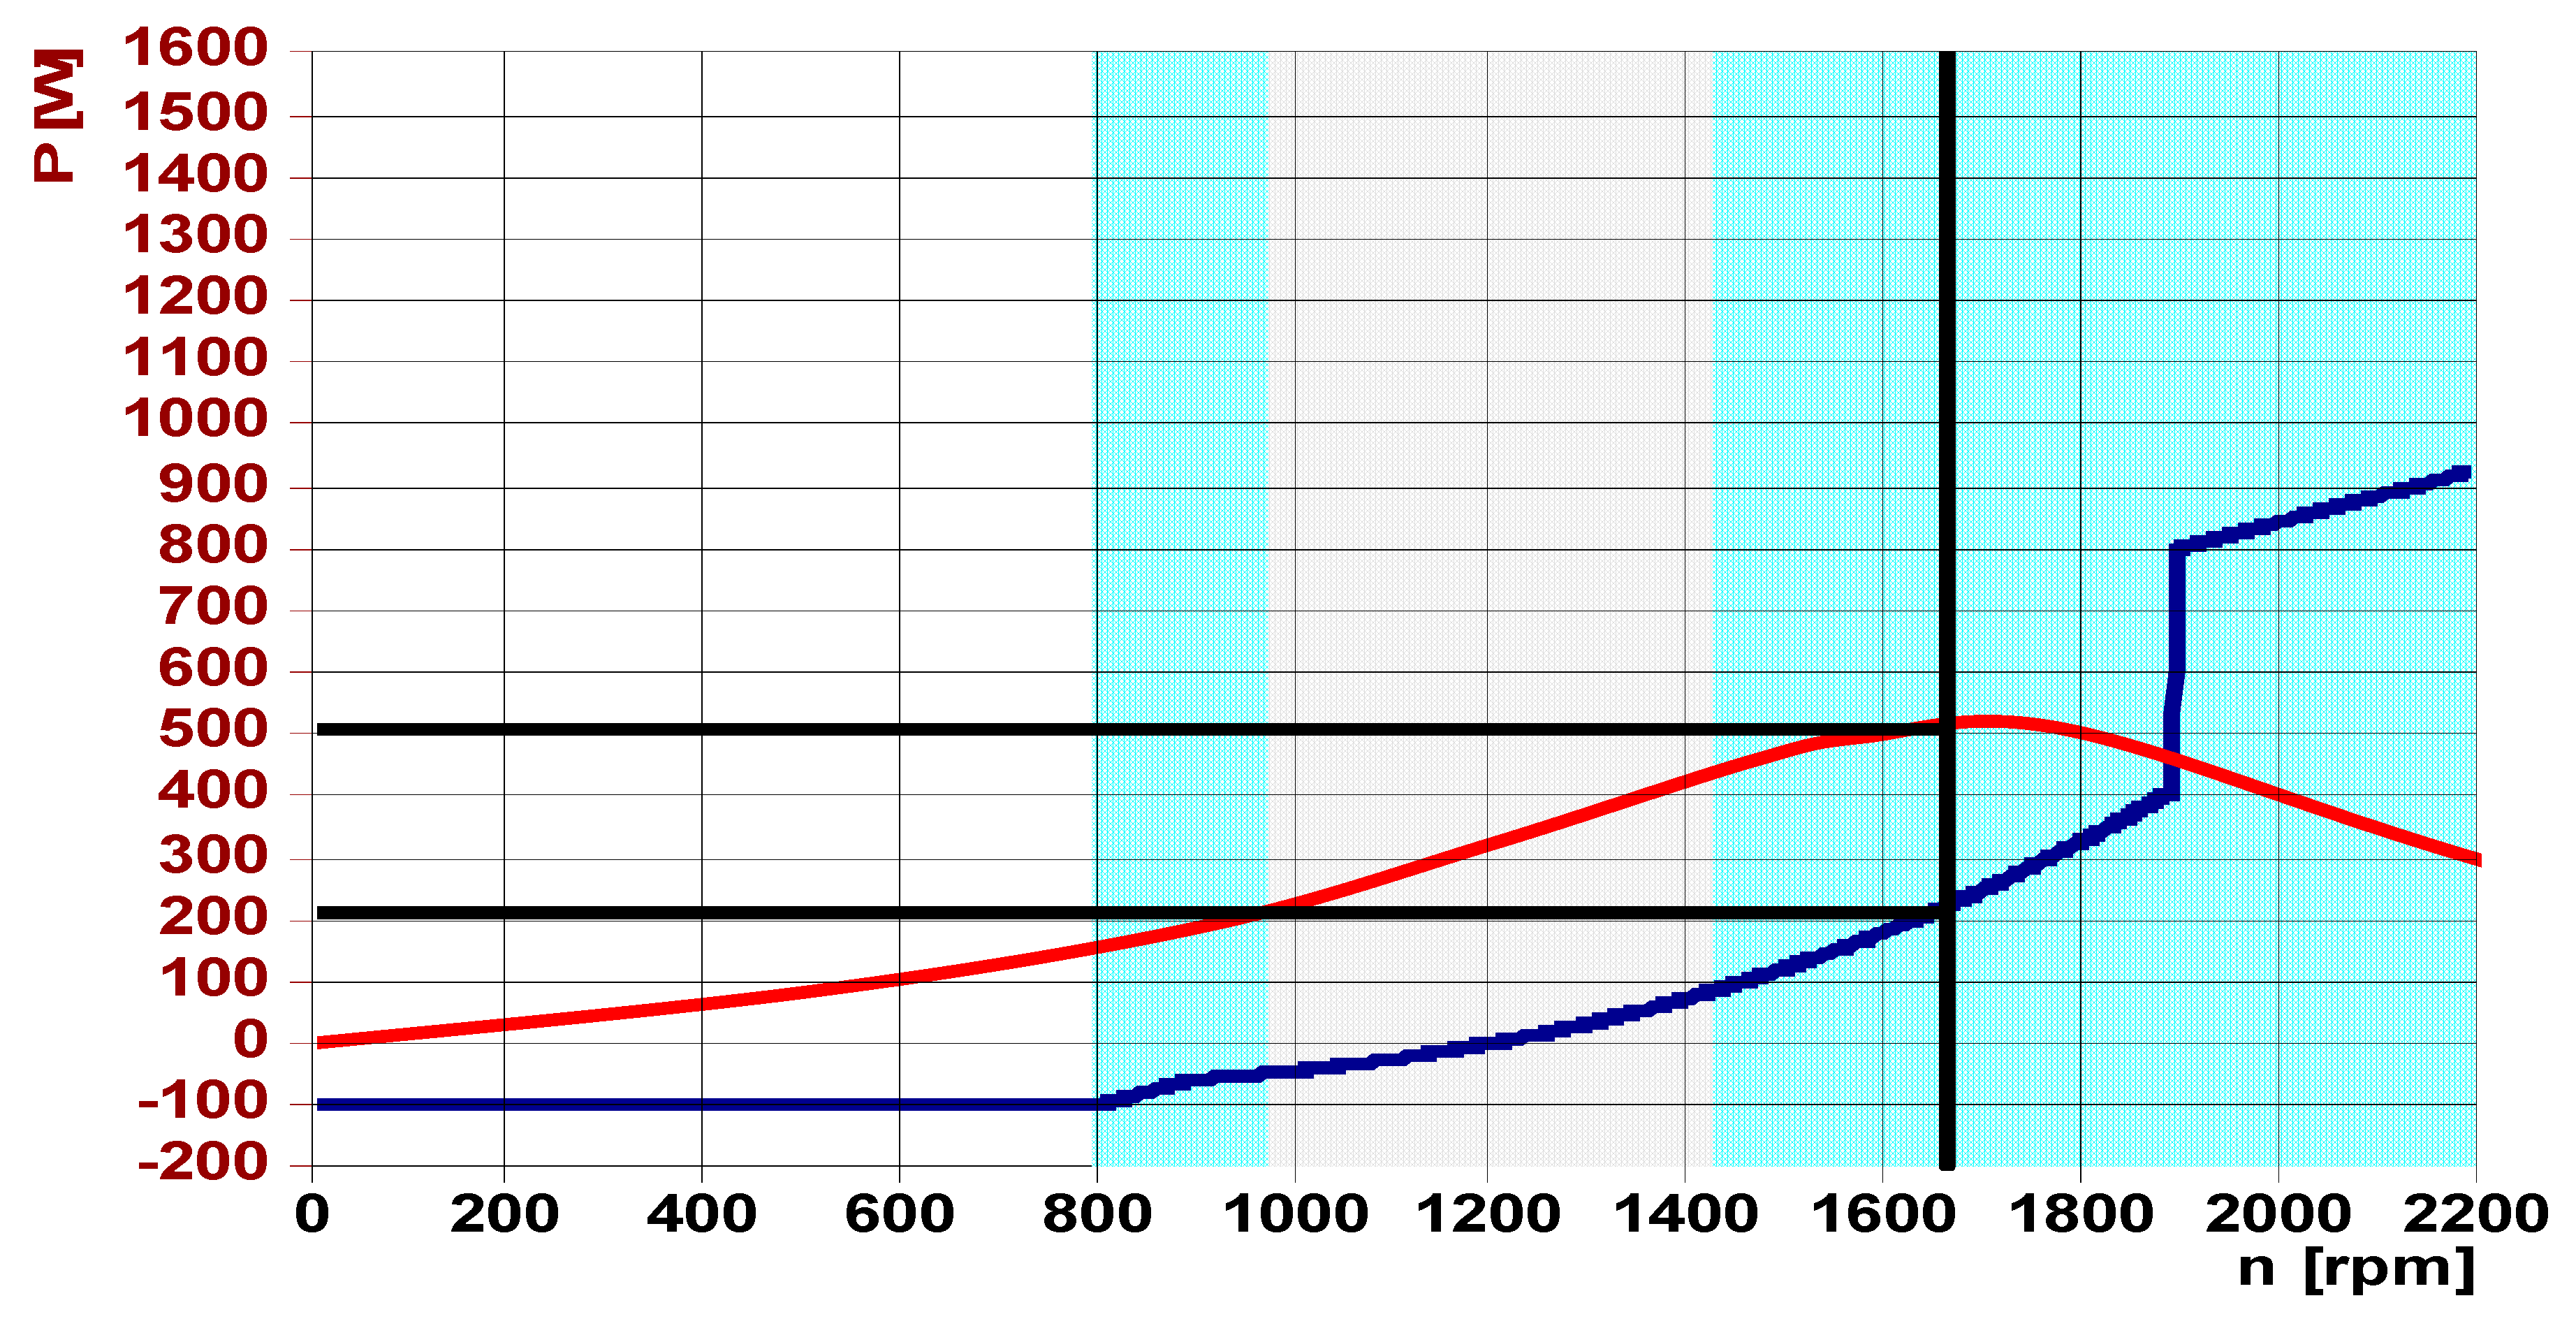
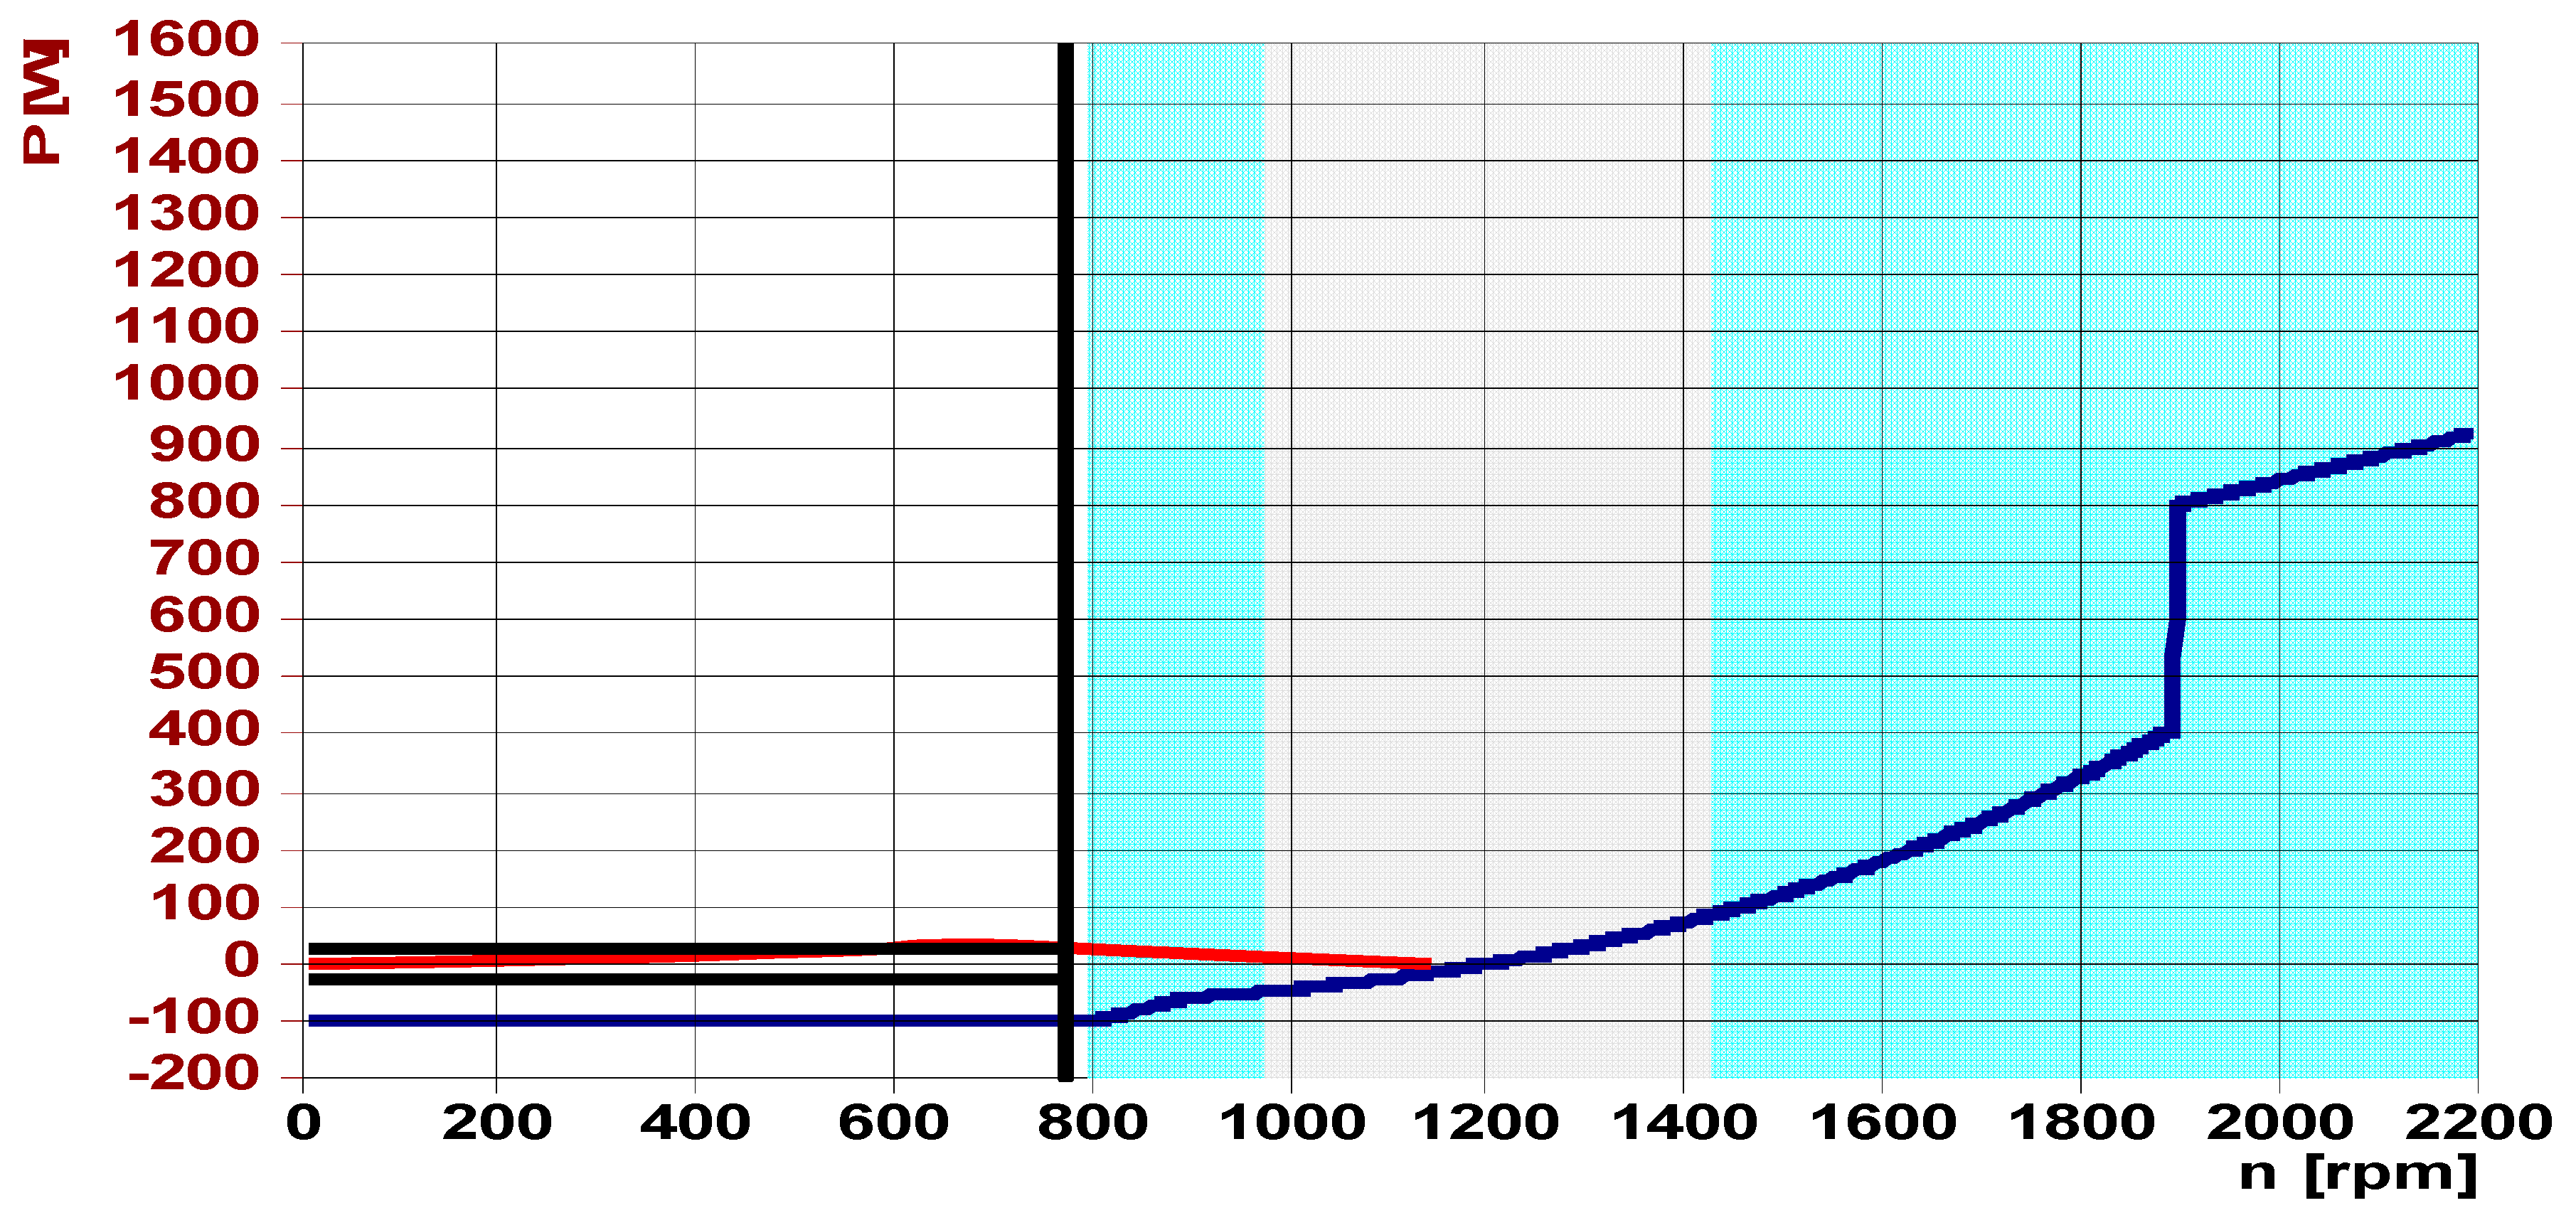
7. Results and Discussion

Table 2 represents the data recorded during conducting an experiment and analyzing different scenarios for wind turbines based on DFIG with Rwanda electrical network, focusing on the variation of parameters, namely: voltage sag that has been varying and adjusted by using a dynamic grid faults simulator, inertia moment, rotation speed, mechanical power, power at the generator side, total power and power at the line side, machine side converter and rotor side converter. During conducting experiments, some mathematical equations such as Equation (19) specifically for active power, which can be supplied or consumed in case it is working as motor or generator.
Figure 13 represents the figures obtained when the wind speed was = 12.5   m / s total power ( P t o t ) = 750   W , as shown in the second black color. Mechanical power ( P m e c ) = 1201   W is shown in the black color for first line rotation speed N = 1902   r . p . m . Shown in the grid, the vertical black color was varying. In the meantime, the power was constant and voltage sag = 0 % of the voltage line to line ( V ( L L ) ). Power at the line side ( P l s ) = 47   W and power at the generator side ( P g e n ) = 673   W . The results mean that the wind power plant was working as a generator and synchronized to the utility grid after satisfying synchronization requirements. Furthermore, the results confirm the statement made in Equation (18).
Figure 14 shows the figures obtained when the speed of the wind decreased to 10.5   m / s . Total power ( P t o t ) = 514   W , mechanical power ( P m e c ) = 915   W as shown by the first horizontal black color, rotation speed ( N ) = 1897   r . p . m . as shown by the vertical grid black color and voltage sag at   20 % of the voltage line to line ( V ( L L ) ). The power generated by wind turbine was 14   W and power at the generator side ( P g e n ) = 501   W as illustrated by second horizontal black line. These results show that the wind turbine based on DFIG worked as a generator and remained in synchronism with utility grid.
Figure 15 illustrates the figures obtained when speed = 8.5   m / s . Total power ( P t o t ) = 212   W , mechanical power ( P m e c ) = 530   W as shown by the first horizontal black line, rotation speed N = 1667   r . p . m . is shown by the grid vertical black line and voltage sag = 40 % of the voltage line to line ( V ( L L ) ). Active power at the line side converter is equal to ( P l s ) = 62   W , whilst power generated by the wind was 274 W, as shown by the second horizontal black line. The inertia moment was M ( N m ) = 3 .
Figure 16 shows the figures obtained when speed = 7   m / s . Total power ( P t o t ) = 61   W , mechanical power ( P m e c ) = 297   W as shown by a black horizontal line, rotation speed N = 1378   r . p . m . as shown by a vertical black line and voltage sag = 60 % of the voltage line to line ( V ( L L ) . Active power at the line side converter (LSC) was approximately equal to ( P l s ) = 100   W as shown by a blue line. Power generated by the wind was 161 W whereas the inertia moment was M ( N m ) = 2 . The negative sign for active power at the line side converter meant that the wind turbine based on DFIG was in reverse direction where it was working as motor and confirmed the reality of Equation (18) regarding power transmission.
Figure 17 illustrates the figures obtained when speed = 6.5   m / s . Total power ( P t o t ) = 22   W , mechanical power ( P m e c ) = 239   W as shown in the first horizontal black line, rotation speed N = 1281   r . p . m . as shown by a black vertical line and voltage sag = 100 % of the voltage line to line ( V ( L L ) ). Active power (P) at the line side converter (LSC) was equal to ( P l s ) = 104   W as shown by a horizontal blue line. The power generated by the wind was 127 W whereas the inertia moment was M = 1.8 Nm.
Figure 18 shows the values obtained when speed = 5.2   m / s . Total power ( P t o t ) = 53   W , mechanical power ( P m e c ) = 129   W , rotation speed ( N ) = 1040   r . p . m . , voltage sag = 100 % of the voltage line to line ( V ( L L ) ). Power at the line side converter ( P l s ) = 102   W and power at the generator side ( P g e n ) = 57   W . At this stage, the wind was in reverse because of negative power and the speed was varying. Meanwhile, the power was constant and the inertia moment was equal to 1.1 Nm.
Figure 19 shows the figures obtained when the wind speed was equal to 4.5   m / s . Total power ( P t o t ) = 80   W , mechanical power ( P m e c ) = 80   W , rotation speed ( N ) = 911   r . p . m . as shown by a black vertical line, voltage sag = 100 % , of the voltage line to line ( V ( L L ) ). Power at the line side converter ( P l s ) = 100   W as shown by an horizontal blue line and power at the generator side ( P g e n ) = 25   W . The inertia moment ( M ) = 0.9   Nm and the wind turbine based on DFIG was working as a motor instead of working as generator because of voltage sag as shown in Table 1 and recorded by using fault ride through (FRT).
Figure 20 shows the figures obtained when the wind speed was equal to 3.4   m / s . Total power ( P t o t ) = 25   W , mechanical power ( P m e c ) = 37   W as shown by the first horizontal black line, rotation speed ( N ) = 756   r . p . m . as shown by a black vertical line, voltage sag = 100 % . Power at the line side converter ( P l s ) = 25   W and the wind turbine based on DFIG was unsynchronized because the speed was too low and consumed power as a motor because of the voltage sag at level equal to 100% of the voltage line to line ( V ( L L ) ). Meanwhile, the inertia moment was equal to 0.4 Nm as recorded in Table 1 during the laboratory experiment.
Figure 21 shows the figures obtained when the instantaneous values of the main voltage U g r i d and t = 0.005 s as a fault were created through a dynamic fault simulator and the voltage decreased until the time of 0.30 s via Supervisor Control and Data Acquisition (SCADA) viewer software and remained synchronized with a capability of fault ride through (FRT). This voltage was calculated in Equation (25) so the SCADA viewer and wind sim software packages were used to control and to calculate the values of the voltages and currents.
.
The voltage dip at 40% of the voltage line to line ( V L L ) in the event of a fault creation at 0.052 s while the current rose in the event of fault after a fault occurred in the network as shown in Figure 22. The displayed variables do not indicate whether a reactive current was supplied in the event of a fault and this equation was determined in Equation (25). Additionally, the SCADA viewer and wind sim software packages were used to emulate wind power plants in different scenarios.
.
Figure 23 shows the voltage in direct axis, which decreased after a fault occurred in the network while the voltage in the quadrature axis was zero and remained so before and after a fault happened and the fault was cleared. Therefore, these equations were calculated in (24) for the equations regarding a positive sequence together with wind sim and SCADA viewer software packages.
Figure 24 displays the current I g r i d measured for direct and quadrature axes in the positive sequence. The direct current was increased at t = 0.054 s whereas the quadrature axis current was almost zero before and after being subjected to the transient disturbance and remained in the negative side. The first signal was a current in the quadrature axis while the second signal was a current in the direct axis. Lastly, the voltage at the mains lay at the direct axis level and the display in the positive sequence (POS) noticeably indicated a voltage sag of 40% in the event of a fault and was determined in Equation (24).
Figure 25 shows that the voltages in direct and quadrature axes were zero in the negative sequence before and after a network was subjected to the transient disturbances, even if during a fault creation the voltages swelled and returned to a normal state. These were clearly determined in Equation (25).
Figure 26 shows that the current in direct and quadrature axes were zero in the negative sequence before and after a network was subject to transient disturbances even if during a fault creation the current increased slightly and returned to a normal state. These values were determined in Equation (25). SCADA viewer and wind sim software packages were used for imitating real wind power plants.

8. Conclusions

The simulation and experimental results in this paper showed that the fault ride through (FRT) capability with SCADA viewer, Active Servo and wind sim software packages are more adaptable to the variations of voltage sag and wind turbines based on a Doubly Fed Induction Generator (DFIG) speed to keep away from a loss of synchronism. Even though the speed of the wind turbine decreased up to 3.4   m / s followed by loss of synchronism, it began to function as a motor and consumed active power that was equal to 25   W instead of working as generator. For protection purposes, a DC chopper and a crowbar should be integrated in wind energy technologies towards the management of excess energy during fault cases. This has been seen at t = 0.054   s when a fault created in Figure 21, Figure 22, Figure 23, Figure 24, Figure 25 and Figure 26 where the voltages or current were impacted by a transient disturbance and the ferrite device was used to reduce the electromagnetic field.
Furthermore, the SCADA viewer software with Active Servo software displayed their effectiveness and competitiveness during the fault clearing time ( t = 0.054   s ) at the speed of 12.5   m / s and produced 750   W as rated capacity but the voltage sag was 0 % and stayed synchronized before a fault creation. After a fault was created it was still synchronized to the utility grid. It also revealed that it was feasible to control and automate a network remotely and safely. The voltage decreased from 0 % up to 100 % of the total voltage in every fault case while the current increases depended upon the type of sequences, either a negative or positive sequence. Nevertheless, in the direct axis, the voltage remained at the direct level and in a positive sequence (POS), which definitely indicated that the voltage decreased in percentage in each fault case. Thus, the current and voltage exhibited neither any negative sequence (NEG) nor any symmetric components. Future work will be based on FRT capability in wind power plants with a Doubly Fed Induction Generator for smart grid technologies by using an artificial intelligence instead of SCADA viewer and Active Servo software packages. This approach can be used in a PV system and in distributed cogeneration to prevent short circuits (SC) at high voltage and extra high voltage levels against the spread of losses in power generation. Again, the fault ride through capability may be investigated in a HVDC system together with SCADA viewer and SCADA Designer software packages. The FRT capability and SCADA viewer can be used in the HVDC system, PV system and in distributed cogeneration in high voltages and extra high voltages as well.

Author Contributions

Conceptualization, A.N. and E.N.; Methodology, A.N.; Software, A.N.; Validation, W.B., E.N. and F.M.; Formal Analysis, A.N.; Investigation, A.N.; Resources, E.N.; Data Curation, A.N.; Writing—Original Draft Preparation, A.N.; Writing—Review & Editing, A.N.; Visualization, A.N.; Supervision, A.N.; Project Administration, A.N.; Funding Acquisition, E.N. All authors have read and agreed to the manuscript.

Funding

This research received no external funding.

Acknowledgments

The authors would like to express our gratitude to the World Bank in collaboration with the government of Rwanda under the African Center of Excellence in Energy for Sustainable Development (ACEESD) based in College of Science and Technology (CST) in University of Rwanda for their contributions in terms of infrastructure and financial.

Conflicts of Interest

The authors declare no conflict of interest.

Abbreviations

V s d   a n d   V s q are the direct and quadrature ( d q ) axis stator voltages
i s d , i s q represents the ( d q ) axis stator currents
φ s d , φ s q are stator fluxes in ( d q ) axis
V s d ,   V s q are the direct and quadrature ( d q ) axis rotor voltages
i r d , i r q are the ( d q ) axis rotor currents
φ r d , φ r q are rotor fluxes in ( d q ) axis
R s , R q resistances of stator and rotor
ω s , ω r are the supply and rotor angular frequency
L s , L r are the cyclic rotor and stator inductances
L m represents the mutual inductances.

References

  1. Kawady, T.A.; Mansour, N.M.; Taalab, A.I. Wind Farm Protection Systems: State of the Art and Challenges. In Distributed Generation; Gaonkar, D.N., Ed.; Intech: Rijeka, Croatia, 2010; pp. 265–288. [Google Scholar]
  2. Qiu, Y.; Feng, Y.; Infield, D. Fault diagnosis of wind turbine with SCADA alarms based multidimensional information processing method. Renew. Energy 2020, 145, 1923–1931. [Google Scholar] [CrossRef]
  3. Pasi, M.; Salvadori, E.; Poggesi, A.; Ciolli, L.; Del Bene, A.; Marini, S.; Toschi, N.; Diciotti, S.; Mascalchi, M.; Inzitari, D.; et al. White matter microstructural damage in small vessel disease is associated with Montreal cognitive assessment but not with mini mental state examination performances: Vascular mild cognitive impairment Tuscany study. Stroke 2015, 46, 262–264. [Google Scholar] [CrossRef] [Green Version]
  4. Hansen, A.D.; Cutululis, N.A.; Markou, H.; Sørensen, P.E.; Iov, F. Grid Fault and Design-Sasis for Wind Turbines–Final Report; Technical University of Denmark: Roskilde, Denmark, 2010. [Google Scholar]
  5. Vittal, V.; McCalley, J.; Ajjarapu, V.; Shanbhag, V.U. Impact of Increased DFIG Wind Penetration on Power Systems and Markets; Final Project Report; PSERC Publication: Tempe, AZ, USA, 2009; Volume 9. [Google Scholar]
  6. Qiu, Y.; Feng, Y.; Tavner, P.; Richardson, P.; Erdos, G.; Chen, B. Wind turbine SCADA alarm analysis for improving reliability. Wind Energy 2012, 15, 951–966. [Google Scholar] [CrossRef]
  7. Yan, L.; Yongning, C.; Haiyan, T.; Xinshou, T.; Yuanzhu, C. Wind Farm Equivalent Model Based on Power Output Sensitivity of Wind Turbines. In Proceedings of the 2019 IEEE Sustainable Power and Energy Conference (iSPEC), Beijing, China, 21–23 November 2019; pp. 76–80. [Google Scholar] [CrossRef]
  8. Chakraborty, A.; Kumar, S.; Tudu, B.; Mandai, K.K. Analyzing the dynamic behavior of a DFIG-based wind farm under sudden grid disturbances. In Proceedings of the 2017 International Conference on Intelligent Sustainable Systems (ICISS), Palladam, Tiripur, India, 7–8 December 2017; pp. 336–341. [Google Scholar]
  9. Ibrahim, A.; Solomin, E.; Miroshnichenko, A. Control Strategy for Maximum Power Point Tracking of Doubly Fed Induction Motor for Wind Turbine. In Proceedings of the 2018 International Ural Conference on Green Energy (UralCon), Chelyabinsk, Russia, 4–6 October 2018; pp. 14–19. [Google Scholar]
  10. Dhouib, B.; Kahouli, A.; Abdallah, H.H. Dynamic behavior of grid-connected fixed speed wind turbine based on proportional-integral pitch controller and fault analysis. In Proceedings of the 2017 International Conference on Green Energy Conversion Systems (GECS), Hammamet, Tunisia, 23–25 March 2017; pp. 1–7. [Google Scholar]
  11. Erlich, I.; Wrede, H.; Feltes, C. Dynamic behaviour of DFIG-based wind turbines during grid faults. IEEJ Trans. Ind. Appl. 2008, 128, 396–401. [Google Scholar] [CrossRef]
  12. Diao, T.; Yan, Z.; Wang, L.; Liu, J.; Hou, D.; Song, N. Simulation Study on Permanent Magnet Doubly Fed Induction Generators Under Grid Voltage Dip. In Proceedings of the 2019 22nd International Conference on Electrical Machines and Systems (ICEMS), Harbin, China, 11–14 August 2019; pp. 1–5. [Google Scholar]
  13. Aphrodis, N.; Ntagwirumugara, E.; Vianney, B.J.M.; Mulolani, F. Design, Control and Validation of a PV System Based on Supervisory Control and Data Acquisition (SCADA) Viewer in Smartgrids. In Proceedings of the 2019 5th International Conference on Control, Automation and Robotics (ICCAR), Beijing, China, 19–22 April 2019; pp. 23–28. [Google Scholar] [CrossRef]
  14. Demirbaş, Ş.; Bayhan, S. Grid synchronization of doubly fed induction generator in wind power systems. In Proceedings of the 2011 International Conference on Power Engineering, Energy and Electrical Drives, Malaga, Spain, 10–12 May 2011; pp. 1–5. [Google Scholar]
  15. Gencer, A. Analysis of fault ride through capability improvement of the permanent magnet synchronous generator based on WT using a BFCL. In Proceedings of the 2019 1st Global Power, Energy and Communication Conference (GPECOM), Nevsehir, Turkey, 12–15 June 2019; pp. 353–357. [Google Scholar]
  16. Boujoudi, B.; Kheddioui, E.; Machkour, N.; Achalhi, A.; Bezza, M. Comparative study between different types of control of the wind turbine in case of voltage dips. In Proceedings of the 2018 Renewable Energies, Power Systems & Green Inclusive Economy (REPS-GIE), Casablanca, Morocco, 23–24 April 2018; pp. 1–5. [Google Scholar]
  17. Boujoudi, B.; Machkour, N.; Kheddioui, E. New method for detection and characterization of voltage dips. Mol. Cryst. Liq. Cryst. 2016, 641, 86–94. [Google Scholar] [CrossRef]
  18. Santos-Martin, D.; Rodriguez-Amenedo, J.L.; Arnalte, S. Direct power control applied to doubly fed induction generator under unbalanced grid voltage conditions. IEEE Trans. Power Electron. 2008, 23, 2328–2336. [Google Scholar] [CrossRef]
  19. Shao, H.; Cai, X.; Li, Z.; Zhou, D.; Sun, S.; Guo, L.; Rao, F. Stability Enhancement and Direct Speed Control of DFIG Inertia Emulation Control Strategy. IEEE Access 2019, 7, 120089–120105. [Google Scholar] [CrossRef]
  20. He, L.; Hao, L.; Qiao, W. Remote Monitoring and Diagnostics of Pitch Bearing Defects in a MW-Scale Wind Turbine Using Pitch Symmetrical-component Analysis. In Proceedings of the 2019 IEEE Energy Conversion Congress and Exposition (ECCE), Baltimore, MA, USA, 29 September–3 October 2019; pp. 1–6. [Google Scholar]
  21. Chen, S.Z.; Cheung, N.C.; Wong, K.C.; Wu, J. Grid synchronization of doubly-fed induction generator using integral variable structure control. IEEE Trans. Energy Convers. 2009, 24, 875–883. [Google Scholar] [CrossRef]
  22. Fan, L.; Yuvarajan, S. Modeling and slip control of a doubly fed induction wind turbine generator. In Proceedings of the 2008 40th North. American Power Symposium, Calgary, AB, Canada, 28–30 September 2008; pp. 1–6. [Google Scholar]
  23. Fan, L.; Miao, Z.; Yuvarajan, S.; Glower, J. A comparison of slip control, FMA control and vector control in DFIG converter. In Proceedings of the 2008 34th Annual Conference of IEEE Industrial Electronics, Orlando, FL, USA, 10–13 November 2008; pp. 2075–2081. [Google Scholar]
  24. Ren, Q.; Liu, H.; Li, Q.; He, J.; Xu, B.; Yuan, X. A Novel Inertia Control Strategy for DFIG Wind Turbines Based on Slip Feedback. In Proceedings of the 2017 IEEE 7th Annual International Conference on CYBER Technology in Automation, Control., and Intelligent Systems (CYBER), Sheraton Princess Kaiulani, HI, USA, 31 July–4 August 2017; pp. 668–672. [Google Scholar]
  25. Abdou, E.H.; Youssef, A.R.; Kamel, S.; Aly, M.M. Sensorless Wind Speed Control of 1.5 MW DFIG Wind Turbines for MPPT. In Proceedings of the 2018 Twentieth International Middle East. Power Systems Conference (MEPCON), Cairo, Egypt, 18–20 December 2018; pp. 700–704. [Google Scholar]
  26. Ouyang, J.; Tang, T.; Yao, J.; Li, M. Active Voltage Control for DFIG-Based Wind Farm Integrated Power System by Coordinating Active and Reactive Powers Under Wind Speed Variations. IEEE Trans. Energy Convers. 2019, 34, 1504–1511. [Google Scholar] [CrossRef]
  27. Kairous, D.; Wamkeue, R.; Belmadani, B. Advanced control of variable speed wind energy conversion system with DFIG. In Proceedings of the 2010 9th International Conference on Environment and Electrical Engineering, Prague, Czech Republic, 16–19 May 2010; pp. 41–44. [Google Scholar]
  28. Zhou, J.; He, L.; Li, C.; Cao, Y.; Liu, X.; Geng, Y. What’s the difference between traditional power grid and smart grid from dispatching perspective. In Proceedings of the 2013 IEEE PES Asia-Pacific Power and Energy Engineering Conference (APPEEC), Kowloon, Hong Kong, China, 8–11 December 2013; pp. 1–6. [Google Scholar]
  29. Dessouky, S.S. Investigation of Multi-terminal Voltage Source Converter HVDC for Wind Power Integration A THESIS. Ph.D. Thesis, Port-said University, Port Said, Egypt, 2016. [Google Scholar]
  30. Miller, J. The smart grid-benefits and challenges. In Proceedings of the EEI Annual Convention, Toronto, ON, Canada, 16 June 2008. [Google Scholar]
  31. Mulyono, N.B. User behavior assessment of household electric usage. Asian J. Technol. Manag. 2013, 6, 65–71. [Google Scholar] [CrossRef]
  32. Rahman, M.G.; Chowdhury, M.F.B.R.; Al Mamun, M.A.; Hasan, M.R.; Mahfuz, S. Summary of smart grid: Benefits and issues. Int. J. Sci. Eng. Res. 2013, 4, 1–5. [Google Scholar]
  33. Engleitner, R.; Nied, A.; Cavalca, M.S.M.; da Costa, J.P. Dynamic analysis of small wind turbines frequency support capability in a low-power wind-diesel microgrid. IEEE Trans. Ind. Appl. 2017, 54, 102–111. [Google Scholar] [CrossRef]
  34. Venkatesh, B.; Rost, A.; Chang, L. Dynamic voltage collapse index—Wind generator application. IEEE Trans. Pow. Deliv. 2006, 22, 90–94. [Google Scholar] [CrossRef]
  35. Engleitner, R.; Nied, A.; Cavalca, M.S.M.; da Costa, J.P. Small wind turbine operating points and their effect on the DC-link control for frequency support on low power microgrids with high wind penetration. In Proceedings of the 2016 12th IEEE International Conference on Industry Applications (INDUSCON), Curitiba, Brazil, 20–23 November 2016; pp. 1–8. [Google Scholar]
  36. Pratap, B.; Singh, N.; Kumar, V. Robust control of variable speed wind turbine using quasi-sliding mode approach. Proc. Comp. Sci. 2018, 125, 398–404. [Google Scholar] [CrossRef]
  37. Singh, N.; Pratap, B.; Swarup, A. Design of robust control for wind turbine using quantitative feedback theory. IFAC-PapersOnLine 2016, 49, 718–723. [Google Scholar] [CrossRef]
  38. Kim, C.K.; Sood, V.K.; Jang, G.S.; Lim, S.J.; Lee, S.J. HVDC Transmission: Power Conversion Applications in Power Systems; John Wiley & Sons: Clementi Loop, Singapore, 2009. [Google Scholar]
  39. Silva, B.M.A. Multi-terminal HVDC grids: Control Strategies for Ancillary Services Provision in Interconnected Transmission Systems with Offshore Wind Farms. Ph.D. Thesis, Faculty of Engineering, University of Porto, Porto, Portugal, 2014. [Google Scholar]
  40. Deng, F.; Chen, Z. An offshore wind farm with DC grid connection and its performance under power system transients. In Proceedings of the 2011 IEEE Power and Energy Society General Meeting, Detroit, MI, USA, 24–28 July 2011; pp. 1–8. [Google Scholar]
  41. Bell, K.; Cirio, D.; Denis, A.M.; He, L.; Liu, C.C.; Migliavacca, G.; Panciatici, P. Economic and technical criteria for designing future off-shore HVDC grids. In Proceedings of the 2010 IEEE PES Innovative Smart Grid Technologies Conference Europe (ISGT Europe), Gothenburg, Sweden, 11–13 October 2010; pp. 1–8. [Google Scholar]
  42. Kirby, N.M.; Luckett, M.J.; Xu, L.; Siepmann, W. HVDC transmission for large offshore windfarms. In Proceedings of the Seventh International Conference on AC and DC Transmission, London, UK, 28–30 November 2001; pp. 162–168. [Google Scholar]
  43. Liang, J.; Jing, T.; Gomis-Bellmunt, O.; Ekanayake, J.; Jenkins, N. Operation and control of multiterminal HVDC transmission for offshore wind farms. IEEE Trans. Power Deliv. 2011, 26, 2596–2604. [Google Scholar] [CrossRef]
  44. Gomis-Bellmunt, O.; Liang, J.; Ekanayake, J.; King, R.; Jenkins, N. Topologies of multiterminal HVDC-VSC transmission for large offshore wind farms. Electr. Power Syst. Res. 2011, 81, 271–281. [Google Scholar] [CrossRef]
  45. Gomis-Bellmunt, O.; Liang, J.; Ekanayake, J.; Jenkins, N. Voltage–current characteristics of multiterminal HVDC-VSC for offshore wind farms. Electr. Power Syst. Res. 2011, 81, 440–450. [Google Scholar] [CrossRef]
  46. Gomis-Bellmunt, O.; Egea-Alvarez, A.; Junyent-Ferré, A.; Liang, J.; Ekanayake, J.; Jenkins, N. Multiterminal HVDC-VSC for offshore wind power integration. In Proceedings of the 2011 IEEE Power and Energy Society General Meeting, Detroit, MI, USA, 24–28 July 2011; pp. 1–6. [Google Scholar]
  47. Wang, C.; Yang, P.; Chen, R.; Cheng, S.; Tian, T.; Li, X. Hierarchical voltage imbalance control for single-/three-phase hybrid multimicrogrid. IET Gen. Transm. Distrib. 2019, 13, 4233–4241. [Google Scholar] [CrossRef]
  48. Nduwamungu, A. Review on the Coordination and Energy Management of Microgrids Broad Based on PQ Controller and Droop Control. Some Useful Information Is Given in This Paper. Open Access Libr. J. 2017, 4, 1. [Google Scholar] [CrossRef]
  49. He, X.; Fang, X.; Yu, J. Distributed Energy Management Strategy for Reaching Cost-Driven Optimal Operation Integrated with Wind Forecasting in Multimicrogrids System. IEEE Trans. Syst. Man, Cyber. Syst. 2019, 49, 1643–1651. [Google Scholar] [CrossRef]
  50. Chiu, W.Y.; Sun, H.; Poor, H.V. A multiobjective approach to multimicrogrid system design. IEEE Trans. Smart Grid 2015, 6, 2263–2272. [Google Scholar] [CrossRef] [Green Version]
Figure 1. Diagram of a wind turbine with a Doubly Fed Induction Generator.
Energies 13 04260 g001
Figure 2. Equivalent circuit of wind based on DFIG for a negative and positive synchronous reference frame.
Energies 13 04260 g002
Figure 3. Relationship among reference frames for α β , dq   and   dq + [18].
Energies 13 04260 g003
Figure 4. Principal concepts of wind power plants.
Energies 13 04260 g004
Figure 5. Schematic diagram of a wind turbine with a fixed speed.
Energies 13 04260 g005
Figure 6. Schematic diagram of a wind turbine (WT) based synchronous generator with full feed.
Energies 13 04260 g006
Figure 7. General diagram of a wind turbine with a DFIG.
Energies 13 04260 g007
Figure 8. Schematic diagram of a slip control for a wind turbine.
Energies 13 04260 g008
Figure 9. Schematic diagram of speed control.
Energies 13 04260 g009
Figure 10. Diagram of smart grid technologies’ challenges and benefits [29,30,31,32].
Energies 13 04260 g010
Figure 11. Dynamic voltage regulation for wind turbines based on DFIG.
Energies 13 04260 g011
Figure 12. Detailed experimental set up.
Energies 13 04260 g012
Figure 13. A wind turbine based on DFIG with a high speed of 12.5 m/s.
Energies 13 04260 g013
Figure 14. Wind speed based on DFIG with a speed of 10.5 m/s.
Energies 13 04260 g014
Figure 15. A wind turbine based on DFIG with a speed of 8.5 m/s.
Energies 13 04260 g015
Figure 16. A wind turbine based on DFIG with a speed of 7 m/s.
Energies 13 04260 g016
Figure 17. A wind turbine based on DFIG with a speed of 6.5 m/s.
Energies 13 04260 g017
Figure 18. A wind turbine based on DFIG with a speed of 5.2 m/s.
Energies 13 04260 g018
Figure 19. A wind turbine based on DFIG with a speed of 4.5 m/s.
Energies 13 04260 g019
Figure 20. A wind turbine based on DFIG with a speed of 3.4 m/s.
Energies 13 04260 g020
Figure 21. Instantaneous value of the main voltage U g r i d .
Energies 13 04260 g021
Figure 22. Instantaneous value of the main current I g r i d .
Energies 13 04260 g022
Figure 23. Voltage and current in the positive sequence (POS).
Energies 13 04260 g023
Figure 24. Current in direct axis and quadrature axis I g r i d .
Energies 13 04260 g024
Figure 25. Voltages in a d q reference frame for a negative sequence (NEG).
Energies 13 04260 g025
Figure 26. Current for d q axes in a negative sequence.
Energies 13 04260 g026
Table 1. Differentiation between traditional grid and smart grid technologies [27,28,29].
Traditional Grid TechnologiesSmart Grid Technologies
Few sensors in the networkSensors all over the network
Electromechanical systemsDigital system
Few customer choicesMany customer choices
Limited control strategiesPervasive control strategies
Failures and blackouts issuesAdaptive and islanding mode
Manual restoration capabilitySelf-healing capability
Centralized generationDistributed generation
One way communication technologiesTwo way communication technologies
Manual monitoringRemote self-monitoring
Table 2. Experimental Data Captured.
N [rpm]M [Nm] P m e c   [ W ] P g e n   [ W ] P l s   [ W ] P t o t   [ W ] Speed [m/s]Voltage Sag [Volts]
1902612016754775012.50%
18974.89155011452010.520%
16673530274−622128.540%
13782297161−10061760%
12811.8239127−104226.5100%
10381.112756−108−535.2100%
9110.98025−102−804.5100%
7560.4370−2−253.4100%
18974.89155011452010.520%
16673530274−622128.540%

