Development Forecasts for the Zero-Emission Bus Fleet in Servicing Public Transport in Chosen EU Member Countries


Abstract

1. Introduction
2. Materials and Methods
- Battery electric vehicles (BEVs)—powered by an electric motor and battery with plug-in charging;
- Hybrid electric vehicles (HEVs)—combine a conventional (petrol/diesel) engine and a small electric motor/battery charged via regenerative braking or the engine;
- Plug-in hybrid electric vehicles (PHEVs)—a conventional (petrol/diesel) engine complemented with an electric motor/battery with plug-in charging;
- Range-extended electric vehicles (REEVs)—powered by an electric motor and plug-in battery, with an auxiliary combustion engine used only to supplement battery charging;
- Fuel cell electric vehicles (FCEVs)—use a fuel cell to create on-board electricity, generally using compressed hydrogen and oxygen from the air.
- Petrol;
- Diesel;
- Petrol-electric, covers both non off-vehicle-chargeable hybrid electric vehicle (“Hybrid electric vehicle”) and off-vehicle-chargeable hybrid electric vehicle (“Plug-in hybrid electric vehicle”);
- Diesel-electric, covers both non off-vehicle-chargeable hybrid electric vehicle (“Hybrid electric vehicle”) and off-vehicle-chargeable hybrid electric vehicle (“Plug-in hybrid electric vehicle”);
- Electric vehicle (EV), covers pure electric vehicle (“Battery electric vehicle”);
- Other, covers bi-fuel petrol/LPG, bi-fuel petrol/CNG, LPG, CNG, flex-fuel, and other fuels than those previously listed.
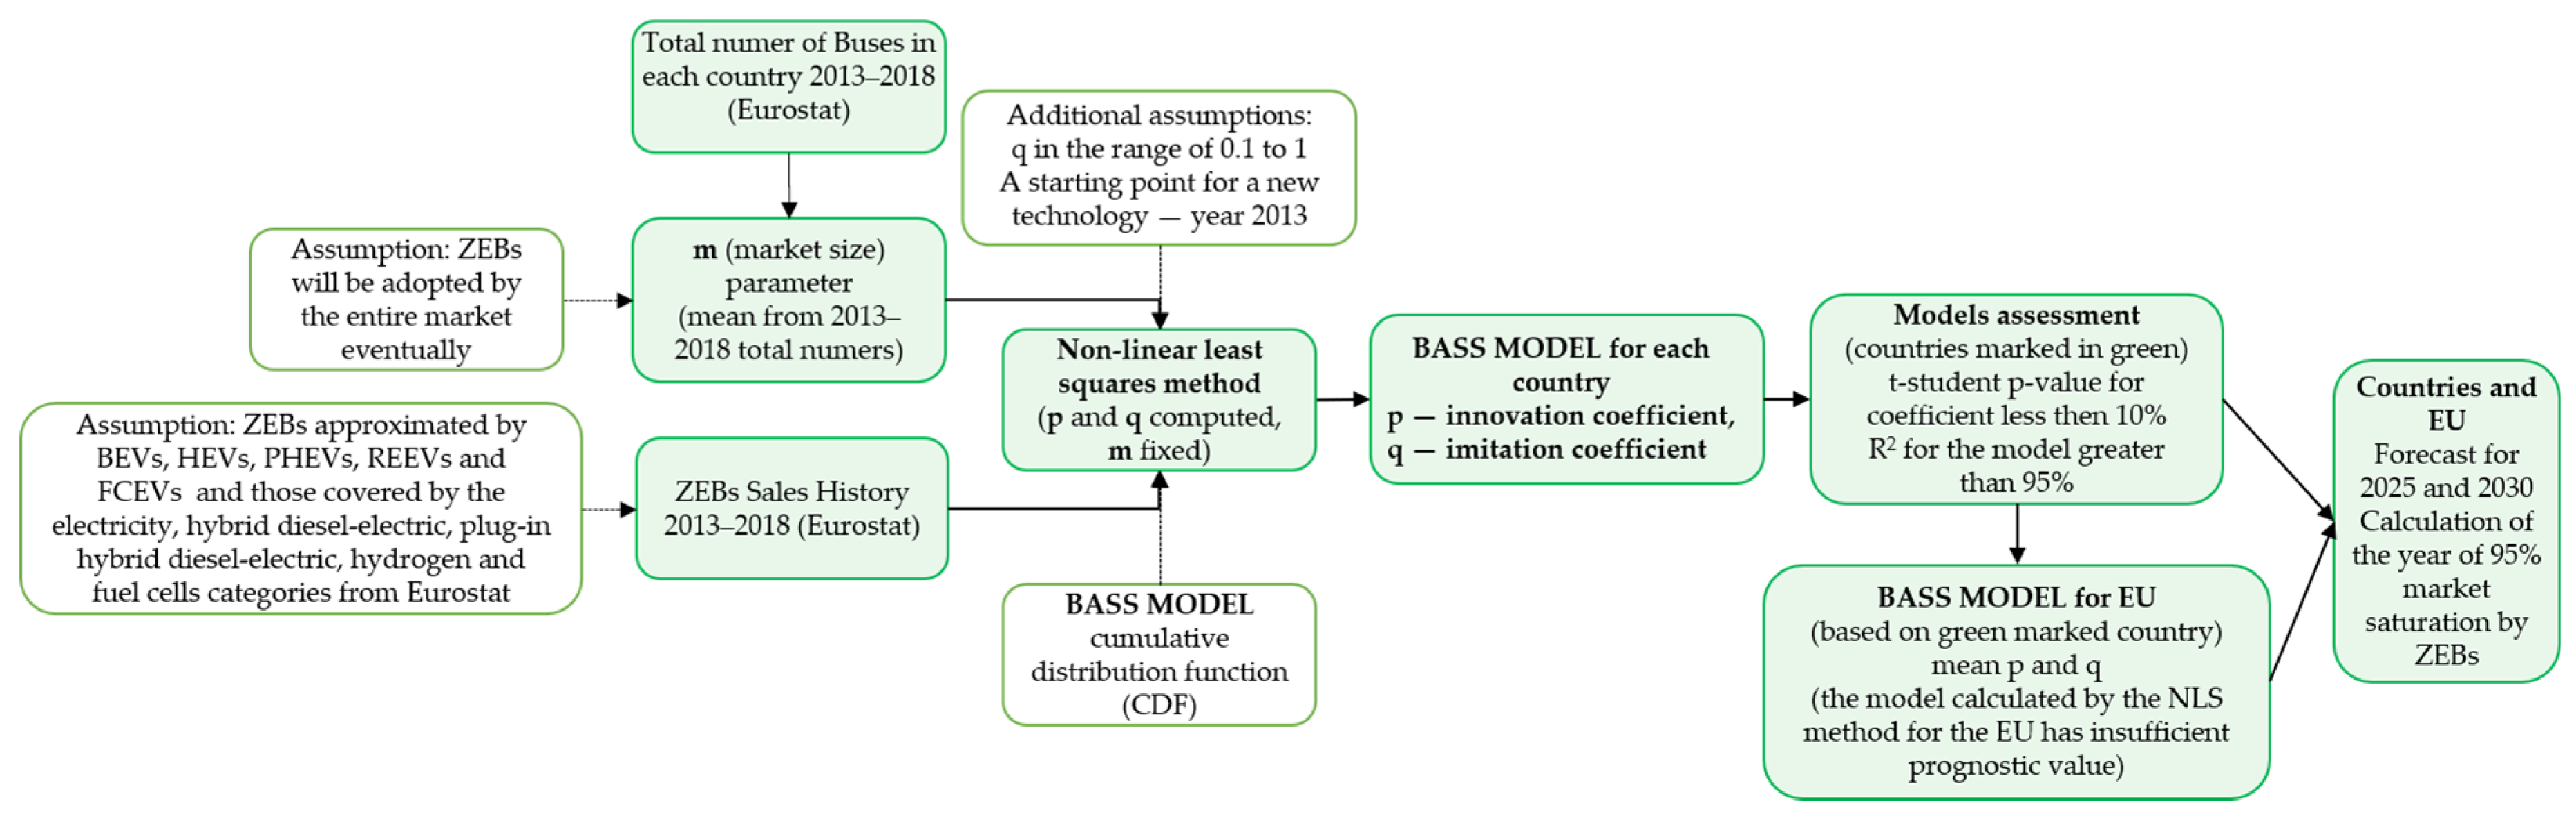
- F(t)—the total number of new technology users by time t (numbers of ZEBs in the market),
- f(t)—number of users of new technology that adopt at time t,
- m—the total number of technology users (total number of buses, see Table 1),
- p—the innovation coefficient,
- q—the imitation coefficient (for details, see [11]).
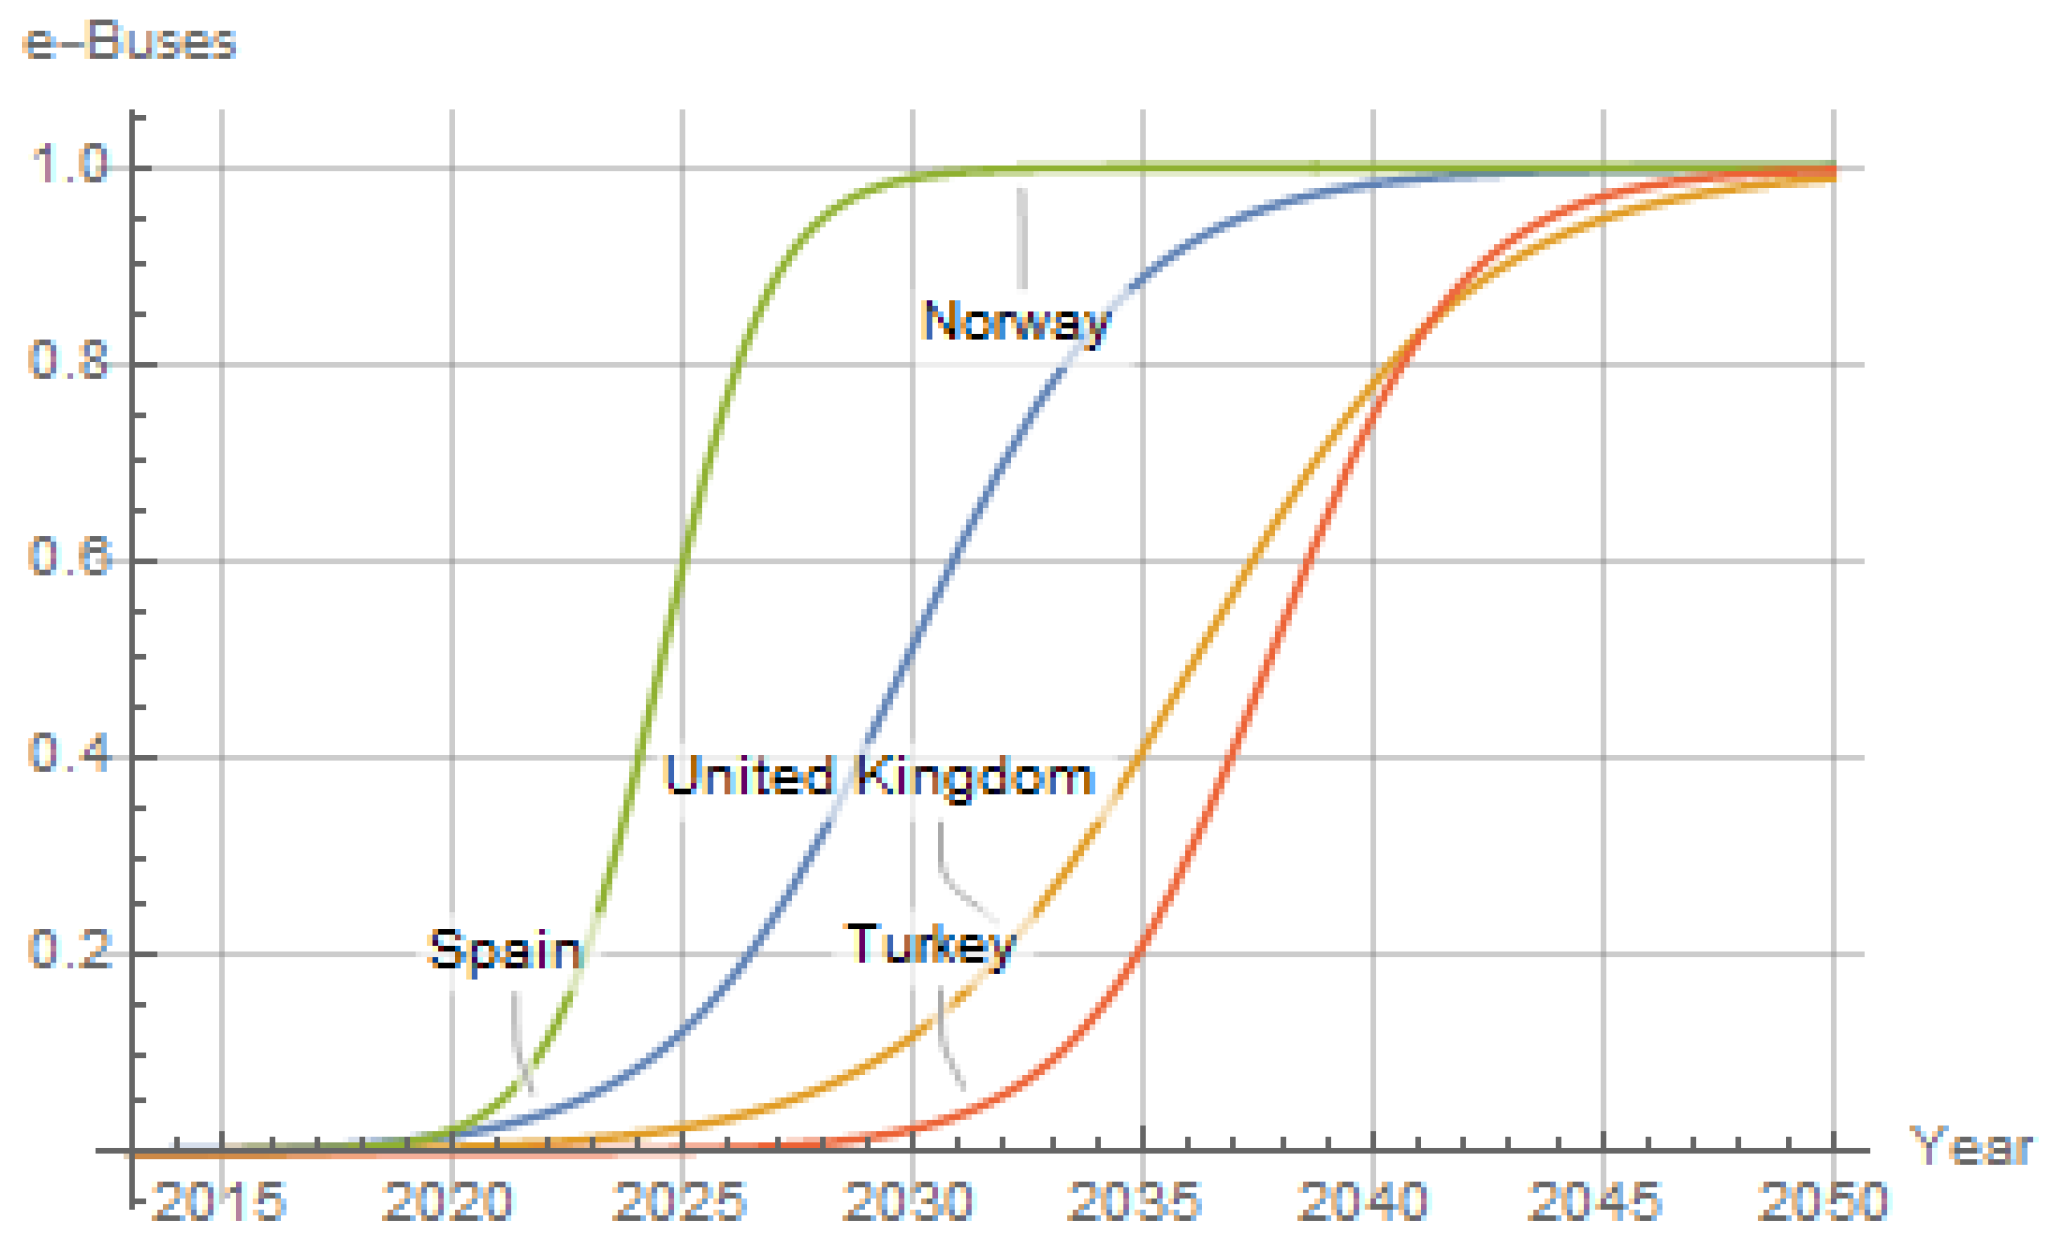
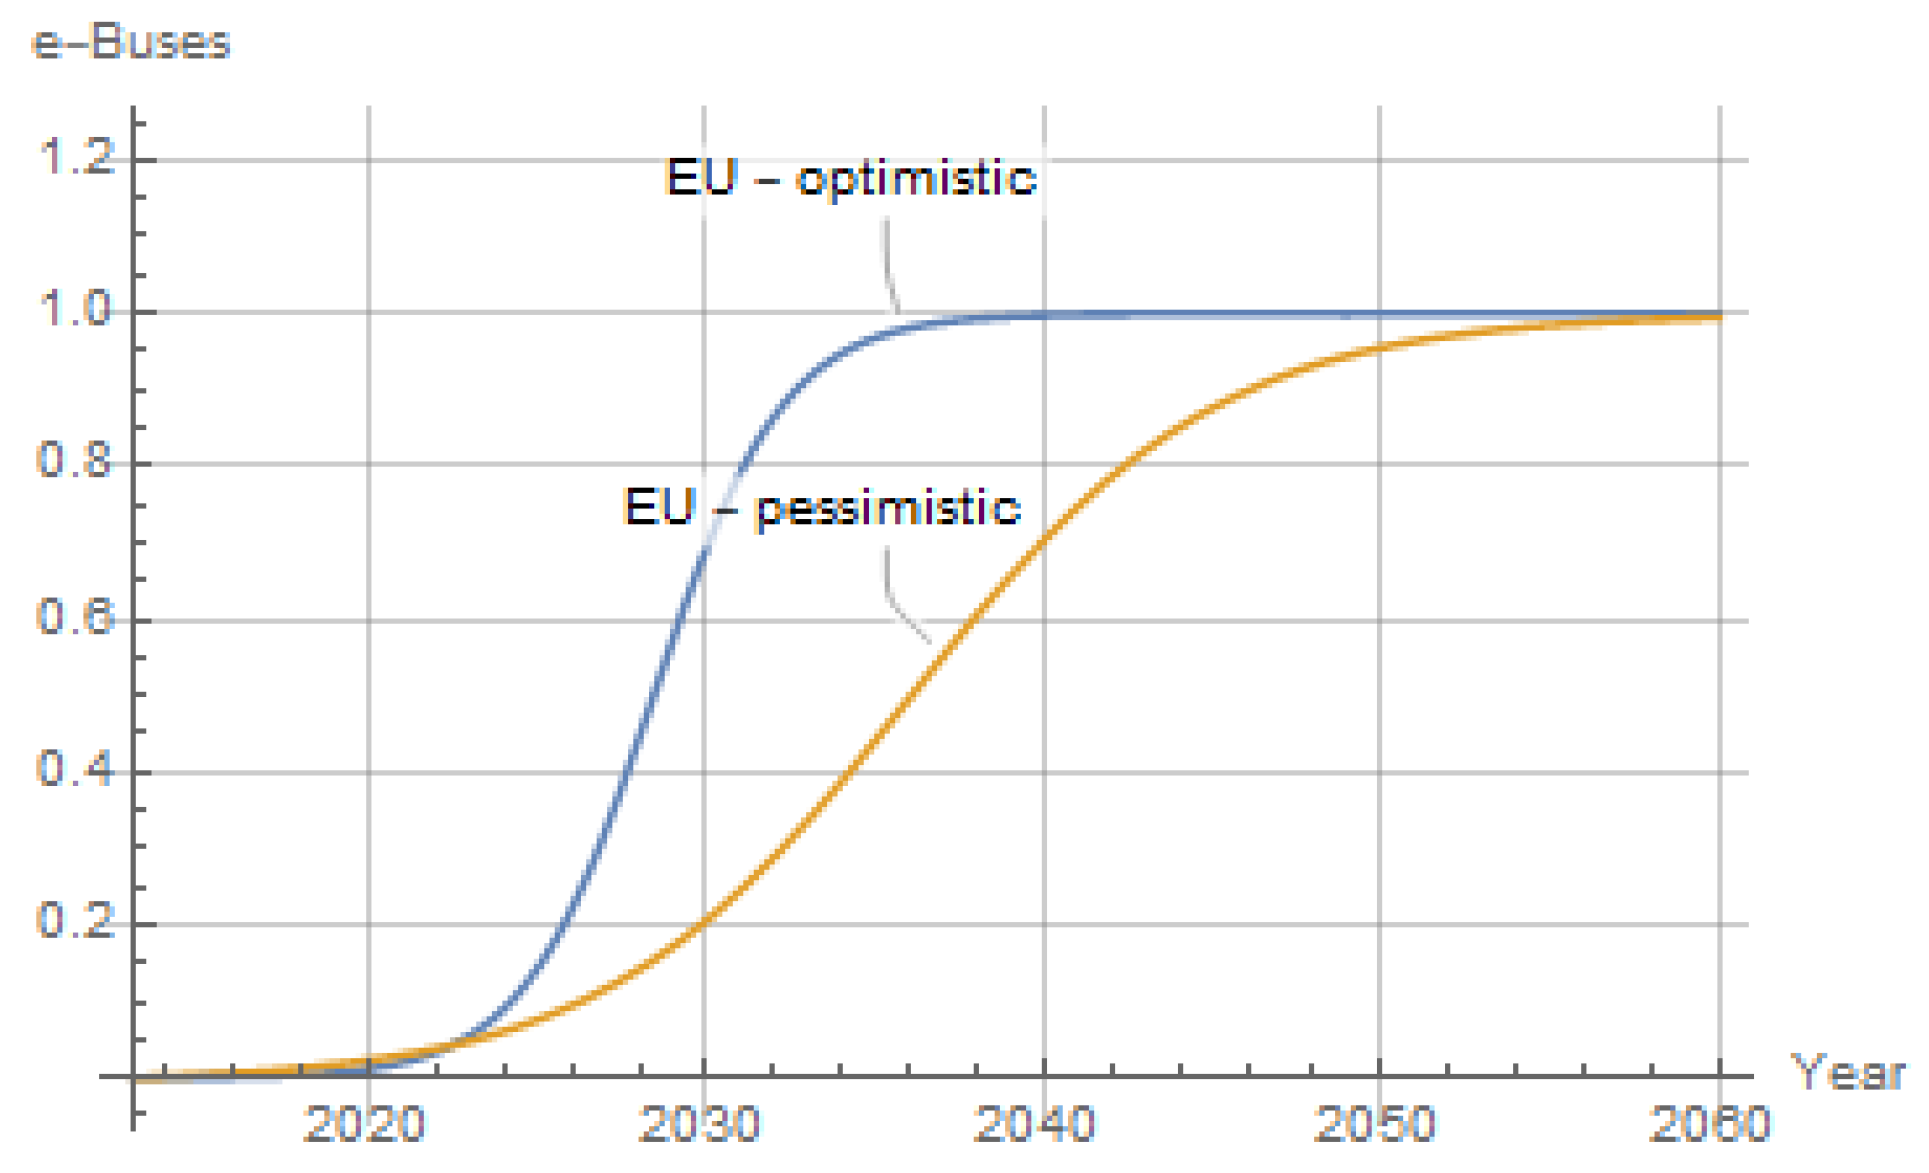
3. Results
4. Discussion
5. Conclusions
Author Contributions
Funding
Conflicts of Interest
References
- Wojtkowska-Łodej, G. Wyzwania klimatyczne i energetyczne a polityka Unii Europejskiej. Polit. Energ. Energy Policy J. 2014, 17, 39–52. [Google Scholar]
- European Commission. Citizens’ Summary: Analysis of Options for Reducing the EU’s Greenhouse Gas Emissions by 30 % by 2020. 2009. Available online: https://ec.europa.eu/clima/sites/clima/files/summary/docs/greenhouse_gas_2020_en.pdf (accessed on 2 June 2020).
- European Union. Citizens’ Summary EU Climate and Energy Package 2020. 2012. Available online: https://ec.europa.eu/clima/sites/clima/files/strategies/2020/docs/climate_package_en.pdf (accessed on 2 June 2020).
- Committee of the Regions of European Union. Opinia Komitetu Regionów—Ramy Polityczne Na Okres 2020–2030 Dotyczące Klimatu i Energii. 2014. Available online: https://eur-lex.europa.eu/legal-content/PL/TXT/PDF/?uri=CELEX:52014IR2691&from=HR (accessed on 31 May 2020).
- Polskie Stowarzyszenie Paliw Alternatywnych; Izba Gospodarcza Komunikacji Miejskiej Take E-Bus! Elektromobilność i Zrównoważony Rozwój Publicznego Transportu Zbiorowego w Miastach. 2019. Available online: https://pspa.com.pl/assets/uploads/2019/09/take_e-bus_raport_S.pdf (accessed on 25 May 2020).
- Bezruchonak, A. Geographic Features of Zero-Emissions Urban Mobility: The Case of Electric Buses in Europe and Belarus. Eur. Spat. Res. Policy 2019, 26, 81–99. [Google Scholar] [CrossRef]
- Blomberg. New Energy Outlook 2019. 2019. Available online: https://about.bnef.com/new-energy-outlook/ (accessed on 13 June 2020).
- Todoruț, A.; Cordoș, N.; Iclodean, C. Replacing Diesel Buses with Electric Buses for Sustainable Public Transportation and Reduction of CO2 Emissions. Pol. J. Environ. Stud. 2020, 29, 3339–3351. [Google Scholar] [CrossRef]
- Ufert, M.; Bäker, B. Battery Ageing as Part of the System Design of Battery Electric Urban Bus Fleets. Sci. Tech. 2020, 19, 12–19. [Google Scholar] [CrossRef]
- Barroso, J.M. Climate and Energy Priorities for Europe: The Way Forward—A Presentation of J.M. Barroso. 2014. Available online: https://ec.europa.eu/clima/sites/clima/files/strategies/2030/docs/climate_energy_priorities_en.pdf (accessed on 17 June 2020).
- Brdulak, A.; Chaberek, G.; Jagodziński, J. Determination of electricity demand by personal light electric vehicles (PLEVs): An example of e-motor scooters in the context of large city management in Poland. Energies 2020, 13, 194. [Google Scholar] [CrossRef]
- Pedrosa, G.; Leontyeva, Y.; Mayburov, I. Promoting zero emissions buses programs: A study of ekaterinburg residents’ willingness to pay. Int. J. Energy Prod. Manag. 2018, 3, 253–265. [Google Scholar] [CrossRef]
- Bakker, S.; Konings, R. The transition to zero-emission buses in public transport–The need for institutional innovation. Transp. Res. Part D Transp. Environ. 2018, 64, 204–215. [Google Scholar] [CrossRef]
- Alfonsin, V.; Suarez, A.; Maceiras, R.; Sanchez, A. Modeling and simulation of a zero emission urban bus with battery and fuel cell energy systems under real conditions. Environ. Prog. Sustain. Energy 2018, 37, 832–838. [Google Scholar] [CrossRef]
- Brozynski, M.T.; Leibowicz, B.D. Markov models of policy support for technology transitions. Eur. J. Oper. Res. 2020, 286, 1052–1069. [Google Scholar] [CrossRef]
- Meade, N.; Islam, T. Modelling and forecasting the diffusion of innovation—A 25-year review. Int. J. 2006, 22, 519–545. [Google Scholar] [CrossRef]
- Bass, F.M. A new product growth for model consumer durables. Manag. Sci. 2004, 15, 215–227. [Google Scholar] [CrossRef]
- Bauckhage, C.; Kersting, K. Strong Regularities in Growth and Decline of Popularity of Social Media Services. arXiv 2014, arXiv:1406.6529. [Google Scholar]
- Rogers, E.M.; Singhal, A.; Quinlan, M.M. Diffusion of innovations. In An Integrated Approach to Communication Theory and Research, 3rd ed.; Stacks, D.W., Salwen, M.B., Eichhorn, K.C., Eds.; Routledge: New York, NY, USA, 2019; ISBN 9781351358712. [Google Scholar]
- Bernards, R.; Morren, J.; Slootweg, H. Development and Implementation of Statistical Models for Estimating Diversified Adoption of Energy Transition Technologies. IEEE Trans. Sustain. Energy 2018, 9, 1540–1554. [Google Scholar] [CrossRef]
- Brito, T.L.F.; Islam, T.; Stettler, M.; Mouette, D.; Meade, N.; Moutinho dos Santos, E. Transitions between technological generations of alternative fuel vehicles in Brazil. Energy Policy 2019, 134, 110915. [Google Scholar] [CrossRef]
- Kong, D.Y.; Bi, X.H. Impact of social network and business model on innovation diffusion of electric vehicles in China. Math. Probl. Eng. 2014, 2014, 1–7. [Google Scholar] [CrossRef]
- Li, S.; Chen, H.; Zhang, G. Comparison of the short-term forecasting accuracy on battery electric vehicle between modified bass and Lotka-Volterra model: A case study of China. J. Adv. Transp. 2017, 2017, 1–6. [Google Scholar] [CrossRef]
- Ayyadi, S.; Maaroufi, M. Diffusion Models for Predicting Electric Vehicles Market in Morocco. In Proceedings of the EPE 2018—Proceedings of the 2018 10th International Conference and Expositions on Electrical And Power Engineering, Iasi, Romania, 17–18 October 2018. [Google Scholar]
- Cagliano, A.C.; Carlin, A.; Mangano, G.; Rafele, C. Analyzing the diffusion of eco-friendly vans for urban freight distribution. Int. J. Logist. Manag. 2017, 28, 1218–1242. [Google Scholar] [CrossRef]
- Van Den Bulte, C. Want to know how diffusion speed varies across countries and products? Try using a Bass model. Pdma Vis. 2002, XXVI, 12–15. [Google Scholar]
- Navigant Consulting, I. Energy Savings Forecast of Solid-State Lighting in General Illumination Applications; Navigant Consulting Inc.: Washington, DC, USA, 2016; pp. 1–119. [Google Scholar]
- Packey, D.J. Market Penetration of New Energy Technologies. Energy Policy 1993, 34, 3317–3326. [Google Scholar]
- Jeyaraj, A.; Sabherwal, R. The Bass Model of Diffusion: Recommendations for Use in Information Systems Research and Practice. J. Inf. Technol. Theory Appl. 2014, 15, 5–30. [Google Scholar]
- Mahajan, V.; Mason, C.H.; Srinivasan, V. An Evaluation of Estimation Procedures for New Product Diffusion Models. New Prod. Diffus. 1986, 851, 203–232. [Google Scholar]
- Marković, D.; Jukić, D. On parameter estimation in the bass model by nonlinear least squares fitting the adoption curve. Int. J. Appl. Math. Comput. Sci. 2013, 23, 145–155. [Google Scholar] [CrossRef]
- Van Den Bulte, C.; Lilien, G.L. Bias and systematic change in the parameter estimates of macro-level diffusion models. Mark. Sci. 1997, 16, 338–353. [Google Scholar] [CrossRef]
- European Environment Agency. Electric Vehicles in Europe; European Office of the European Union: Copenhagen, Denmark, 2016. [Google Scholar]
- Eurostat EU Transport Statistics. Eurostat Guidelines on Passenger Mobility Statistics; Eurostat EU Transport Statistics: Brussels, Belgium, 2018. [Google Scholar]
- European Union. Alternative Fuels. Expert Group Report; European Union: Luxembourg, 2017. [Google Scholar]
- Sultan, F.; Farley, J.U.; Lehmann, D.R. A Meta-Analysis of Applications of Diffusion Models. J. Mark. Res. 1990, 27, 70–77. [Google Scholar] [CrossRef]
- Wong, D.; Yap, K.; Turner, B.; Rexha, N. Predicting the Diffusion Pattern of Internet-Based Communication Applications Using Bass Model Parameter Estimates for Email. J. Internet Bus. 2011, 9, 1–25. [Google Scholar]
- Turk, T.; Trkman, P. Bass model estimates for broadband diffusion in European countries. Technol. Soc. Chang. 2012, 79, 85–96. [Google Scholar] [CrossRef]
- Massiani, J.; Gohs, A. The choice of Bass model coefficients to forecast diffusion for innovative products: An empirical investigation for new automotive technologies. Res. Transp. Econ. 2015, 50, 17–28. [Google Scholar] [CrossRef]
- Ma, J.; Zhang, L. A deploying method for predicting the size and optimizing the location of an electric vehicle charging stations. Information 2018, 9, 170. [Google Scholar] [CrossRef]
- Akbari, M.; Brenna, M.; Longo, M. Optimal locating of electric vehicle charging stations by application of Genetic Algorithm. Sustaiability 2018, 10, 1076. [Google Scholar] [CrossRef]
- Rogge, M.; van der Hurk, E.; Larsen, A.; Sauer, D.U. Electric bus fleet size and mix problem with optimization of charging infrastructure. Appl. Energy 2018, 211, 282–295. [Google Scholar] [CrossRef]
- Mohamed, M.; Ferguson, M.; Kanaroglou, P. What hinders adoption of the electric bus in Canadian transit? Perspectives of transit providers. Transp. Res. Part D Transp. Environ. 2018, 64, 134–149. [Google Scholar] [CrossRef]
- Nurhadi, L.; Borén, S.; Ny, H. A sensitivity analysis of total cost of ownership for electric public bus transport systems in swedish medium sized cities. Transp. Res. Procedia 2014, 3, 818–827. [Google Scholar] [CrossRef]
- Xu, Y.; Gbologah, F.E.; Liu, H.; Rodgers, M.O.; Guensler, R.L. Corrigendum to Assessment of alternative fuel and powertrain transit bus options using real-world operations data: Life-cycle fuel and emissions modeling. Appl. Energy 2015, 154, 143–159. [Google Scholar] [CrossRef]
- Zhou, B.; Wu, Y.; Zhou, B.; Wang, R.; Ke, W.; Zhang, S.; Hao, J. Real-world performance of battery electric buses and their life-cycle benefits with respect to energy consumption and carbon dioxide emissions. Energy 2016, 96, 603–613. [Google Scholar] [CrossRef]
- Li, X.; Castellanos, S.; Maassen, A. Emerging trends and innovations for electric bus adoption—A comparative case study of contracting and financing of 22 cities in the Americas, Asia-Pacific, and Europe. Res. Transp. Econ. 2018, 69, 470–481. [Google Scholar] [CrossRef]
- Taczanowski, J.; Kołoś, A.; Gwosdz, K.; Domański, B.; Guzik, R. The development of low-emission public urban transport in Poland. Bull. Geogr. 2018, 41, 79–92. [Google Scholar] [CrossRef]
- Pelletier, S.; Jabali, O.; Mendoza, J.E.; Laporte, G. The electric bus fleet transition problem. Transp. Res. Part C Emerg. Technol. 2019, 109, 174–193. [Google Scholar] [CrossRef]
- Cavallaro, F.; Danielis, R.; Nocera, S.; Rotaris, L. Should BEVs be subsidized or taxed? A European perspective based on the economic value of CO2 emissions. Transp. Res. Part D Transp. Environ. 2018, 64, 70–89. [Google Scholar] [CrossRef]
- Pedrosa, G.; Leontyeva, Y.; Mayburov, I. Financing of buses with zero emissions: The willingness of consumers to pay for public marketing. In Proceedings of the the 32nd International Business Information Management Association Conference, IBIMA 2018—Vision 2020: Sustainable Economic Development and Application of Innovation Management from Regional expansion to Global Growth, Seville, Spain, 15–16 November 2018. [Google Scholar]
- Plötz, P.; Schneider, U.; Globisch, J.; Dütschke, E. Who will buy electric vehicles? Identifying early adopters in Germany. Transp. Res. Part A Policy Pract. 2014, 67, 96–109. [Google Scholar] [CrossRef]
- Cooney, G.; Hawkins, T.R.; Marriott, J. Life cycle assessment of diesel and electric public transportation buses. J. Ind. Ecol. 2013, 17, 689–699. [Google Scholar] [CrossRef]
- Kliucininkas, L.; Matulevicius, J.; Martuzevicius, D. The life cycle assessment of alternative fuel chains for urban buses and trolleybuses. J. Environ. Manag. 2012, 99, 98–103. [Google Scholar] [CrossRef] [PubMed]
- Nurhadi, L.; Borén, S.; Ny, H. Advancing from Efficiency to Sustainability in Swedish Medium-sized Cities: An Approach for Recommending Powertrains and Energy Carriers for Public Bus Transport Systems. Procedia Soc. Behav. Sci. 2014, 111, 586–595. [Google Scholar] [CrossRef]
- Lajunen, A. Energy consumption and cost-benefit analysis of hybrid and electric city buses. Transp. Res. Part C Emerg. Technol. 2014, 38, 1–15. [Google Scholar] [CrossRef]
- Noel, L.; McCormack, R. A cost benefit analysis of a V2G-capable electric school bus compared to a traditional diesel school bus. Appl. Energy 2014, 126, 246–255. [Google Scholar] [CrossRef]
- Topal, O.; Nakir, İ. Total cost of ownership based economic analysis of diesel, CNG and electric bus concepts for the public transport in Istanbul City. Energies 2018, 11, 2369. [Google Scholar] [CrossRef]
- Brecher, A. Transit Bus Applications of Lithium-Ion Batteries. Progress and Prospects. In Lithium-Ion Batteries: Advances and Applications; Pistoia, G., Ed.; Elsevier: Amsterdam, The Netherlands, 2014; ISBN 9780444595133. [Google Scholar]
- Li, J.Q. Battery-electric transit bus developments and operations: A review. Int. J. Sustain. Transp. 2016, 10, 157–169. [Google Scholar] [CrossRef]
- Zivanovic, Z.; Nikolic, Z. The Application of Electric Drive Technologies in City Buses. In New Generation of Electric Vehicles; Stevic, Z., Ed.; Intech Open: London, UK, 2012. [Google Scholar]
- An, K. Battery electric bus infrastructure planning under demand uncertainty. Transp. Res. Part C Emerg. Technol. 2020, 111, 572–587. [Google Scholar] [CrossRef]
- CIVITAS. Smat choices for cities: Clean buses for your city. Police Note 2013. [Google Scholar]
- Tang, X.; Lin, X.; He, F. Robust scheduling strategies of electric buses under stochastic traffic conditions. Transp. Res. Part C Emerg. Technol. 2019, 105, 163–182. [Google Scholar] [CrossRef]
- May, N. Local environmental impact assessment as decision support for the introduction of electromobility in urban public transport systems. Transp. Res. Part D Transp. Environ. 2018, 64, 192–203. [Google Scholar] [CrossRef]
- Lin, Y.; Zhang, K.; Shen, Z.J.M.; Ye, B.; Miao, L. Multistage large-scale charging station planning for electric buses considering transportation network and power grid. Transp. Res. Part C Emerg. Technol. 2019, 107, 423–443. [Google Scholar] [CrossRef]
- Jing, W.; An, K.; Ramezani, M.; Kim, I. Location Design of Electric Vehicle Charging Facilities: A Path-Distance Constrained Stochastic User Equilibrium Approach. J. Adv. Transp. 2017, 2017, 1–15. [Google Scholar] [CrossRef]
- Liu, H.; Wang, D.Z.W. Locating multiple types of charging facilities for battery electric vehicles. Transp. Res. Part B Methodol. 2017, 103, 30–55. [Google Scholar] [CrossRef]
- Vepsäläinen, J.; Kivekäs, K.; Otto, K.; Lajunen, A.; Tammi, K. Development and validation of energy demand uncertainty model for electric city buses. Transp. Res. Part D Transp. Environ. 2018, 63, 347–361. [Google Scholar] [CrossRef]
- Grijalva, E.R.; López Martínez, J.M. Analysis of the Reduction of CO2 Emissions in Urban Environments by Replacing Conventional City Buses by Electric Bus Fleets: Spain Case Study. Energies 2019, 12, 525. [Google Scholar] [CrossRef]
- Wu, X.; Wang, T. Optimization of battery capacity decay for semi-active hybrid energy storage system equipped on electric city bus. Energies 2017, 10, 792. [Google Scholar] [CrossRef]
- Gokce, K. Performance evaluation of a newly designed robotized gearbox for electric city buses. Mechanika 2017, 23, 639–645. [Google Scholar] [CrossRef]
- Wieczorek, M.; Lewandowski, M.; Jefimowski, W. Cost comparison of different configurations of a hybrid energy storage system with battery-only and supercapacitor-only storage in an electric city bus. Bull. Pol. Acad. Sci. Tech. Sci. 2019, 67, 1095–1106. [Google Scholar] [CrossRef]
- Xylia, M.; Silveira, S. The role of charging technologies in upscaling the use of electric buses in public transport: Experiences from demonstration projects. Transp. Res. Part A Policy Pract. 2018, 118, 399–415. [Google Scholar] [CrossRef]
- Chiodo, E.; Lauria, D.; Andrenacci, N.; Pede, G. Accelerated life tests of complete lithium-ion battery systems for battery life statistics assessment. In Proceedings of the 2016 International Symposium on Power Electronics, Electrical Drives, Automation and Motion, SPEEDAM 2016, Pisa, Italy, 22–24 June 2016. [Google Scholar]
- Veeneman, W. Developments in public transport governance in the Netherlands; the maturing of tendering. Res. Transp. Econ. 2018, 69, 227–234. [Google Scholar] [CrossRef]
- Lin, B.; Tan, R. Are people willing to pay more for new energy bus fares? Energy 2017, 130, 365–372. [Google Scholar] [CrossRef]
- Heo, J.Y.; Yoo, S.H. The public’s value of hydrogen fuel cell buses: A contingent valuation study. Int. J. Hydrog. Energy 2013, 38, 4232–4240. [Google Scholar] [CrossRef]
- Tesla battery supplier Catl says new design has one million-mile lifespan. BBC News, 8 June 2020.
- Frost & Sullivan. Global Electric Vehicle Market Outlook; Frost & Sullivan: San Antonio, TX, USA, 2020. [Google Scholar]


| Bulgaria | 2013 | 2014 | 2015 | 2016 | 2017 | 2018 |
| New registrations | 20 | 150 | 47 | 0 | : | 14 |
| Total number | 467 | 563 | 540 | 437 | 390 | 376 |
| Estonia | 2013 | 2014 | 2015 | 2016 | 2017 | 2018 |
| New registrations | 0 | 0 | 0 | 0 | 0 | 0 |
| Total number | 91 | 88 | 75 | 63 | 58 | 1 |
| Country | 2013 | 2014 | 2015 | 2016 | 2017 | 2018 |
| Belgium | 59 34 | 63 34 | 7 134 | 201 34 | 213 34 | 366 34 |
| BulgariaDT | 467 234 | 563 234 | 540 234 | 437 234 | 390 234 | 376 234 |
| Czech RepublicNA | 559 234 | : 1234 | : 1234 | : 1234 | : 1234 | : 1234 |
| Denmark | 0 2 | 0 2 | 5 2 | 7 2 | 6 2 | 8 2 |
| Germany | 99 234 | 116 234 | 137 234 | 168 234 | 183 234 | 228 234 |
| Estonia | 91 34 | 88 34 | 99 34 | 87 34 | 102 34 | 45 34 |
| IrelandNA | : 1234 | : 1234 | : 1234 | : 1234 | : 1234 | : 1234 |
| GreeceNA | : 1234 | : 1234 | : 1234 | : 1234 | : 1234 | : 1234 |
| Spain | : 1234 | 112 | 152 | 274 | 463 | 701 |
| France | 567 34 | 638 34 | 1103 34 | 1682 34 | 1952 34 | 2300 34 |
| Croatia | : 1234 | : 1234 | 2 234 | 3 234 | 3 234 | 3 234 |
| ItalyDT | 495 34 | 488 34 | 494 34 | 463 34 | : 1234 | 488 34 |
| CyprusNA | 0 | 0 | 1 | 0 | 0 | 0 |
| Latvia | 01 | 257 | 269 | 290 | 255 | 258 |
| LithuaniaDT | 457 234 | 434 234 | 431 234 | 408 234 | 424 234 | 438 234 |
| Luxembourg | 4 234 | 2 234 | 48 34 | 59 34 | 7 234 | 33 234 |
| Hungary | 2 | 3 | 6 | 25 | 25 | 24 |
| MaltaDT | 5 134 | 5 3 | 5 3 | 0 | 5 3 | : 1234 |
| NetherlandsNA | : 1234 | : 1234 | : 1234 | : 1234 | : 1234 | : 1234 |
| Austria | 143 34 | 141 34 | 150 | 154 | 146 | 158 |
| Poland | : 1234 | 458 23 | 3616 (504)3 | 3636 (526)3 | 581 23 | 803 3 |
| Portugal | 8 234 | 15 | 14 | 17 | 19 | 46 |
| Romania | 1 234 | 2 234 | 4 234 | 4 234 | 4 234 | 15 34 |
| Slovenia | : 1234 | 2 234 | 2 234 | 4 234 | 3 234 | 4 234 |
| SlovakiaNA | 250 234 | : 1234 | : 1234 | : 1234 | : 1234 | : 1234 |
| Finland | 2 13 | 7 | 8 | 16 | 24 | 24 |
| Sweden | 50 34 | 56 34 | 73 | 89 | 108 | 151 |
| United Kingdom | : 1234 | : 1234 | 194 4 | 261 4 | 305 234 | 511 23 |
| Liechtenstein | 2 | 2 | 2 | 2 | 2 3 | 2 3 |
| Norway | : 1234 | 9 234 | 11 234 | 37 | 67 | 167 |
| Switzerland | 100 | 100 3 | 0 3 | 100 | 100 3 | 200 3 |
| Macedonia6,DT | 3 234 | 2 234 | 2963 (1)34 | : 1234 | : 1234 | : 1234 |
| Turkey | 0 234 | 1 234 | 12 234 | 24 234 | 57 | 74 |
| Kosovo5,NA | : 1234 | : 1234 | : 1234 | : 1234 | 023 | 0 |
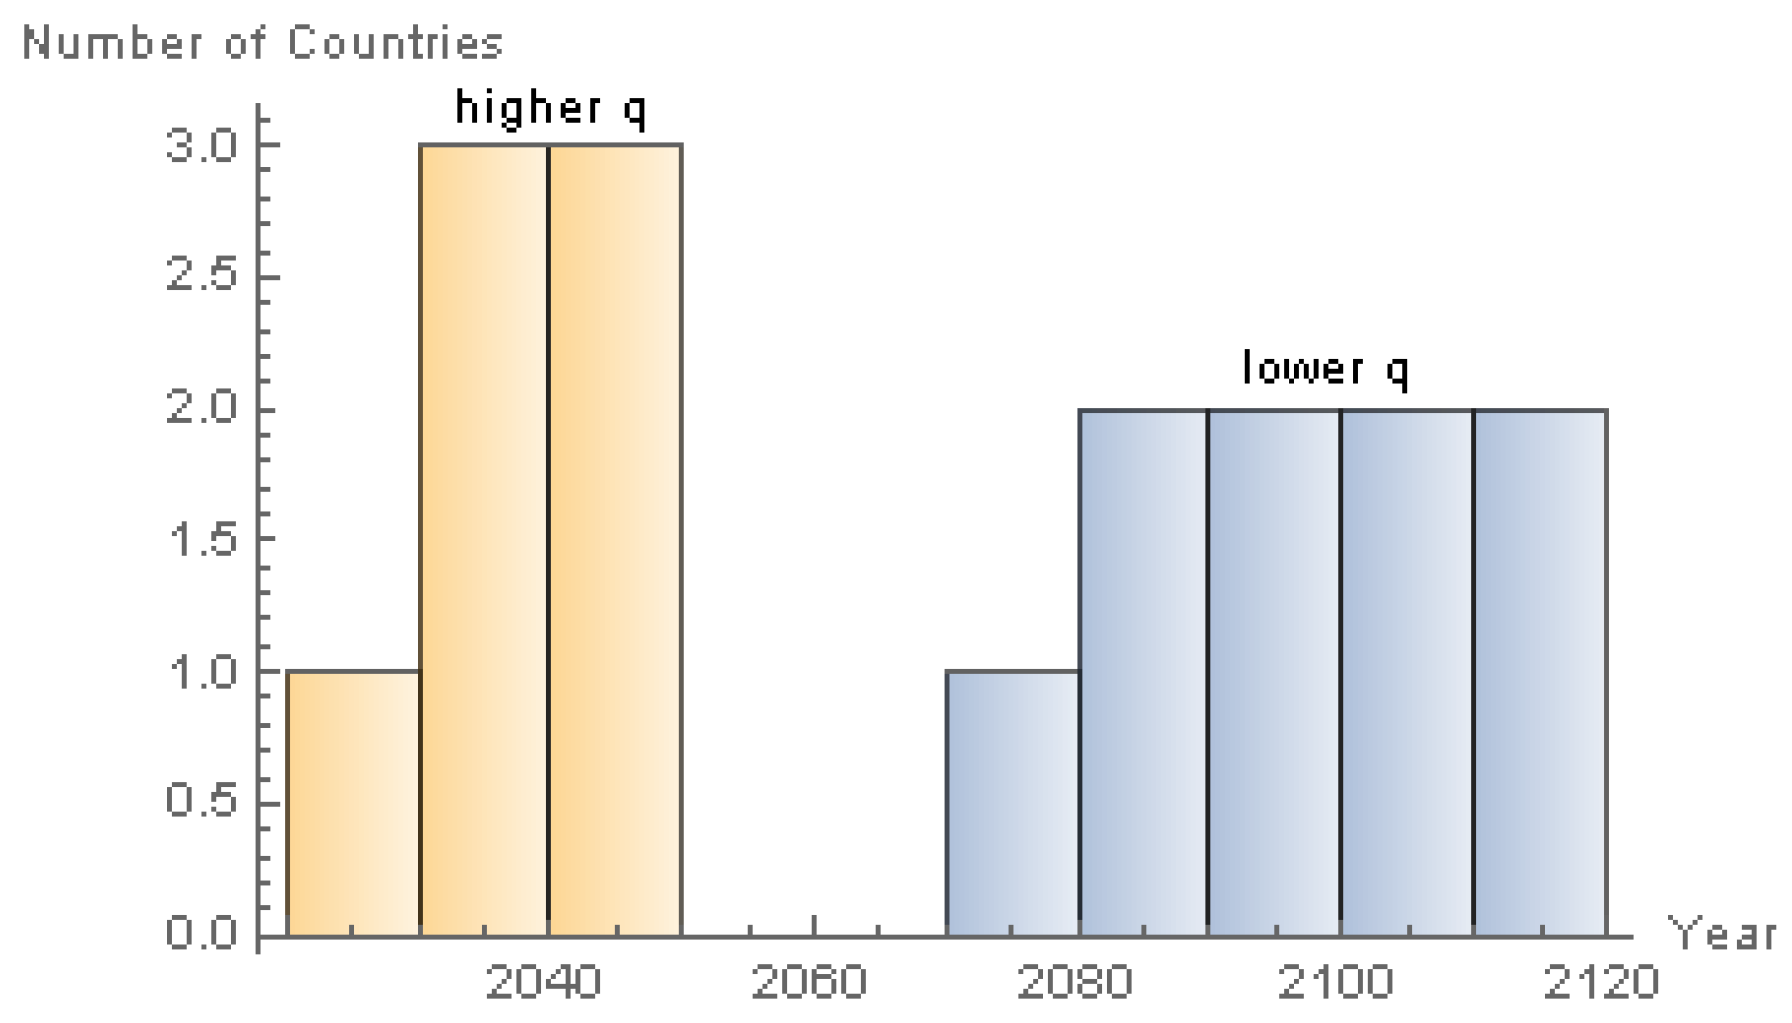
| Country | Parameter | Estimate | Standard Error | T-Statistic | p-Value | R2 |
|---|---|---|---|---|---|---|
| Belgium | p | 0.000885394 | 0.000565631 | 1.565322522 | 0.192561721 | 0948650663 |
| q | 0.410295825 | 0.172394185 | 2.379986445 | 0.075990387 | ||
| Denmark | p | 0.0000771299 | 0.000045924 | 1.679509668 | 0.168351712 | 0.926736146 |
| q | 0.100003852 | 0.212953914 | 0.469603257 | 0.663094394 | ||
| Germany | p | 0.000396186 | 0.000204596 | 1.936428221 | 0.124888934 | 0.943931675 |
| q | 0.1 | 0.184882586 | 0.540883823 | 0.617301126 | ||
| Estonia | p | 0.002887886 | 0.004669849 | 0.618411127 | 0.56977991 | 0.633401476 |
| q | 0.1 | 0.583379797 | 0.171414918 | 0.872219773 | ||
| Spain | p | 0.000457022 | 0.0000644608 | 7.089928856 | 0.002089651 | 0.99731596 |
| q | 0.401918954 | 0.038185946 | 10.52531079 | 0.000460806 | ||
| France | p | 0.003082591 | 0.000640235 | 4.814783299 | 0.008555448 | 0.990588119 |
| q | 0.1 | 0.074974179 | 1.333792525 | 0.253150892 | ||
| Croatia | p | 0.0000807419 | 0.0000502966 | 1.605314643 | 0.183695642 | 0.920360181 |
| q | 0.100009858 | 0.222797329 | 0.448882661 | 0.676761267 | ||
| Latvia | p | 0.009131224 | 0.008486617 | 1.075955683 | 0.34251624 | 0.842631191 |
| q | 0.1 | 0.34176469 | 0.292598981 | 0.78437893 | ||
| Luxembourg | p | 0.002770994 | 0.004986776 | 0.555668447 | 0.608049994 | 0.582779443 |
| q | 0.100000027 | 0.649018282 | 0.154078906 | 0.885008825 | ||
| Hungary | p | 0.000181564 | 0.000113826 | 1.595099572 | 0.185919392 | 0.919813533 |
| q | 0.10466556 | 0.223167127 | 0.469000794 | 0.663489577 | ||
| Austria | p | 0.002718866 | 0.002978315 | 0.91288739 | 0.412946675 | 0.790341288 |
| q | 0.1 | 0.394989813 | 0.253171086 | 0.812615238 | ||
| Poland | p | 0.00091753 | 0.000469269 | 1.955231138 | 0.122221307 | 0.945055774 |
| q | 0.1 | 0.183399162 | 0.545258763 | 0.614554536 | ||
| Portugal | p | 0.000171208 | 0.000111008 | 1.542300231 | 0.197864381 | 0.933889305 |
| q | 0.293996079 | 0.191424236 | 1.535835201 | 0.199380212 | ||
| Romania | p | 0.00000303032 | 0.00000320946 | 0.944183717 | 0.398537742 | 0.934794737 |
| q | 0.709422062 | 0.238694759 | 2.972088974 | 0.041059215 | ||
| Slovenia | p | 0.000206534 | 0.000116033 | 1.779960219 | 0.14969122 | 0.93427419 |
| q | 0.100016751 | 0.201013473 | 0.497562423 | 0.644902165 | ||
| Finland | p | 0.00017463 | 0.000050292 | 3.47231985 | 0.02552966 | 0.982203041 |
| q | 0.118605229 | 0.100991957 | 1.174402713 | 0.305378156 | ||
| Sweden | p | 0.001315502 | 0.000452593 | 2.906593192 | 0.043827409 | 0.974409779 |
| q | 0.1 | 0.123521821 | 0.809573557 | 0.463593199 | ||
| United Kingdom | p | 0.000169943 | 0.0000722559 | 2.351959527 | 0.078347481 | 0.972186036 |
| q | 0.326811667 | 0.122009779 | 2.678569456 | 0.055310761 | ||
| Liechtenstein | p | 0.003518262 | 0.004142058 | 0.849399656 | 0.44350691 | 0.765882685 |
| q | 0.100000655 | 0.425556385 | 0.234988027 | 0.825757503 | ||
| Norway | p | 0.0000590045 | 0.0000141281 | 4.176397302 | 0.013958849 | 0.99743895 |
| q | 0.829605613 | 0.051582606 | 16.0830496 | 0.0000874111 | ||
| Switzerland | p | 0.001742495 | 0.001962474 | 0.887907319 | 0.424757571 | 0.796458861 |
| q | 0.177589975 | 0.373654193 | 0.475278957 | 0.659377964 | ||
| Turkey | p | 0.00000330122 | 0.00000142233 | 2.320995094 | 0.081048171 | 0.979453761 |
| q | 0.480497008 | 0.109960075 | 4.36974062 | 0.011970507 |
| Model Type | Parameter | Estimate | Standard Error | t-Statistic | p-Value | R2 |
|---|---|---|---|---|---|---|
| EU | m | 7508.84 | 6356.48 | 1.18129 | 0.322606 | 0.980254 |
| p | 0.338689 | 0.19937 | 1.69879 | 0.187921 | ||
| q | 0.0001 | 1.44641 | 0.000069137 | 0.999949 | ||
| EU fixed m | p | 0.000614179 | 0.000333394 | 1.8422 | 0.139242 | 0.938461 |
| q | 0.1 | 0.19447 | 0.514219 | 0.634204 | ||
| EU fixed p | m | 611100 | 260598 | 2.34499 | 0.0789462 | 0.958096 |
| q | 0.0001 | 0.172262 | 0.000580512 | 0.999565 |
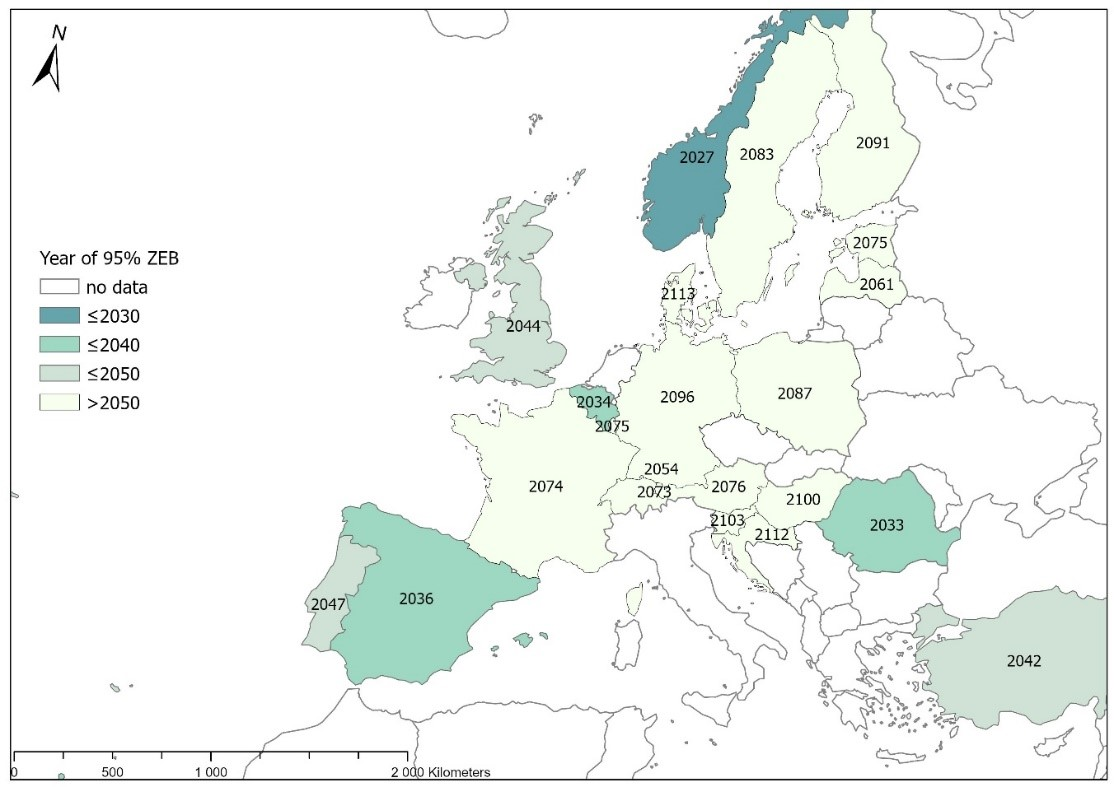
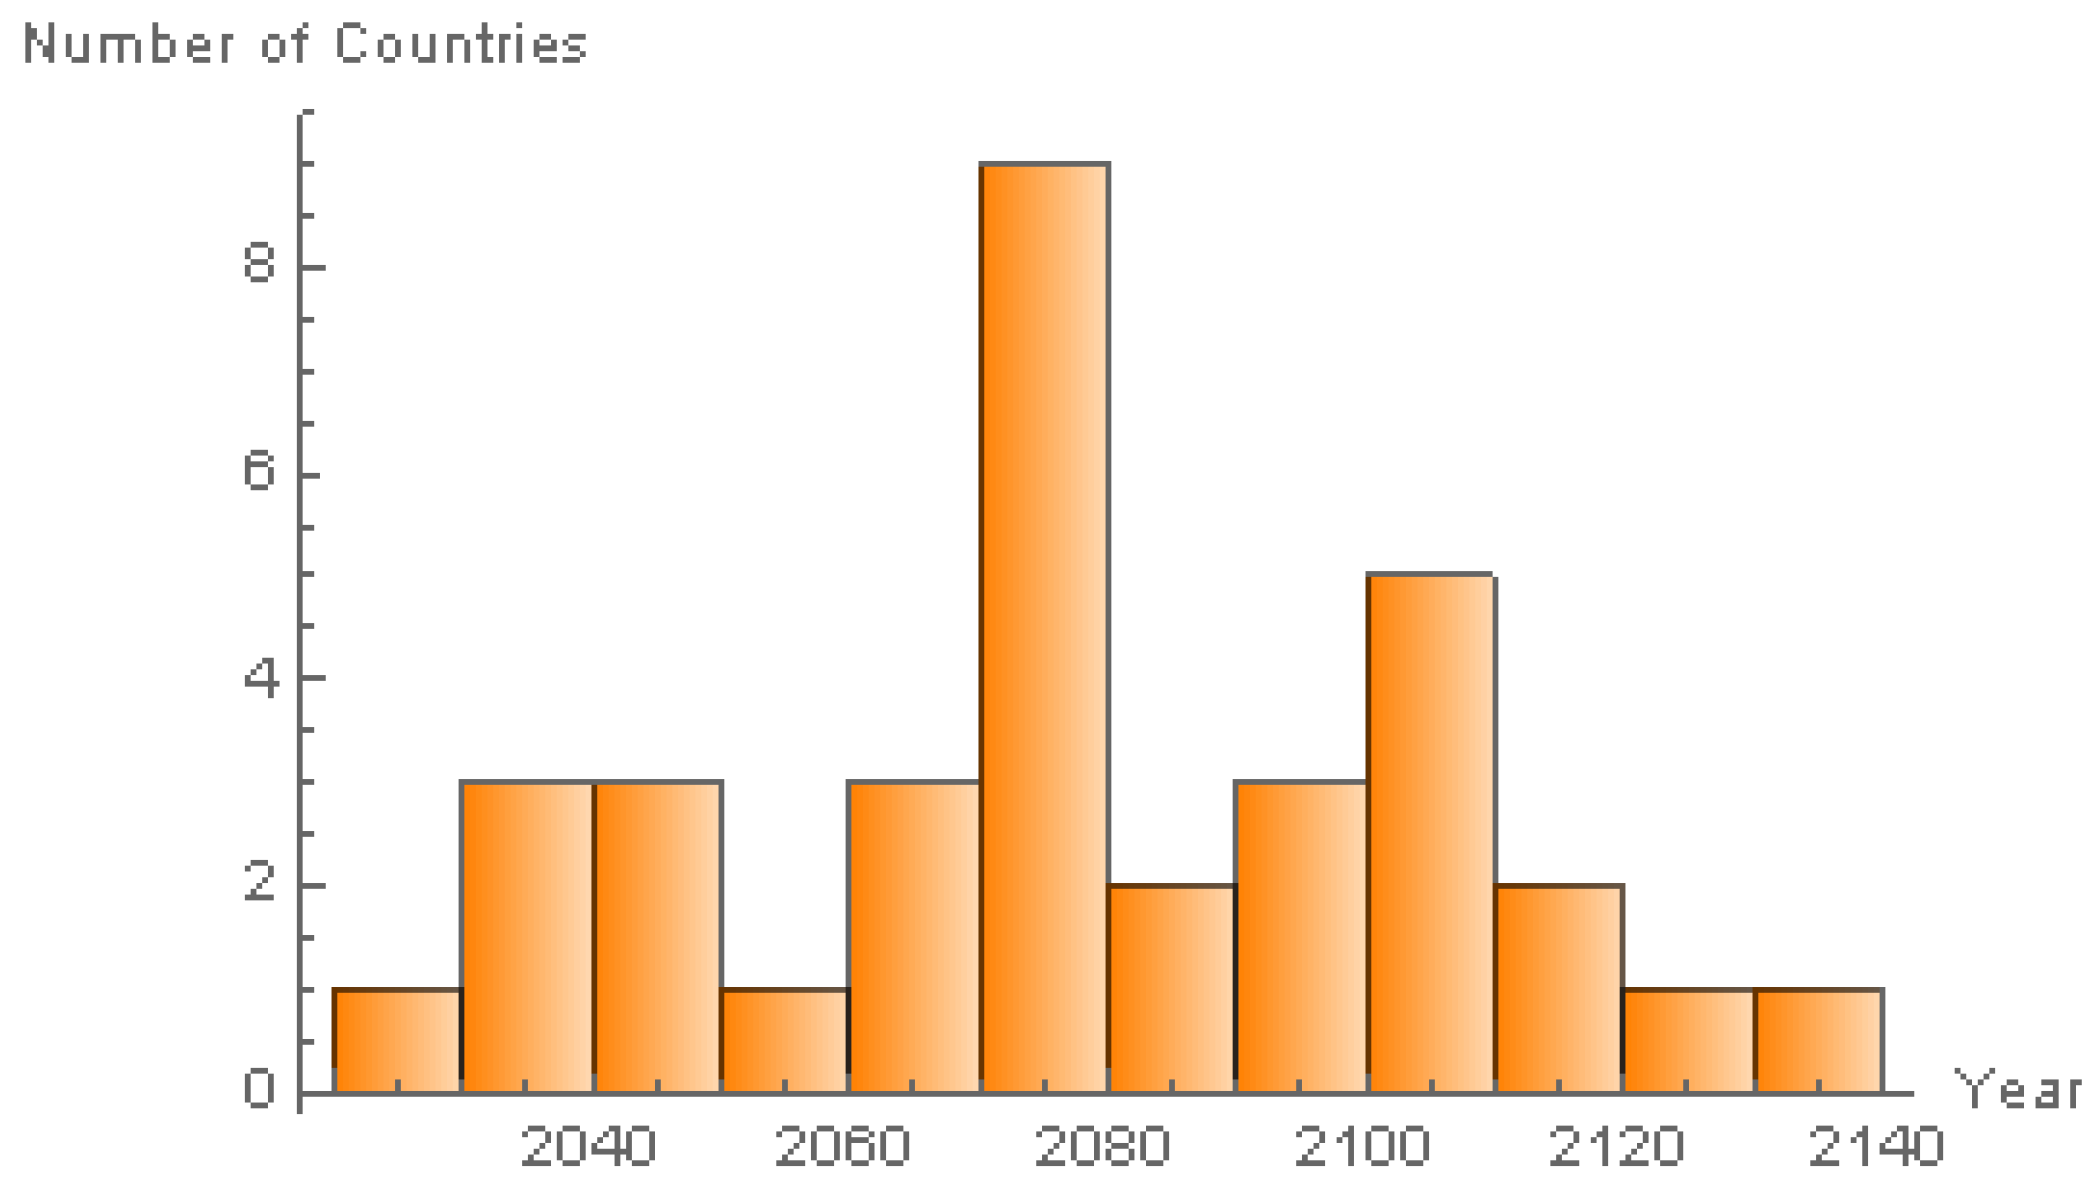
| Country | E-Bus Market | Year 95% of m | Number of Buses | |||
|---|---|---|---|---|---|---|
| 2025 Total | 2025 % | 2030 Total | 2030 % | |||
| Belgium | 4965 | 30.99% | 12,479 | 77.90% | 2034 | 16,019 |
| Denmark | 27 | 0.20% | 51 | 0.38% | 2113 | 13,353 |
| Germany | 824 | 1.05% | 1548 | 1.97% | 2096 | 78,591 |
| Estonia | 354 | 7.30% | 635 | 13.10% | 2075 | 4847 |
| Spain | 10,761 | 17.44% | 37,854 | 61.34% | 2036 | 61,712 |
| France | 7674 | 7.77% | 13,711 | 13.89% | 2074 | 98,701 |
| Croatia | 11 | 0.21% | 21 | 0.39% | 2112 | 5365 |
| Latvia | 1046 | 20.75% | 1709 | 33.90% | 2061 | 5041 |
| Luxembourg | 132 | 7.01% | 237 | 12.59% | 2075 | 1883 |
| Hungary | 91 | 0.50% | 176 | 0.96% | 2100 | 18,324 |
| Austria | 674 | 6.89% | 1213 | 12.41% | 2076 | 9776 |
| Poland | 2724 | 2.41% | 5062 | 4.47% | 2087 | 113,175 |
| Portugal | 369 | 2.53% | 1506 | 10.35% | 2047 | 14,557 |
| Romania | 1971 | 4.14% | 28,545 | 60.02% | 2033 | 47,563 |
| Slovenia | 14 | 0.53% | 27 | 1.02% | 2103 | 2658 |
| Finland | 92 | 0.54% | 185 | 1.08% | 2091 | 17,087 |
| Sweden | 484 | 3.43% | 892 | 6.31% | 2083 | 14,126 |
| United Kingdom | 5530 | 3.47% | 25,056 | 15.72% | 2044 | 159,404 |
| Liechtenstein | 8 | 8.00% | 15 | 15.00% | 2073 | 100 |
| Norway | 12,658 | 77.46% | 16,267 | 99.54% | 2027 | 16,342 |
| Switzerland | 788 | 8.28% | 1813 | 19.05% | 2054 | 9516 |
| Turkey | 2373 | 0.35% | 25,372 | 3.77% | 2042 | 672,885 |
© 2020 by the authors. Licensee MDPI, Basel, Switzerland. This article is an open access article distributed under the terms and conditions of the Creative Commons Attribution (CC BY) license (http://creativecommons.org/licenses/by/4.0/).
Share and Cite
Brdulak, A.; Chaberek, G.; Jagodziński, J. Development Forecasts for the Zero-Emission Bus Fleet in Servicing Public Transport in Chosen EU Member Countries. Energies 2020, 13, 4239. https://doi.org/10.3390/en13164239
Brdulak A, Chaberek G, Jagodziński J. Development Forecasts for the Zero-Emission Bus Fleet in Servicing Public Transport in Chosen EU Member Countries. Energies. 2020; 13(16):4239. https://doi.org/10.3390/en13164239
Chicago/Turabian StyleBrdulak, Anna, Grażyna Chaberek, and Jacek Jagodziński. 2020. "Development Forecasts for the Zero-Emission Bus Fleet in Servicing Public Transport in Chosen EU Member Countries" Energies 13, no. 16: 4239. https://doi.org/10.3390/en13164239
APA StyleBrdulak, A., Chaberek, G., & Jagodziński, J. (2020). Development Forecasts for the Zero-Emission Bus Fleet in Servicing Public Transport in Chosen EU Member Countries. Energies, 13(16), 4239. https://doi.org/10.3390/en13164239