Article

Real-Time Control of Plug-in Electric Vehicles for Congestion Management of Radial LV Networks: A Comparison of Implementations

by
César García Veloso
1,2,*,
Kalle Rauma
3,
Julián Fernández
4 and
Christian Rehtanz
3
1
School of Electrical Engineering and Computer Science, KTH Royal Institute of Technology, 11428 Stockholm, Sweden
2
Barcelona School of Industrial Engineering, Technical University of Catalonia, 08028 Barcelona, Spain
3
Institute of Energy Systems, Energy Efficiency and Energy Economics (ie3), TU Dortmund University, 44227 Dortmund, Germany
4
Institute for Integrated Energy Systems, University of Victoria, Victoria, BC V8W 2Y2, Canada
*
Author to whom correspondence should be addressed.
Energies 2020, 13(16), 4227; https://doi.org/10.3390/en13164227
Submission received: 5 May 2020 / Revised: 8 August 2020 / Accepted: 13 August 2020 / Published: 15 August 2020
(This article belongs to the Special Issue Flexibility in Distribution Systems from EVs and Batteries)

Abstract

:
The global proliferation of plug-in electric vehicles (PEVs) poses a major challenge for current and future distribution systems. If uncoordinated, their charging process may cause congestion on both network transformers and feeders, resulting in overheating, deterioration, protection triggering and eventual risk of failure, seriously compromising the stability and reliability of the grid. To mitigate such impacts and increase their hosting capacity in radial distribution systems, the present study compares the levels of effectiveness and performances of three alternative centralized thermal management formulations for a real-time agent-based charge control algorithm that aims to minimize the total impact upon car owners. A linear formulation and a convex formulation of the optimization problem are presented and solved respectively by means of integer linear programming and a genetic algorithm. The obtained results are then compared, in terms of their total impact on the end-users and overall performance, with those of the current heuristic implementation of the algorithm. All implementations were tested using a simulation environment considering multiple vehicle penetration and base load levels, and equipment modeled after commercially available charging stations and vehicles. Results show how faster resolution times are achieved by the heuristic implementation, but no significant differences between formulations exist in terms of network management and end-user impact. Every vehicle reached its maximum charge level while all thermal impacts were mitigated for all considered scenarios. The most demanding scenario showcased over a 30% reduction in the peak load for all thermal variants.

1. Introduction

With over three million registered units worldwide in 2017 [1], driven by their own improving competitiveness over conventional powertrains and incremental government support, the market share of plug-in electric vehicles (PEVs) is expected to grow further. By 2030 the projected number of light-duty vehicles ranges from 125 to 220 million [1]. If uncoordinated, the charging of PEVs, which include both plug-in hybrid (PHEV) and battery electric vehicles (BEV), may pose major technical and operational challenges that could compromise the stability and reliability of low voltage distribution networks [2,3].
Among those challenges, thermal congestions are one of the most severe. The overloading of the main network assets, namely, distribution transformers and head feeders, due to a prolonged exposure to operational currents above their thermal limits, may result in overheating, asset deterioration, protection triggering and eventual risk of failure, compromising the normal operation of the network [4]. If coincident with peak domestic loads [3], PEV charging may result in significant thermal stress, especially in densely clustered residential networks with hundreds of customers, prone to experiencing network congestions [5,6].
The uncertainty and variability brought by the increasing share of distributed renewable energy resources combined with the current digitalization of power systems are driving DSOs to seek active management based solutions [5] as substitutions for traditional, expensive grid reinforcements and network expansions, only required to face peak loads a few hours per year [7]. Consequently an active control of the charging demand of PEVs could help prevent, delay or substitute network reinforcements and expansions [8], mitigating their impacts while complying with the needs of the drivers.
Many charging management strategies have been proposed to address the thermal impacts caused by PEVs on distribution systems based on limiting their charging rates according to the measured or foreseen state of the network. Optimal coordinated charging between all cars in order to mitigate network congestions can be achieved through centralized control architectures, while at the same time exploiting their charging flexibility to satisfy different objectives, such as minimizing system losses [9], curtailing costs for DSOs [5] and maximizing user comfort [3], among others. Centralized control schemes are better suited for the application of optimization algorithms, as all required information will be available at a central unit facilitating the management of distribution networks and the provision of supplementary services [8]. However, as highlighted in [3], many of these solutions propose complex optimization strategies which face major practical barriers related to ICT and computational costs, and large network, PEV and market data requirements. This makes their adoption unfeasible in the short-term and mid-term.
To overcome this, the authors in [10] focused on developing a tradeoff between the complexity of a market-based control and the simplicity of a price-based control. On the other hand, combining the two aspects can make the algorithm difficult to be understood. Their algorithm solves network congestions efficiently, but still needs testing on real hardware. In [11] Shao et al. introduced a centralized method to relieve congestions on the transmission level. While the proposed algorithm performs well, it could be relatively heavy to calculate in a realistic implementation. It is a generally recognized fact that EVs have a minor impact on the power transmission network, since the bottlenecks are mostly local. Including aspects of the transmission level in the algorithm increases the complexity of the problem, but may not pay back.
The study presented in [12] tackled the computational costs with a probabilistically-based method. Instead of calculating all relevant parameters for each control step, the method relies on the probability of whether a voltage or a thermal violation will happen or not. The results are clearly encouraging and a significant reduction in computation capacity was achieved. The disadvantage of the EV control system is that it requires a significant amount of data from the network, which is not always easily available. The study also makes a clear contribution to probability-based control methods in smart grids in general. Although congestion management is a secondary product of the algorithm presented in [13], it is an important feature. The authors developed a charging protocol that takes into account possible congestions and voltage violations. However, the performance of the algorithm regarding congestions and voltage violations was not discussed in detail. One major advantage of this decentralized strategy is the high efficiency in comparison with other similar algorithms. The method has many advantages and the function should still be tested on commercial charging infrastructure. As in [12,13], and in [14], the constraints of voltage and congestions are controlled indirectly through PEVs. The authors present a relatively complex algorithm, but while still taking the fairness and customer satisfaction into account, which is highly recommendable with a view toward commercial applications and is not overstated in the scientific literature. Combining all this into one algorithm can make the algorithm difficult to be understood. The compatibility of the algorithm with the current charging standards is not discussed.
The study in [15] focused on the coordination of the charging of PEVs together with photovoltaic power generators. The algorithm clearly improves voltage quality, but the most important limitation is that it works only in areas with very high penetration of distributed photovoltaic power. In [16], the authors not only focus on PEVs but take a more holistic approach by coordinating the charging of PEVs together with on-load tap changers, voltage regulators and capacitor banks in order to improve voltage profiles and decrease network losses. The algorithm is efficient; however, the paper does not discuss practical aspects of the implementation, which might be very complex. Likewise, the work in [17] sought to perform voltage control through not only PEVs but also by using on-load tap changers and capacitors in low and medium voltage networks. As said complicated control algorithm grows into a very complex one easily, practical aspects regarding its real implementation should be discussed. The topology of the innovative four-quadrant charging stations employed in [17] is further examined in more detailed in [18]. Additionally, the study in [19] examined voltage control through PEVs in coordination with an on-load tap changer. The work focused on microgrid applications. A fundamental distinctness compared with most studies is that it also considered economic metrics and impacts. In [20] the concept of smart loads to relieve voltage issues caused by the charge of PEVs is discussed. The approach presented is able to correct short-term voltage problems, so other means, such as an on-load tap changer, are necessary to make voltage corrections during longer time periods. However, the idea in [20] seems to offer another fruitful branch of research considering the integration of PEVs to low voltage networks. Another promising trend is to study a stationary battery energy storage option together with a PEV charging station in order to make the operation of the battery lighter from the network viewpoint. Different aspects of such implementations are discussed in [21,22,23]. Even though energy storage systems are not further discussed in this paper, it is still important to recognize them as a possible solution in the future.
In contrast, a simple droop-based controller for the provision of multiple ancillary services, including network congestions, was proposed and validated in [24]. The authors pointed out the overall lack of field validation of the suggested controls in the current literature. This topic was the focal point in [25], wherein it was successfully demonstrated that autonomous droop controllers can support network voltage in practice, even in relatively severe situations. Unlike many others, this study improved the state-of-the-art in experimental testing. The work in [26] introduced a charging strategy with similar objectives as the one in [25], considering voltage and thermal limits of the network based on droop control. In addition to positive results, the authors discussed the limitations of the communications, which is a crucial aspect in commercial implementations. An important difference with the work in [25] is that the research in [26] has a strong focus on microgrid applications. Additionally, an interesting charging strategy considering network congestions is presented in [27]. The strategy is more straightforward than the ones presented in [25,26]; while it does modulate the charging of PEVs, it only does so by enabling or disabling the charging current and does not consider voltage constraints. Due to the discrete switching of the EVs, the algorithm is quite rough and may result in an oscillating behavior at large charging sites. This aspect was not discussed. However, the method was tested on commercial PEVs.
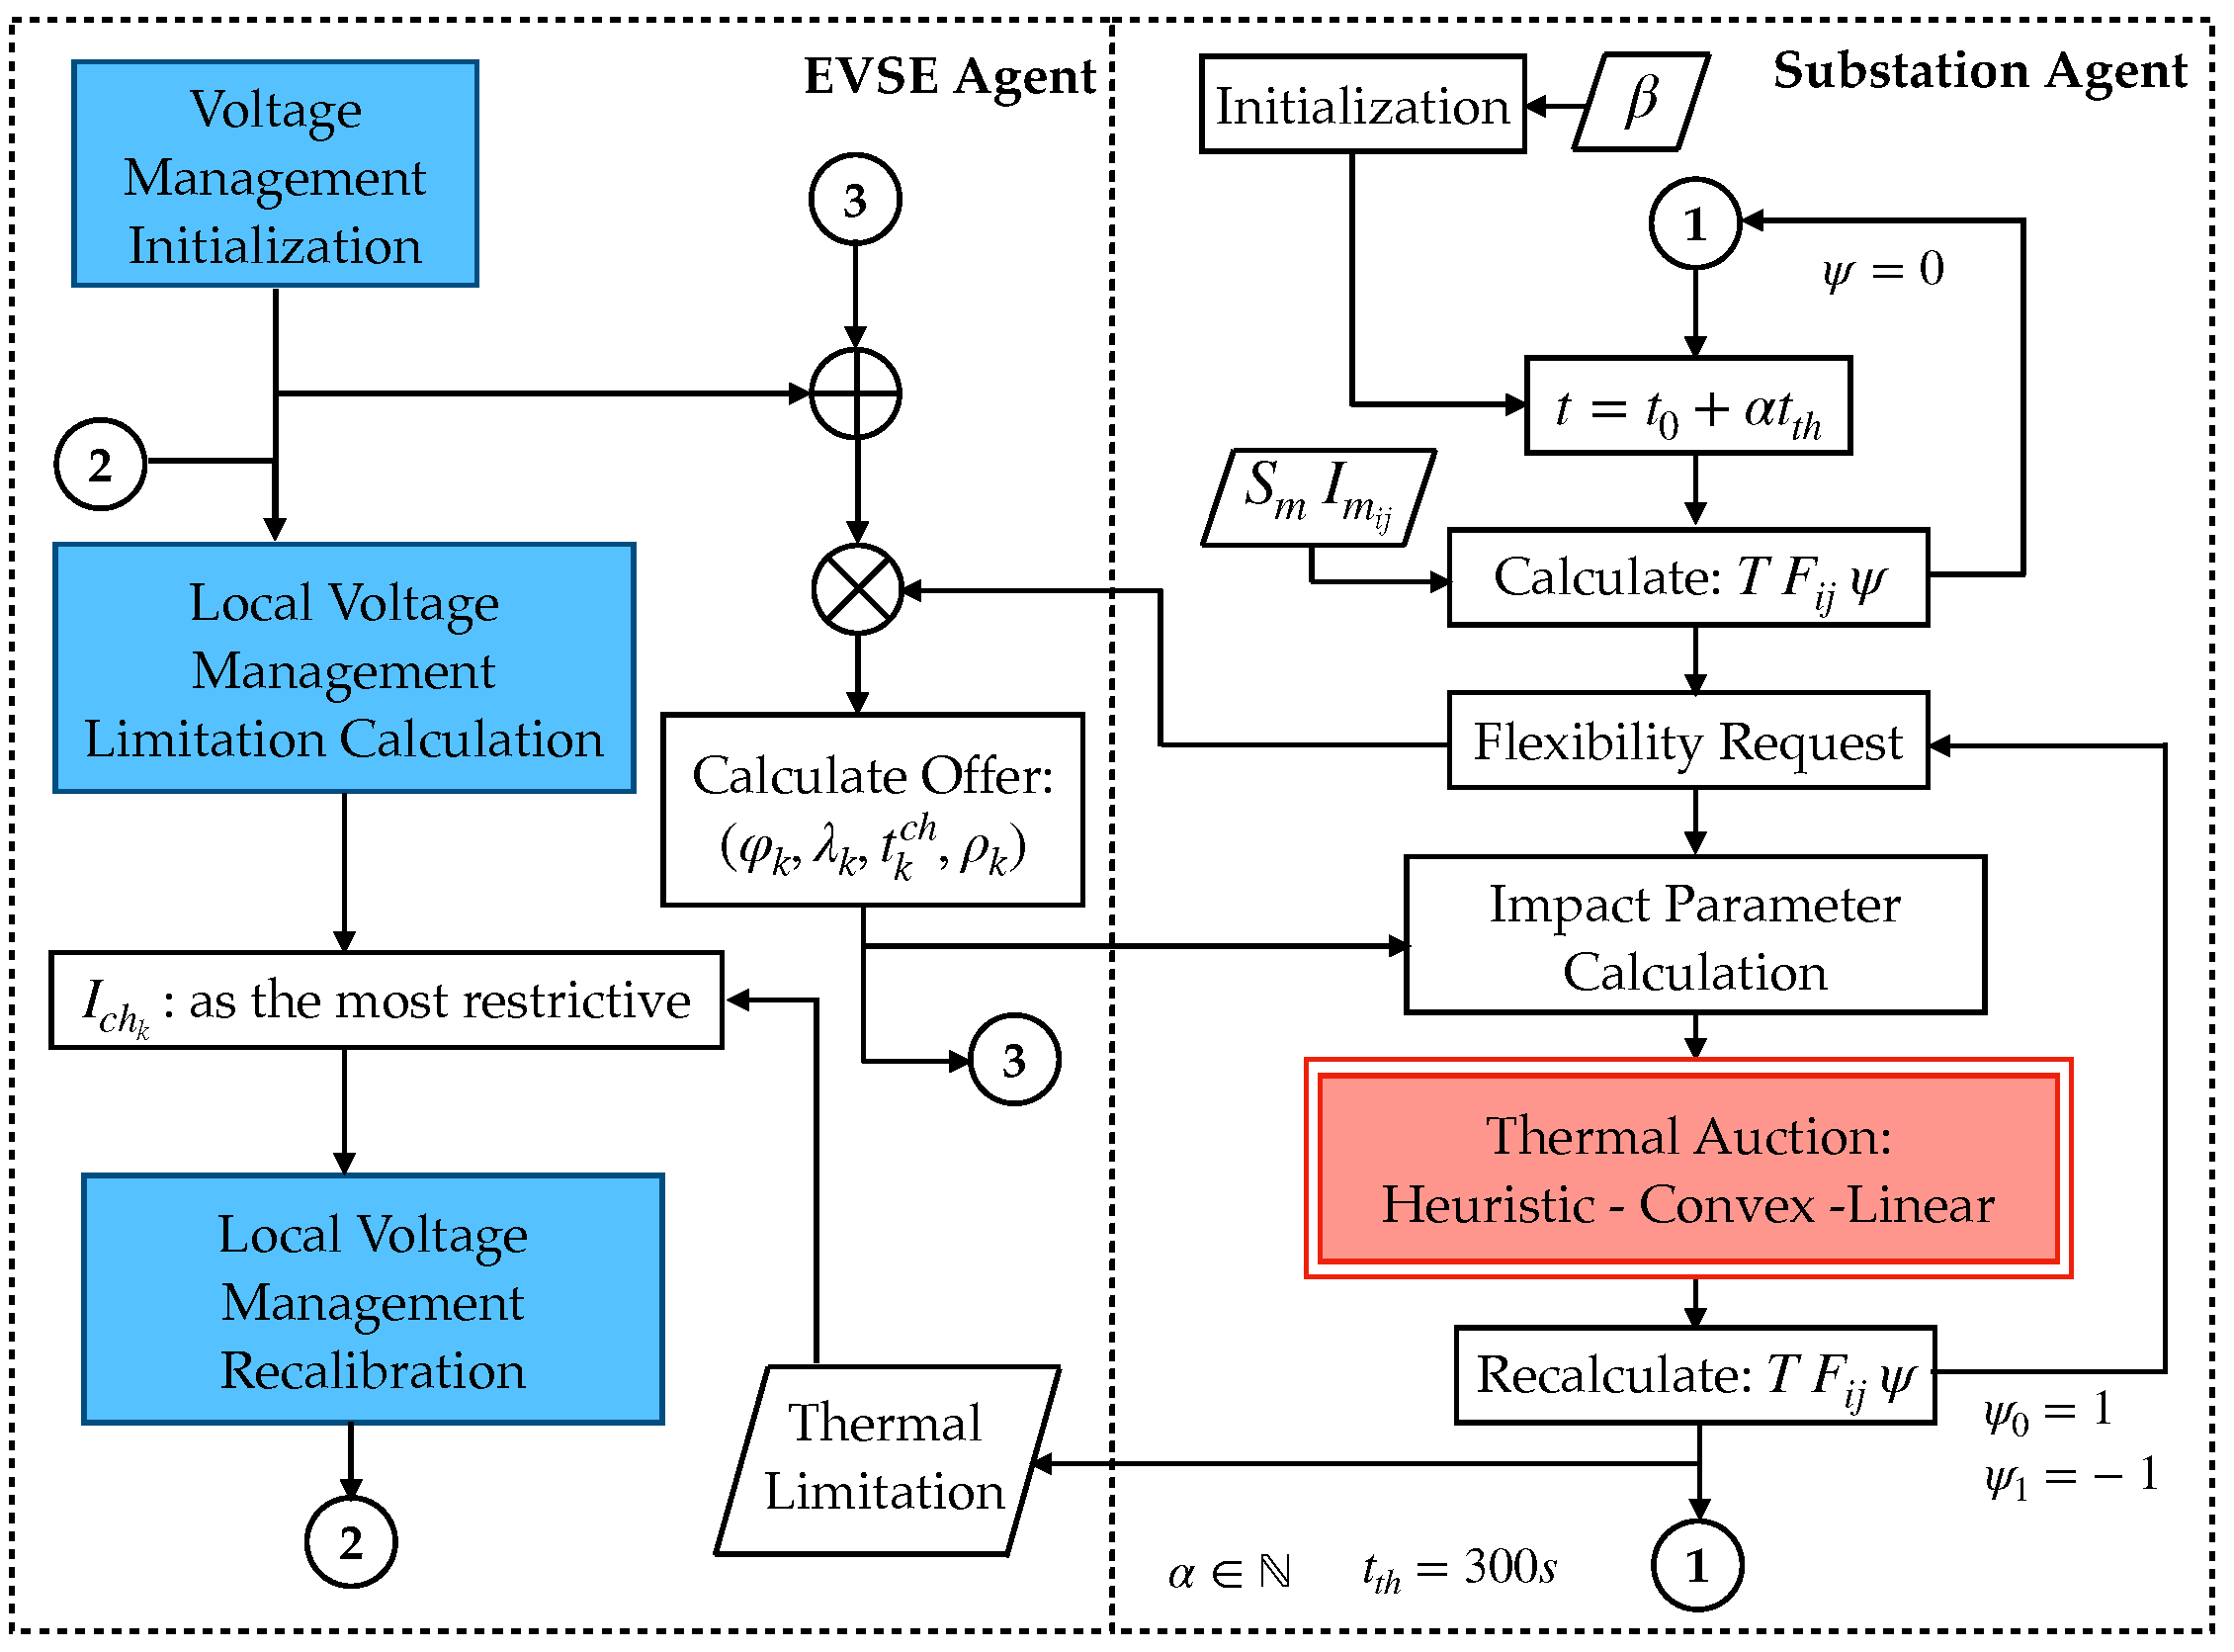
To address these issues, a real-time agent-based charge control algorithm designed to mitigate the impacts of uncontrolled domestic Mode 3 AC charging on radial distribution networks was presented and validated through hardware-in-the-loop (HIL) simulations in [28]. Due to employing centralized flexibility-offer-based congestion management designed to minimize the impact on car owners and combining that with a decentralized sensitivity-based nodal voltage control, its formulation and architecture were conceived to require a minimal infrastructural deployment for its operation.
The current work is intended to serve as a continuation of the foundations laid in [28]. This paper proposes two novel problem formulations, linear and convex, to replace the the current heuristic thermal management of the charge control algorithm described in [28]. Additionally, the performances and levels of effectiveness of both approaches are evaluated and compared with each other and with the existing one. The new suggested problem formulations are also conceived to minimize the total impact upon car owners and designed to serve as a complete replacement of the current thermal management. This means guaranteeing full compatibility with the architecture and operation of the algorithm, and coordination with the local voltage management. Moreover, no additional data are required for their execution, ensuring the same minimal infrastructural deployment is needed for the operation of the charge control algorithm, solely requiring once again controllable charging stations (EVSE), communication links and strategically allocated sensors across the network [28].
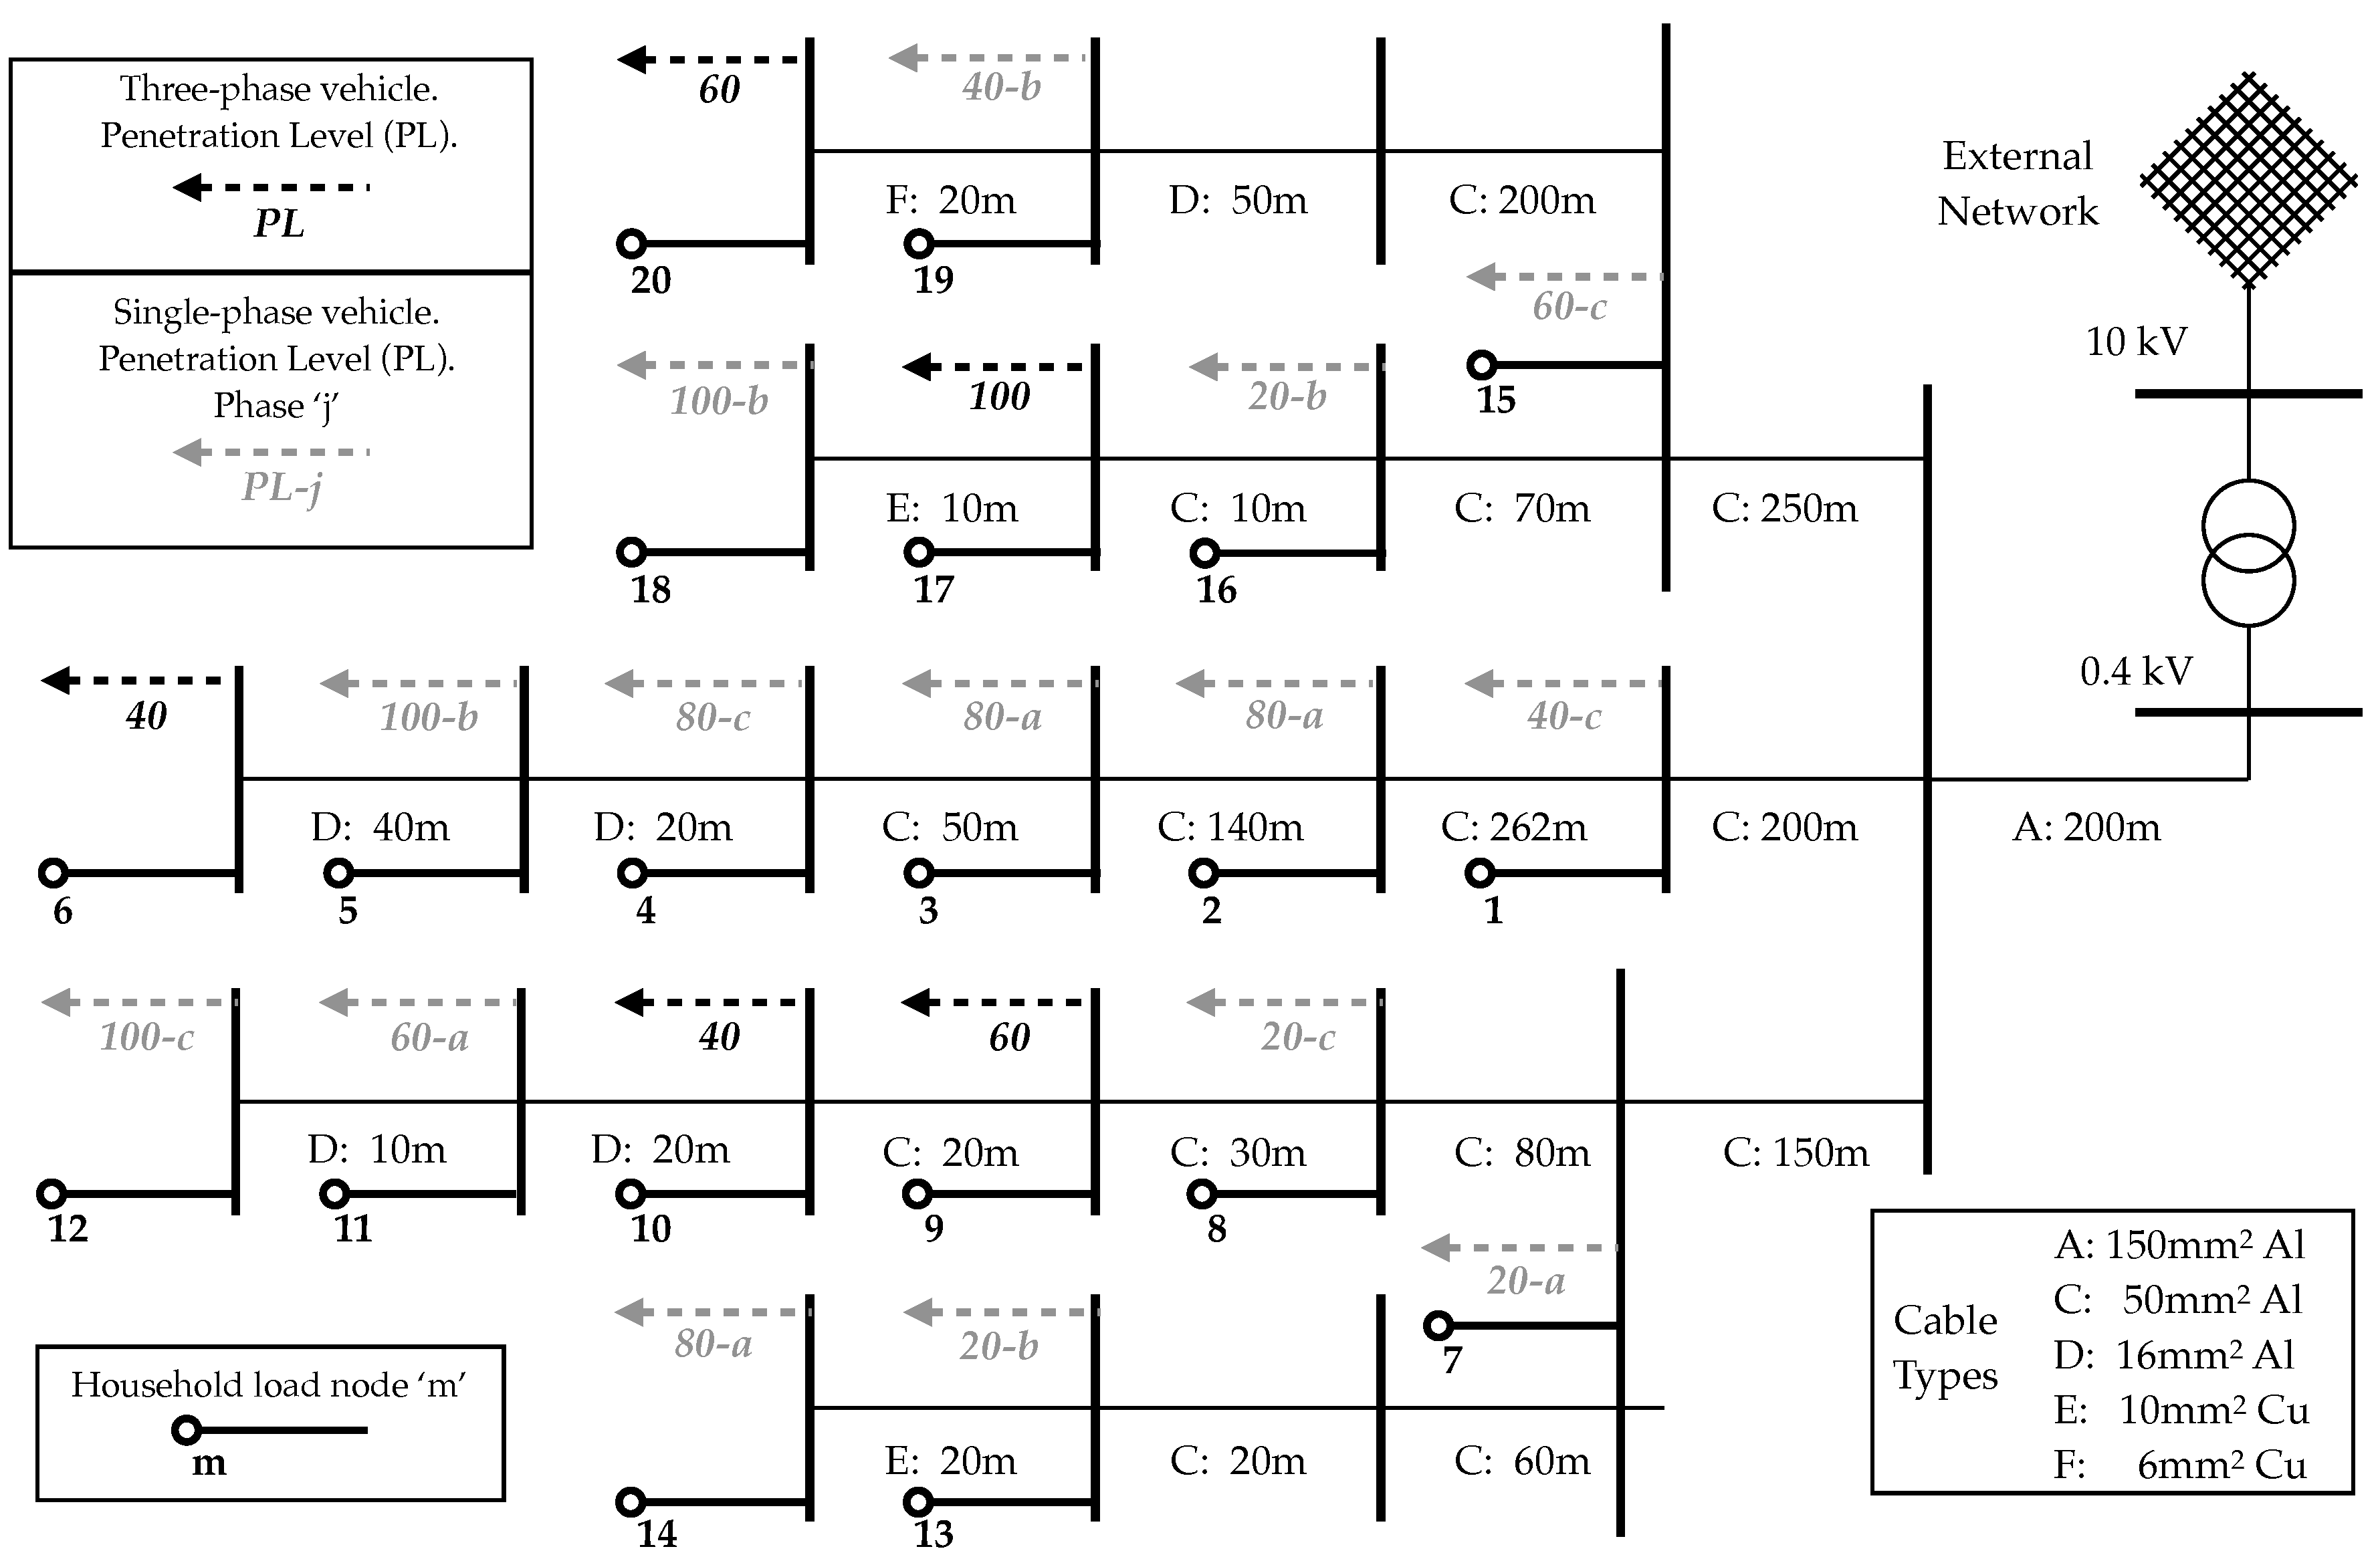
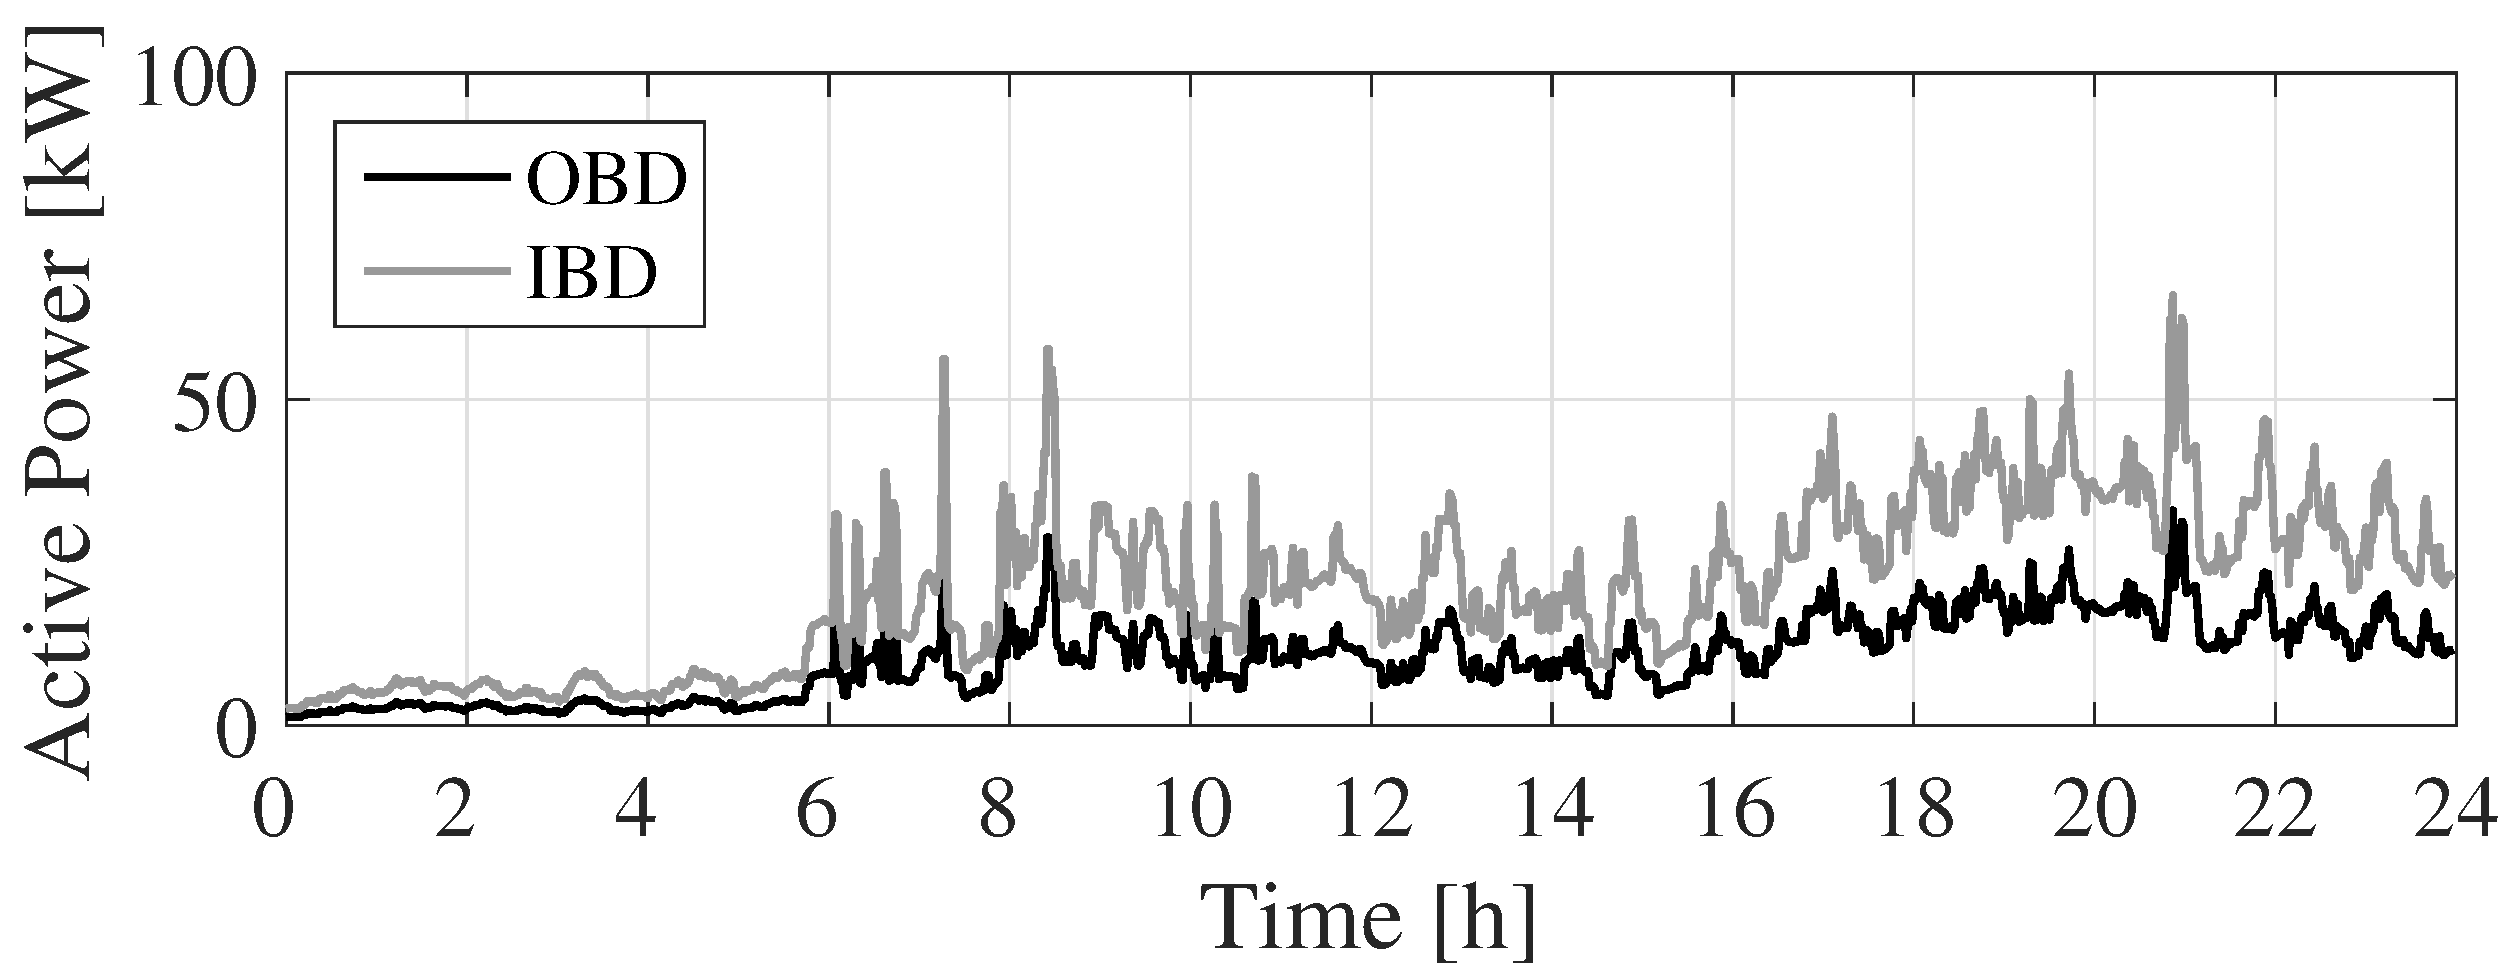
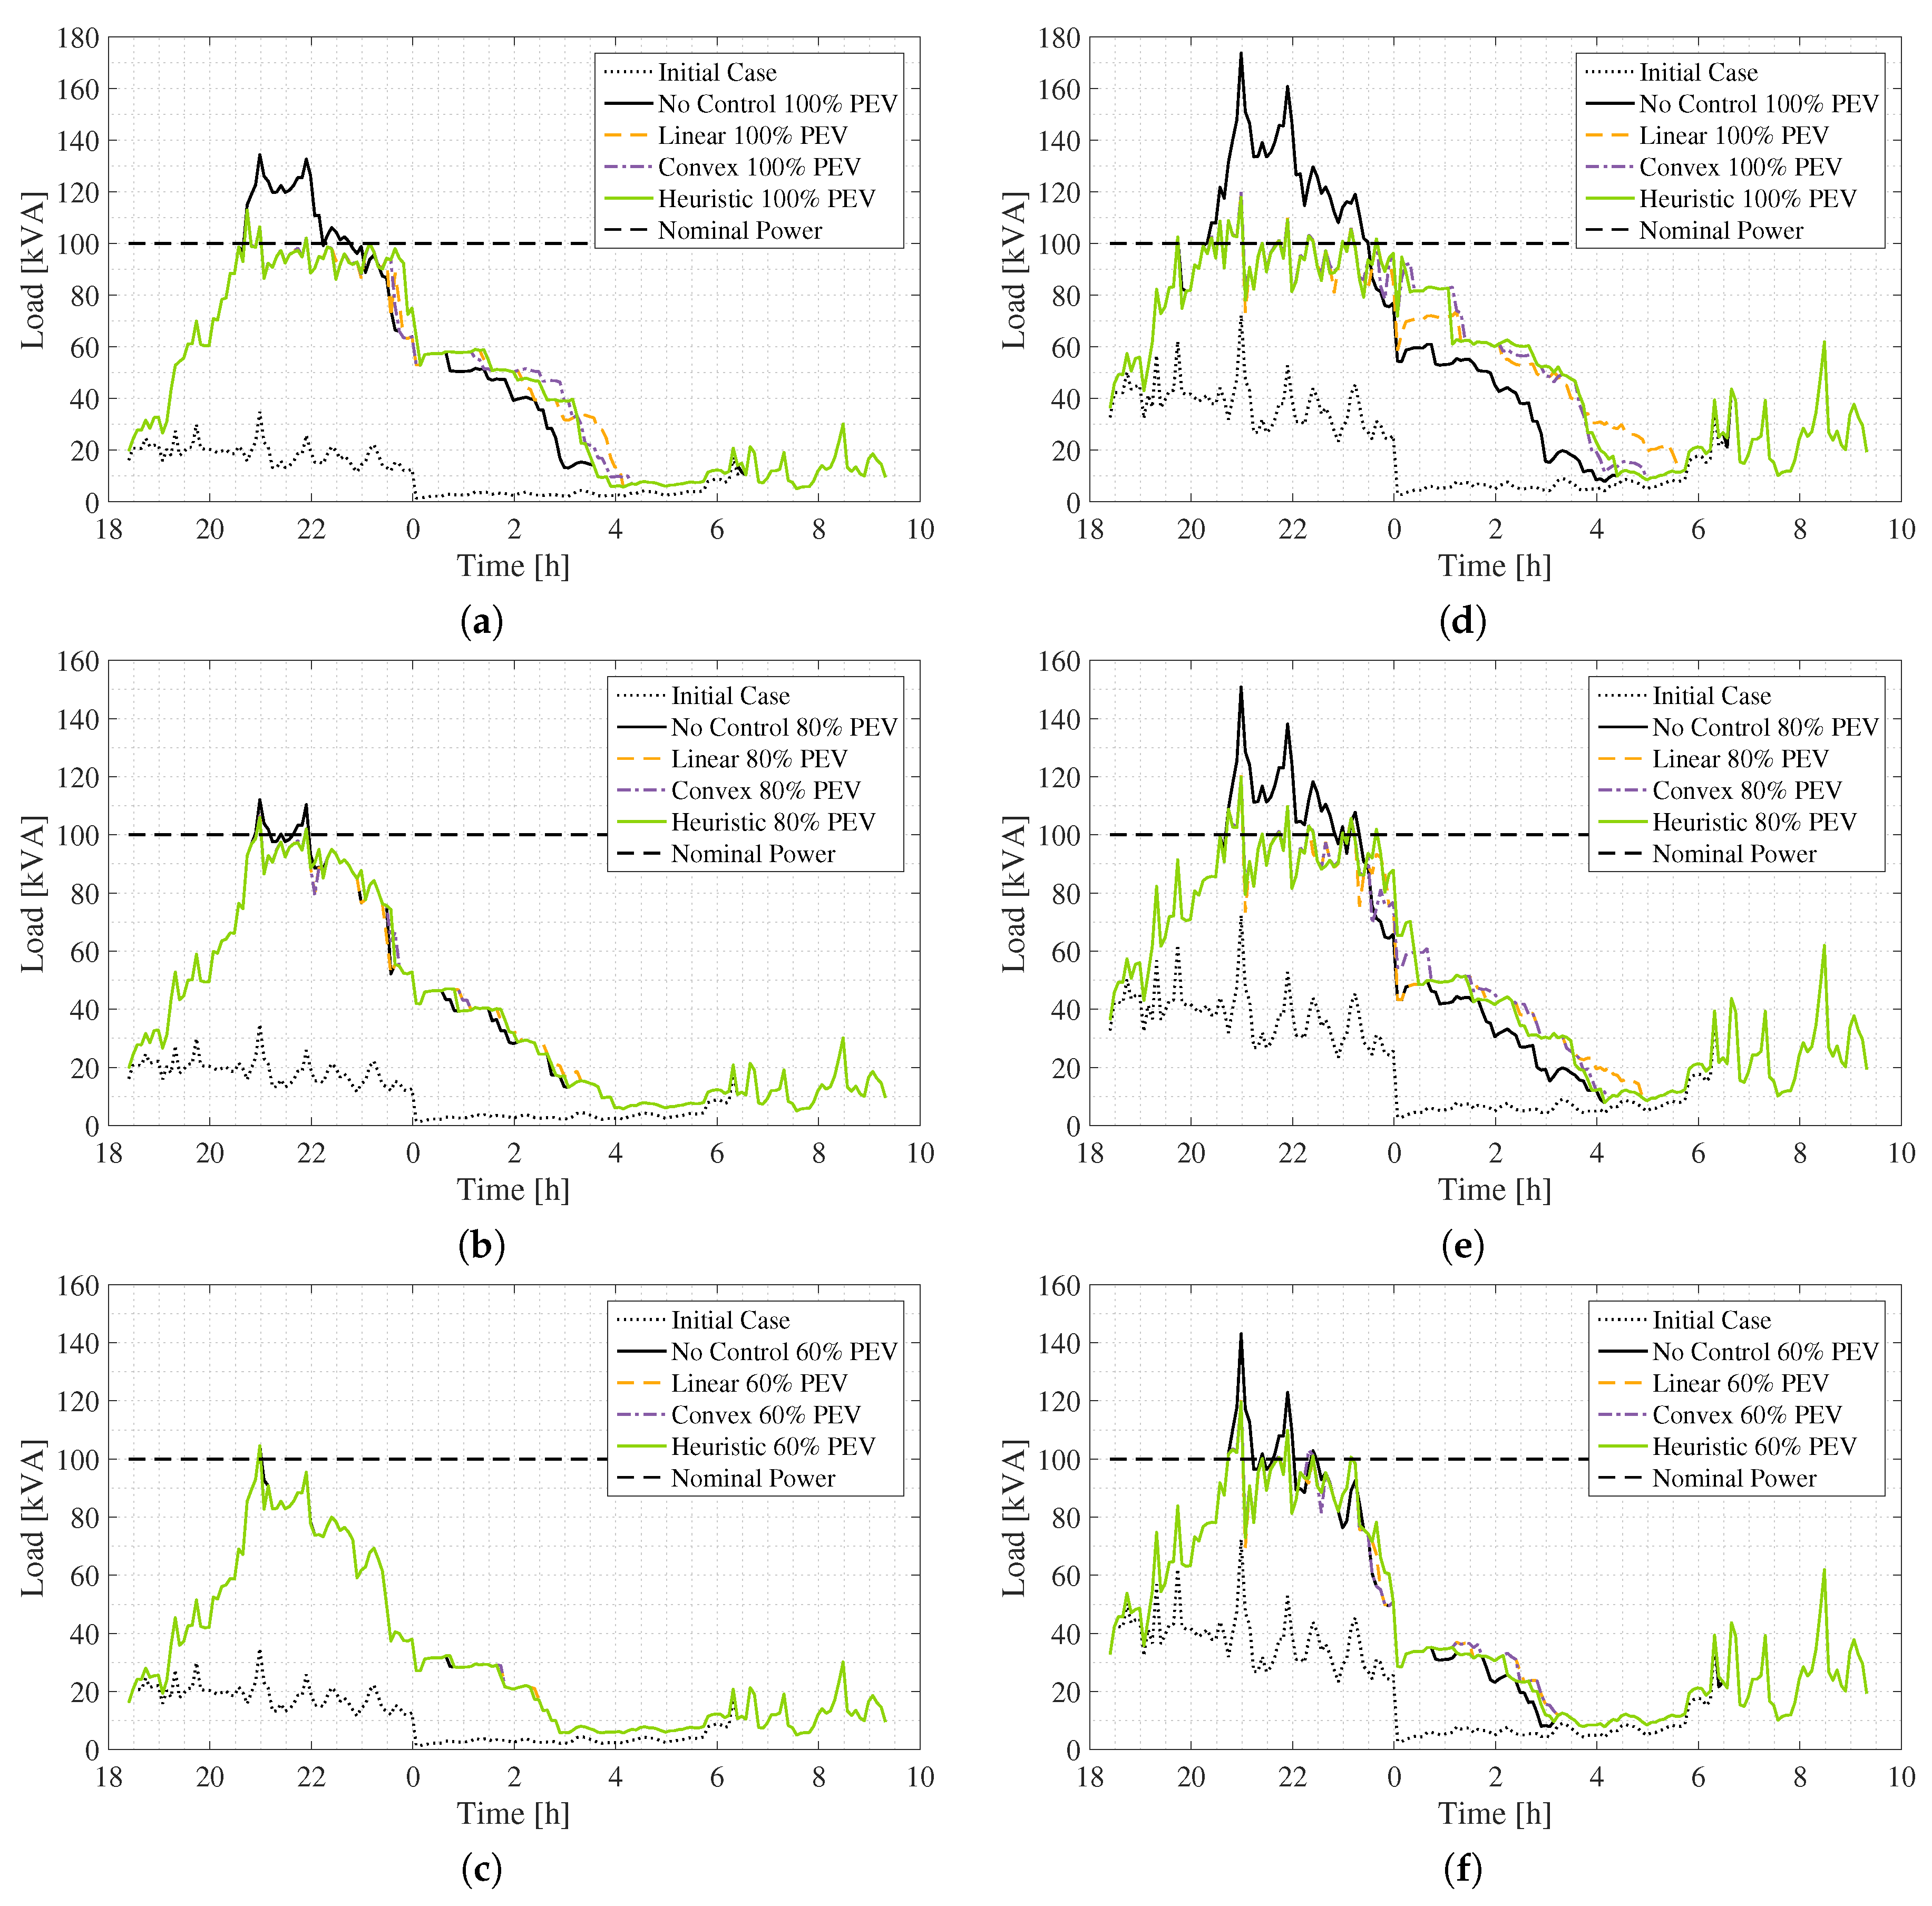
A complete set of night charging episodes under increasing PEV penetrations were tested on a residential low voltage (LV) grid facing comprehensively severe conditions, given by two peak winter domestic demand scenarios and a low initial state of charge (SOC) for all vehicles. To assess the effectiveness of all three thermal implementations, their execution times and the final share of PEV owners who achieved a final acceptable SOC were weighted against their capacity to mitigate the registered network impacts for the uncontrolled and controlled charging scenarios. Moreover, to clearly evaluate the different formulations, the execution of the algorithm was solely limited to the central thermal control, disabling the local voltage management.
The contributions of this paper are:
  • Two novel problem formulations for the congestion management of the charge control algorithm described in [28]. These offer support for the same features as the original formulation:
    • Support for 1-phase AC and 3-phase AC Mode 3 domestic charging.
    • Support for the current charging standard IEC 61851-1 [29].
  • The formulation of constraints and objective functions (linear and convex) compatible with the same minimal data availability and infrastructural deployment for their operation, as in [28].
  • A comparative evaluation between them and the existing one in terms of their performance and effectiveness under comprehensively severe testing conditions.
The paper is organized as follows. Section 2 introduces the two alternative thermal management formulations for the algorithm in [28], linear and convex. Section 3 describes the simulation environment and the considered study cases. The main results showcasing and comparing the performances of all implementations are presented and discussed in Section 4. Finally, the main conclusions from the study are drawn in Section 5. Nomenclature is provided in Table 1.

2. Thermal Implementations

In this section a detailed mathematical description of the two alternative problem formulations designed to substitute the current heuristic methodology employed by the charge control algorithm described in [28] is proposed. A brief overview of the auction-based centralized thermal management presented in [28] is followed by the problem formulations employed for the charge increase and charge decrease auctions. A detailed description of the heuristic methodology can be found in [28].

2.1. Thermal Management Overview

The thermal management employed in [28] has been designed to allow each car to charge at the maximum plausible rate so that the loading of the distribution transformer and the loading of the head feeders are kept below 95% of their rated capacities. This narrow security margin ( β = 5 % ) is used to guarantee adequate control. Given a radial topology with n feeders, the loading of the assets is monitored using the loading factors, defined for the distribution transformer (T) and phase j of feeder i ( F i j ) as:
{ T = S m ( 1 β ) S r ( 1 a ) F i j = I m i j ( 1 β ) I r i j i = 1 , n ; j = a , b , c ( 1 b )
where S m and S r are the measured and rated powers of the transformer; I m i j and I r i j are the corresponding measured and rated loading currents for phase j of feeder i.
Based on their values, a decision parameter ψ is employed to determine the need to call for a charge increase ( ψ = 1 ), decrease ( ψ = 1 ) or no thermal management auction ( ψ = 0 ) at all. When requested, all participating vehicles submit flexibility offers containing their maximum current bid ( φ k ), bid division ( λ k ), cumulative charging time ( t k c h ) and lastly, a charge characteristics parameter ( ρ k ) which identifies whether a 3-phase AC ( ρ k = 4 ) or 1-phase AC ( ρ k = [ 1 , 2 , 3 ] respectively for phases [a,b,c]) charge is taking place. If different network assets require different courses of action, a charge increase auction is launched first. Once it concludes and within the same control cycle, a charge decrease auction follows to correct the required congestions.
Once each offer is received, based on its feeder of origin τ k , its impact parameters m i j k 1 P h and m i k 3 P h are determined. These describe how each car affects the network assets, indicating whether vehicle k affects phase j of the feeder i, for 1-phase AC charging, or all phases of feeder i, for 3-phase AC charging. All vehicles affect the transformer in radial topologies. The definitions of the decision parameter ψ , the flexibility offers and the impact parameters are presented respectively within Equations (2)–(4) and Table 2, where I c h k and I m a x k represent, respectively, the present and the maximum charging rate of the station (the minimum rate is equal to 6 A). A more detailed description can be consulted in [28].
ψ = 1 , if T > 0 or [ T < 0 and all ( F i j 0 ) ] 1 , elseif any ( F i j < 0 )   &   T < 0 0 , else i = 1 , n ; j = a , b , c
φ k = I m a x k I c h k , I c h k 6 6 , I c h k < 6 ψ = 1
φ k = I c h k 6 , I c h k > 6 6 , I c h k = 6 ψ = 1
λ k = 1 , I c h k 6 6 , I c h k < 6 ψ = 1
λ k = 1 , I c h k > 6 6 , I c h k = 6 ψ = 1
After collecting the flexibility offers from all participating vehicles, this information is then used to launch the thermal auctions and determine the necessary degree of participation from each car in order to perform the required network management and minimize the total impact on the owners. The participation of each vehicle k is measured by its participation factor ( x k ) which indicates the total number of bidding units taken from its complete flexibility offer, ranging from no contribution ( x k = 0 ) to full participation ( x k = φ k / λ k ). When the auction concludes, the charging rates of the vehicles are adjusted based on their resulting participation.
A simplified flowchart highlighting the integration of the different thermal variants within the logic of the algorithm is presented in Figure 1. For simplification purposes and since the objective of this paper is to draw a comparison between the three thermal formualtions, only those processes involved in the thermal management are shown in detail. The control flows associated with the local voltage management and further details regarding the complete structure and control logic can be found in [28].

2.2. Problem Formulation: Charge Decrease Auction

As in [28] the charge decrease auction is executed in two stages. A first optimization seeking to correct all congestion from both the head feeders and their phases is followed, if needed, by a second one aimed at alleviating all remaining congestion that could still affect the distribution transformer. Said structure is used to avoid duplicities since all congestion may already be corrected solely acting on the head feeders. Mathematically, the linear and convex formulations of the first optimization problem managing congestion affecting the head feeders are given by:
{ minimize : k = 1 λ k x k t k c h Linear ( 5 a ) minimize : k = 1 λ k x k t k c h σ ( x 1 , x 2 , , x ) + 1 Convex ( 5 b )
subject   to : i = 1 , n ; j = ( a , b , c )
F i j Σ k = 1 λ k x k ( m i j k 1 P h + m i k 3 P h ) 0 if F i j 0
0 Σ k = 1 λ k x k m i j k 1 P h 0 if F i j < 0
0 x k φ k / λ k
for k = 1,..., , with referring to the total number of participating vehicles. Both problem formulations, linear and convex, posses the same constraints, but differ in their objective functions formulated respectively in Equations (5a) and (5b), thereby entailing different corrective courses of action. The same applies for all thermal auctions.
Although both implementations seek to minimize the total impact on the users by prioritizing those cars with the higher cumulative charging times, the way their contribution is selected changes. While the linear formulation always forces the maximum participation of the car with the highest charging time before the next in line can contribute, a more equitable approach, like the one used by the heuristic resolution [28], is favored by the convex implementation. This is accomplished dividing the linear objective function by the standard deviation of all participation factors σ ( x 1 , x 2 , , x ) . Adding one unit to the denominator forces the convexity of the problem and favors the full correction of the network issues over identical car participation solutions ( x 1 = x 2 = = x ) . The linear problem is solved by means of integer linear programming, while the solution for the convex optimization is calculated by means of a genetic algorithm starting with an initial population given by x k = 0 .
For the current feeder congestion optimization, a distinction between which feeders and phases require corrective measures is made when formulating the constraints, as shown by Equations (6a) and (6b). If no action is necessary on phase j of feeder i, as indicated by its loading factor (Equation (6b)), the constraint is formulated so no participation will result from those vehicles relying on 1-phase AC charging connected to it. This does not apply to vehicles using 3-phase AC charging, as they could also be affecting other congested phases.
The obtained solution, consisting of the participation factors for each vehicle ( x k 1 s t ), is then used to reevaluate the loading of the transformer as indicated in Equation (7). Here V t represents the nominal voltage at the transformer and the parameter ζ k , defined in Equation (8), is used to indicate how each vehicle affects the transformer based on its charging characteristics.
T = T V t Σ k = 1 λ k x k 1 s t ζ k
ζ k = 1 if ρ k < 4 3 if ρ k = 4
If congestion still affects the transformer ( T > 0 ), a second optimization is launched. Mathematically the objective functions for both formulations are given respectively, once again, by Equations (5a) and (5b), combined with the following constraints:
minimize : Equation ( 5 a ) Equation ( 5 b )
subject   to : i = 1 , n ; j = ( a , b , c )
T V t Σ k = 1 λ k x k ζ k 0
0 x k φ k / λ k x k 1 s t
As indicated by Equation (9b), for the second optimization, the participation of each vehicle is limited already by its previous contribution during the feeder management. The final value for each car x k f can be determined as follows, depending on whether two optimizations or just one optimization are executed:
x k f = x k 1 s t + x k 2 n d if T > 0 x k 1 s t else

2.3. Problem Formulation: Charge Increase Auction

Following the same structure proposed in [28] a single optimization is used for the charge increase auction considering both the capacities of the head feeders and the distribution transformer. Mathematically the objective functions for both formulations are given, respectively, once again, by Equations (5a) and (5b), combined with the following constraints:
minimize : Equation ( 5 a ) Equation ( 5 b )
subject   to : i = 1 , n ; j = ( a , b , c )
T + V t Σ k = 1 λ k x k ζ k 0
F i j + Σ k = 1 λ k x k ( m i j k 1 P h + m i k 3 P h ) 0 if F i j < 0
0 + Σ k = 1 λ k x k ( m i j k 1 P h + m i k 3 P h ) 0 if F i j 0
0 x k φ k / λ k
As was the case for the first charge decrease auction, different constraints are formulated depending on which feeders and phases allow for rate increases of the corresponding vehicles (Equations (11b) and (11c)). Likewise, to preserve the integrity of all network assets, once again restrictive conditions have been established for the charge increase auction. If to decrease the rate of a vehicle using 3-phase AC charging the congestion of a single phase was enough, now it can only be increased if all three phases of the corresponding feeder allow it.

3. Simulation Environment and Case Studies

In this section the different case studies are presented together with the designed simulation environment.

3.1. Test Network

The same residential LV Dutch modified network topology employed in [28] was used in this work. The network, modeled using Simulink and its Simscape Power Systems Library [30], consists of a total of 20 individual households fed by power underground cables distributed among three main feeders supplied by a 10/0.4 kV, 100 kVA MV/LV transformer. All feeders have three-phases with three-phase customer connection points. The allocation of the existing dwellings and the different cable sections, and the distribution of the different PEVs within the network can be found in Figure 2. Its main electrical characteristics are summarized in Table 3.
As shown in [28], the considered network was found to experience voltage violations ahead of thermal congestions, with critical vehicle penetration levels at 60% and 100% respectively. Therefore, to avoid a predominantly voltage-governed network management and to expose the differences between the different thermal implementations, the local voltage control was disabled and the impacts over the network voltage profile were disregarded. The scope of the present work focuses on evaluating the performances of the thermal implementations. The combined results of the voltage and thermal managements for the heuristic implementation can be found in [28].

3.2. Domestic Load Profiles

The same characterization of the uncontrolled domestic demand employed in [28] was used in this work. Through the CREST tool [31] 20 random individual domestic load profiles were generated based on a typical weekday during winter in Dortmund. The individual profiles, indicating the net active power demand of each household in kW, were then assigned a random inductive power factor between 0.9 and 0.95. Winter conditions were considered to account for the maximum uncontrolled demand and thus the hardest base load conditions.
As no significant thermal violations were found in [28] below a full vehicle penetration, an additional unrealistic future increased base demand (IBD) scenario was considered to achieve a deeper comparison between the three proposed implementations. This scenario was defined as doubling the current original uncontrolled domestic base demand (OBD) in order to put additional thermal stress on the network. The combined net active power aggregated demand of all households for the OBD and IBD scenarios is shown in Figure 3.

3.3. PEV Demand

The same type, amount, allocation, penetration, grid connection, charge characteristics, charger and battery model, initial SOC and arrival and departure times employed in [28] were used in this work to model the PEV demand. All vehicles were modeled after the two commercially mass-produced cars: a Nissan Leaf and a BMW i3. Their technical characteristics are compiled and summarized in Table 4. As in [28], the scope of this study only accounts for 1-phase and 3-phase mode 3 AC domestic charging compliant with the IEC 61851-1 standard [29], with all households possessing commercial charging stations supporting a maximum phase current of 16 A, effectively limiting the maximum charging rate of both vehicles respectively to 3.7 kW and 11 kW. A maximum of 20 vehicles, 15 Nissan Leafs and 5 BMW i3s, were again considered and assigned to the different households. The vehicles were equally distributed across five incremental penetration levels, ranging from 20% to 100%, and defined as the fraction of total households possessing at least one electric vehicle. Likewise all vehicles had to achieve a final charge level of at least 85% overnight to be considered impact free. This was found to be the average SOC most danish drivers started their trips with every day, based on an analysis of their driving patterns [32].
Even if the control algorithm does not rely on the SOC of the vehicles, a battery model must be employed for simulation purposes in order to halt the charging process once the battery reaches full charge. For comparison purposes the same exact model employed in [28] was used. The formulation is based on the charging rate model presented in [33], where it was shown to offer faster computational times and compatibility with multiple battery technologies. Furthermore, compared to a classic simplified equivalent circuit model applied to a LiFePO4 cell of known parameterization, it only exhibited less than 1% deviation. Even though more representative network impacts could be achieved through a more complex battery modeling, neither the capacity of the controls to perform an effective management nor the results of the comparison between thermal implementations should be affected by the model of choice if the same one is used for all cases.
As in [28], the model has been further expanded to additionally consider both the performance of the on-board charger (OBC) and the charge–discharge efficiency of lithium-ion batteries. For the latter a 97% value was chosen based on the experimental findings in [34]. Its mathematical description is presented in Equations (12) and (13).
S O C k ( t ) = S O C k ( t 0 ) + η o b c k η b a t k C n k V b a t k 3600 ι = 1 α P c h k ( γ ) t Δ γ = ( ι 1 ) t Δ + t 0 t = α t Δ + t 0 ; α N
P c h k ( γ ) = Re [ V i ( γ ) I c h k ( γ ) ] , ρ k < 4 Re [ V i j ( γ ) I c h k j ( γ ) ] , ρ k = 4 j = a , b , c
where S O C k ( t ) represents the SOC of the vehicle k at an instant t and is expressed as a function of its SOC at a prior instant ( t 0 ) α simulation time steps behind, plus its variation over that time period. The change in SOC experienced by vehicle k is calculated based the capacity of its battery ( C n ) in Amp hours, its rated voltage ( V b a t ) in Volts, its charge–discharge efficiency ( η b a t ), the simulation time step in seconds ( t Δ ), the performance of the OBC ( η o b c k ) and the cumulative charging powers within the studied period. The charging powers ( P c h k ( γ ) ) at every simulated step ( γ ) are calculated based on the respective complex nodal voltages V i j ( γ ) and conjugate charging rates of each vehicle I c h k j ( γ ) , k, located at node i. In the case of 1-phase AC charging the corresponding phase voltage j is used to compute the charging power, while for 3-phase AC all phase voltages must be considered.
The current drawn by each vehicle is determined by the behavior of its OBC, which rectifies the network signal from AC to DC to charge the battery. At the same time, it reduces its harmonic injection and corrects the resulting power factor [35]. As in [28], a simplified model was built on Simulink to account for the resulting charging impacts of the vehicles on the analyzed network. The model employs the obtained charging current RMS setpoints to multiply a set of unitary sinusoidal waves calculated using a PLL (phase-locked loop) measuring the corresponding nodal voltages at each location. The resulting waves are then fed to controlled current sources connected at each respective node.

3.4. Case Studies

To quantify the progressive network impacts caused by PEVs and to assess the effectiveness of the different thermal formulations, the following case studies were considered:
  • Uncontrolled charging—OBD
    Network behavior resulting from the increasing penetration levels of PEVs (20%, 40%, 60%, 80% and 100% respectively) without any control action taken to restrict their charging process was considered under original uncontrolled domestic base demand conditions.
  • Controlled charging—OBD
    Network behavior resulting from the increased penetration levels of PEVs (20%, 40%, 60%, 80% and 100% respectively) with their charging process managed according to thermal limitations for the three proposed alternatives was evaluated under original uncontrolled domestic base demand conditions. All vehicles were considered to actively participate in network management.
  • Uncontrolled charging—IBD
    Network behavior resulting from the increasing penetration levels of PEVs (20%, 40%, 60%, 80% and 100% respectively) without any control action taken to restrict their charging process was considered under increased uncontrolled domestic base demand conditions.
  • Controlled charging—IBD
    Network behavior resulting from the increasing penetration levels of PEVs (20%, 40%, 60%, 80% and 100% respectively) with their charging process managed according to thermal limitations for the three proposed alternatives was evaluated under increased uncontrolled domestic base demand conditions. All vehicles were considered to actively participate in network management.
All case studies were run entirely within Simulink. The network, domestic demands and PEV demands are modeled using the Simscape Power Systems Library, and the control optimizations were implemented using MATLAB functions and were directly interfaced with the network model using the MATLAB function block within Simulink. The linear and convex formulations were solved respectively by means of the “intilinprog” and “ga” optimization toolboxes within MATLAB. The required computational times of the different implementations were evaluated by enclosing each corresponding code section with the “tic” and “toc” MATLAB functions.

4. Results and Discussion

In this section, the results of the three thermal implementations for the different considered case studies are presented and discussed. A comparison in terms of capacity to address network issues, total impact on the end-users and overall performance is presented.

4.1. Alleviation of Network Congestions

First, capacity to alleviate network congestions was analyzed. For all study cases the charging demand only caused a significant overloading on the distribution transformer, without exceeding the capacity of the head feeders. Thus, solely the impacts and corrective measures derived from the loading of the distribution transformer are presented and discussed.
The most relevant results for both the OBD and IBD scenarios are summarized respectively in Figure 4 and Table 5 and Table 6. Figure 4 depicts the loading profile of the distribution transformer over the complete simulation time frame for all thermal implementations considering the three highest PEV penetration levels: Figure 4a,d (100%), Figure 4b,e (80%) and Figure 4c,f (60%). These are compared among them and against their respective uncontrolled loading profiles while accounting for the rated capacity of the transformer and the base loading of the initial vehicle free network. Complementary Table 5 (OBD) and Table 6 (IBD) present the overall mean transformer loading over the complete simulation time frame together with its standard deviation for all uncontrolled and controlled charging scenarios and the three highest PEV penetration levels.
As shown in [28] an increasing number of PEVs results in a higher and more heterogeneous loading of the distribution transformer. This is indicated graphically by the loading profiles of the transformer in Figure 4 and by the a higher mean and standard deviation values of the transformer loading presented in Table 5 and Table 6. Moreover, as discussed in [28], a satisfactory controlled penetration of PEVs should result in lower load deviations while maintaining the average transformer loading. An equal average loading indicates that the same amount of energy has been transferred in the considered period, while the smaller load deviations indicates a less fluctuating and more stable overall charging demand.
For all considered scenarios, Figure 4 shows how all thermal implementations satisfactorily mitigated all thermal impacts and the peak was shaved on the total demand curve. This effect becomes most noticeable in Figure 4d since it depicts the highest loading scenario for the distribution transformer. For said case the uncontrolled peak demand of 173.6 kVA was reduced by 30% to 117.8, 119.8 and 119.9 kVA respectively for the heuristic, linear and convex implementations. All thermal variants demonstrated their effectiveness in preventing the thermal overloading of the transformer for both OBD and IBD scenarios with only minor differences due to their own respective formulations. This is further reinforced by the data presented in Table 5 and Table 6, where all implementations are shown to result in equivalent average loading values. Finally, it can be seen how the linear and convex implementations scored lower deviation values over the heuristic formulation, with the smallest deviations being registered by the linear variant. This is indicative of a slightly superior performance of the linear implementation over the other two alternatives.

4.2. Overall User Impact

The impacts caused upon PEV users by the alleviation of transformer congestions overnight are summarized respectively in both Table 7 and Table 8 for the OBD and IBD scenarios. Both tables compare the average final SOC levels reached by all vehicles together with their standard deviations for the uncontrolled and controlled charging implementations covering the higher PEV penetration levels and all thermal variants. Additionally, the total share of cars that reach a final SOC 85 % and can thus be considered impact-free is also highlighted.
As discussed in [28], the upper maximum performance limit for the thermal implementations is given respectively by each corresponding no control case. This is because no restrictions over the charging process are imposed and thus all cars can achieve the maximum possible charging level given by their charging rates and connection times. Table 7 and Table 8 reveal how all thermal variants resulted in a null impact on the participating users for all vehicle penetrations. All cars surpassed the 85% SOC limit and reached maximum charge, equal to or beyond 99%, with a null deviation regardless of the base load demand level.

4.3. Running Times

Finally, a comparison among the three implementations was done in terms of their required computational times. Shorter times are preferred as they are indicative of less required computational power and less demanding communications for a chosen control period. The obtained results considering the highest vehicle penetration levels together for both OBD and IBD scenarios are summarized in Figure 5a,b. Both figures depict in ascending order and using a logarithmic time scale, the computational running times respectively for each executed charge increase (Figure 5a) and charge decrease auction (Figure 5b).
First of all, it can be seen how increasing numbers of PEVs, causing more loading of the distribution transformer, results in more charge decrease and in fewer charge increase auctions being executed. This is shown in Figure 5a,b across all thermal variants. Additionally, the results reveal a significant difference between implementations for both thermal auctions. The heuristic variant outperformed both the linear and convex formulations, managing to achieve an effective solution with consistent running times below 100 μ s for the charge decrease auction and for most iterations of the charge increase auction. A maximum resolution time of 0.5825 s was registered in said case. On the other hand, running times registered for the linear and convex formulations ranged, respectively, from 0.0415 s to 5.1766 s and 1.0416 s to 71.5619 s for the charge decrease auction, and 0.0131 s to 18.9781 s and 0.2698 s to 127.0041 s for the charge increase auction.
Overall faster resolution times were achieved by the heuristic implementation, followed respectively by the linear and convex implementations.

5. Conclusions

This work has proposed two novel alternative formulations, linear and convex, for the centralized thermal management of a real-time, agent-based charge control algorithm currently solved by means of a heuristic implementation. The algorithm is conceived to mitigate and correct the main network impacts caused by the penetration of PEVs on radial distribution networks. Both formulations seek to minimize the total impact upon car owners and have been designed to serve as replacements of the current heuristic implementation of the algorithm, ensuring their compatibility with its current architecture and coordination with the local voltage management. The implementations, solved respectively by means of integer linear programming and a genetic algorithm, were tested using a simulation environment considering multiple vehicle penetration levels and two base demand scenarios, and their results were compared with those of the current heuristic implementation of the algorithm. An analysis of the obtained results was then done in terms of their total impacts on the end-users and overall performances. Results showed how faster resolution times were achieved by the current heuristic implementation, and no significant differences between formulations existed in terms of network management and end-user impact for any considered scenario.
Future work is encouraged to test the validity of the obtained results analyzing the effects of increasing number of participating vehicles on execution times. Additionally, employing larger and more realistic distribution networks, incorporating distributed generation and using stochastic modeling to improve the current simulation environment are all also recommended to detect potential differences between the formulations in terms of their total impacts on the end-users and overall performances. The combined execution of each implementation with the local voltage control could also be explored, as potential operational synergies with certain implementations might be revealed. Finally the testing of the new formulations within a hardware-in-the-loop setup with real electric vehicles and charging stations, as done for the current heuristic implementation, should be carried out in order to validate their operation and analyze how their execution times could affect the performance of the overall control.

Author Contributions

Conceptualization, C.G.V., K.R. and J.F.; formal analysis, C.G.V.; investigation, C.G.V. and K.R.; methodology, C.G.V., K.R. and J.F.; resources, C.R.; software, C.G.V.; supervision, C.R.; visualization, C.G.V.; writing—original draft, C.G.V.,K.R.; writing—review and editing, C.G.V., K.R. and J.F. All authors have read and agreed to the published version of the manuscript.

Funding

This research received no external funding.

Acknowledgments

This work is the result of a Master’s Thesis project submitted to both the Technical University of Catalonia (Spain) and KTH Royal Institute of Technology (Sweden) [36].The authors would like to extend their gratitude to the European Institute of Innovation and Technology (EIT) and InnoEnergy both for their financial support and encouragement. Kalle Rauma acknowledges the German Federal Ministry of Transport and Digital Infrastructure and the support through the project “PuLS—Parken und Laden in der Stadt.”

Conflicts of Interest

The authors declare no conflict of interest.

Abbreviations

The following abbreviations are used in this manuscript:
EVsElectric Vehicles
PEVsPlug-in Electric Vehicles
BEVsBattery Electric Vehicles
PHEVsPlug-in Hybrid Electric Vehicles
ICTInformation and Communication Technologies
OBDOriginal Base Demand
IBDIncreased Base Demand
SOCState of Charge
OBCOn-board Charger
PLLPhase-Locked Loop
HILHardware-in-the-loop
LVLow voltage

References

  1. IEA. Global EV Outlook 2018: Towards Cross-Modal Electrification; International Energy Agency: Paris, France, 2018; pp. 1–141. [Google Scholar]
  2. Richardson, D.B. Electric vehicles and the electric grid: A review of modeling approaches, Impacts, and renewable energy integration. Renew. Sustain. Energy Rev. 2013, 19, 247–254. [Google Scholar] [CrossRef]
  3. Quirós-Tortós, J.; Ochoa, L.F.; Alnaser, S.W.; Butler, T. Control of EV Charging Points for Thermal and Voltage Management of LV Networks. IEEE Trans. Power Syst. 2016, 31, 3028–3039. [Google Scholar] [CrossRef]
  4. Rauma, K. Industrial Aspects of Voltage Management and Hosting Capacity of Photovoltaic Power Generation in Low Voltage Networks. Ph.D. Thesis, Université Grenoble Alpes, Saint-Martin-d’Hères, France, 2016. [Google Scholar]
  5. Haque, A.; Rahman, M.T.; Nguyen, P.; Bliek, F. Smart curtailment for congestion management in LV distribution network. In Proceedings of the 2016 IEEE Power and Energy Society General Meeting (PESGM), Boston, MA, USA, 17–21 July 2016; pp. 1–5. [Google Scholar] [CrossRef]
  6. Haque, A.N.M.M.; Nguyen, P.H.; Vo, T.H.; Bliek, F.W. Agent-based unified approach for thermal and voltage constraint management in LV distribution network. Electr. Power Syst. Res. 2017, 143, 462–473. [Google Scholar] [CrossRef] [Green Version]
  7. Verzijlbergh, R.A.; De Vries, L.J.; Lukszo, Z. Renewable Energy Sources and Responsive Demand. Do We Need Congestion Management in the Distribution Grid? IEEE Trans. Power Syst. 2014, 29, 2119–2128. [Google Scholar] [CrossRef]
  8. García-Villalobos, J.; Zamora, I.; San Martín, J.I.; Asensio, F.J.; Aperribay, V. Plug-in electric vehicles in electric distribution networks: A review of smart charging approaches. Renew. Sustain. Energy Rev. 2014, 38, 717–731. [Google Scholar] [CrossRef]
  9. Clement-Nyns, K.; Haesen, E.; Driesen, J. The impact of charging plug in hybrid electric vehicles on a residential distribution grid. IEEE Trans. Power Syst. 2010, 25, 371–380. [Google Scholar] [CrossRef] [Green Version]
  10. Hu, J.; Si, C.; Lind, M.; Yu, R. Preventing distribution grid congestion by integrating indirect control in a hierarchical electric vehicles’ management system. IEEE Trans. Transp. Electrif. 2016, 2, 290–299. [Google Scholar] [CrossRef] [Green Version]
  11. Shao, C.; Wang, X.; Shahidehpour, M.; Wang, X.; Wang, B. Partial Decomposition for Distributed Electric Vehicle Charging Control Considering Electric Power Grid Congestion. IEEE Trans. Smart Grid 2017, 8, 75–83. [Google Scholar] [CrossRef]
  12. Procopiou, A.T.; Quiros-Tortos, J.; Ochoa, L.F. HPC-Based Probabilistic Analysis of LV Networks with EVs: Impacts and Control. IEEE Trans. Smart Grid 2017, 8, 1479–1487. [Google Scholar] [CrossRef]
  13. Zhang, L.; Kekatos, V.; Giannakis, G.B. Scalable Electric Vehicle Charging Protocols. IEEE Trans. Power Syst. 2017, 32, 1451–1462. [Google Scholar] [CrossRef] [Green Version]
  14. De Hoog, J.; Alpcan, T.; Brazil, M.; Thomas, D.A.; Mareels, I. A Market Mechanism for Electric Vehicle Charging under Network Constraints. IEEE Trans. Smart Grid 2016, 7, 827–836. [Google Scholar] [CrossRef]
  15. Zeraati, M.; Golshan, M.E.H.; Guerrero, J.M. A Consensus-Based Cooperative Control of PEV Battery and PV Active Power Curtailment for Voltage Regulation in Distribution Networks. IEEE Trans. Smart Grid 2017. [Google Scholar] [CrossRef] [Green Version]
  16. Sabillon-Antunez, C.; Melgar-Dominguez, O.D.; Franco, J.F.; Lavorato, M.; Rider, M.J. Volt-VAr Control and Energy Storage Device Operation to Improve the Electric Vehicle Charging Coordination in Unbalanced Distribution Networks. IEEE Trans. Sustain. Energy 2017, 8, 1560–1570. [Google Scholar] [CrossRef]
  17. Restrepo, M.; Cañizares, C.A.; Kazerani, M. Three-Stage Distribution Feeder Control Considering Four-Quadrant EV Chargers. IEEE Trans. Smart Grid 2018, 9, 3736–3747. [Google Scholar] [CrossRef]
  18. Restrepo, M.; Morris, J.; Kazerani, M.; Cañizares, C.A. Modeling and testing of a bidirectional smart charger for distribution system EV integration. IEEE Trans. Smart Grid 2018, 9, 152–162. [Google Scholar] [CrossRef]
  19. Shekari, T.; Golshannavaz, S.; Aminifar, F. Techno-Economic Collaboration of PEV Fleets in Energy Management of Microgrids. IEEE Trans. Power Systems 2017, 32, 3833–3841. [Google Scholar] [CrossRef]
  20. Akhtar, Z.; Chaudhuri, B.; Hui, S.Y.R. Smart Loads for Voltage Control in Distribution Networks. IEEE Trans. Smart Grid 2017, 8, 937–946. [Google Scholar] [CrossRef] [Green Version]
  21. Rivera, S.; Wu, B. Electric Vehicle Charging Station With an Energy Storage Stage for Split-DC Bus Voltage Balancing. IEEE Trans. Power Electron. 2017, 32, 2376–2386. [Google Scholar] [CrossRef]
  22. Silva, C.; Sousa, D.M.; Roque, A. Charging electric vehicles from photovoltaic generation with intermediate energy storage. In Proceedings of the 2017 6th International Conference on Clean Electrical Power: Renewable Energy Resources Impact, ICCEP 2017, Santa Margherita Ligure, Italy, 27–29 June 2017; pp. 596–601. [Google Scholar] [CrossRef] [Green Version]
  23. Radu, A.T.; Eremia, M.; Toma, L. Promoting battery energy storage systems to support electric vehicle charging strategies in smart grids. In Proceedings of the 2017 Electric Vehicles International Conference, Bucharest, Romania, 5–6 October 2017. [Google Scholar] [CrossRef]
  24. Knezovic, K.; Martinenas, S.; Andersen, P.B.; Zecchino, A.; Marinelli, M. Enhancing the Role of Electric Vehicles in the Power Grid: Field Validation of Multiple Ancillary Services. IEEE Trans. Transp. Electrif. 2017, 3, 201–209. [Google Scholar] [CrossRef] [Green Version]
  25. Martinenas, S.; Knezovic, K.; Marinelli, M. Management of Power Quality Issues in Low Voltage Networks using Electric Vehicles: Experimental Validation. IEEE Trans. Power Deliv. 2016, 8977, 1–9. [Google Scholar] [CrossRef] [Green Version]
  26. Soares, F.J.; Rua, D.; Gouveia, C.; Tavares, B.D.; Coelho, A.M.; Lopes, J.A. Electric Vehicles Charging: Management and Control Strategies. IEEE Veh. Technol. Mag. 2018, 13, 130–139. [Google Scholar] [CrossRef]
  27. Tran-Quoc, T.; Clemot, H.; Nguyen, V.L. Charging strategies of electric vehicles. In Proceedings of the 2017 12th International Conference on Ecological Vehicles and Renewable Energies, EVER 2017, Monte Carlo, Monaco, 11–13 April 2017. [Google Scholar] [CrossRef]
  28. García Veloso, C.; Rauma, K.; Fernández, J.; Rehtanz, C. Real-Time Agent-Based Control of Plug-in Electric Vehicles for Voltage and Thermal Management of LV Networks: Formulation and HIL Validation. IET Gener. Transm. Distrib. 2020, 14, 2169–2180. [Google Scholar] [CrossRef]
  29. International Electrotechnical Commission. International Standard IEC 61851-1; International Electrotechnical Commission: Geneva, Switzerland, 2017. [Google Scholar] [CrossRef]
  30. The MathWorks Inc. Simscape Power Systems. Available online: https://www.mathworks.com/products/simpower.html.html (accessed on 2 May 2017).
  31. Richardson, I.; Thomson, M. Integrated simulation of photovoltaic micro-generation and domestic electricity demand: A one-minute resolution open-source model. Proc. Inst. Mech. Eng. Part A J. Power Energy 2012, 227, 73–81. [Google Scholar] [CrossRef]
  32. Wu, Q.; Nielsen, A.H.; Østergaard, J.; Cha, S.T.; Marra, F.; Chen, Y.; Træholt, C. Driving Pattern Analysis for Electric Vehicle (EV) Grid Integration Study. In Proceedings of the 2010 IEEE PES Innovative Smart Grid Technologies Conference Europe (ISGT Europe), Gothenberg, Sweden, 11–13 October 2010; pp. 1–6. [Google Scholar] [CrossRef]
  33. Fernandez Orjuela, J.A. Intégration des Véhicules Electriques dans le réseau électrique résidentiel: Impact sur le déséquilibre et stratégies V2G innovantes. Ph.D. Thesis, Université Grenoble Alpes, Saint-Martin-d’Hères, France, 2014. [Google Scholar]
  34. Genovese, A.; Ortenzi, F.; Villante, C. On the energy efficiency of quick DC vehicle battery charging. World Electr. Veh. J. 2015, 7, 570–576. [Google Scholar] [CrossRef] [Green Version]
  35. Habib, S.; Kamran, M.; Rashid, U. Impact analysis of vehicle-to-grid technology and charging strategies of electric vehicles on distribution networks—A review. J. Power Sources 2015, 277, 205–214. [Google Scholar] [CrossRef]
  36. García Veloso, C. Real Time Voltage and Thermal Management of Low Voltage Distribution Networks through Plug-in Electric Vehicles. Master’s Thesis, Barcelona School of Industrial Engineering, Barcelona, Spain, 2017. [Google Scholar]
Figure 1. Integration of the thermal variants within the logic of the algorithm. Adapted from [28].
Energies 13 04227 g001
Figure 2. Considered test network. Adapted from [28].
Energies 13 04227 g002
Figure 3. Aggregated 24 h, 1-min resolution domestic active power demand. Adapted from [28].
Energies 13 04227 g003
Figure 4. Five-minute time series transformer loading profile comparison between the uncontrolled and controlled vehicle charging implementations for the higher PEV penetration levels. (a) Original base demand (OBD) 100% penetration. (b) OBD 80% penetration. (c) OBD 60% penetration. (d) Increased base demand (IBD) 100% penetration. (e) IBD 80% penetration. (f) IBD 60% penetration.
Energies 13 04227 g004
Figure 5. Computational running times, in ascending order, of each thermal auction for all analyzed variants (H: heuristic; L: linear; C: convex) considering both OBD and IBD scenarios and highest penetrations levels. (a) Charge increase auctions. (b) Charge decrease auctions.
Energies 13 04227 g005
Table 1. Nomenclature.
TLoading factor: distribution transformer
T Reevaluated distribution transformer loading factor after the 1st thermal auction
F i j Loading factor: phase j of feeder i
S m Measured power loading of the distribution transformer
S r Rated power loading of the distribution transformer
I m i j Measured loading current of phase j from feeder i
I r i j Rated loading current of phase j from feeder i
β Thermal security margin
nTotal number of feeders
ψ Decision parameter. [(1) charge increase, (−1) charge decrease, (0) no auction]
φ k Vehicle k flexibility offer: current bid
λ k Vehicle k flexibility offer: bid division
t k c h Vehicle k flexibility offer: cumulative charging time
ρ k Vehicle k flexibility offer: charge characteristics. [1-phase AC ( a = 1 , b = 2 , c = 3 ), 3-phase AC (4)]
τ k Feeder of origin from flexibility offer of vehicle k
m i j k 1 P h Impact parameter of vehicle k on phase j of feeder i (1-phase AC)
m i j k 3 P h Impact parameter of vehicle k on feeder i (3-phase AC)
I c h k Present charging rate of vehicle k
I m a x k Maximum charging rate of vehicle k
Total number of participating vehicles
x k Participation factor of vehicle k
x k 1 s t Participation factor of vehicle k after the 1st thermal auction
x k 2 n d Participation factor of vehicle k after the 2nd thermal auction
x k f Final value of the participation factor of vehicle k
α Iterative natural number
tCurrent time
t 0 Initialization time
t t h Thermal control period
V t Nominal phase voltage at the distribution transformer
ζ k Impact parameter of vehicle k on the distribution transformer
S O C k State of charge of vehicle k
C n k Battery capacity of vehicle k
V b a t k Rated battery voltage of vehicle k
η o b c k Performance of the OBC of vehicle k
η b a t k Battery charge–discharge efficiency of vehicle k
t Δ Simulation time step
P c h k ( γ ) Charging power of vehicle k at simulation time step γ
γ Simulation time step within the ( t t 0 ) time window
V i j Complex nodal phase voltages at node i
I c h k j Conjugate charging rate of vehicle k at phase j located at node i
Table 2. Impact parameters: m i j k 1 P h and m i k 3 P h [28].
ρ k < 4 ρ k = 4
if i = τ k and j = ρ k else if i = τ k else
m i j k 1 P h 1000
m i k 3 P h 0010
Table 3. Test network: electrical characteristics [28].
Underground Cables
Cable TypeR ( Ω /km)X ( Ω /km)C ( μ F/km)Ampacity (A)
A 150 mm 2 Al0.2060.0790.723-
C 50 mm 2 Al0.6410.0850.553116
D 16 mm 2 Al1.910.0960.404-
E 10 mm 2 Cu1.8370.0880.404-
F 6 mm 2 Cu3.0610.10.325-
Distribution Transformer
Rating (kVA)100R; Z ( Ω )0.0072; 0.0246
Table 4. Analyzed PEVs: technical characteristics [28].
VehicleNissan LeafBMW i3
Model2014-15BMW i3 (94 Ah)/2016
Battery Capacity (Ah)6794
Battery Rated Voltage (V)360353
OBC efficiency0.890.925
Connector IEC 62196Type 1Type 2
Max Charging Current (A)1632
Max Supported AC Charging1-Phase AC3-Phase AC
Table 5. Overall transformer loading (pu): original base demand.
ThermalPEV Penetration Level [%]
Control[60]/ ( μ ± 3 σ ) [80]/ ( μ ± 3 σ ) [100]/ ( μ ± 3 σ )
No Control 0.314 ± 0.805 0.381 ± 0.947 0.452 ± 1.172
Heuristic 0.314 ± 0.802 0.381 ± 0.926 0.449 ± 1.025
Linear 0.314 ± 0.801 0.381 ± 0.915 0.448 ± 0.993
Convex 0.314 ± 0.802 0.382 ± 0.923 0.448 ± 1.000
Table 6. Overall transformer loading (pu): increased base demand.
ThermalPEV Penetration Level [%]
Control[60]/ ( μ ± 3 σ ) [80]/ ( μ ± 3 σ ) [100]/ ( μ ± 3 σ )
No Control 0.432 ± 0.972 0.500 ± 1.100 0.571 ± 1.312
Heuristic 0.431 ± 0.907 0.497 ± 0.938 0.566 ± 0.955
Linear 0.432 ± 0.897 0.497 ± 0.894 0.565 ± 0.886
Convex 0.431 ± 0.899 0.497 ± 0.916 0.566 ± 0.963
Table 7. Final SOC levels (%) and number of unaffected users: original base demand 60%, 80% and 100% PEV scenarios.
PenetrationThermal Control ( μ ± 3 σ ) | ( % of Unaffected Users )
LevelNo ControlHeuristicLinearConvex
60% ( 99.000 ± 0.000 ) | ( 100 ) ( 99.000 ± 0.000 ) | ( 100 ) ( 99.000 ± 0.000 ) | ( 100 ) ( 99.000 ± 0.000 ) | ( 100 )
80% ( 99.000 ± 0.000 ) | ( 100 ) ( 99.000 ± 0.000 ) | ( 100 ) ( 99.000 ± 0.000 ) | ( 100 ) ( 99.000 ± 0.000 ) | ( 100 )
100% ( 99.000 ± 0.000 ) | ( 100 ) ( 99.000 ± 0.000 ) | ( 100 ) ( 99.000 ± 0.000 ) | ( 100 ) ( 99.000 ± 0.000 ) | ( 100 )
Table 8. Final SOC levels (%) and number of unaffected users: increased base demand 60%, 80% and 100% PEV scenarios.
PenetrationThermal Control ( μ ± 3 σ ) | ( % of Unaffected Users )
LevelNo ControlHeuristicLinearConvex
60% ( 99.000 ± 0.000 ) | ( 100 ) ( 99.000 ± 0.000 ) | ( 100 ) ( 99.000 ± 0.000 ) | ( 100 ) ( 99.000 ± 0.000 ) | ( 100 )
80% ( 99.000 ± 0.000 ) | ( 100 ) ( 99.000 ± 0.000 ) | ( 100 ) ( 99.000 ± 0.000 ) | ( 100 ) ( 99.000 ± 0.000 ) | ( 100 )
100% ( 99.000 ± 0.000 ) | ( 100 ) ( 99.000 ± 0.000 ) | ( 100 ) ( 99.000 ± 0.000 ) | ( 100 ) ( 99.000 ± 0.000 ) | ( 100 )

