Abstract
The lack of electricity access is increasingly concentrated in rural areas of developing countries, in which mini-grids are often a suitable solution; however, given the high risks, it is crucial to minimize costs. This paper aims at analyzing existing methodologies for the optimal design of mini-grids combined with different operating strategies. Typical system operations, like the load-following (LFS) and cycle charging (CCS) strategies, are compared with the more demanding predictive strategies based on Mixed-Integer Linear Programming (MILP). The problem is formulated and solved with Particle Swarm Optimization (PSO), so to simulate traditional and predictive operating strategies. Two reformulations based on the proposed Search Space Update are also detailed and compared with the so-called one-shot MILP model, which is able to con-jointly optimize both the design and the operation of the system, in order to reduce computational requirements with the predictive strategy. The results, tailored with data from a rural mini-grid in Kenya, highlight that heuristic methodologies can perform better than the traditional MILP approach, both in terms of optimality and computational time, especially when advanced operating strategies are considered. Conventional operating strategies (LFS or CCS) appear to be sub-optimal, but require very little computational requirements, which makes them suitable for preliminary designs.
1. Introduction
Increasing energy access is a key objective for developing countries [1]. Recognized as an enabler to foster rural development [2,3], universal access to electricity is part of the global development agenda as one of the targets of Sustainable Development Goal (SDG) 7 [4]. In the last 10 years, there has been a rapid increase in the global electricity access rate, with the population lacking access falling, for the first time, below one billion [5]. However, at current rates, estimates show that there will still be 620 million people lacking access in 2030, mostly located in rural areas of sub-Saharan Africa [6]. Renewable-based mini-grids, which exploit locally available energy sources, can be the most convenient solution to provide access in remote locations, with respect to grid extension and purely diesel-based systems [7]. However, in order to guarantee a good quality of supply, fuel generators are typically included in the design to face periods of low renewable energy production, and storage systems are often required to meet the peak demand and shift the energy produced to hours of high load.
Mini-grids can provide a high level of service, being comparable to a reliable national grid [8], thus enabling the development of productive activities, at commercial and industrial level, including agro-processing activities [9]. A massive number of mini-grids is foreseen to be needed to achieve universal access, but their commercial viability for private developers is still limited [10]. Among the technical advancements needed for this technology, optimal sizing, and improved dispatching and management strategies are considered one of the priorities [11].
Universal access to electricity with renewable energy sources is considered to be one of the key drivers for achieving the sustainable development [12], given the corresponding synergies. As an example, the process of diffusion of Electric Vehicles (EVs) could benefit the pace of electrification by making available cheap second life EV batteries [13], which could lower mini-grid investment costs. In addition, EVs can be envisaged to be used for transportation services in isolated areas, in combination with renewable electricity production, in order to relieve the burden of fuel procurement [14].
The optimal design of rural mini-grids is crucial to maximize the profitability of the electrification projects. To do so, given that economic concerns are often priorities to private developers, techno-economic simulations are performed in order to minimize costs or maximize profits by means of economic indicators, such as Net Present Cost (NPC). The simulations simulate the life cycle value of the project that accounts for both CAPEX and OPEX, the latter being evaluated accounting for the operating strategy to be used in the project.
The simplest operation strategies for mini-grids are based on priority-rules [15,16,17], which give precedence to renewable generation capacity, then committing storage units and traditional fuel generators at last. In the Load-Following (LFS) approach, when the batteries reach their minimum State-Of-Charge (SOC) the fuel-fired generator is switched on, but it limits itself to satisfy the energy demand, as the name implies. In the case of Cycle-Charging (CCS) approach, on the other hand, once the generator is activated, it is used both to serve the load and to recharge the storage unit, until a prescribed SOC level. The widespread diffusion of priority-list approaches depends on their simplicity and ease of real-life implementation, since they require only inexpensive controls, a situation also mirrored in scientific papers [17,18,19].
The use of advanced, predictive strategies may seem unfit for applications in rural mini-grids, but there is a trend among mini-grid developers to use sophisticated equipment, like smart-metering technology [20], and an expected shift towards intelligent controls in the coming years, favored by ever decreasing prices of the devices [11]. Predictive strategies are more complex, as they require a forecast of electricity demand and renewable generation for a specified time window, which is fed to an algorithm that outputs an optimized scheduling for the commitment of all system components. The increased complexity with respect to LFS and CCS pays off in terms of OPEX savings, which cause a decrease in the NPC, provided that the forecasts are accurate enough. In particular, for Rolling-Horizon Strategies (RHS), such optimizations are performed multiple times infra-daily [21]; unbalances in real-time operation due to forecast errors are prevented by priority rules. The frequency of these optimizations makes RHS capable of mitigating uncertainties notwithstanding its deterministic nature.
The optimal design of renewable-based mini-grids is a key issue, frequently addressed in the literature [18,22,23,24,25], and it requires reliable forecasts of the load and renewable generation profiles on no-less than a yearly basis, and with an adequate granularity (e.g., hourly day profiles). For the renewable production, there are established techniques that can be used starting from reliable meteo station data, as the Graham method for solar irradiation [26]. As for the demand, an estimate of the present-day load profile for a rural community with no prior access to electricity requires a structured survey campaign [27], a costly and complex process. The actual evolution of the electricity consumption over time depends on complex socio-economic dynamics [28], and also by the role and strategy of the developer [9]. A way to circumvent this limitation, especially when studying optimal design procedures for mini-grids and as done in the present paper, is to refer to data coming from existing projects, which serve as the closest proxy in lack of reliable and validated methods for the assessment and forecast of electricity demand for greenfield rural communities.
Any optimization method involves the minimization of a target techno-economic parameter, by selecting an optimal design given an operation strategy. Typical optimization approaches used for off-grid systems can be divided into mathematical optimization methods (e.g., Mixed-Integer Linear Programming) and (meta)heuristic methodologies [29]. The first ones, also referred to as classical methods, are capable of finding the optimal solution to a problem in a finite time frame; however, the complexity of implementation and the computational burden required may result impractical for many applications [30]. The so-called (meta)heuristic algorithms, while not guaranteeing to reach an exact optimal solution, allow for obtaining high quality sub-optimal solutions in a fraction of the computational time by employing search processes often inspired by nature and biology (such as swarm intelligence) [29,30]. On the other hand, Mixed-Integer Linear Programming (MILP) is a numerical technique for mathematical optimization that guarantees convergence towards the global optimum; however, the computational burden grows significantly with the size of the problem [31,32]. Instead, when MILP tackles the optimal system operation, the computational burden is generally lower [18,33,34].
In sizing methodologies, MILP is often used with a deterministic approach, where an assumption for the yearly profiles of load and renewable generation is done beforehand the simulation of the operation; stochastic approaches have also been proposed, but they require simplifications to handle a large time horizon [35,36]. Computational requirements are a challenge of MILP: as reported by Li and colleagues [33], in order to optimally design of a stand-alone energy system with provision of electricity and heat/cool, only 12 representative days instead of a full yearly profile had to be used. In another example [34], a MILP formulation was proposed in order to optimize an off-grid system considering the simulation of an entire year at hourly resolutions; however, the convergence criterion was either a maximum of 3 h of computational time or a 5% of tolerance on the objective function.
Heuristic methodologies rely on an iterative process, where a given number of different sizing cases is drawn, then their yearly operation is simulated; the target function to be minimized is evaluated for all cases, selecting the cheapest ones, which are then considered in the next round of sizing cases generated, until the termination criteria are met [17,18,23,25,37,38]. As an example of heuristic methodology, Particle Swarm Optimization (PSO) has been used in the field of mini-grids for rural electrification [35,39]. In [39], the authors proposed two interesting approaches to reduce computational requirements in heuristic approaches for a hybrid system, also including the simulation of the fuel logistics. The paper [35] proposed an interesting comparison between different sizing methodologies, including MILP and heuristic approaches; however, we believe that the comparison could be improved, also including the methodologies developed in [39]. The benefits of predictive approaches is showcased also by authors in [40], which obtained, with respect to LFS and CCS strategies, notable savings in the annualized costs. Predictive strategies are able to attain better results than LFS and CCS, but they entail higher computation times. In the above, we considered predictions done in a deterministic way, i.e., assuming perfect forecast and considering a single yearly scenario as the reference for all the years in the lifetime of the mini-grids. However such methods can also be operated through stochastic approaches for increased robustness at additional computational cost: that is, consider uncertainties in the design phase by weighing the probability of multiple load and renewable production scenarios within each sizing case. As a last note, it is worth to remember that heuristic methodologies allow for usage of non-linear cost functions, whereas MILP ones are restricted to employ their piecewise linearizations.
The present paper, aimed at guiding both developers and researchers, presents an extended comparison among deterministic methods to design rural mini-grids. Firstly, a MILP model, called One-Shot (OS), is proposed, which optimizes both the sizing and the operation of the mini-grid assuming the perfect forecasting of load and RES profiles. The results of the OS, which is guaranteed to be close to the global optimum by a given tolerance, are compared with a PSO heuristic methodology that implements both classical dispatching strategies (LFS, CCS) and a predictive one (RHS). Additionally, two simplified methodologies to reduce the computational requirements of RHS are proposed with the objective of making the real-life implementation of advanced strategies easier. The main novelty consists in using the results of the preliminary design calculated using LFS to initialize the simulation with RHS; the methodology is referred to as Search Space Update (SSU). Furthermore, we have also discussed the need for the developers to optimize the system using the operating strategy that will be implemented in practice and the consequences in terms of objective function if that is not performed. The proposed methodology is performed on a realistic case study in rural Kenya, while using input data from a real mini-grid in the region.
This activity is an advancement of other works published by the same authors [35,39] and this paper aims at establishing a solid baseline for researchers and developers to tackle the microgrid sizing, combined with advanced operating strategies.
The rest of the paper is organized, as follows. Section 2 describes the mathematical formulation of the OS model, while Section 3 details the heuristic approaches combined with the LFS, CCS and RHS. Section 4 describes the proposed procedure to reduce the computational requirements of sizing methodologies based on predictive techniques; Section 5 introduces the case study and Section 6 reports the results.
2. One-Shot (OS) Model
2.1. Description
In this section, we describe the mathematical MILP formulation of the optimization problem to achieve the cheapest design of a typical mini-grid in developing countries, composed by a photovoltaic plant, a battery storage, a battery converter, the inverter, and a fuel-fired generator. The inverter and the diesel generator are tied at the AC-busbar and directly supply the load; the battery and the photovoltaic plant are linked at the DC busbar. It is worth noticing that this formulation conjointly optimizes both the operation and the design of the system with the very established MILP techniques, which has been widely used in the energy sector and can achieve the global optimum of the problem [32]. The objective of the methodology is minimizing the Net Present Cost of the system over the project lifespan, accounting for the investment costs of the components and the operating charges, which depend upon the dispatch of the resources. The operating costs are evaluated based on the simulation of the typical year at an hourly resolution, which is a good compromise between problem tractability and optimality of results. This formulation is based on the one described in [39].
2.2. Mathematical Formulation
Equation (1) details the objective function of the one-shot model that is the minimization of NPC; hence, as a weighted sum of CAPEX and OPEX. The investment costs of each component account for the economy of scale by using a piece-wise linear formulation, as detailed in Equation (2). The operating costs account for the maintenance and fuel-charges of the generator , described in (4), and of the costs due to the Energy-Not-Served , that are a linear function of the curtailed demand , as stated in (6). It is worth noticing that the costs due to the fuel and the maintenance of the generator are modeled through the piece-wise formulation described in (4), with coefficients and that represent the intercept and slope of the specific cost function; details the specific charge due to the maintenance. The binary variable specifies when the generator is in operation: it equals one when it is in operation, zero otherwise.
Equations (7) and (8) are stated for the AC and DC busbars, respectively, in order to guarantee the power balance of the system. describes th dispatch of the diesel generator, and describe the dispatch of the inverter and the variable of the curtailed demand is . depicts the load demand and represents the renewable energy production. Lastly, variables and represent the dispatch of the battery converter, when it is charged and when it is discharged. The inverter efficiency is taken into account in the formulation.
The constraints related to the diesel generator are set with Equations (9) and (10). The capacity of the generator must be guaranteed, as stated in (9). On the other side, the minimum and maximum operating points of the asset must be taken into account. The latter is done with constraint (10) by using the status of the generator , as already discussed. The maximum operating point is the nominal capacity of the generator and the minimum is expressed with the fraction .
The power constraints of the battery and the inverter are detailed in (11)–(18). In particular, in both cases the power limits employ a binary variable, and for the battery and the inverter, respectively, so that the assets cannot supply and absorb power from the busbar in the same time-step. The Equations (11) and (12) guarantee to be the limit of the power dispatched by the battery, and the same is done for the inverter using constraints (15) and (16). The proposed formulation also includes specific constraints to forbid the battery and inverter to supply and absorb power in the same time by the corresponding busbar: constraints (13) and (14) apply for the battery, whereas Equations (17) and (18) apply for the inverter.
The energy flow in the battery is modelled while using Equation (19), where represents the energy stored in the battery and is the round-trip conversion efficiency. The maximum and minimum operating point of the battery are guaranteed with Equation (20); similarly to the fuel-fired generator, the minimum energy that is to be stored in the battery is modeled with a parameter ().
3. Heuristic-Based Sizing Methodologies (LFS, CCS, RHS)
3.1. Description
The OS model is then compared to an equivalent formulation that was developed with the PSO algorithm, based on previous work of the same authors [35,39]. Figure 1 depicts the main flowchart of the optimization procedure. Conversely to OS, in which the dispatching variables are optimized assuming perfect knowledge of the optimization period, in heuristic methodologies the operating strategy to be put in place can be simulated also including the effect of the forecasting errors, as done in [35]. On the other side, heuristic approaches do not guarantee global convergence, while OS does, hence the type of comparison performed in this paper can be very worthy also to validate the convergence quality among different heuristic formulation and exact methods like the MILP-based OS.
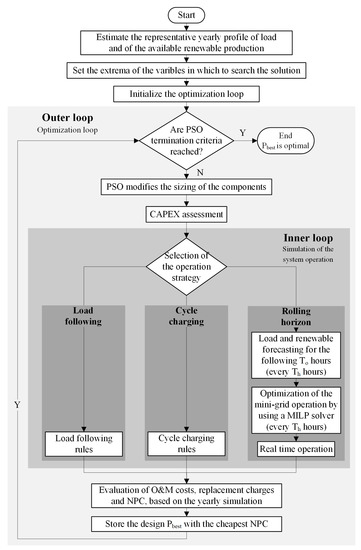
Figure 1.
Algorithm of the proposed heuristic-based optimization.
The optimization procedure is composed by two nested loops, as shown in Figure 1: in the outer one, the main PSO procedure iteratively draws multiple size scenarios of the components of the system whose corresponding NPC is then evaluated in the inner loop by means of simulations. According to the PSO algorithm, the solution is searched in a preset area delimited by given upper and lower bounds, set a-priori according to the expertise of the developer and the estimated load demand; the criterion that is proposed in this paper is described in the following section. The simulations in the inner loop are performed with three different operating strategies: the load following (LFS), the cycle charging (CCS), and the rolling-horizon (RHS) ones, which are well known in the literature and in practical applications [35,39]. More details on the operating strategies are described in the following Section 3.3.
For the sake of clarity, when we refer to the optimization methods that are based on PSO, the acronyms LFS, CCS, and RHS can refer to the PSO methodology combined with the corresponding operating strategy.
3.2. Initial Search Space
In this activity, the initial search space is set according to the following rules.
- The maximum size of the AC inverter and the fuel-fired generator is set to be larger or equal to the yearly peak demand of the load.
- The maximum capacity of the battery is set to be equal to the average daily demand of the load.
- The maximum size of the PV plant is chosen so that the corresponding yearly demand is higher than the yearly demand by a given factor (+50%).
- The maximum size of the battery converter is chosen to be no lower than the capacity of the inverter and of the photovoltaic plant.
- The lower bound of the design of each asset is zero, so that the solver could not install some components.
3.3. Operating Strategies
Details on the operating strategies simulated within the procedure depicted in Figure 1 are described below. In particular, we simulated both traditional priority-list rules, such as LFS and CCS, as well as predictive approaches that can lead to savings in terms of operation, but they require accurate forecasts. Because the objective of this paper is comparing deterministic approaches, in this activity we assume the perfect forecast of the system, to compare the heuristic methodologies with OS on a fair ground.
3.3.1. Load Following Strategy
The most common operating strategy used in real-life applications is LFS, given its low hardware and computational requirements. With LFS, resources are dispatched based on priority-list rules: renewable energy sources are exploited first, then the energy stored in the batteries and finally the fuel-fired generators, as they usually correspond to the most expensive energy source. When the minimum allowed energy level of the batteries is reached, then the generator is turned on to meet the remaining demand not met by the photovoltaic plant. When the renewable sources are able to cover the demand, then the generator is shut down. Batteries are usually not recharged during this process.
3.3.2. Cycle Charging Strategy
In this paper, we also considered CCS to dispatch rural mini-grids. CCS is a very simple approach, since it follows the same merit-order criterion as LFS, but, when the generator is turned on, it is kept operating at a given power, usually the rated power, to not only supply the demand, but also to recharge the batteries until a given threshold. The generator is usually turned on at the minimum SOC level of the battery; however, the final SOC value is a site-dependent parameter and it can be difficult to tailor a-priori. This is why the optimization approach based on PSO also optimizes this parameter for the proposed case study.
3.3.3. Rolling Horizon Strategy
Finally, we also simulate the rolling-horizon strategy, which is based on an iterative approach in which at every given time, such as 12 h, a forecast of the following horizon, i.e., 24 h, is performed and an optimization methodology calculates the optimal dispatch of the system that minimizes the operating costs. Conversely to LFS, this allows the system to advance possible energy requirements; hence, avoiding load shedding. On a real-time application, this can also allow the system to correct deviations due to the unavoidable forecasting errors [35]. In this activity, the mathematical formulation of the RHS problem is equivalent to the minimization of operating costs as described in (4), but tailored only for the subsequent time horizon (i.e., the following 24 h with respect to the actual time-step). Because unavoidable forecasting errors can occur, the scheduled dispatch of the system is corrected by using fast real-time rules, such as the ones used for LFS and described above.
It is worth noticing that combining PSO with RHS can enable interesting savings with respect to traditional operating strategies (LFS or CCS) at the cost of higher computational requirements [35]. For this reason, in this paper, we also develop simplified approaches to speed up the optimization process, similarly to [39], but also accounting for the OS model.
Furthermore, RHS optimization is significantly faster to compute than the OS model; hence, it makes sense to combine PSO and RHS so to possibly achieve the optimal design with low computational requirements.
4. Simplified Design Approaches to Reduce Computational Requirements Based on Search Space Update (SSU)
4.1. The General Procedure
Predictive operating strategies, such as the RHS, can be interesting to reduce operating costs and reduce the NPC of mini-grid projects [35]; however, the corresponding sizing approach can be computational demanding. For this reason, simplified techniques have been proposed to reduce computational requirements, but they have not been adequately compared with other deterministic approaches, including OS [39].
When the search space of the PSO algorithm is not accurately chosen, the computational requirements and convergence speed may be lower; hence, more iterations are required. When RHS is used, each iteration has higher computational demand than when LFS applies; however, the design calculated with LFS is similar to the optimal one with RHS. Therefore, it makes sense to perform a preliminary simulation using LFS with the objective of refining the search space to be used in RHS methodologies.
In this section, we describe a generalized procedure to simplify the sizing of an energy system by using preliminary simulations that are fast to compute, and the generalized diagram is sketched in Figure 2.
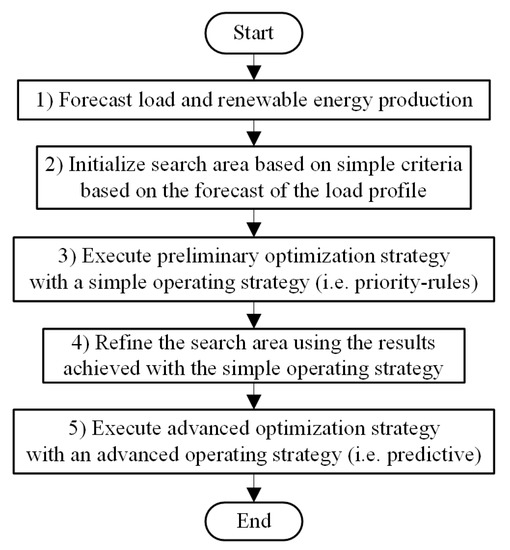
Figure 2.
Workflow for the definition of simplified advanced strategies.
4.2. Initial Search Space
With respect to Figure 2, the initial search space of the heuristic methodologies can be set conservatively, by using basic considerations on the load and renewable production data, as shown in Section 3.2. The upper bound for the size of each component can be defined, so that it guarantees serving the electrical demand, while the lower bound can be set at zero to include the possibility that a component may not be part of the final design: for example, the maximum size of the inverter can be set equal to the size of the demand and/or the maximum size of the renewable units.
4.3. Preliminary Optimization
Once the initial search space is initialized, a preliminary optimization method is performed by using a simple operating strategy, which is fast to compute, such as based on priority-rules. This preliminary phase aims at reducing the search space for the more demanding optimization method that is based on predictive strategies that is subsequently performed. The time savings related to having a refined search space can overcome the additional burden of performing an initial optimization; this is why the proposed approach is promising when the preliminary optimization is fast to compute, such as when priority-rules criteria are used.
4.4. Update of the Search Space
Subsequently, given the results of the preliminary optimization phase, the search space of the methodology is refined. For example, the refined search space can be defined to be within a fraction (i.e., 10%) below or above the preliminary solution. Anyway, the criterion for reducing the search space should not be too strict, otherwise the optimality of the results may be compromised. In particular, in this activity we consider two main methodologies for refining the search space:
- (upd)
- In the case denoted “upd”, the upper and lower bound of the design of each component in the advanced operating strategy is changed to be below or above a given percentage (i.e., 10%) of the design obtained with the simplified priority-list method.
- (smp)
- According to the literature, the sizing of renewable assets, of the battery and of converters sometimes do not change significantly with an advanced operating strategy [35,39], hence it may be better to perform the optimization only on the variables that are considerably affected. Therefore, in this case, denoted “smp”, the sizing of such components is not optimized in the subsequent optimization phase, rather it is fixed; instead, only the other components are optimized, such as the fuel-fired generators.
4.5. Optimization with Advanced Operating Strategies
Once the search space is refined, the final optimization with an advanced operating strategy, such as RHS, can be performed. Two optimization methodologies are introduced and discussed below based on the RHS operating strategy (RHS-upd and RHS-smp), according to the general methodology described above and the refining strategies that have been discussed.
To summarize, the simplified optimization procedures are:
- RHS-upd: this method uses the sizing obtained with LFS to update the search space to be used by the RHS-integrated PSO methodology. The criteria for the update are:
- For the components less sensitive to the operating approach (PV, converters, and electrochemical storage system [35,39]), the lower and upper boundaries of the search space are set within a () range of their optimal sizing obtained through LFS.
- For the diesel genset, the upper bound of the search space is set within a given tolerance (i.e., +10%) of the optimal LFS sizing, while the lower bound is kept at 0. In fact, according to [35,39], it can occur that the size of the diesel generator is even halved with respect to the LFS sizing; to be conservative, then, the limit has been put equal to zero.
- RHS-smp: this method brings to extremes the assumptions made for RHS-upd, as it only optimizes the diesel generator size, while the design of the other components is inherited from the LFS results from the first stage. For the diesel generator, the search space is modified with the same criterion: the lower bound is zero, and the upper bound is a 10% increase of the diesel genset sized by the LFS. In this approach, the computational times are expected to decrease even further, by having four less optimization variables, and by the focused reduction of the diesel generator search space.
5. Case Study
5.1. Description
The input data for the optimization methodologies come from a mini-grid system of 10,000 consumers, both residential and commercial, located in Wajir County, Kenya.
The same load and renewable generation profile has been considered for all of the strategies and a perfect forecast has been assumed for OS and RHS in order to compare the methodologies on an equal basis.
Given the load and renewable data, the components considered for the optization are: photovoltaic system, electrochemical storage, the DC/DC battery converter, the inverter, and the diesel generator.
In this case, the full potential of the heuristic methodology have not been exploited; it would be, in fact, possible to optimize the size of the fuel tank and the fuel procurement logistics, as done in [39], but, due to the complexity and computational requirements needed to include them in the OS, they have been disregarded in favor of a fair comparison across methods.
5.2. Solar Irradiation and Load Profiles
The load data measured in the reference mini-grid in 2014 were made available with a granularity of 30 min., and therefore averaged to obtain a hourly profile for a year. The peak demand and the base load registered in 2014 were 292 kW and 43 kW, respectively; the total yearly demand was 1.1 GWh.
A synthetic yearly solar irradiation profile has been obtained by applying the Graham model [26] to a dataset that was obtained from the kenyan weather station of Kitale, a location near the considered mini-grid.
5.3. Investment and Maintenance Costs, Component Efficiencies
As already mentioned, heuristic optimization methodologies allow for the implementation of non-linear cost functions, while MILP-based methods, like OS, can only handle their piecewise linearized form. Therefore, firstly, non-linear cost curves have been derived while using the power model reported in (23), in which for every x-component, the cost for the reference size is considered, to obtain the cost of the component with a generic size . The exponent accounts for scale effects.
The resulting continuous cost curve is shown in blue for the diesel generator in Figure 3a, alongside the seven-point piecewise linearization used for the OS, in red. Analogously, the curves for the inverter and DC-DC converter are presented in Figure 3b,c along with the respective seven-point and nine-point linearizations.. For these three components, the common reference size is 1 kW, and the corresponding costs are: , and . As denoted by the shape of the cost functions, scale effects are stronger for the inverter and DC-DC with respect to diesel generator.
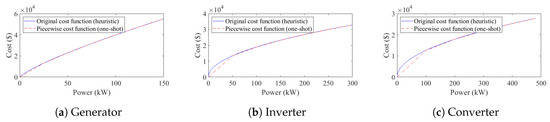
Figure 3.
Investment cost of selected components. Blue curves: continuous power functions used in Particle Swarm Optimization (PSO) optimization. Red curves: piecewise linear functions used for Mixed-Integer Linear Programming (MILP) optimization.
Conversely, no scale effects have been considered for the photovoltaic and electrochemical storage system, i.e., is assumed to be equal to one, meaning that their cost function is de facto a single straight line in all cases. The reference costs considered are for 1 kWp of PV panels and, assuming the installation of Li-ion batteries, for 1 kWh of storage.
The maintenance costs are expressed as yearly values that are proportional to the size of the component: 16 $/kWp/y for the PV, 3 $/kWh/y for batteries, and 3 $/kW/y for the power converters. On the other hand, for the fuel-fire generator the maintenance cost depends on the number of working hours, and is estimated at 15 c$/kW/h. Furthermore, the cost of diesel is assumed to be 0.8 $/L.
The efficiency of the diesel generator has been evaluated, both for OS and heuristic methodologies, as a piecewise function of the fuel consumption at different power conditions, which reaches a maximum of 33.4% efficiency at half of its rated power. The efficiencies for the conversion and storage system are instead simply evaluated as percentages, considering 96% and 99% for the inverter and DC-DC converter, respectively, and 96% as the roundtrip value for the battery.
Finally, the cost assumed for energy not served is 1 $/kWh.
5.4. Comparing Procedure
For the sake of clarity, Figure 4 depicts the overall procedure used to compare the heuristic approaches with the standard OS one, according to the formulations described in the previous sections. The heuristic methodologies, including the sensitivity over the operating strategy, are described in Section 3, whereas the ones of the OS is detailed in Section 2.
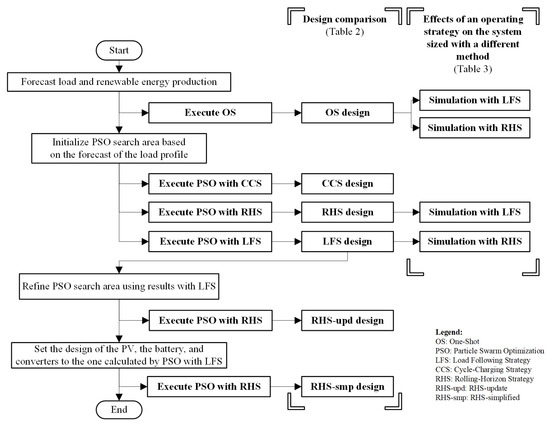
Figure 4.
Procedure to compare the heuristic optimization with one-shot, also including the cross-simulations with different operating strategies.
The optimal mini-grid design for the case study is firstly obtained with the MILP-based OS method, and then with PSO-based methods, both priority-based (LFS and CCS) and predictive (RHS). Subsequently, the design obtained with LFS is used to initialize the simplified procedures RHS-upd and RHS-smp by setting the refined search space boundaries reported in Table 1, and the resulting designs are added to the techno-economic comparison that is presented in Table 2. Furthermore, we also simulated the expected NPC in the case the system is sized according to a given operating strategy and then operated with a different approach. This may happen, for example, when a developer designs the system while using a simplified operating strategy and then an advanced operating strategy is later implemented, or vice-versa. Therefore, this comparison enables evaluating the potential benefits of simulating the actual operating system to avoid project failures.

Table 1.
Boundaries of the search space used for the heuristic optimization methods.
Table 2.
Optimal design of the mini-grid with one-shot (OS) and different heuristic optimization methods (load-following (LFS), Cycle-Charging (CCS), Rolling-Horizon Strategies (RHS), RHS-smp, and RHS-upd).
For this comparison, which is presented in Table 3, the CCS operating strategy has been neglected, because, as discussed in Section 6, its results are practically coincident with the ones obtained with LFS. Therefore, only the design obtained with LFS was simulated to be operated with RHS, and only the LFS strategy was applied to the sizings obtained with OS and RHS.
Table 3.
Simulations of the mini-grid designed with an operating strategy-LFS, RHS or OS-and operated with another strategy (LFS or RHS).
Similarly, only the design that was obtained with the standard RHS was used in the comparison, as the results of the RHS-based simplified strategies handed comparable results. In conclusion, we recall that, for the case of OS, the optimal dispatching is implicitly calculated along the sizing for each run; therefore, there is no OS operating strategy that can be simulated on the LFS and RHS designs; nevertheless, the optimal OS design has been simulated employing both LFS and RHS strategies.
5.5. Parameters for the Particle Swarm Optimization
The initial search space for the PSO is selected with respect to information of the load profile: the maximum size of the battery corresponds to the average daily demand (3 MWh), the maximum capacity (300 kW) of the inverter, and the fuel-fired generator is chosen slightly above the peak demand of the load (292 kW) and the limit (900 kW) on the size of the PV plant and its converter are chosen, so that the corresponding available energy production is 1.5 times the daily demand. The minimum size is null for every component, so that the methodology could avoid the installation of selected components. The lower and upper bounds are detailed in Table 1.
The tolerances were set at 0.1% for the PSO and at 1% for the mip-gap at every RHS iteration, while the max number of allowed stall iterations was set at 15. As for the number of particles generated by the PSO procedure at each iteration, corresponding to the number of different sizing scenarios simulated, was determined when considering 10 particles for each optimization variable, i.e., component to be sized; therefore, 50 particles have been employed for all strategies, except RHS-smp, which used 10.
The simulations were run on a a 12-core 2.66 GHz Xeon computer with 16 GB RAM.
6. Results and Discussion
The main results of the procedure that are described in Section 5.4 are depicted in Table 2 and Table 3. Table 2 describes the main results obtained with the MILP-based OS model and the PSO optimization procedure combined with LFS, CCS, RHS, including the proposed simplified methodologies, named RHS-upd and RHS-smp, based on SSU. On the other hand, Table 3 depicts the simulations developed to evaluate the drawbacks of using an operating strategy in the optimization phase that is different from the one of the final implementation. Figure 4 depicts the detailed description of these so-called cross-strategy simulations.
The results presented in Table 2 show that the advanced predictive approaches (RHSs) can not only achieve cheaper solutions than convergence-proven methodologies, or the MILP-based OS, but they can also reach convergence much faster than OS, given the desired convergence tolerance (5%). Furthermore, the proposed simplified approaches (RHS-upd and RHS-smp) can allow further significant reductions in execution time, with a negligible loss in terms of optimality of the solutions, which are still cheaper than the one found with OS.
It is worth noticing that, since OS optimizes both the design and operation together, its global optimum should represent the lowest value with respect to other operating strategies, if executed with a 0% optimality tolerance. However, in our simulations, due to computational constraints, the solution with OS was achieved with 5% of optimality, which explains why it is not the cheapest one. While OS outperforms LFS and CCS, obtaining a 2–3% cheaper solution, the strategies based on Rolling Horizon, including the simplified ones, produce the best results. This is remarkable, because, even if the OS was operated with a relatively high tolerance, thus preventing it from obtaining the theoretical optimal solution, its computational requirements are the highest, with a 6.7 h execution time, by far more than RHS (2.8 h), RHS-upd (1.8 h) and RHS-smp (0.18 h).
LFS and CCS are, on the other hand, the fastest executing strategies, requiring less than two minutes each, and providing very similar results. The similarity between LFS and CCS is confirmed by noticing that the optimal state-of-charge limit () in the optimization with CCS is just 2.8% higher than the minimum SOC (20%), thus suggesting that the function being optimized for LFS and CCS is practically the same. Therefore, despite implementing different management strategies for the diesel generator, as detailed in Section 3.3, the results that were obtained by LFS and CCS exhibit negligible differences. Hence, given the similarities of the results with CCS and the fact that it requires less optimization variables, since only applies to CCS, LFS has been considered as the representative of priority-based strategies in the present study, especially for the simulations in Table 3.
The very low computational time of LFS, which represents 1% of the time required by PSO to converge with RHS, confirms the rationality of using LFS to provide a “seed” solution for the proposed simplified design approaches described in Section 4. Furthermore, it can be noted that the sizing that was obtained with LFS is comparable to the one obtained with the predictive approaches, which strengthens the rationality of the approach.
In particular, the results of the simplified approaches (RHS-upd and RHS-smp) are very close to the results that were obtained with both the full RHS and OS, which suggests that they are good approximations of the full optimization strategy, but their savings in terms of computational requirements are significant, even up to a reduction of about 97.5% with respect to OS. In particular, RHS-upd and RHS-smp reduce by 33% and 94% the computational requirements of RHS. Furthermore, in the case of RHS-upd, the objective function is identical to the one of the full RHS, whereas, in RHS-smp, the result is slightly higher, but still lower than the OS one.
Moreover, according to the results presented in Table 2, it can be noted how RHS and RHS-upd have lower CAPEX than the LFS and CCS cases: the increased coordination achieved through predictive strategies leads to reducing the size of the components, especially for the fuel-fired generator, whose capacity is reduced by 40%, approximately. On the other side, OPEX in the RHS-upd case are not far from the optimizations with LFS and CCS values and they are very similar to the RHS case, in spite of a slight increase in generator usage. In the OS case, the reduction in CAPEX that is given by the smaller genset leads to the highest diesel participation in the generation mix, and eight times the level of curtailments with respect to RHS and RHS-upd. Interestingly, all RHS approaches and OS significantly reduce the load curtailment to about one-tenth the value with CCS or LFS.
In the RHS-smp, where the design of the renewable assets, the converters and the storage is set to the value obtained with LFS, the optimization affects only the design of the generator whose capacity is reduced by 42% respect to the one calculated with LFS. In addition to the slight CAPEX savings due to the reduced capacity of the generator, OPEX are reduced by 8.4% thanks to the higher coordination of components that was enabled by RHS, and load curtailment is almost one-tenth the LFS value.
Table 3, developed according to the procedure depicted in Figure 4, details the additional costs occurring when the design approach is performed using a different operating strategy with respect to the one that will be implemented in the control system of the mini-grid. The values of optimization procedures using LFS, RHS, and OS, as reported in Table 2, are considered the reference cases to compare the results of the proposed comparison.
The results show that operation with RHS can improve the performance of systems designed with priority-rules strategies, as it reduces the NPC by almost 2% with respect to the system designed and operated with LFS. Furthermore, it is worth noticing that, when RHS is used on the system designed with OS, the NPC increases by 1%, thus suggesting that the OS methodology can be used to approximate the real system that can only operate with rolling-horizon. In fact, while OS assumes the perfect knowledge of the entire behavior of the microgrid for the project lifespan, no control system can accurately forecast the demand for such time horizon and actual predictive operating systems usually operate with a smaller time horizons (i.e., a day or week). This suggests that the OS result is an asymptotic value and the proposed RHS strategy is very close to this value.
On the other hand, the results with LFS suggest that developers should avoid optimizing the system while using OS or RHS strategies when the microgrid is operated with LFS. In fact, the simulation using the LFS strategy on the system sized with RHS or OS leads to a sharp increase in costs by 10.2% and 15.4%, respectively, due to higher operative expenses and energy not served. In fact, systems designed with RHS and OS have a smaller fuel-fired generator is downsized with respect to the requirements of LFS. In fact, when that mismatch occurs and LFS is improperly use on the OS design, OPEX and load curtailment costs increase by 41.5% and 2.4% respectively with respect to the reference RHS design, and by 47.8% and 4% with respect to the reference OS design.
7. Conclusions
Aiming to guide researchers, developers and practitioners in the design and operation of mini-grids, this paper discusses a number of different deterministic formulations to size rural mini-grids and it also proposes a generalized procedure to reduce the computational burden when advanced operating strategies are used based on the Search Space Update. Furthermore, the document also highlights the importance of optimizing the system with the actual operating strategy to be implemented and evaluates the corresponding drawbacks if a mismatch occurs. A heuristic methodology combined with different operating strategies is compared with a standard optimization method that is based on Mixed-Integer Linear Programming, named one-shot (OS). Numerical simulations have been tailored on a case study in Kenya, and real load data have been used.
The results highlight that heuristic solvers can be useful tools that developers and researchers can effectively use to size mini-grids without compromising the optimality of results with respect to convergence-proven methods, like the MILP-based OS, especially when computational time restrictions apply. In fact, the heuristic approach combined with predictive operating strategies can reach even a cheaper solution than the standard OS with considerably less computational requirements, given the convergence tolerance. In particular, due to its fast run time (few minutes), the PSO methodology coupled with LFS and CCS can be suitable for the preliminary design of the system. However, when predictive strategies can be implemented in the actual system, the optimization process developed with RHS is advisable, as it achieves cheaper designs, at the cost of higher computational requirements that are anyway very compatible with time constraints of the most mini-grid projects.
The already low computational requirements by RHS, which are about half of the OS one, can be even decreased further by about 90% with the proposed simplified approaches with negligible differences in terms of optimality of the results. Therefore, the proposed techniques can be very suitable for mini-grids optimization and they could be applied for many different configurations.
The results of this activity recommend developers to accurately choose the simulation tool that complies with the operating strategy that will be implemented in the project, otherwise project costs may increase even beyond 10–15%. In fact, when a load-following operating strategy is simulated on a mini-grid sized with a predictive approach (RHS or OS), the NPC can increase even beyond 15% with respect to the NPC of the solutions with RHS or OS. On the other hand, RHS proved to be an efficient and versatile operating strategy, that leads to interesting savings, even if used in systems sized with traditional strategies, which suggests that upgrading the control system of existing mini-grids to include predictive methodologies can prove useful. Furthermore, when applied on the OS solution, RHS also proved to approximately reproduce the results of OS, which represents a theoretical optimum difficult to achieve in practice as the time horizons of actual control systems is usually much smaller than the time horizon of the design optimization.
This activity can support practitioners in the selection of the sizing tool that should cope with the actual operating strategy of the project, which can enhance the financial sustainability of mini-grid projects. Furthermore, the proposed methodology can be directly used by developers in order to speed up the design phase of a project, but can also suggest further improvements of actual commercial tools or approaches in development stage. Nonetheless, this paper can lay the foundations for further analyses and investigation also in different contexts, not only limited on rural electrification of developing countries, as the proposed methodologies can be easily generalized.
Author Contributions
Conceptualization, A.M., P.D.-M., D.F. and P.C.; methodology, D.F.; software, D.F.; validation, P.C. and D.F.; data curation, A.M.; writing—original draft preparation, P.C., D.F; writing—review and editing, P.C., D.F., A.M. and P.D.-M.; supervision, A.M. and P.D.-M. All authors have read and agreed to the published version of the manuscript.
Funding
This research received no external funding.
Conflicts of Interest
The authors declare no conflict of interest.
Abbreviations
The following abbreviations are used in this manuscript:
| CAPEX | Capital Expenditures |
| CCS | Cycle Charging Strategy |
| EV | Electric Vehicle |
| LFS | Load Following Strategy |
| MILP | Mixed-Integer Linear Programming |
| NPC | Net Present Cost |
| OPEX | Operational Expenditures |
| OS | One-Shot |
| PSO | Particle Swarm Optimization |
| RHS | Rolling Horizon Strategy |
| SSU | Search Space Update |
| SDG | Sustainable Development Goal |
| SOC | State Of Charge |
References
- Phimister, E.; Vera-Toscano, E.; Roberts, D. The Dynamics of Energy Poverty: Evidence from Spain. Econ. Energy Environ. Policy 2015, 4, 153–166. [Google Scholar] [CrossRef]
- Winkler, H.; Simões, A.F.; la Rovere, E.L.; Alam, M.; Rahman, A.; Mwakasonda, S. Access and Affordability of Electricity in Developing Countries. World Dev. 2011, 39, 1037–1050. [Google Scholar] [CrossRef]
- Onyeji, I.; Bazilian, M.; Nussbaumer, P. Contextualizing electricity access in sub-Saharan Africa. Energy Sustain. Dev. 2012, 16, 520–527. [Google Scholar] [CrossRef]
- United Nations; UN General Assembly. Transforming our World: The 2030 Agenda for Sustainable Development; Division for Sustainable Development Goals: New York, NY, USA, 2015. [Google Scholar]
- IEA. SDG7: Data and Projections. Available online: https://www.iea.org/reports/sdg7-data-and-projections (accessed on 6 May 2020).
- IEA; IRENA; UNSD; World Bank; WHO. Tracking SDG7: The Energy Progress Report 2020; World Bank: Washington, DC, USA, 2020; p. 171. [Google Scholar]
- Hubble, A.H.; Ustun, T.S. Composition, placement, and economics of rural microgrids for ensuring sustainable development. Sustain. Energy Grids Netw. 2018, 13, 1–18. [Google Scholar] [CrossRef]
- Franz, M.; Peterschmidt, N.; Rohrer, M.; Kondev, B. Mini-Grid Policy Toolkit; Technical Report; EUEI-PDF, ARE and REN21; European Union Energy Initiative Partnership Dialogue Facility (EUEI PDF): Eschborn, Germany, 2014. [Google Scholar]
- RES4Africa Foundation; Field Studies for Mini-Grid Optimization International Research Group; ERM; FAO; RINA; PwC. RE-Thinking Access to Energy Business Models. Ways to Walk the Water-Energy-Food Nexus Talk in Sub-Saharan Africa; Gangemi Editore: Rome, Italy, 2019. [Google Scholar]
- ESMAP. Mini Grids for Half a Billion People: Market Outlook and Handbook for Decision Makers. Executive Summary; Energy Sector Management Assistance Program (ESMAP) Technical Report 014/19; World Bank: Washington, DC, USA, 2019. [Google Scholar]
- International Renewable Energy Agency (IRENA). Innovation Outlook: Renewable Mini-Grids; International Renewable Energy Agency: Abu Dhabi, UAE, 2016; p. 184. [Google Scholar]
- IRENA. Global Renewables Outlook: Energy Transformation 2050, 2020th ed.; International Renewable Energy Agency: Abu Dhabi, UAE, 2020. [Google Scholar]
- Ambrose, H.; Gershenson, D.; Gershenson, A.; Kammen, D. Driving rural energy access: A second-life application for electric-vehicle batteries. Environ. Res. Lett. 2014, 9. [Google Scholar] [CrossRef]
- Goel, S.; Sharma, R. Performance evaluation of stand alone, grid connected and hybrid renewable energy systems for rural application: A comparative review. Renew. Sustain. Energy Rev. 2017, 78, 1378–1389. [Google Scholar] [CrossRef]
- Barley, C.D.; Winn, C.B. Optimal dispatch strategy in remote hybrid power systems. Sol. Energy 1996, 58, 165–179. [Google Scholar] [CrossRef]
- HOMER Energy. HOMER Pro Version 3.13 User Manual. Available online: https://www.homerenergy.com/products/pro/docs/latest/index.html (accessed on 6 May 2020).
- Mandelli, S.; Barbieri, J.; Mereu, R.; Colombo, E. Off-grid systems for rural electrification in developing countries: Definitions, classification and a comprehensive literature review. Renew. Sustain. Energy Rev. 2016, 58, 1621–1646. [Google Scholar] [CrossRef]
- Siddaiah, R.; Saini, R.P. A review on planning, configurations, modeling and optimization techniques of hybrid renewable energy systems for off grid applications. Renew. Sustain. Energy Rev. 2016, 58, 376–396. [Google Scholar] [CrossRef]
- Bernal-Agustín, J.L.; Dufo-López, R. Simulation and optimization of stand-alone hybrid renewable energy systems. Renew. Sustain. Energy Rev. 2009, 13, 2111–2118. [Google Scholar] [CrossRef]
- Energy 4 Impact; INENSUS. Billing, Revenue Collection and Metering Models for Mini-Grids; Technical Report April; Green Mini-Grid Help Desk. 2019. Available online: https://www.energy4impact.org/file/2098/download?token=EcIaPTX_ (accessed on 25 April 2020).
- Barsali, S.; Giglioli, R.; Giuntoli, M.; Lutzemberger, G.; Poli, D. Control strategies and real time operation of storage systems integrated with MV photovoltaic plants. In Proceedings of the 2015 IEEE 15th International Conference on Environment and Electrical Engineering, EEEIC 2015-Conference Proceedings, Rome, Italy, 10–13 June 2015; Institute of Electrical and Electronics Engineers Inc.: Piscataway, NJ, USA, 2015; pp. 243–248. [Google Scholar] [CrossRef]
- Mandelli, S.; Colombo, E.; Merlo, M.; Brivio, C. A methodology to develop design support tools for stand-alone photovoltaic systems in developing countries. Res. J. Appl. Sci. Eng. Technol. 2014, 8, 778–788. [Google Scholar] [CrossRef]
- Al-falahi, M.D.; Jayasinghe, S.D.; Enshaei, H. A review on recent size optimization methodologies for standalone solar and wind hybrid renewable energy system. Energy Conv. Manag. 2017, 143, 252–274. [Google Scholar] [CrossRef]
- Erdinc, O.; Uzunoglu, M. Optimum design of hybrid renewable energy systems: Overview of different approaches. Renew. Sustain. Energy Rev. 2012, 16, 1412–1425. [Google Scholar] [CrossRef]
- Liu, Y.; Yu, S.; Zhu, Y.; Wang, D.; Liu, J. Modeling, planning, application and management of energy systems for isolated areas: A review. Renew. Sustain. Energy Rev. 2018, 82, 460–470. [Google Scholar] [CrossRef]
- Graham, V.A.; Hollands, K.G.T. A method to generate synthetic hourly solar radiation globally. Sol. Energy 1990, 44, 333–341. [Google Scholar] [CrossRef]
- Gambino, V.; Del Citto, R.; Cherubini, P.; Tacconelli, C.; Micangeli, A.; Giglioli, R. Methodology for the Energy Need Assessment to Effectively Design and Deploy Mini-Grids for Rural Electrification. Energies 2019, 12, 574. [Google Scholar] [CrossRef]
- Riva, F.; Ahlborg, H.; Hartvigsson, E.; Pachauri, S.; Colombo, E. Electricity access and rural development: Review of complex socio-economic dynamics and causal diagrams for more appropriate energy modelling. Energy Sustain. Dev. 2018, 43, 203–223. [Google Scholar] [CrossRef]
- Twaha, S.; Ramli, M.A. A review of optimization approaches for hybrid distributed energy generation systems: Off-grid and grid-connected systems. Sustain. Cities Soc. 2018, 41, 320–331. [Google Scholar] [CrossRef]
- Sörensen, K. Metaheuristics-the metaphor exposed. Int. Trans. Oper. Res. 2015, 22, 3–18. [Google Scholar] [CrossRef]
- Brenna, M.; Falvo, M.C.; Foiadelli, F.; Martirano, L.; Poli, D. From Virtual Power Plant (VPP) to Sustainable Energy Microsystem (SEM): An opportunity for buildings energy management. In Proceedings of the 2015 IEEE Industry Applications Society Annual Meeting, Addison, TX, USA, 18–22 October 2015; Volume 6, pp. 1–8. [Google Scholar] [CrossRef]
- Carrión, M.; Arroyo, J.M. A computationally efficient mixed-integer linear formulation for the thermal unit commitment problem. IEEE Trans. Power Syst. 2006, 21, 1371–1378. [Google Scholar] [CrossRef]
- Li, B.; Roche, R.; Miraoui, A. Sizing of a stand-alone microgrid considering electric power, cooling/heating and hydrogen. In Proceedings of the 2017 IEEE Manchester PowerTech, Manchester, UK, 18–22 June 2017; IEEE: Piscataway, NJ, USA, 2017; pp. 1–6. [Google Scholar] [CrossRef]
- Malheiro, A.; Castro, P.M.; Lima, R.M.; Estanqueiro, A. Integrated sizing and scheduling of wind/PV/diesel/battery isolated systems. Renew. Energy 2015, 83, 646–657. [Google Scholar] [CrossRef]
- Fioriti, D.; Poli, D.; Cherubini, P.; Lutzemberger, G.; Micangeli, A.; Duenas-Martinez, P. Comparison among deterministic methods to design rural mini-grids: Effect of operating strategies. In Proceedings of the IEEE PowerTech 2019, Milan, Italy, 23–27 June 2019; pp. 1–6. [Google Scholar] [CrossRef]
- Mazzola, S.; Vergara, C.; Astolfi, M.; Li, V.; Perez-Arriaga, I.; Macchi, E. Assessing the value of forecast-based dispatch in the operation of off-grid rural microgrids. Renew. Energy 2017, 108, 116–125. [Google Scholar] [CrossRef]
- Chauhan, A.; Saini, R.P. A review on Integrated Renewable Energy System based power generation for stand-alone applications: Configurations, storage options, sizing methodologies and control. Renew. Sustain. Energy Rev. 2014, 38, 99–120. [Google Scholar] [CrossRef]
- Ahmad Khan, A.; Naeem, M.; Iqbal, M.; Qaisar, S.; Anpalagan, A. A compendium of optimization objectives, constraints, tools and algorithms for energy management in microgrids. Renew. Sustain. Energy Rev. 2016, 58, 1664–1683. [Google Scholar] [CrossRef]
- Fioriti, D.; Lutzemberger, G.; Poli, D.; Micangeli, A.; Duenas-Martinez, P. Optimal design of off-grid power systems operated by a rolling-horizon strategy: A method to reduce computational requirements. In Proceedings of the 5th International Forum on Research and Technologies for Society and Industry: Innovation to Shape the Future, RTSI 2019-Proceedings, Florence, Italy, 9–12 September 2019; pp. 202–207. [Google Scholar] [CrossRef]
- Moretti, L.; Astolfi, M.; Vergara, C.; Macchi, E.; Pérez-Arriaga, J.I.; Manzolini, G. A design and dispatch optimization algorithm based on mixed integer linear programming for rural electrification. Appl. Energy 2019, 233–234, 1104–1121. [Google Scholar] [CrossRef]


© 2020 by the authors. Licensee MDPI, Basel, Switzerland. This article is an open access article distributed under the terms and conditions of the Creative Commons Attribution (CC BY) license (http://creativecommons.org/licenses/by/4.0/).