1. Introduction
Energy consumption has increased considerably in the past quarter of a century. Economic development, which includes improving living standards and the progress of science and technology, is considered to be a key driver of this sudden surge in energy use. However, economic development is impacting energy consumption differently. This is related to the processes driving economic development, which differ from one region to another [
1]. This issue of energy consumption in correlation with the evolution of GDP (economic growth) and demographic size (urbanization) has been addressed in numerous research articles (e.g., [
2,
3,
4,
5]). It is generally accepted that there is an increase in energy consumption alongside increasing living standards (per capita GDP). In addition, [
1] it is pointed out that in the developing countries with a low GDP per capita, a higher increase in energy consumption is noticed during economic expansion periods, while in developing countries a slower growth occurs during such timeframes. By applying specific tests (e.g., panel cointegration, panel unit root, Granger causality), [
6] it was found that, among the largest IMF-advanced economies in the world, capital formation, energy consumption and the real GDP are co-integrated, and that the former two positively impact the real GDP in the long run.
The relationships between urbanization and energy consumption showed that an accelerated urbanization process plays an important part in energy consumption in many areas of the world, but little attention has been paid to the territorial differences [
7]. Furthermore, the results of various studies are divergent, making it very difficult to establish a precise relationship between energy consumption and urbanization, while some studies performed in developed regions highlighted the positive effects of urbanization on energy consumption, other studies argued quite the opposite. The positive effects pinpointed that the population size and the age structure influenced energy consumption as well as economic development and urbanization [
8]. Several papers (e.g., [
9,
10]) assess the relationships between energy consumption, financial development, economic growth, industrialization and urbanization in low, middle and high-income countries, and their results confirm the existence of long-running relationships among these variables, trends and processes. The links between the urbanization level, the level of pollution and energy consumption are analyzed in Middle East and North Africa (MENA) countries [
11], as well as in China [
12]. Some, on the one hand, papers examine the relationships between demographic changes, urban development and specific features of transport [
13] and on the other hand some empirically investigate the effects of urbanization on residential energy consumption [
14]. Other studies show that the process of urbanization substantially impacted energy consumption and the efficiency of energy use (by decreasing it), while doing more than that; energy inefficiency is correlated more with urbanization in countries with a higher gross domestic product per capita. Only recently has attention been granted to the energy-related behavior of different age groups. The study of the link between population aging and energy demand is even more important for Europe because its energy dependence is almost complete and its population is aging at an alarming rate. As a result of a less active lifestyle, elderly people have a higher energy demand for heating and electricity [
15]. The economics literature almost universally predicts the following situation: older households spend more on energy, especially on heating energy, because their members are at home for a larger proportion of the day and they usually need more heating comfort. [
16]
We may therefore summarize that the effects/consequences of urbanization on energy consumption are heterogeneous, the differences being driven by the differences between countries and/or regions in terms of the structure of the energy industry, the stages of development of each of them, the infrastructure, the characteristics of urbanization [
17,
18].
At territorial level, the links between population density and energy consumption were studied. Thus, [
19] shows that energy efficiency increases in densely populated areas. Consequently, within a city, if the population density doubles, the efficiency of energy consumption increases by 12%. Other studies investigate the impact of GDP, demographic growth and energy consumption on CO
2 emissions in several populated and very dynamic Asian countries in terms of economic development (e.g., China, India, Malaysia, [
20,
21,
22,
23]) or in Australia [
24]). Some papers include in the analysis performed the indicators reflecting the international trade and transport sectors [
3,
25]. Many studies show that the relationships between population density and energy consumption are more complex if the variable “CO
2 emissions” and socio–economic factors are included into the short- and long term-statistical analysis. As a result, the increasing complexity of the analysis reveals that population density is proving to be a major factor in shaping energy consumption and, therefore, CO
2 emissions.
Moreover, population evolution and energy consumption influence each other, each acting as a cause and effect in relation to the other. Thus, energy consumption has an effect on population growth. Population growth has effects on increasing energy consumption [
26]. Zabel hypothesizes that “…the Earth’s population is ultimately determined by the availability of energy resources, and if some of those energy resources are at or near their peak rates of production, then that may affect rates of population growth. If the correlation is strong enough, the number of people the Earth can support may also be at or near its peak” [
26]. According to Holdren’s study (1991) [
27], this is due to the structure of the settlement system and the type of energy resources on which a nation depends. At the same time, he suggests that demographic change may lead companies to create plans for the efficient use of energy resources.
There is also an increase in the efficiency of energy consumption, both in terms of population consumption and as a result of structural changes undergone by the economy. If an industrialized country’s energy consumption at the national level is very high, residential energy consumption is low (as a share of total energy consumption). In developing countries, energy consumption is constantly increasing due to the growing demand for energy for the population [
1]. Here, too, structural changes in the economy are visible in increasing energy efficiency.
Feng et al. [
28] investigate the long-term temporal and underlying relationships between the structure of energy consumption and economy, and the energy intensity in a growing economy, such as China’s economy. The results have significant implications in terms of energy consumption and conservation, as well as economic development: the need to reduce the share of non-renewable resources (e.g., coal) in the structure of energy consumption is insinuated, as is the need that these resources be used efficiently when unavoidable, while promoting the modernization of the economic structure. At the same time, the authors emphasize the importance of complete analyses on the relationships between the structure of the economy and of energy consumption, in order to develop energy policies.
Analyzing the link between global energy consumption, the type of fuel used and capitalized resources and economic sectors on the one hand, and the environmental impact of global energy consumption, on the other hand, [
29] elucidates a close relationship between energy consumption and economic growth. Extensive research (comprising 125 countries) on the population impact, wealth (affluence) and technology on CO
2 emissions between 1990 and2011 shows that the degree of influence on carbon emissions varies according to income levels, while two models stand out: higher revenue drives the greater impact of technology and a lower impact of wealth on carbon emissions; lower income makes wealth the factor with the greatest impact on CO
2 emissions, and technology the element with the lowest impact [
30].
The population of the European Union countries is undergoing a continuous aging process. There is reason to believe that a high percentage of an elderly population leads to higher energy consumption. The elderly population have more energy consumers (such as cars) than the young population. Moreover, countries with a high percentage of elderly population also change their economic structure in different ways (to meet the demand for products and services needed by the population in this age group), which impacts energy consumption. That is why it is critical to estimate the effects of the increased percentage of the population in this age group on energy consumption. For more information on the links between energy strategies and their pressure on population evolution, see [
31].
Another issue discussed is how energy needs are met with a view to developing modern economies. Here we consider the two types of resources: renewable and non-renewable energy. The way in which a state or a region combines the two types of resources could be a restrictive factor for economic growth, along with production factors (labor and capital) [
32]. In addition, as natural energy resources are not evenly distributed, it may impose constraints on economic growth in certain areas, removing the positive influence of technological progress. This is why it is important to use renewable energy resources that allow for the sustainable growth of the economy, even if natural energy resources, non-renewable resources, are limited. If economic productivity and population evolution are affected by unsustainable energy use or (restrictive) environmental policies, the effects can be long-lasting [
32]. At the same time, the efficient use of energy resources needs high economic growth levels [
33].
2. Data and Methodology
Knowing the energy consumption according to final consumption sectors at national level, we aim to assess the energy consumption at county level using the share of population at county level within the total population, but also the share held by each county in the energy-consuming economic activities. As a proxy for economic activity we used the share of the economically active population by activities of the national economy.
We grouped the variables (indicators) in two categories: demographic (share of urban population, population size, share of population aged 65 and over, the economically active population by activities of the national economy: agriculture, industry, transport), and economic (GDP per capita, residential energy consumption, energy consumption by activities of national economy: agriculture, industry, transport). The economic indicators are available at national level (except the GDP per capita, which is available at county level), while the demographic indicators are available at county level.
In the first stage, we determined the energy consumption at county level, by knowing the importance of indicators at national level for each year (1995, 2000, 2005, 2010, 2015) and for each county, using the following equation:
where
IN is the national level indicator (demographic or economic),
IC is the county level indicator,
EcN is the energy consumption (national level), and
EcC is the energy consumption (county level).
When we use the size of the population in the equation, we find out the residential energy consumption, and when the data refer to the economically active population divided by activity of national economy we obtain the energy consumption by activities of national economy.
Consequently, the energy consumed in an economic activity at county level is related to the share of the active population in the economic activity held by the respective county from the active population at national level. The same situation applies to the energy consumed by households which is related to the share of the resident population. Therefore, we refer to an average consumption per person (active or resident population).
We used the data obtained from the above calculations in the second stage, by means of multivariate analysis. The Hierarchical Ascending Classification (HAC) (using the Philcarto software) groups the spatial units (counties) according to the similarities between the values of the indicators, providing information about their typology. Thus we intended to highlight the links between energy consumption by the activities of the national economy and the standard of living (GDP/capita), population agglomeration (percentage of urban population) and the propensity for energy consumption of a group of population (population aged 65 years and over). To the above specified variables we added the percentage of the economically active population by activities of the national economy (agriculture, industry, construction and transport) of the total active population, as well as the share of energy consumption (as determined by the authors) for the final energy consumption (the remaining difference up to 100% being represented by the energy consumption from service activities).
With the help of HAC, the indicators were grouped into classes by reference to the mean value using standard deviation. Calculating the standard deviation (which represents the square root of the variation) helps estimate the dispersion for each variable. HAC allows the creation of an exact hierarchy on a large data set according to the following data aggregation strategy: minimum linkage, minimum diameter, average distance, variation. HAC helped us visualize the profiles of the counties and draw conclusions on how the indicators and the counties with the same profile were grouped [
34,
35,
36,
37,
38].
Minimum linkage or nearest neighbor clustering is a hierarchical technique with a wide spread in research fields such as health, economics, and regional development. To calculate the distance between two clusters, the distance between their closest members is used [
39].
The weighted pair-group method (average distance) was applied to all clusters members for differentiating between two clusters, according to the following algorithm: the arithmetic averages of the distance between the two clusters is calculated as the average of distances between all members of two clusters [
40]. Thus, the number of members in each cluster is not important, each pair of members that merge at the level of the two clusters having equal weight [
40].
The point where the binary tree is cut in order to form clusters is named cluster cutoff. A dendrogram is interpreted as follows: the farther the joining points between the subtrees (clusters) are, the more similar the subtrees are [
41]. The hierarchical cluster analysis (HCA) is a statistical technique producing, as a result sequentially pairing members by cluster composition. The HCA has in view the pairing members algorithm by which result increasingly large clusters and, finally, all members are clustered in a single group. This analysis differs from other cluster analyses in that a single set of mutually exclusive and exhaustive clusters is formed. The class-inclusion relationships between the clusters and the value of the grouping criterion associated with each are shown by the dendrogram [
42]. Hierarchical cluster analysis identifies a range of clusters based on a measure of intra-cluster homogeneity of each cluster and inter-cluster heterogeneity [
43].
A dendrogram includes quantitative values of the similarity or distance at which clusters are fused together in each agglomerative stage [
44]. We must mention, however, that due to the fact that the predicted property value for a cluster is the average of all of the other compounds in the group, the predictive ability is generally low if very few groups are identified [
44].
To calculate the distance between two clusters, the correlation between these is used [
45]:
D=1 − C, where D = Distance and C = correlation between clusters.
When correlation value is close to 1 (highly correlated clusters), the distance is close to 0, when correlation value is close to 0 (not correlated clusters), the distance is close to 1 and when correlation value is close to −1 (negatively correlated clusters), the distance is close to 2 [
45]. At the bottom of the dendrogram are placed the highly correlated classes.
4. Results and Discussions
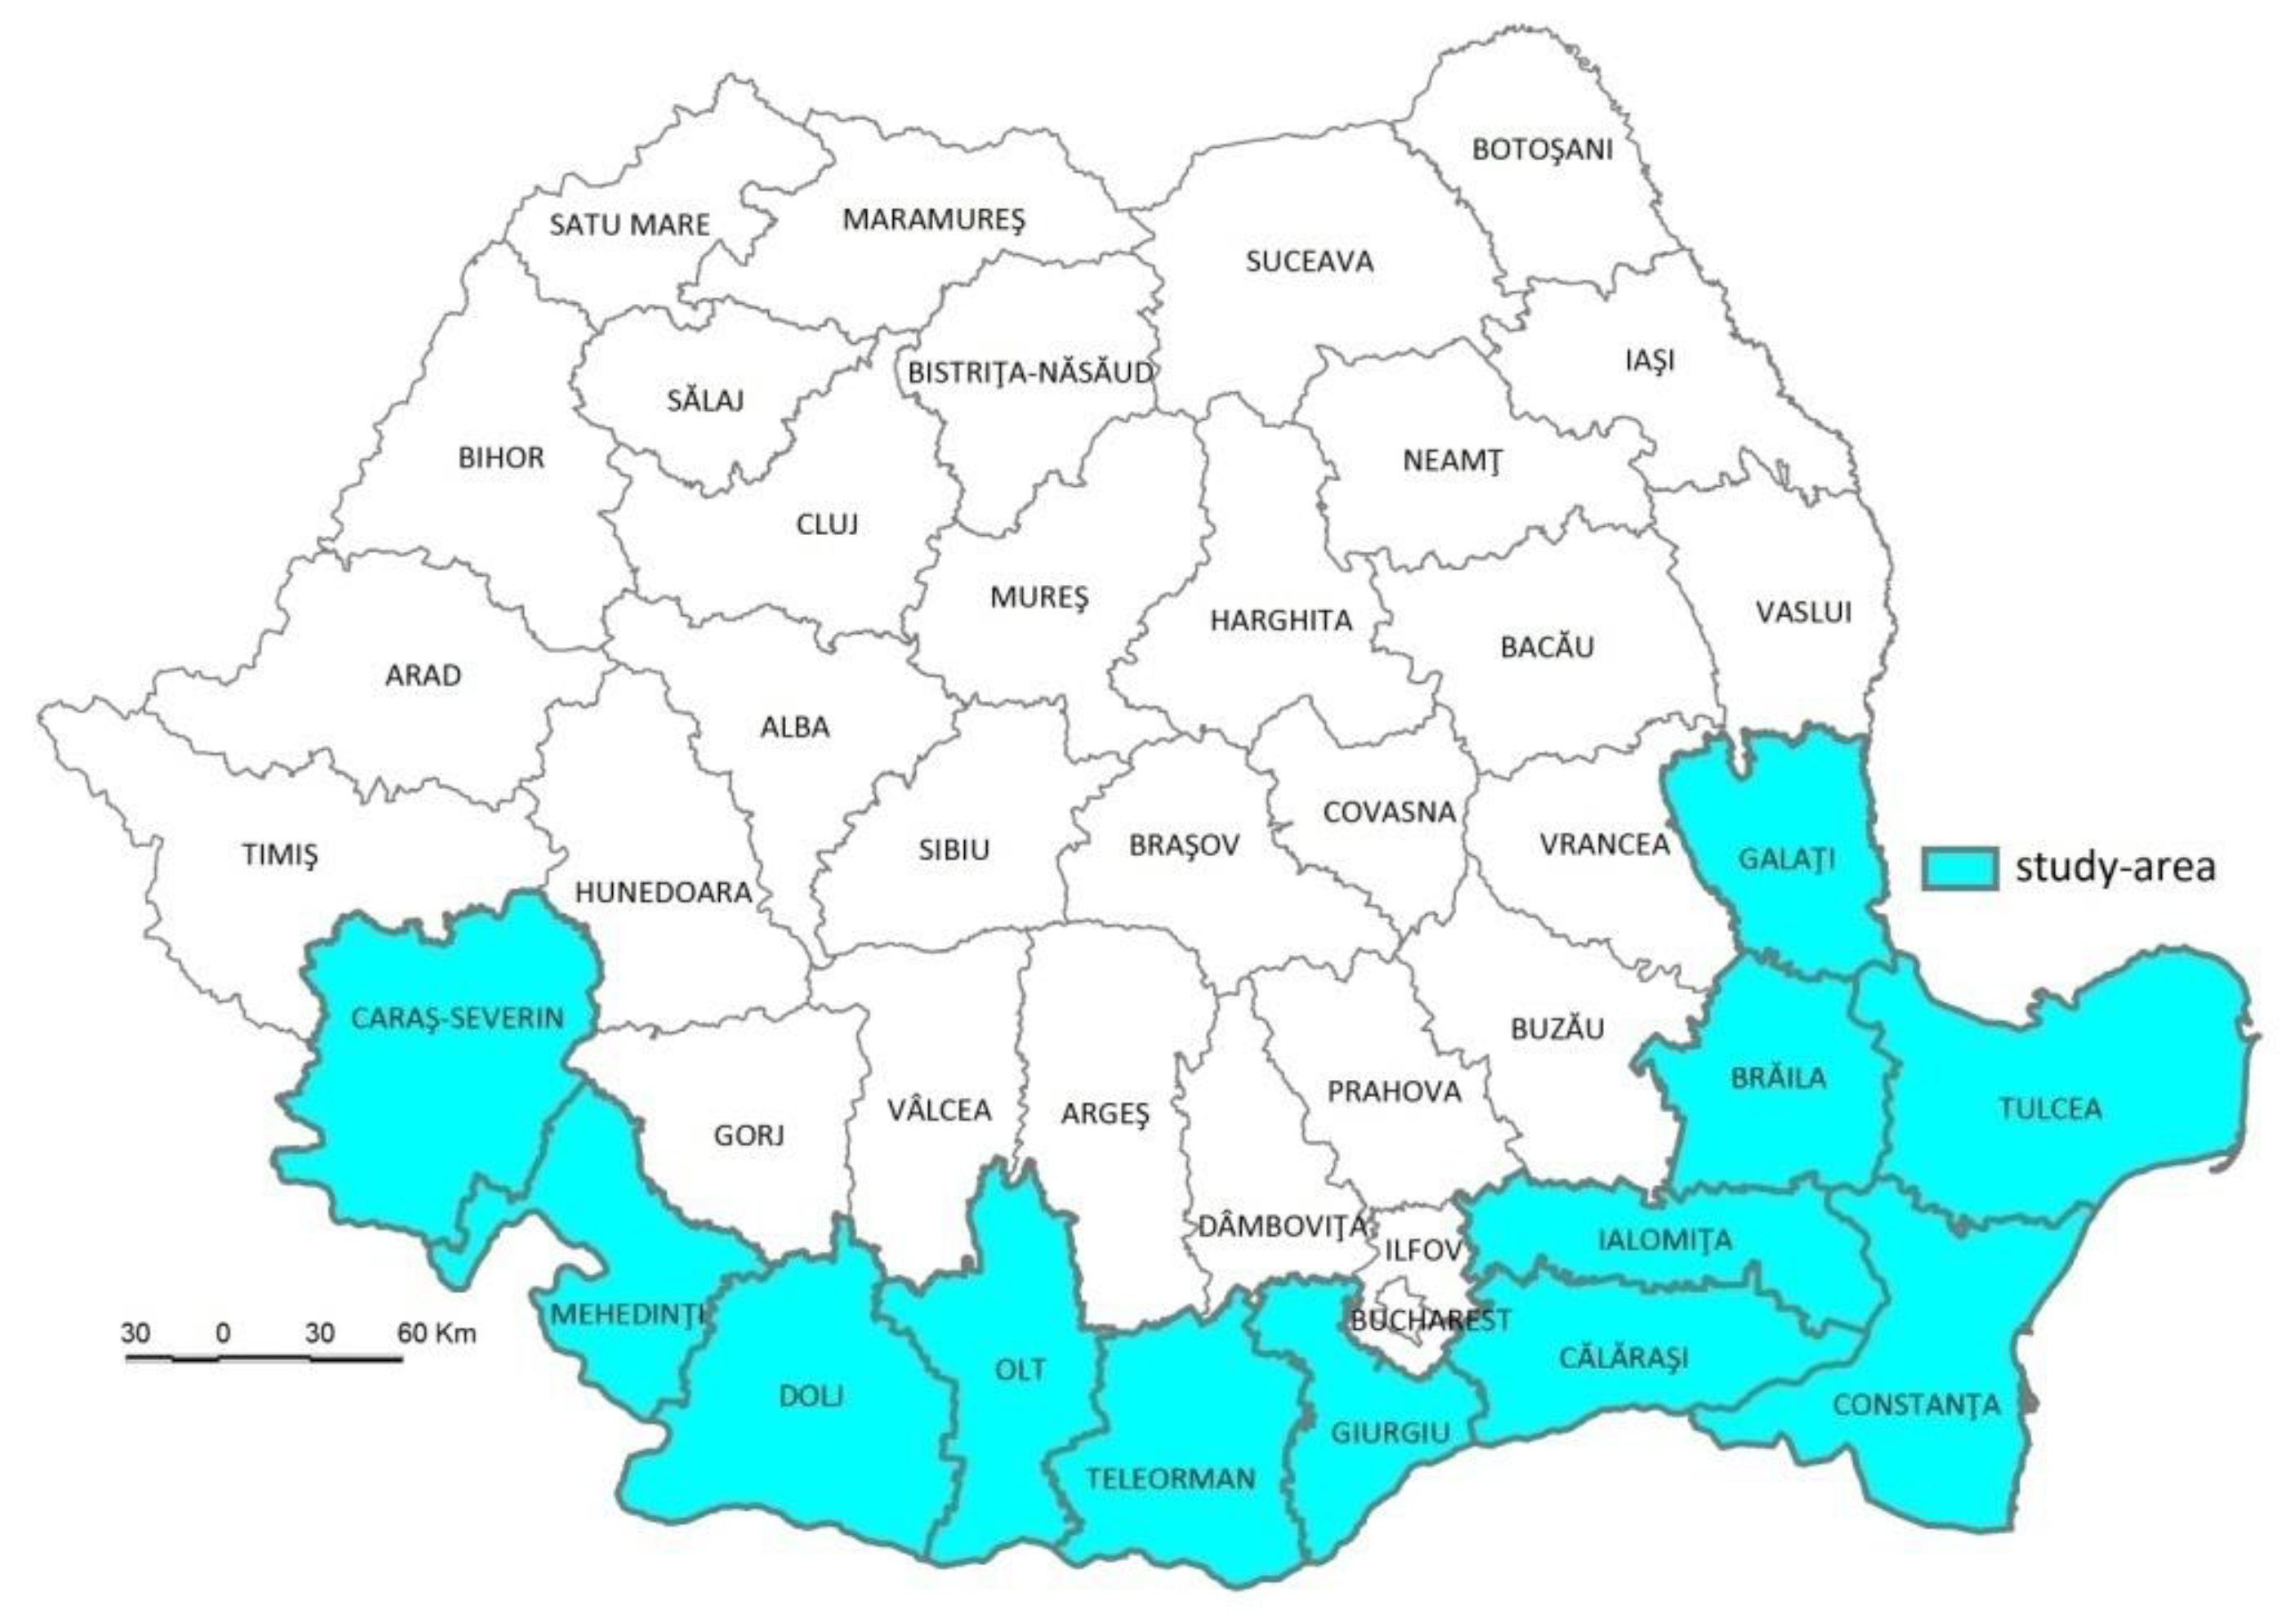
The evolution of demographic indicators can provide information on the evolution of energy consumption. In the period 1995–2015, the total population of Romania decreased by 3.5%, from 23.06 million inhabitants to 22.3 million inhabitants. During the same period, the population of the counties located along the Romanian Danube Valley registered a decrease of 7.2%. A total of 75% of the counties inside of the studied area had a population of under 0.5 million inhabitants, compared to the nationwide status, where 60% of counties had less than 0.5 million inhabitants.
These less populated counties generally had a low degree of urbanization, ranking below the national level. The degree of urbanization increased in Romania from 54.9% in 1995 to 56.7% in 2010, reaching 56.5% in 2015. The counties with a low degree of urbanization in the study area had an evolution above the national average in terms of increasing the share of urban population (even by 6.5%). This process can be attributed to the transition of some rural localities towards being raised to town status in 2004 leading to an increase in the share of urban population by 1.3%. In addition, the decline in urban population has been slower than in rural areas between 2005 and 2015.
Romania’s population is undergoing an aging process. The percentage of the population aged 65 and over increased from 11.7% in 1995 to 15.3% in 2015. Only three counties in the analyzed area had shares of elderly population below the national average (by 2–3%), the other counties exceeding the national average by 1, reaching 6.5%.
The evolution of economic indicators. In the 1990s, Romania went through a period of profound economic transformation, which was reflected in the decline in GDP per capita. Many high-capacity industrial units were closed and the excess labor force could not be absorbed by the labor market. Thus, the unemployment rate increased (to 9.5% in 1995 and to 10.5% in 2000) and the impoverishment of the population was evident (see [
35]). The GDP per capita was about 1500–1600 USD between 1995–1999. The economic growth which started in 2000 led to significant increases of GDP per capita that exceeded 3500 USD in 2005, 5500 USD in 2010 and 7000 USD in 2015 (National Institute of Statistics). The intra-regional variation is one of the economic characteristics of the Romanian Danube Valley [
47], the GDP per capita being one of the indicators showing an uneven distribution. In 1995 only three counties registered values higher than the national average: (Ialomița, Galați and Constanța) but since 2000, only Constanța has found itself in this situation.
Spatial distribution of the selected indicators.
By running the HAC, the counties located along the Danube Valley fall within the following classes, slightly different for each analyzed year.
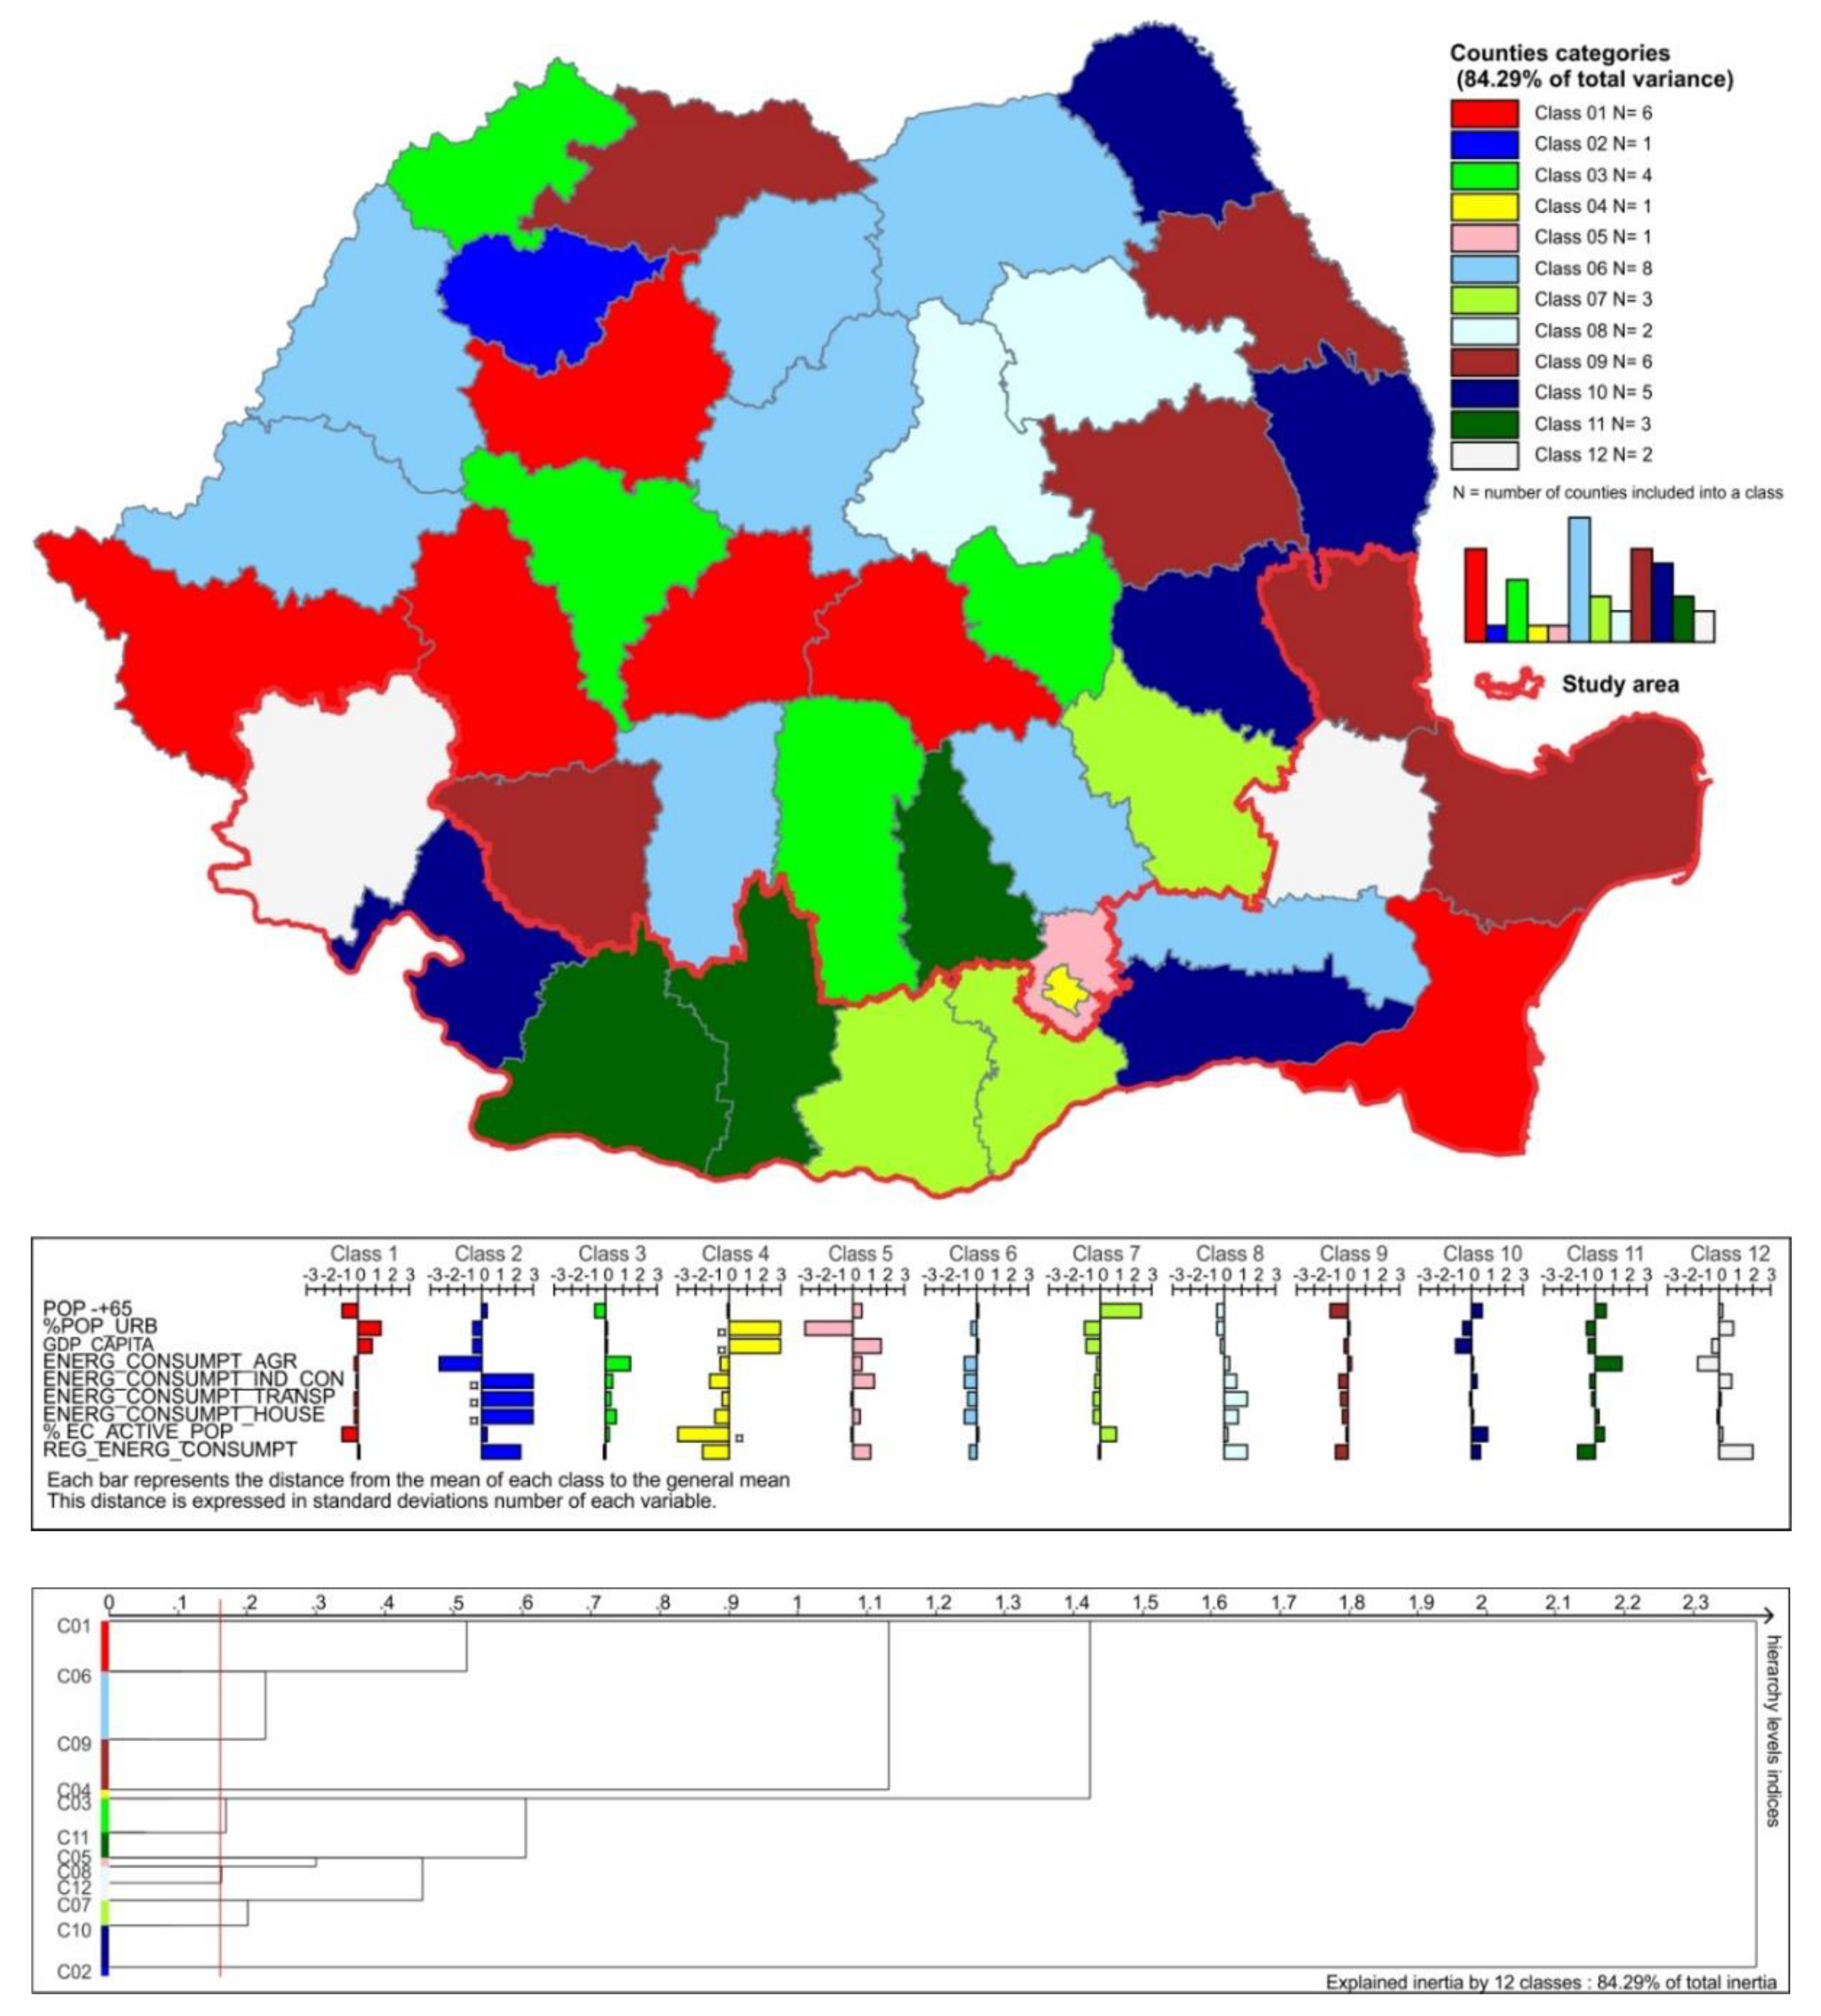
In 1995, the counties in the central sector of the Danube Valley had a share of the elderly population above the national average, and the percentage of the urban population was generally below average. The GDP/capita generally fell below average, while the energy consumption in agriculture was above the average or close to the average. Some of the counties at the extremities of the analyzed area registered above average energy consumption in industry or transport, and the residential energy consumption was slightly overstated. The counties in the western and central parts had shares of economically active population in the four economic activities above the national average (
Figure 2). As mentioned above, the dendrogram is the graphical representation of the clustering. Usually, it is drawn backward, starting from the cluster (the final cluster) which contains all members and from similarity 0 [
51,
52] The similarity increases as the final cluster splits in the two parent clusters and so on [
51,
52]. Observing the dendrogram we realized that the class 12 and class 9 are very similar, and class 2 is different from all the others.
Because the purpose of our study was to emphasize that a certain economic structure influences a specific final energy consumption, we chose a larger number of classes (clusters). As indicated above, hierarchical clustering algorithms are based on intra-cluster similarities. By successively increasing the number of classes, intra-cluster similarities increased, and we obtained more homogeneous and better differentiated classes of counties. We opted for 12 classes from analyzing the dendrogram. At the same time, we kept a lot of information from the data used (over 80% of the total variance) in the dendrogram below, and we chose a distance of 0.2.
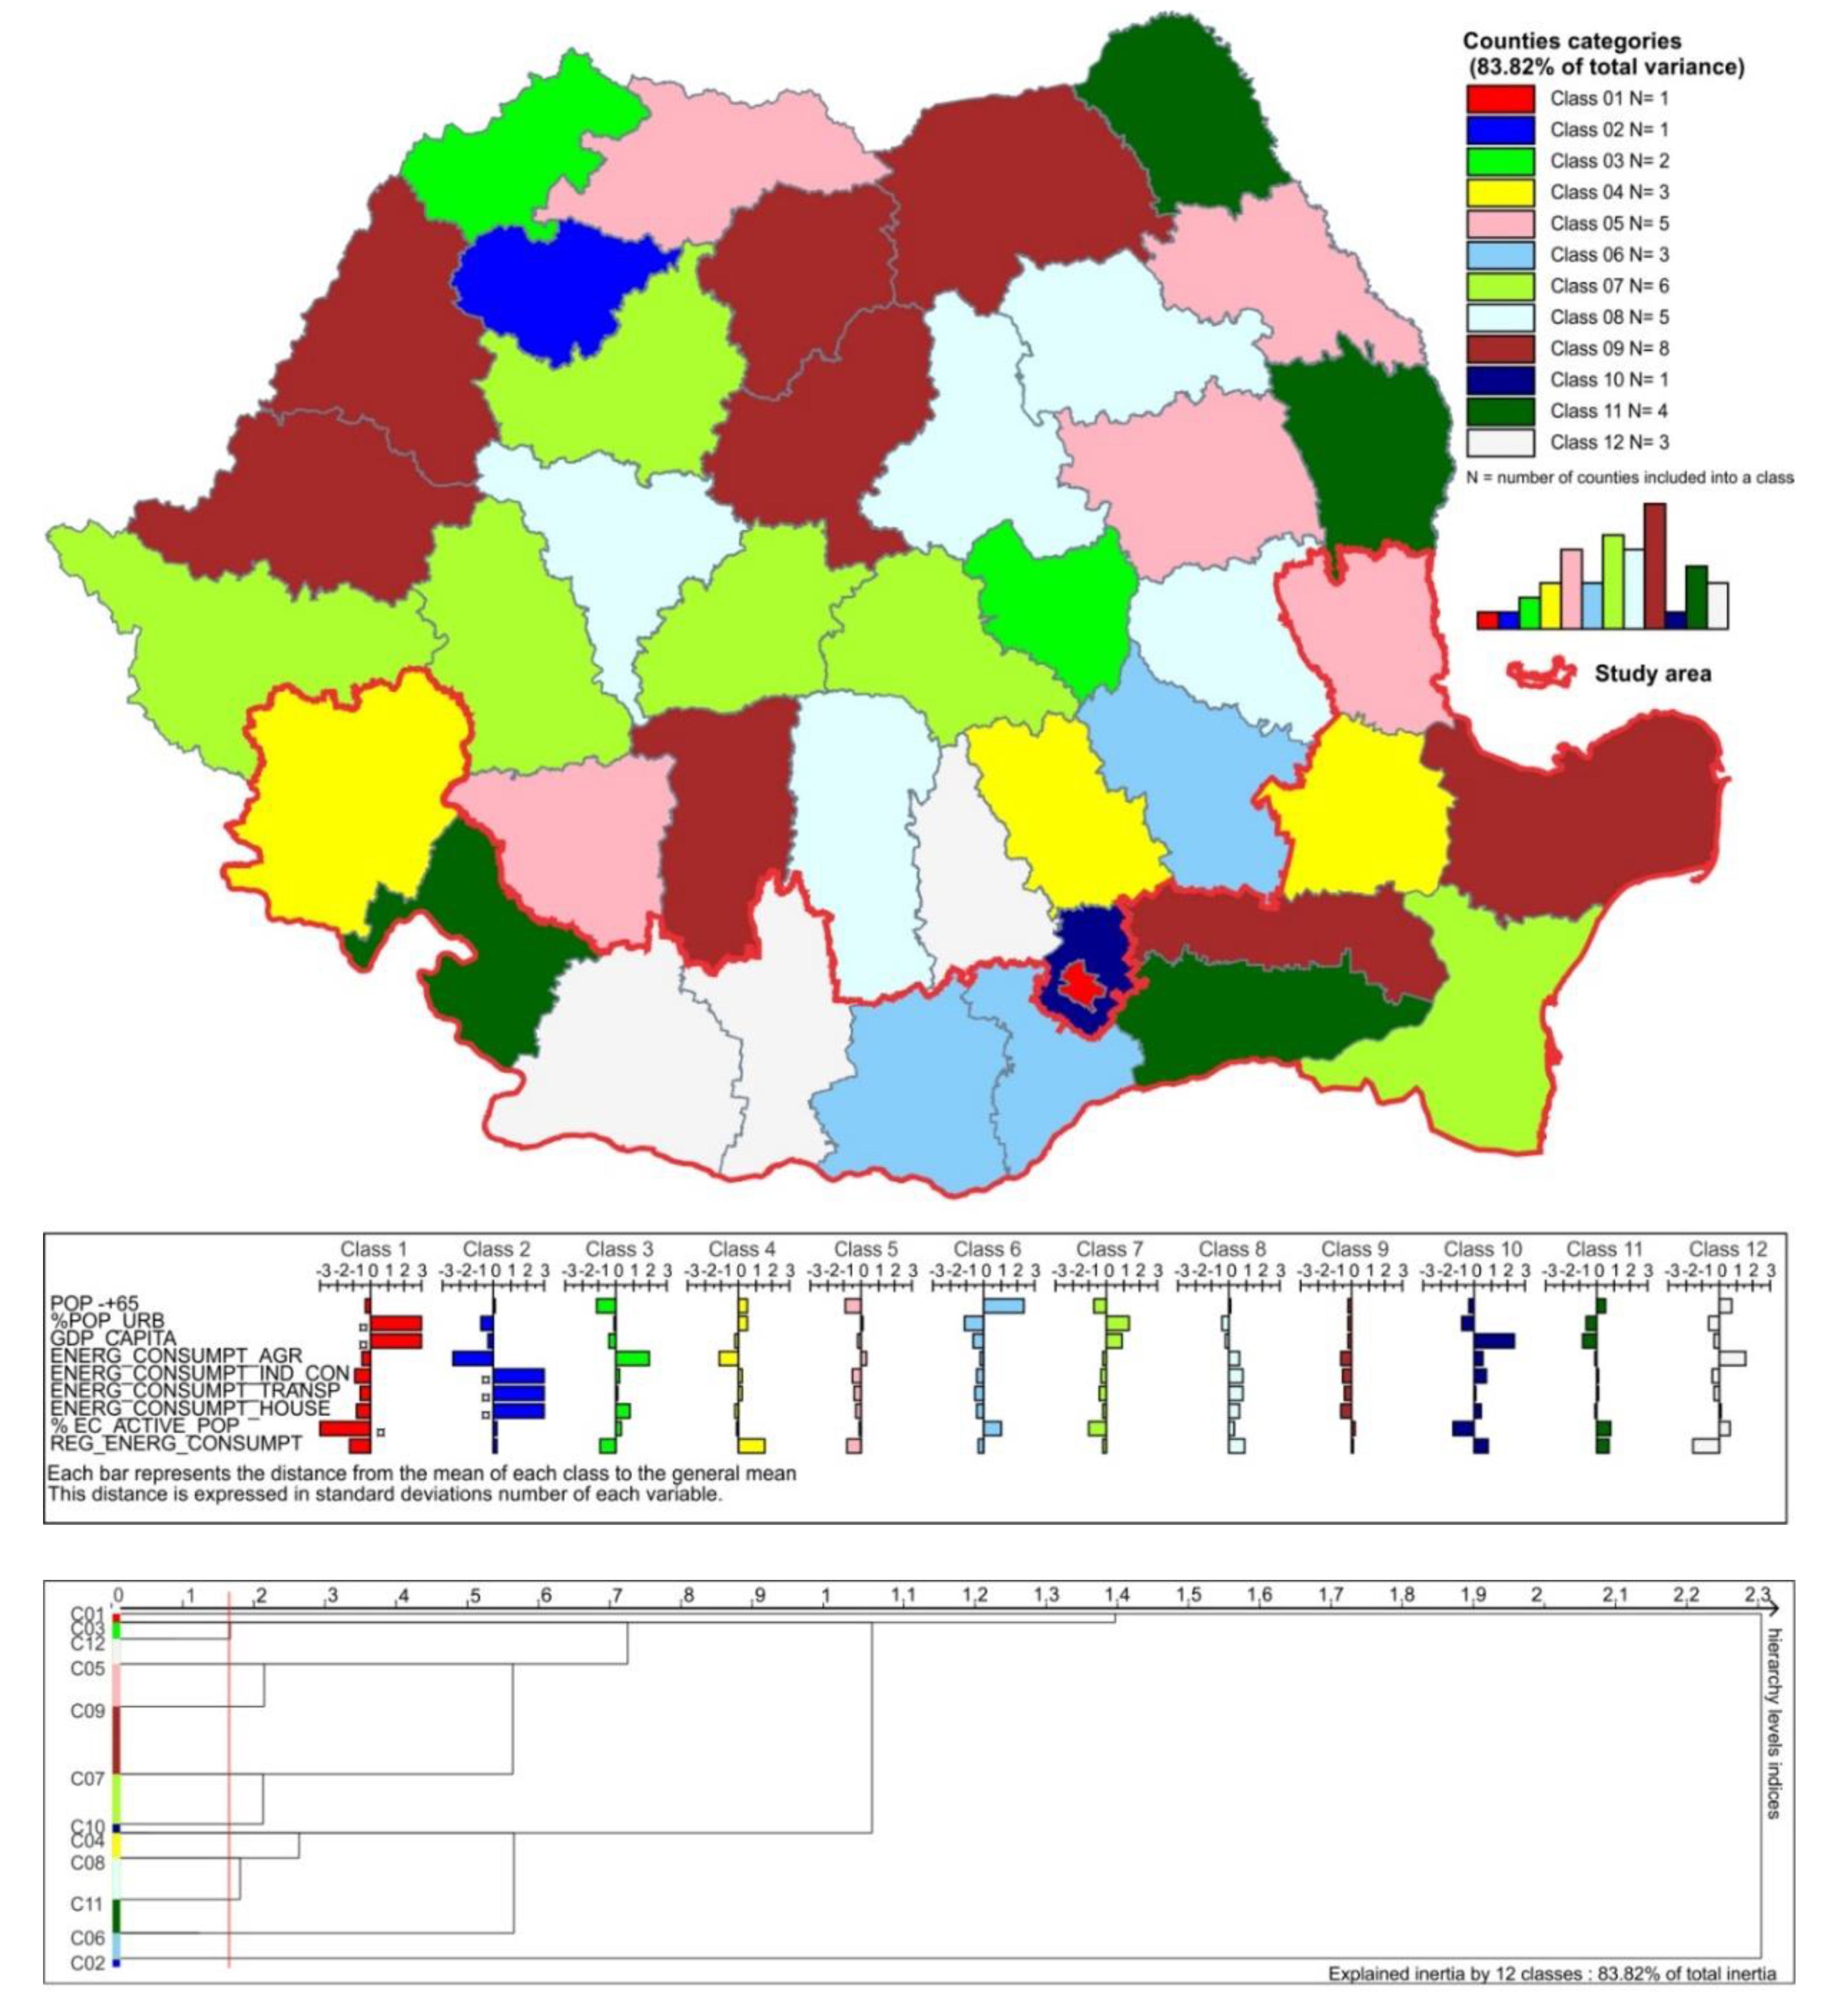
In 2000, the counties bordering the Danube were split in class values similar to those of 1995: they were characterized by an aging population, a lower degree of urbanization (in the central part), an above average energy consumption rate in agriculture or close to average in the central part, an above average energy consumption rate in industry or transportation for the extremities, an above average share of economically active population in the four economic activities for the western and central parts, and a slightly overestimated consumption rate for the extremities (
Figure 3).
The different evolution of indicators selected at county level led to the alteration of the process of grouping counties into classes. Thus, Călărași county, which formerly fell into class 11, alongside Dolj and Olt counties (in 1995), was removed from the category and placed in class 10 (in 2000), with Mehedinți county. Mehedinți County was removed in 2000 from class 6, from alongside counties Teleorman and Giugiu. This change was due to the more predominant aging process that takes place in the Teleorman and Giugiu counties, as a significant number of young people migrate to Bucharest in search of a job. In the year 2000, Galați and Tulcea counties had the same class (class 9), after having belonged to different classes (class 10 and class 8, respectively). Galați County reduces its energy consumption for agriculture, industry, constructions and households.
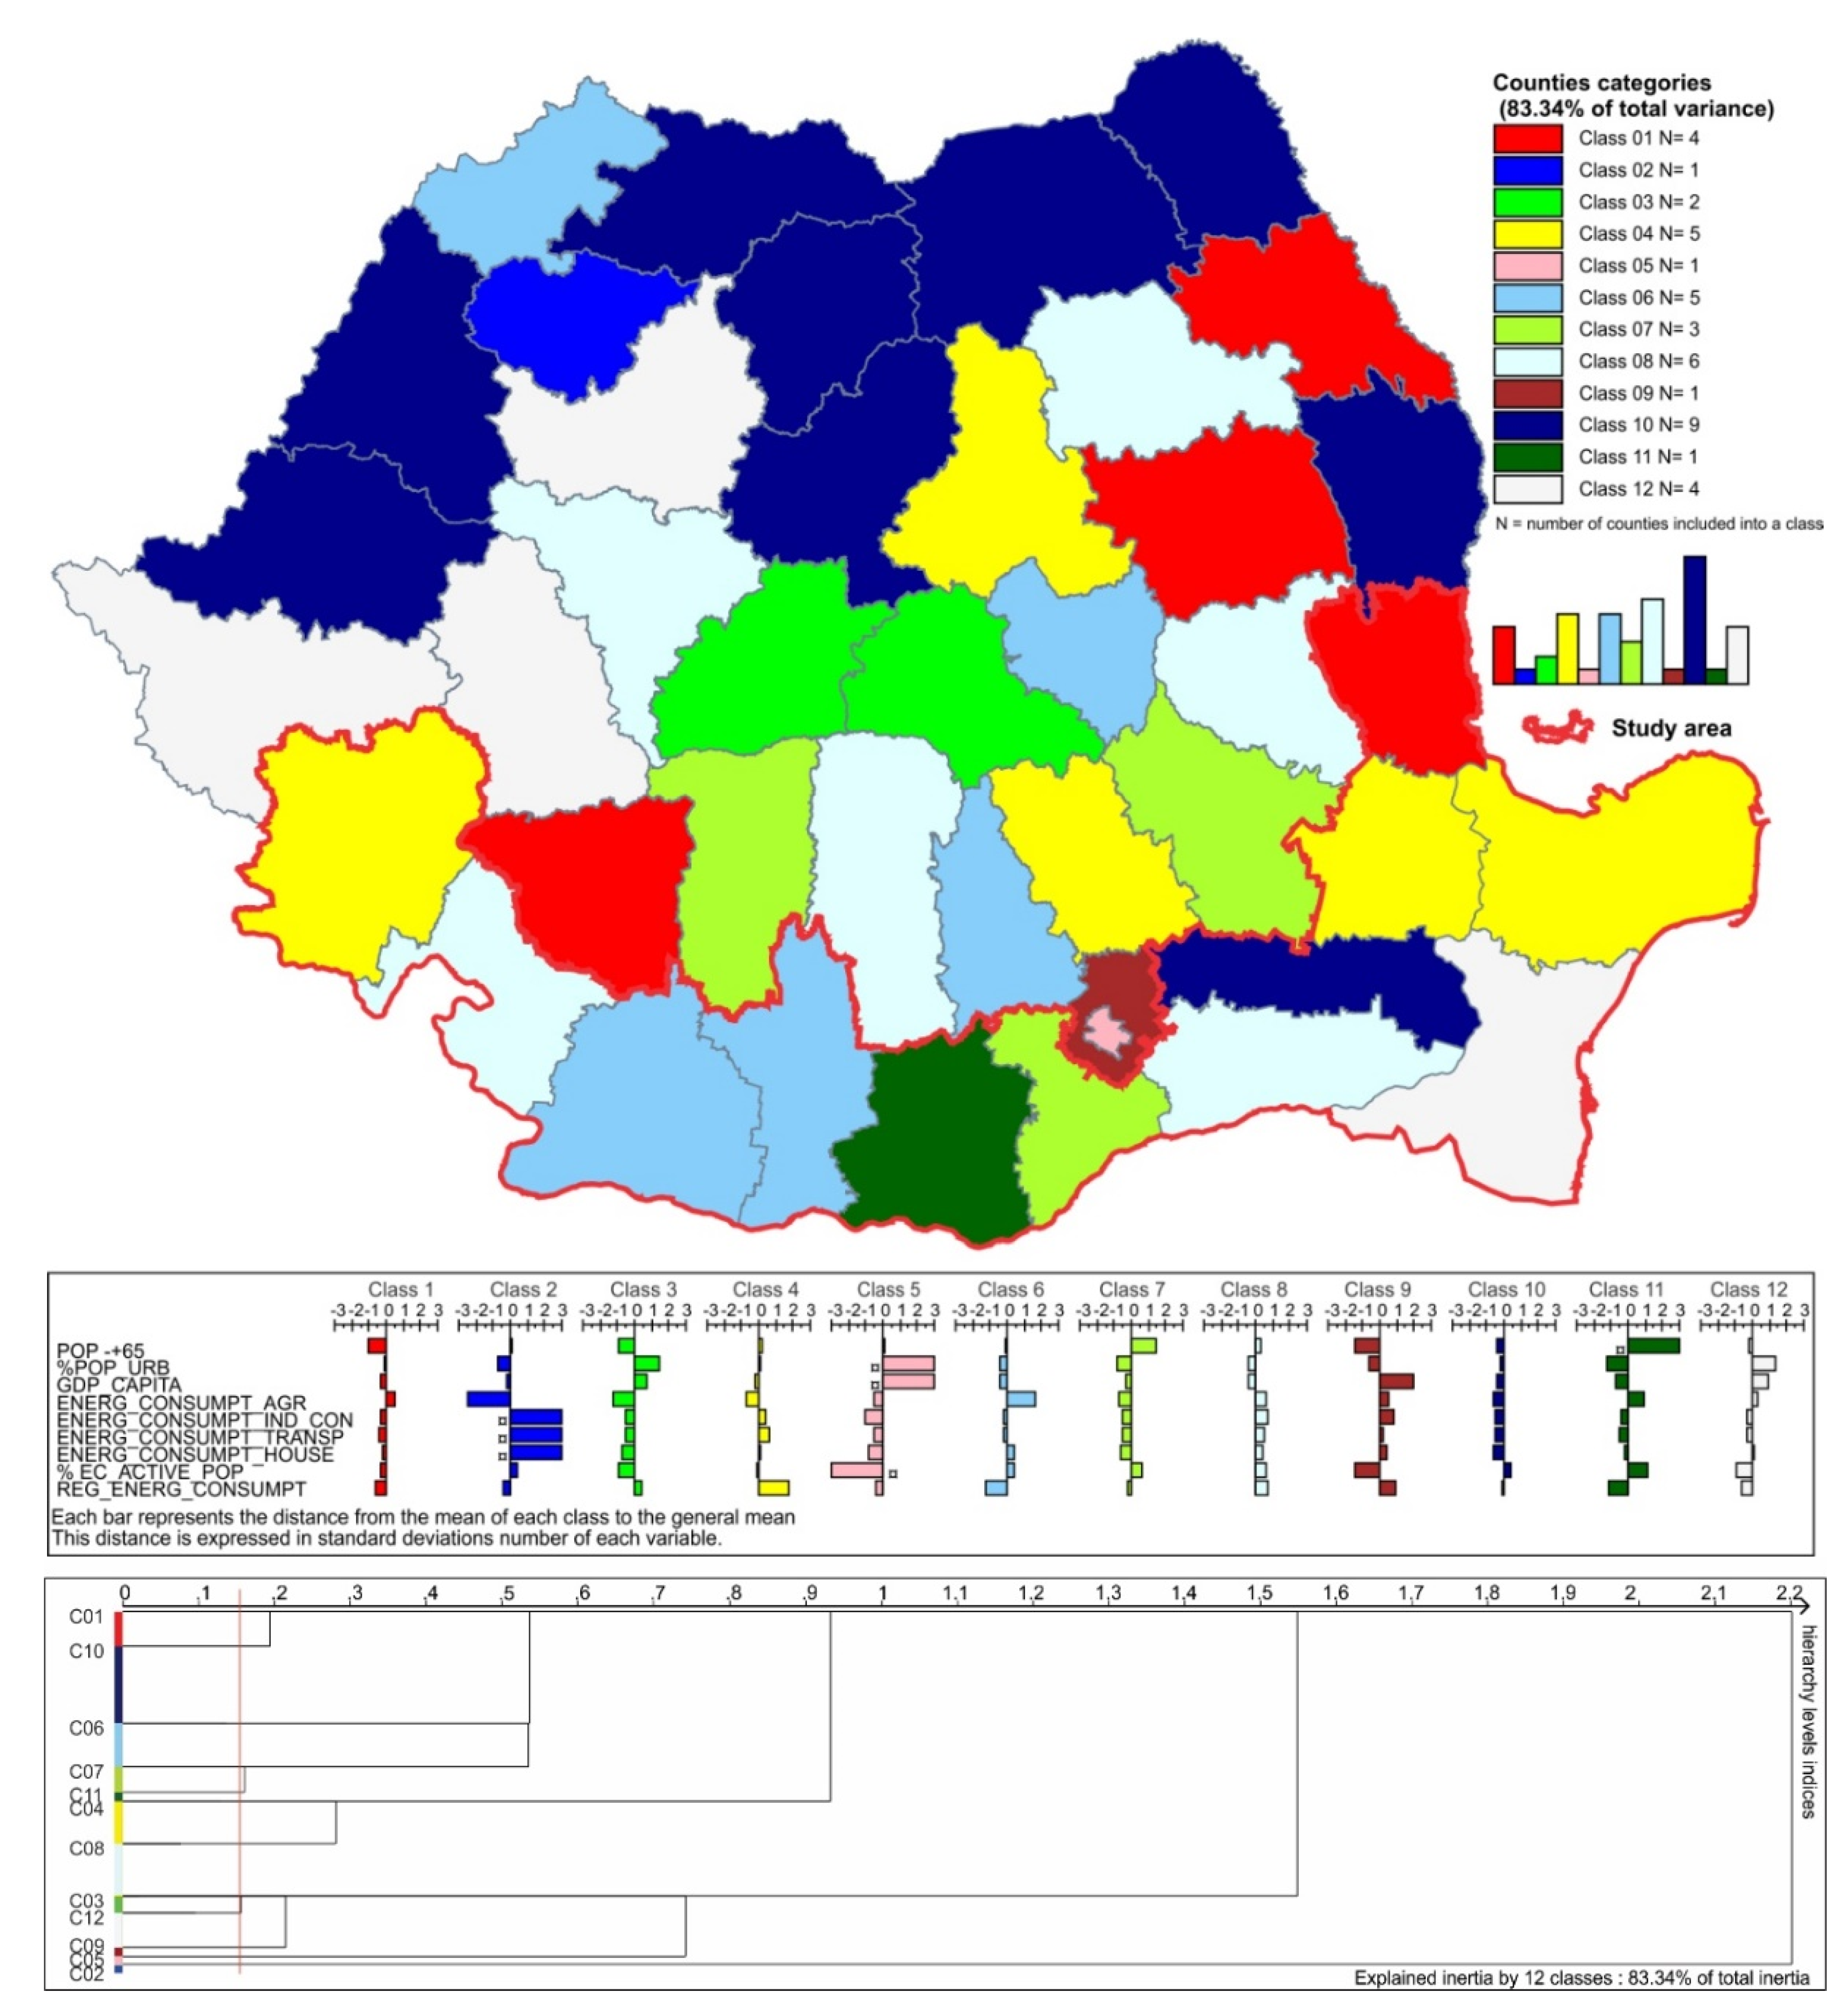
In 2005, the central part of the study area registered an increasing share of population aged 65 years and over, compared to the previous years, and an urban population below the national average. Moreover, in the counties located in the central sector of the Danube Valley, the GDP/capita was generally below average, and energy consumption in agriculture and the share of economically active population in the four economic activities was above or close to the average. The counties at the extremities of the study area stood out due to an above average energy consumption in industry or transportation and to the above average share of economically active population in the four economic activities (only in the western extremity). Residential energy consumption was slightly overstated (
Figure 4). As in the previous years of the analysis, the counties in the central part and in the eastern extremity of the Danube Valley appear to be territorially grouped. In the central sector, the counties registered negative standard deviations for all indicators, except for the share of the population aged 65 years and over and the energy consumption in agriculture, which recorded positive standard deviations. In the eastern extremity of the study area, most of the indicators were close to the national average, with small positive and negative standard deviations, and the regional energy consumption was above the national average. The main changes which happened in 2005, as compared to the year 2000, were: Galați County was removed from class 9, as it had a different evolution trend in terms of the selected indicators; and Tulcea County, previously of class 9 in 2000, joined class 6 in 2005 (alongside Brăila and Caraș-Severin counties). The main difference was the lower energy consumption rate of Galați County in terms of the selected economic activities.
Compared to the situation in 2005, in 2010 there were very similar conditions: the central part of the study area was represented by an aging population, a more pronounced rurality than the national average, a GDP/capita generally below this average, and energy consumption in agriculture above average or close to the average; the western extremity and the central part are characterized by the percentage of the active population in the four above-average economic activities. Residential energy consumption was slightly overstated (
Figure 5). In 2010, compared to 2005, the energy consumption in industry or transport in the counties located at the extremities of the Danube Valley which no longer exceeded the average, as it did in 2005, was close to the average in 2010.
In 2010, Tulcea County was removed from class 6 and joined Ialomița County in class 9, as the energy consumption was lower in constructions, transport and households, and higher in agriculture, compared to Brăila and Caraș-Severin, its former category partners.
Halfway through the current decade, in 2015, the spatial distribution of the demographic and economic indicators was similar to that of a decade ago: the central part of the Danube Valley had an elderly population above the national average, and an urban population below the national average; the GDP/capita was generally below the average, and the energy consumption in agriculture and the percentage of the active population in the four economic activities were above or close to the average. The counties at the extremities of the study area stood out through an above average energy consumption rate in industry or transport and an above average share of active population in the four economic activities (only in the western extremity). Residential energy consumption is slightly overstated (
Figure 6). Tulcea County rejoined Brăila and Caraș-Severin in class 4, in the year 2015, as the energy consumption increased for industry, construction and transportation, while Teleorman County was separated from Giurgiu County, having a more numerous, older population and higher energy consumption.
As mentioned above, the estimation of energy consumption at county level was made based on the national energy consumption rate stemming from the main economic activities (agriculture, industry, construction, transportation), as well as on the energy consumption in households. Compared to the data provided by the National Institute of Statistics on final energy consumption at national level, the value of energy consumption estimated by the authors ranged between 96% and 91% for the timeframe 1995–2015 (the difference is represented by energy consumption in service activities), while also taking into account that in the 1990s it was around 96%, falling around 91% in the 2000s. The energy consumption values were established making use of the active population in the respective economic activities. At national level, the share of the active population in the four economic activities numbered between 74–59% of the total active population in the period 1995–2015, and at the level of the Danube counties it represented between 83% and 57%. There was a decrease in the share of the active population in the four economic activities with the expansion of service activities since the 2000s.
There are correlations between the amount of energy consumed in the main economic activities, on the one hand, and the GDP/capita, the degree of urbanization and the share of the elderly population, on the other hand, knowing that some economic activities (industry, construction and transport) led to an increase in GDP/capita and population agglomeration (increase in density), and some service activities are developing in areas with an aging population. Therefore, the efficiency of energy consumption increases when the population density (share of the urban population) in a county is higher. In terms of GDP per capita and the share of the elderly population, the situation is completely different. The economic development has a substantial contribution to changes registered in energy consumption. Many researchers have extensively studied the relationship between energy consumption and economic growth. This relationship suggests that higher growth requires higher energy consumption and a more efficient use of energy requires a higher level of growth. Since the pioneering work of [
48,
53], the Granger causality test has become a traditional tool for studying the link between growth and energy consumption in various countries such as the USA [
49,
54], Tunisia [
50,
55], Asian countries (e.g., Taiwan [
51,
56], India [
52,
57]), low and middle income countries [
53,
58], European countries [
54,
59], Association of Southeast Asian Nations (ASEAN) and Organisation for Economic Co-operation and Development (OECD) countries [
55,
56,
60,
61] or in top energy-consuming countries [
57,
62]. Urbanization, in particular, has a positive effect on energy consumption, thus contradicting the hypotheses of modernization theorists [
8,
9,
10,
11,
12]. However, the expected population decrease in Romania will help reduce the increase in energy consumption.
The final energy consumed has decreased in the 20 years that our analysis refers to, from 28,738 million tons of equivalent oil in 1995, to 21,896 million tons of equivalent oil in 2015. In agriculture, energy consumption decreased from 1008 to 461 thousand tons of equivalent oil, in industry and construction from 14,369 to 6438 million tons of equivalent oil, in households from 8818 to 7387 million tons of equivalent oil and in transport increased from 3087 to 5591 million tons of equivalent oil at national level. Decreases of over 25% (national average) in terms of final energy consumption were registered in counties such as: Mehedinți (−29%), Constanța (−31%), Dolj (−32%), Giurgiu (−33%), Galați (−34%), Teleorman (−36%), Ialomița (−37%), Olt (−38%). Overall, the counties located along the Romanian Danube Valley recorded a 28% decrease in final energy consumption.
The total energy consumption calculated by the authors at county level based on the consumption of the main economic activities to which the consumption of households is added was sometimes (in the case of 10 counties out of 42 counties, as the total in Romania) overestimated by up to 10% and in the case of two counties, even by 20%.
It can be noted that there have been no significant changes in the territorial distribution of the selected indicators for the period 1995–2015 (
Figure 7).
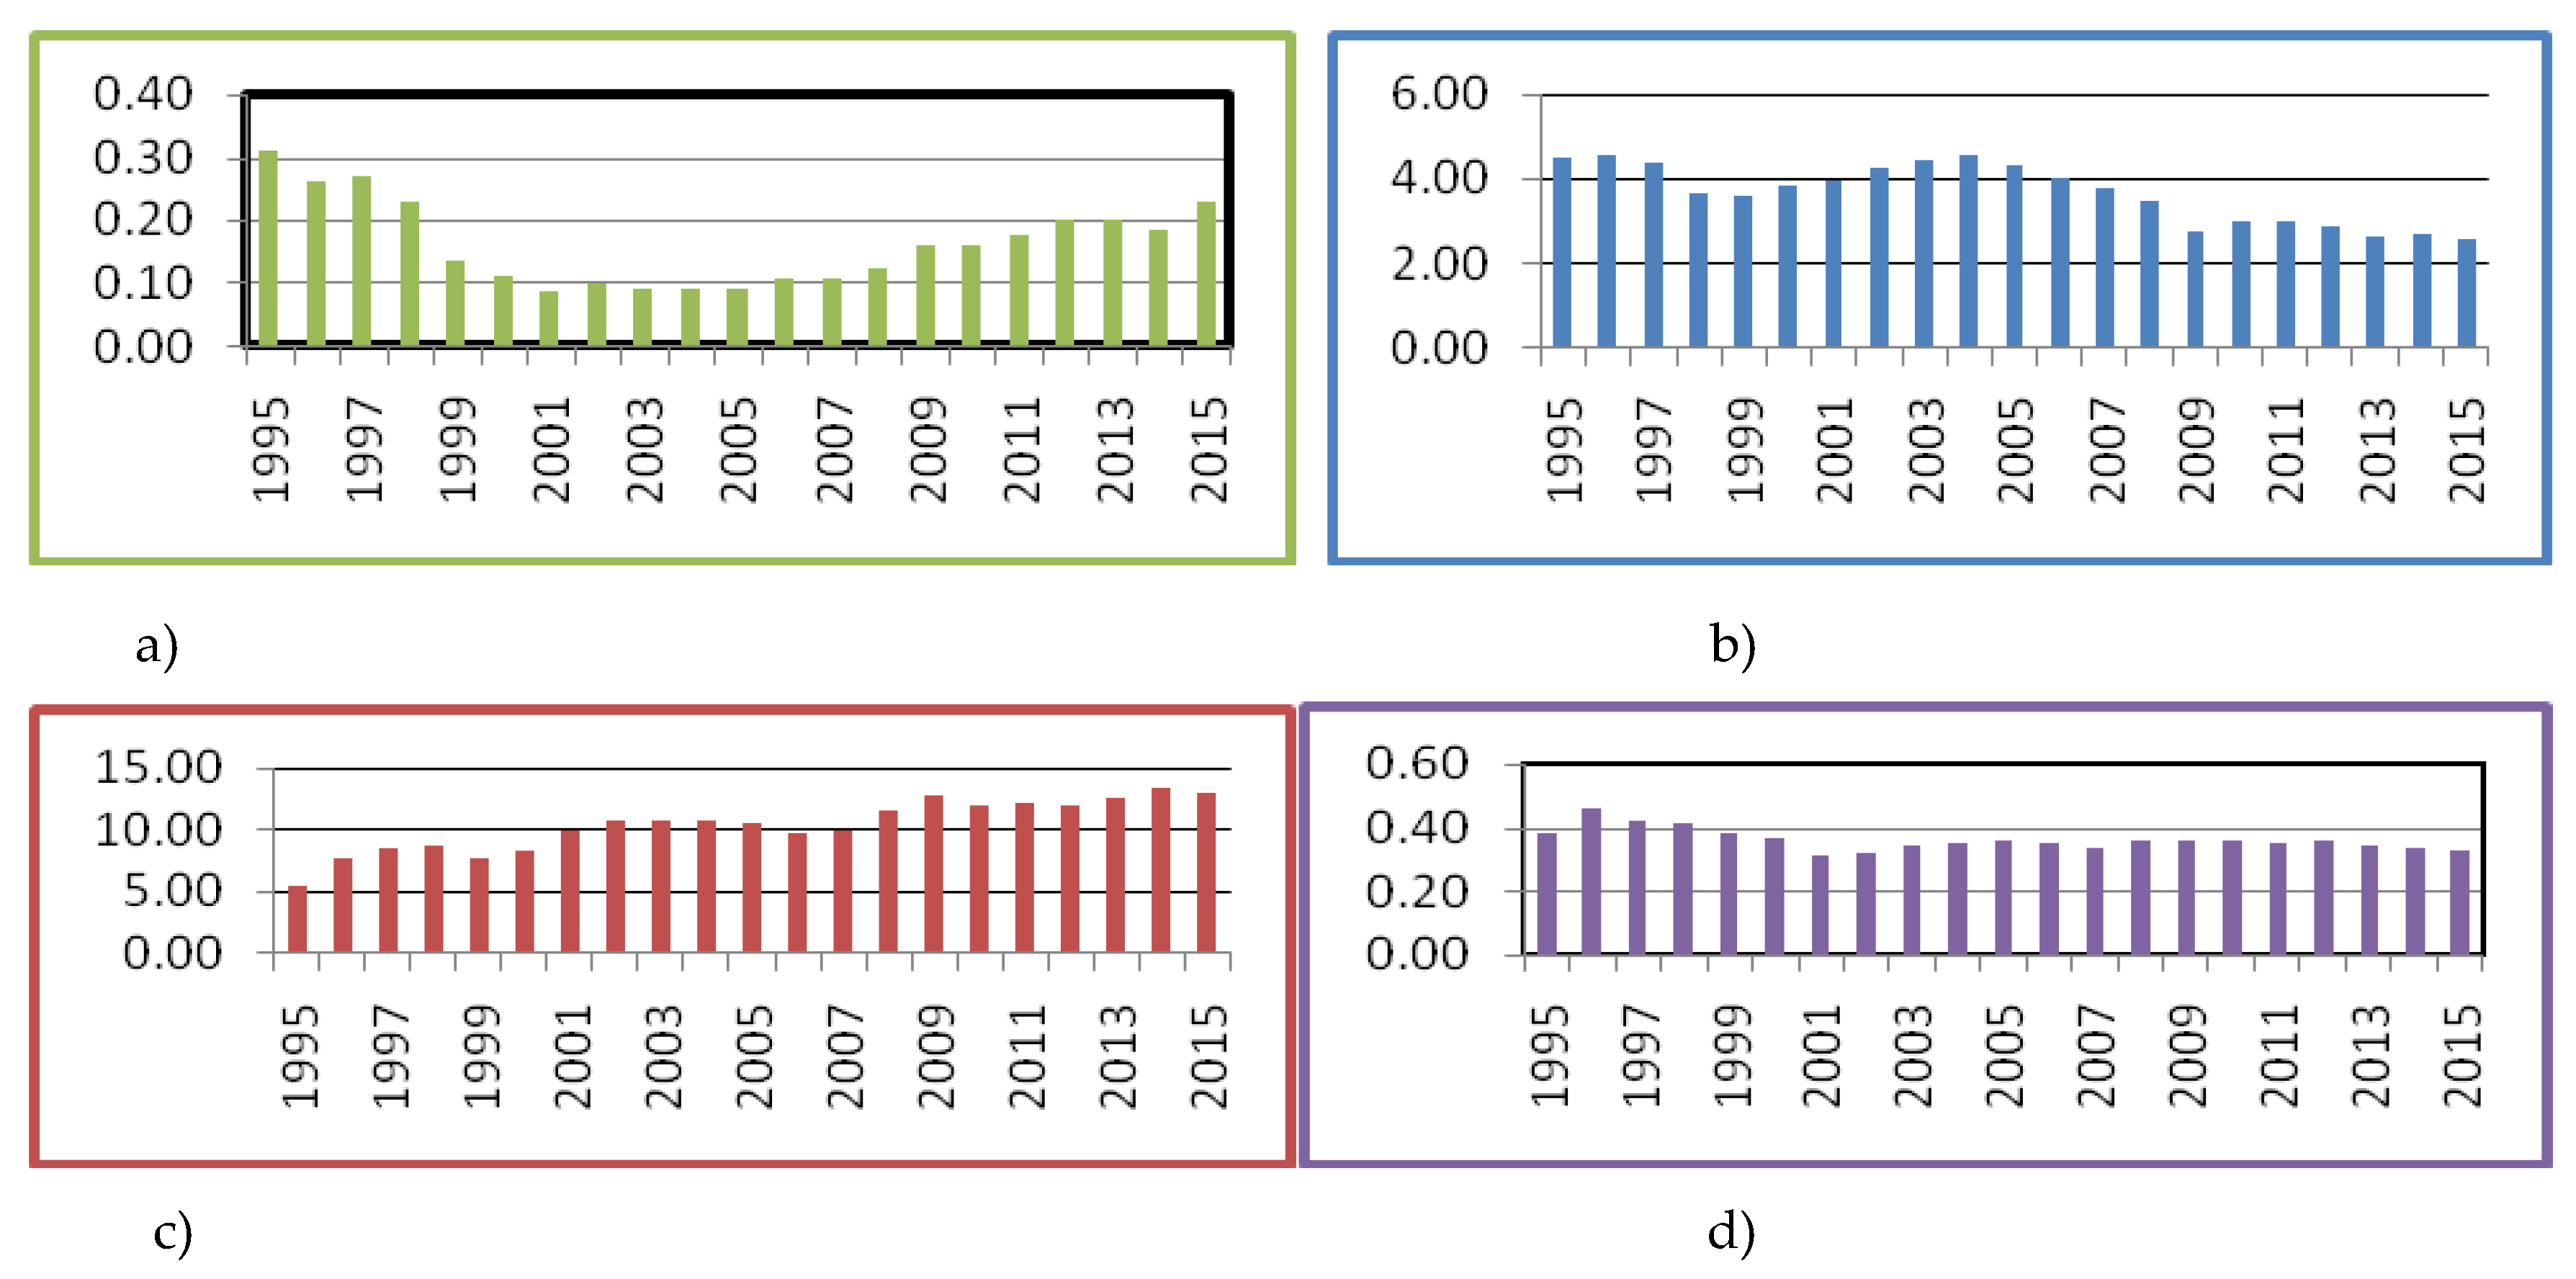
Energy efficiency (the ratio between energy consumption and the active population expressed in tons of equivalent oil) has evolved differently in terms of each selected activity of the national economy. Thus, in agriculture, energy consumption decreased in the 1990s up until 2001 when the upward trend began, amid investment in the partial re-commissioning of irrigation systems and agricultural policies. In industry and construction, the evolution oscillated: there was a decrease in energy consumption in the late 1990s, then the trend changed every five years, but the general trend was a downward one. In transport, the situation was totally different: the increase in the 1990s was followed by a decrease, and the trend also changed every five years, while the general trend was to increase the energy consumption. In terms of energy consumption in households, it had declined between 1995 and 2015, so energy efficiency has increased.
Our analysis helps understand the way demographic factors could contribute to the consumption of energy resources, sometimes in a rather subtle way. Our findings revealed that the relationship between demographic factors and energy consumption from 1995 to 2015 in the twelve counties of Romania along the Danube Valley was quite flexible. At first glance, this result seems surprising because expectations are generally to find a unitary elasticity—energy consumption changes at the same rate as the population.
5. Conclusions
In Romania, there is no statistical data regarding energy consumption in the main activities of the national economy and households at county level (only at national level). To calculate energy consumption at county level, we used data on the economically active population from the respective activities of national economy, as well as data on the resident population available at county level. Thus, the results obtained are more accurate than in the data on final energy consumption (reporting of final energy consumption at county level according to the total active population at county level). In the latter case, it would have resulted in the underestimation of the final energy consumption if a county has a significant percentage of energy-intensive economic activities (transport, industry).
The final energy consumption at county level was estimated based on the average consumption of activities of the national economy (energy consumption/active people). Therefore, we reported the active population from four economic activities that have the highest shares (agriculture, industry, construction, transport) in each selected county related to the active population from those economic activities at the national level. The higher amount of energy consumed resulting from the sum of energy consumption at the level of selected economic activities compared to the estimated final energy consumption is due to a lower average consumption (increased energy efficiency in different economic activities) in some counties with an increased share of the active population in industry.
The decrease in energy consumption we have observed in Romania during the period 1995–2015 is based, first of all, on the restructuring of the industry that took place in the 1990s, but also on the decommissioning of irrigation systems driven by the transition to private ownership of agricultural land.
Three counties along the Romanian Danube Valley have been the object of our overestimations: Brăila, Caraș-Severin (by 20% in 2000, but less than 5% in 2015) and Giurgiu by 5% just in 2000. We noticed that overestimations are more frequent in the case of counties with a large active population in industry, a high energy-consuming activity. It is obvious that the industrial branches do not consume the same amount of energy, thus we based our calculation on an average consumption at branch level. Therefore, where there is an overestimation of energy consumption, we suspect more energy-efficient industries. There are also other factors that could influence our calculations, among them: the GDP/capita, the degree of population aging, but also the high degree of urbanization which could lead to an overestimation of consumption rates, knowing that population density entails an increased degree of energy efficiency.
Energy efficiency depends, in addition to the technologies used in each economic activity, on demographic factors. Some of the demographic factors have different trends in terms of energy consumption. The effect of the population size must be explained in the context of changes in the structure by age groups (aging of the population), changes in fertility and mortality. Moreover, the economic structure changes alongside the changes in the demographic structure. Furthermore, this changes production and consumption, transport infrastructure, social services. In order to draw firm conclusions about the relationship between energy consumption and population structure by age group, further detailed studies are needed, including making use of other indicators. The economic growth Romania has been subject to since 2000 has led to a rise in energy consumption for the main economic activities (agriculture, transport, less so in industry—which has undergone a process of transformation and reduction of production capacity). It also turned out that improving the technologies used in industry has a positive effect on energy efficiency. The estimation considered in this paper could be helpful to support more extensive and comprehensive estimations of renewable energy which already record an increase in the global energy mix, with uncertain effects on employment, economic activities and on the general development process [
58,
59,
63,
64].
This study conducted in Romania could be useful for future collaborative studies or projects with other countries located along the Danube Region, especially in the context of the Danube Region Strategy which includes 4 pillars and 12 priority areas; a potential collaborative study or project could add a concrete value in the frame of Pillar 2—Connecting the Region, i.e., the priority area focused on Energy.

 ,
, 


