1. Introduction
Shipping has been a significant human action throughout history, especially in international and inter-regional trading applications. Different types of technologies have been used for providing the propulsion force of ships so far. All-electric ships are one of the recently introduced technologies which is referred to the ships that use electricity to provide the propulsion force [
1]. Required electricity of these ships can be generated by different resources like diesel and gas power generators, batteries, and clean energies like fuel cell, or by hybrid of these resources [
2,
3,
4,
5]. At the moment, the hybrid of diesel generators and batteries is known as a popular method for supplying the all-electric ships loads and reducing the emission [
6,
7].
Energy management of all-electric ships has been thoroughly studied in the literature, so far. In [
8], the authors use unconstrained, large-scale, global optimization to solve the energy resources scheduling problem of a large green ship with diesel power generator, batteries, photovoltaic panels and cold ironing as energy resources. A dynamic programming approach is used in [
9] to solve the energy management problem of an all-electric ship with hybrid diesel/battery system considering emission limitations. A nonlinear procedure is used to achieve a control strategy of all-electric powered ships with only a hybrid energy storage system as the energy resource. In order to address shipboard load fluctuations, the authors of [
10] apply a real-time model predictive control based on energy management strategy. They also use an integrated perturbation analysis and sequential quadratic programming algorithm to solve the optimal scheduling problem of a ship with hybrid batteries and ultra-capacitors. In [
11], a combined cooling heat and power plant in the hybrid diesel/battery ships is introduced and a multi-energy configuration for it is proposed. In order to reduce the ship operating cost and gas emissions simultaneously, a multi-objective optimization problem is solved. In [
12], a non-linear method is used to find the optimal control strategy of an all-electric ship supplied with a hybrid storage system. Shipboard loads power scheduling problem is solved using the particle swarm optimization method in [
13]. Energy management of hybrid fuel cell/battery system for propulsion of ships has also appeared in the literature recently. In [
14], a rule-base method is proposed for energy management of a hybrid fuel cell/battery ship. Simultaneous optimal component sizing and energy management of a hybrid fuel cell/battery ship are studied in [
15]. Reference [
16] applies a multi-scheme energy management method for optimizing the total energy consumption of a hybrid FC and battery system. Reference [
17] proposes a non-linear model for optimal energy management of a hybrid fuel cell/battery ship under different operation scenarios.
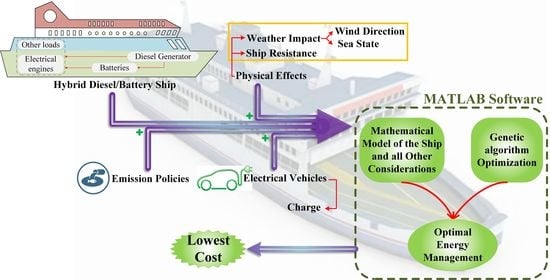
Reviewing the above mentioned studies shows that there are still some gaps in the field of the energy management methods for all-electric ships. First of all, although it has a strong impact on the propulsion load, ship resistance due to sea waves is not discussed and formulated in detail in these studies. The impacts of wind direction and sea state of the operation of the ships are not formulated in the methods. Moreover, the ability of all-electric ships that carry vehicles in providing the possibility of charging to electric vehicles is not formulated in the aforementioned studies. This paper focuses on integrating impacts from water resistance and wind on the propulsion load. So, the main contributions of the paper are summarized as follows:
An energy management method for the ships sailing in Inter-regional areas considering different emission constraints in different areas of the traveling route.
Formulating the water resistant for the understudy ship in detail and integrating the resistance formulations in the energy management problem.
Considering the impacts of wind direction and sea state on the efficiency of electric motors.
The rest of the paper is organized as follows.
Section 2 presents the problem description. In
Section 3, ship’s resistance is formulated. The relation between fuel consumption and power is determined in
Section 4. The problem is formulated in
Section 5. Numerical results are presented in
Section 4 followed by concluding remarks in
Section 5.
2. Problem Description and Preliminaries
2.1. Problem Definition
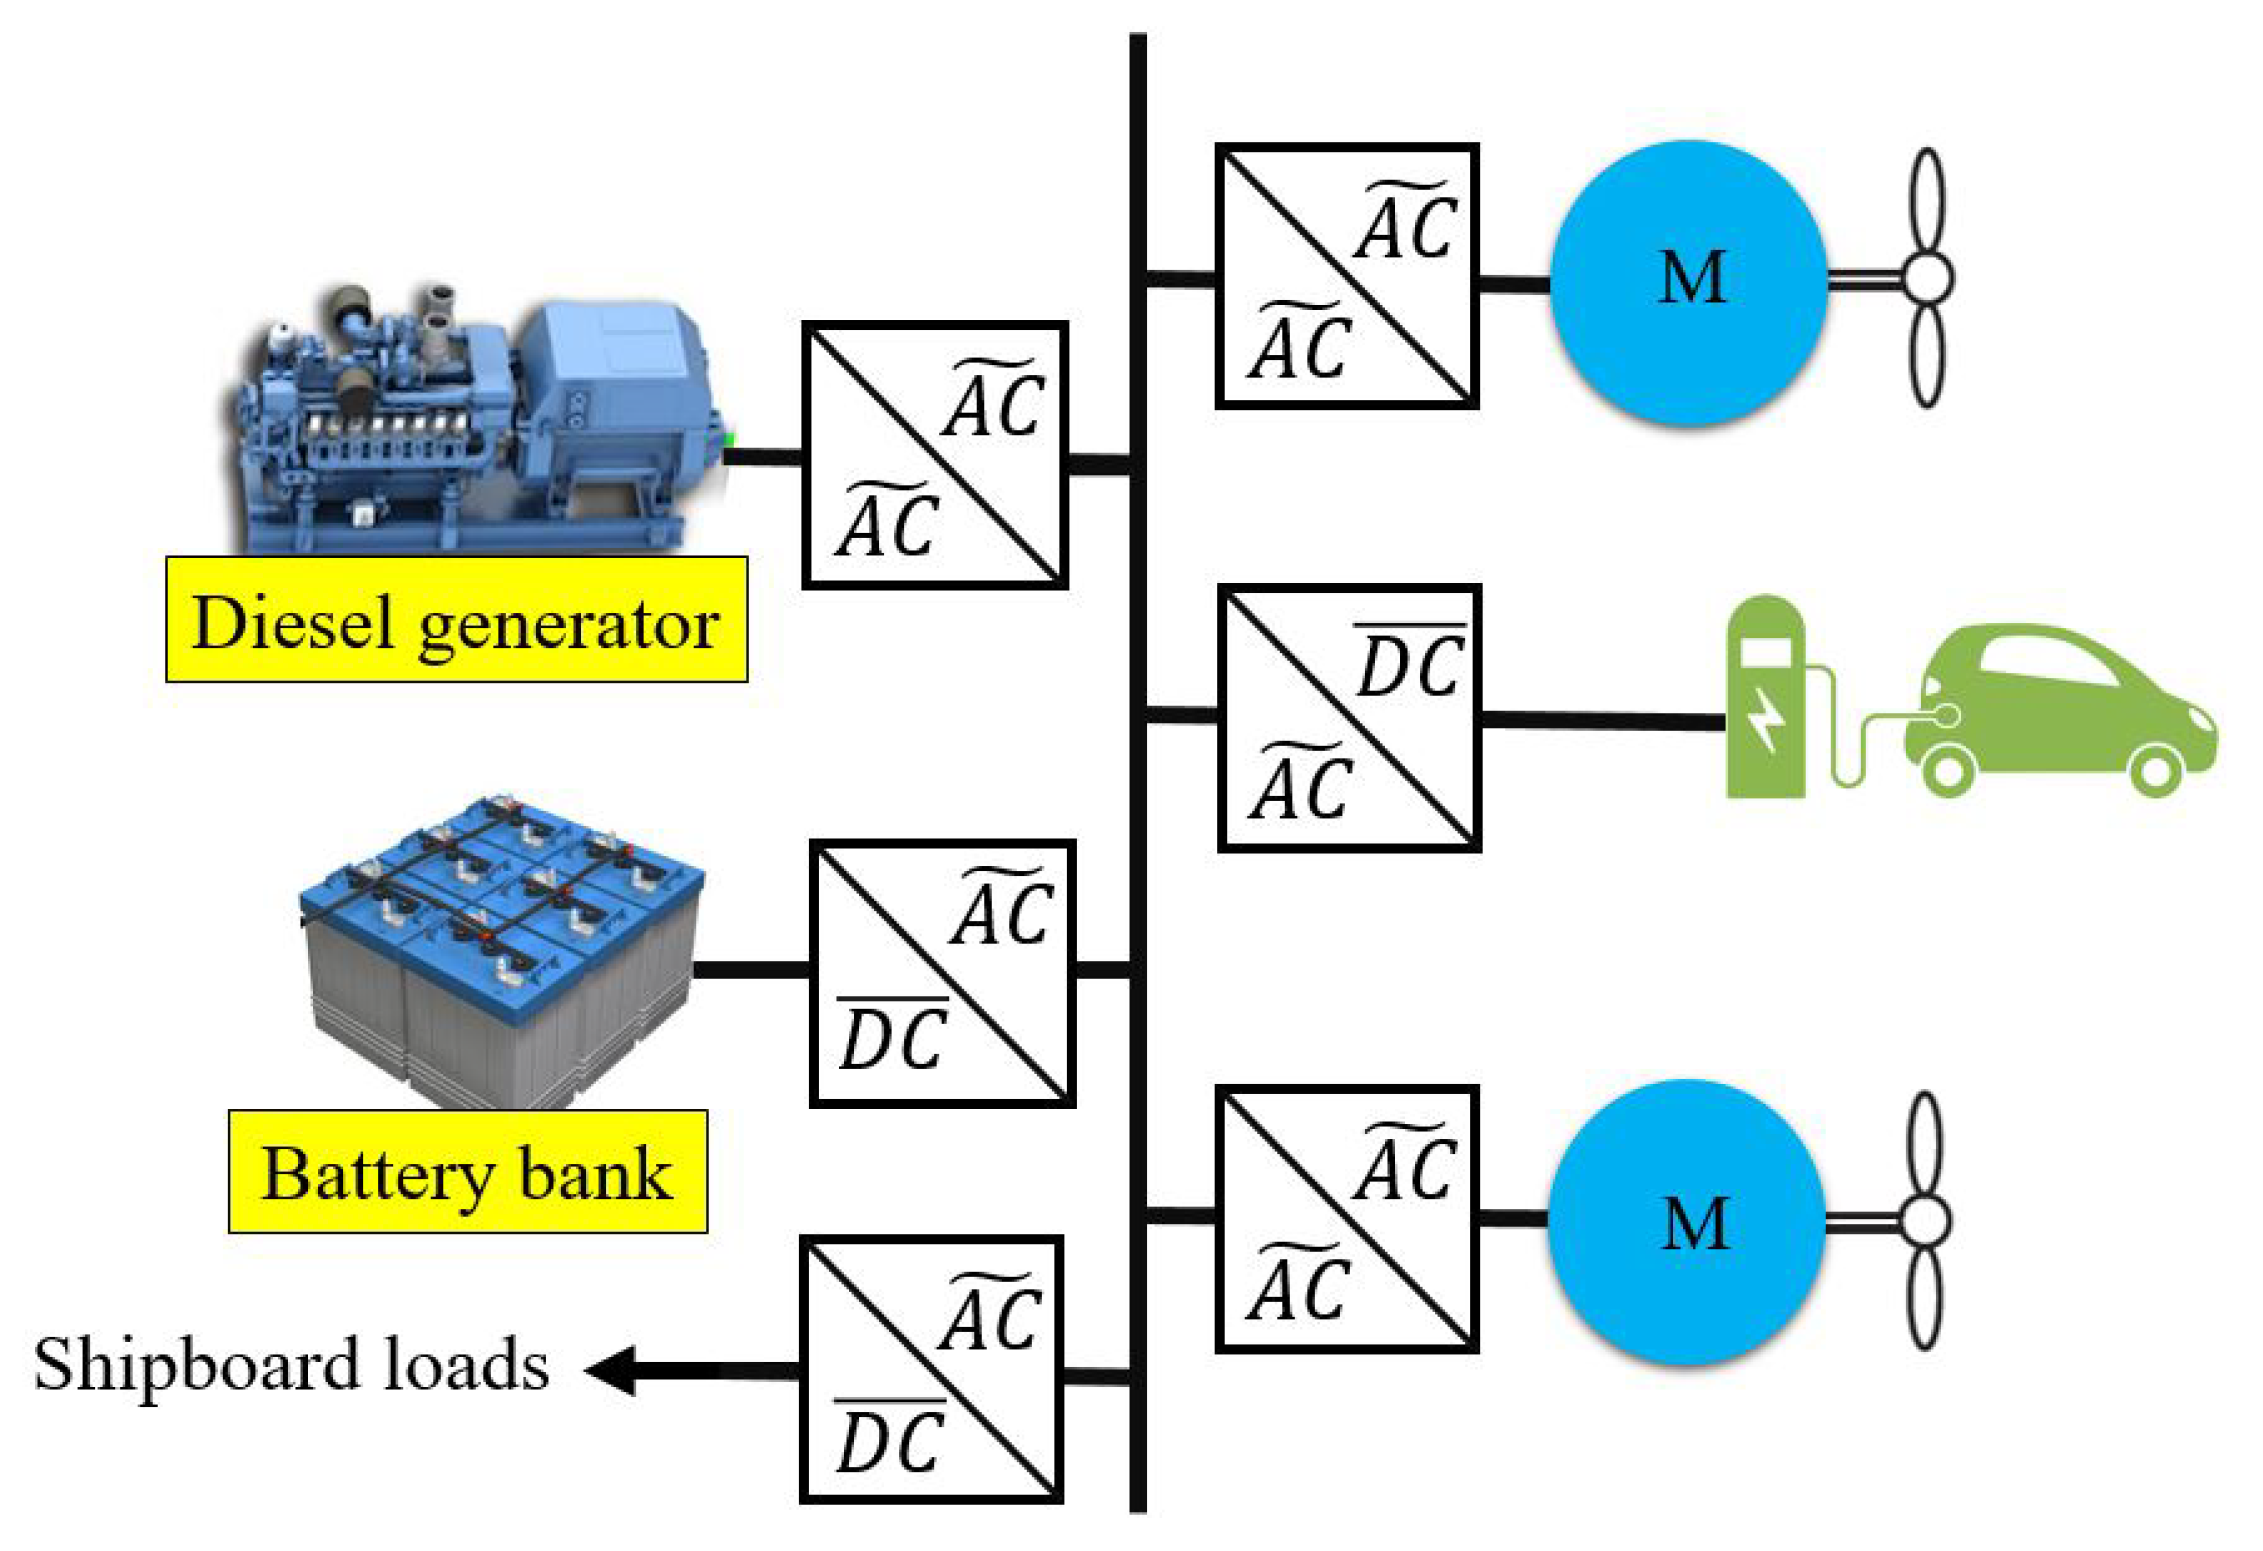
A hybrid diesel/battery ship with a 1000 kW diesel generator and 300 kWh battery is considered. This ship sails on a special route involving both domestic and international waters. It is assumed that the ship can provide the possibility of charging the electric vehicles that it carries by itself. The maximum power transmission for charging electric vehicles is assumed to be constant and limited. The single line electric diagram of the ship is shown in
Figure 1.
It should be noted that this type of ships usually sail a specific route two or three times per day. Energy management at each journey is performed considering discharging the batteries between predetermined values such that the total energy storage of the batteries are shared among all daily journeys. At the end of each day, after the last journey, the batteries are charged using cold-ironing in harbor. Since in this paper, the main focus is on only one journey, only the constraints related to discharging the batteries up to predetermined values at the end of understudy journey are considered in the modeling.
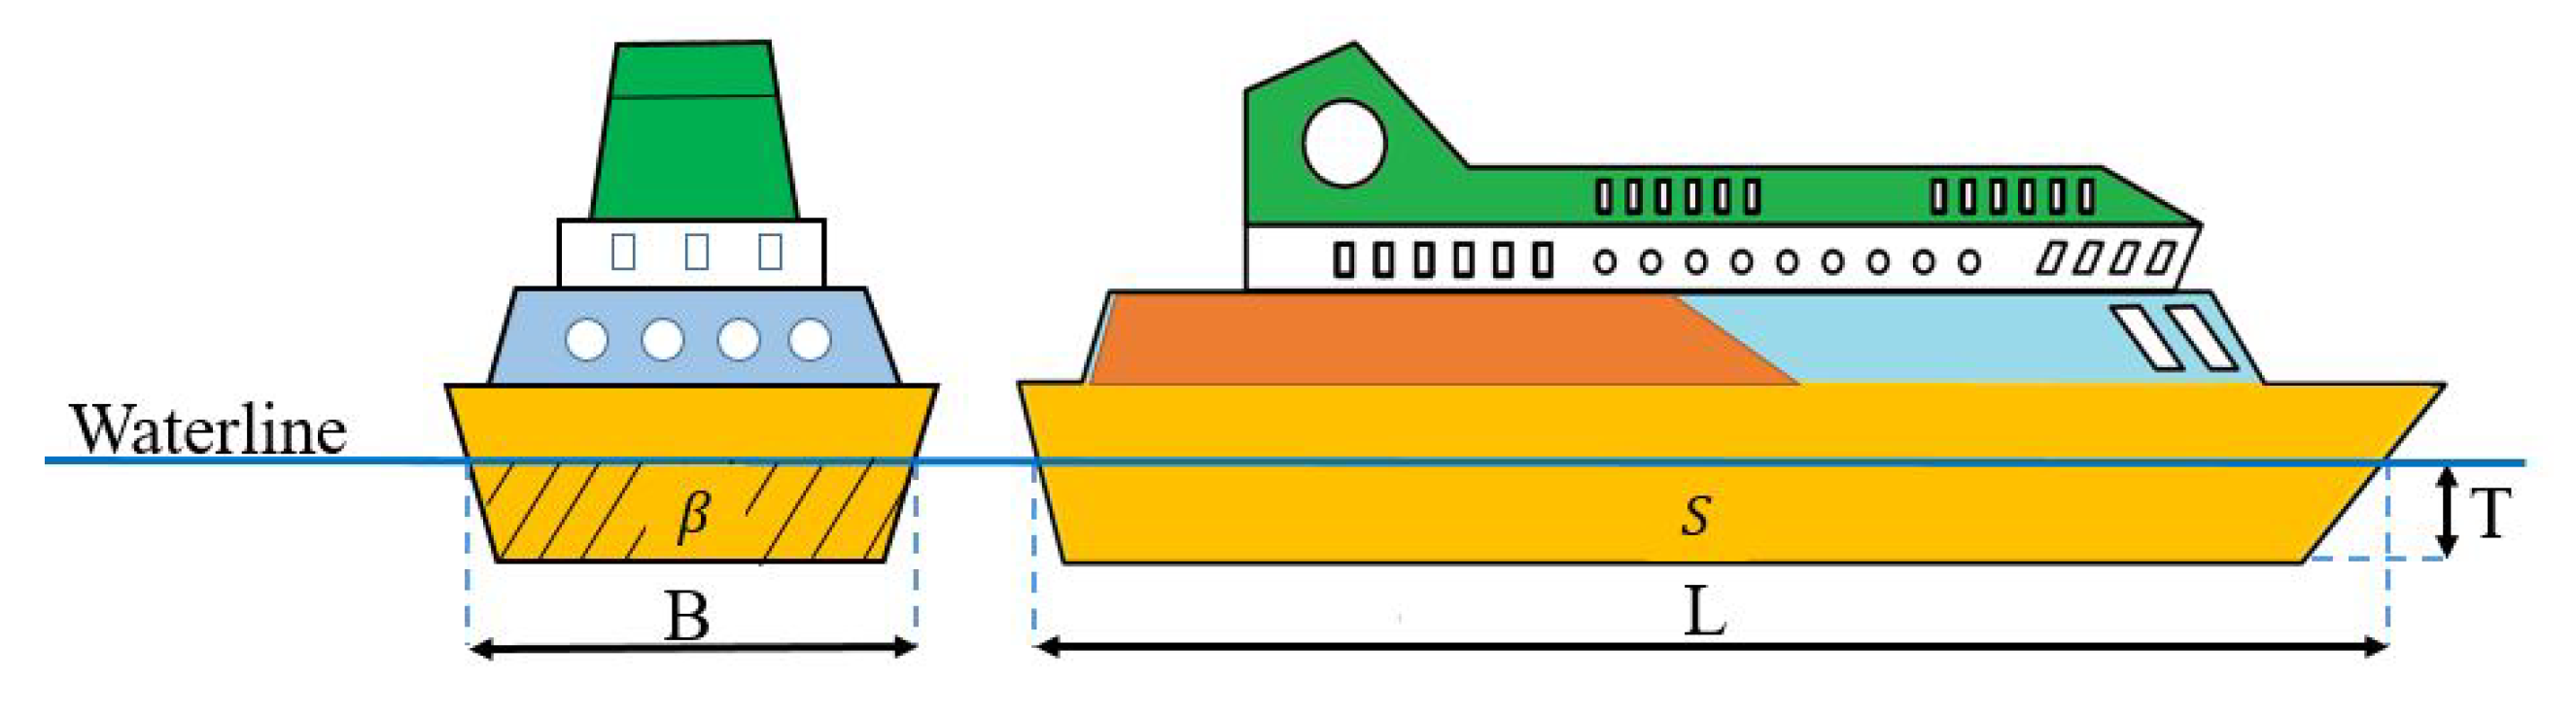
Basic parameters of the case study ship are presented in
Table 1 and illustrated in
Figure 2.
It is assumed that the travelling starts from a country with specific emission restriction in its own domestic waters. No emission restrictions are considered for international waters. So, when the ship enters the international waters no emission restrictions is imposed to the ship operation. When the ship leaves the international waters and enters to the domestic waters of the destination country new emission control restrictions should be considered in the operation of the ship.
Different studies show that wind direction and sea state can affect the performance of ship electric motors [
18]. It is assumed that the traveling route is short. So, the wind direction and condition of the sea in different traveling route locations can be predicted and known in the power scheduling problem.
The variations in ship’s speed during travel lead to changes in ship’s resistance. The consumed fuel is also characterized as a function of shipping speed and also ship’s speed-dependence resistance. So, in order to determine the amount of fuel consumption, the relation between the ship’s speed and resistance should be taken into account.
Considering all above mentioned assumptions, the aim of this paper is to determine the optimal speed adjustment of the ship during the journey and scheduling the batteries and electric vehicles charging considering the emission limitation, weather condition, and ship resistance such that the optimal operation cost is achieved.
It is assumed that energy resources scheduling is performed for different portions of the sailing route. Each portion is denoted by index x and the set of all portions is defined by X.
2.2. Ship’s Resistance Formulation
Considering the ship’s speed-dependent resistance and as mentioned in [
19], the propulsion force is proportional to shipping speed as follows:
where
denotes the electric motors’ power in kW,
is the ship’s speed-dependent resistance, and
V is the shipping speed in (m/s). Ship’s resistance is represented as:
where
is mass density,
S is the wetted surface of the ship, and the total resistance coefficient, denoted by
, is given by:
where
,
,
,
, and
represent the frictional resistance coefficient, the residual resistance coefficient, the incremental resistance coefficient, the air resistance coefficient, and the steering resistance coefficient, respectively. The frictional resistance coefficient, denoted by
, is formulated as:
is the Reynolds Number and is defined as:
where
L and
are the length of the waterline and the coefficient of kinematic viscosity, respectively.
is expressed as a function of Froude number. The Froud number is defined as below:
where
g is the standard gravity. According the the available studies [
19] the relation between
and Froude number is highly dependent on the parameters of the ship. In [
19] relation between
and Froude number is depicted using some curves obtained by experimental results. In order to find the best curve for the ship under study, two parameters should be calculated. The first term is a length-displacement ratio that is defined as below:
The second term is the prismatic coefficient
of the model given by:
where ∇,
B,
T, and
denote volumetric displacement, breadth, draught, and mid-ship section area coefficient, respectively. Using these two parameters the corresponding curve for
versus Froude number can be found in [
19]. Curve fitting is applied to assign a mathematical formulation to the relation between
and fourth-degree. The following polynomial function represents this relation:
Now, it should be noted that this curve is valid for the case that
. Below formulation is used to find the value of
for other
values:
The incremental resistance coefficient,
, depends on the length of the waterline and for understudy ship equals to
. It is also assumed that
,
. Mathematical representations of all resistant coefficients and the total resistant coefficient curve
are depicted in
Figure 3. Ship’s resistant is obtained by including the calculated value of
using (
3), (
4), (
9), (
10) and above-mentioned information.
2.3. Fuel Consumption
The following formulation is used to find the mass of fuel consumption for a specific output power of the diesel generator [
20]:
where
is the output power of the diesel generator in (kW) and
is the fuel consumption in (g/h). Specific fuel oil consumption (SFOC), in (g/kWh), is the measure of the amount of fuel consumed in (g) by the diesel generator to produce a unit of energy in (kWh). The SFOC at different loading of the diesel generator is derived from the performance curve, which can be obtained from the manufacturers. The SFOC curve is shown in
Figure 4.
Considering that the SFOC in 100% output power of the power generator is 211 g/kWh [
20] and capacity of diesel generator is 1000 kW, curve fitting using cftool in Matlab software is applied in
Figure 4 to assign a mathematical function to the relation between the output power of the diesel generator and SFOC as below:
2.4. Impacts of Weather Condition on the Motors’ Performance
One of the goals of this paper is considering the effects of weather condition on the optimal energy management of the ship. Reference [
18] has already studied the impacts of wind direction and sea state on the fuel consumption efficiency of the ships. In [
18], calculation are performed for ships with diesel engines whereas understudy ship in this paper is an all-electric ship that uses electric motors. However, since the fuel consumption and output power in diesel engines have a linear relation, same impact can be considered for wind direction and sea state on the efficiency of output power of the motors. So, obtained results in [
18] are used in this paper to model the impact of wind speed and sea state on the efficiency of the motors. In the rest of this paper, the phrase “motors’ efficiency” refers to the motors’ electrical efficiency plus the ability of electric motors in reaching the ship’s speed to a specific value. Analysis in [
18] shows that tail wind, beam wind and head wind have different impacts on the fuel consumption of ships. Around the operation point of understudy system, tail wind and beam wind have similar impacts on the motors’ efficiency and head wind reduces the motors’ efficiency about 4%. Coefficient
is introduced to consider the impact of wind direction on the motors’ efficiency. We have:
refers to the set of portions in which the wind blows to Tail or Beam of the ship and is to the set of portions in which we have head wind.
The Beaufort scale is also used in [
18] to categorize the different states of the sea and their impacts on the performance of motors. According to the Beaufort scale, 13 scales
are used to describe the sea state. Scale 0 represents the calm state and scale 12 defines a hurricane sea. In [
18], the focus is on three states 4, 5, and 6. In state 4, wind speed is between 20 to 28 km/h and wave height is between 1 to 2 m. In state 5, wind speed is between 29 to 38 km/h and wave height is between 2 to 3 m, and in state 6, wind speed is between 39 to 49 km/h and wave height is between 3 to 4 m. Based on the analysis in [
18], considering the state 4 as the base case, in states 5 and 6 the motors’ efficiency decreases about 4% and 8%, respectively. Coefficient
is introduced to consider the impact of see state on the motors’ efficiency as below:
Sets
,
, and
refer to sets in which the sea state is 4, 5, and 6, respectively. Now, using coefficients
and
the motors efficiency is formulated as below:
represents the motors’ electrical efficiency. It should be noted that since the traveling time period is short, it is assumed that wind direction and sea state are known at the beginning of the sailing.
3. Optimization Problem
In this section, the optimal scheduling problem of the hybrid diesel/battery ship is formulated. The goal is to minimize the total shipping operation cost considering diesel generator’s operation constraints, the battery’s operation constraints, time limitation, the fuel consumption limit, and emission constraint. The whole sailing route is divided into several portions. It is assumed that the adjusted variables are constant during each portion of the trip. The problem is formulated as below:
The first term of objective function (
16) is the cost of fuel consumption.
and
present the fuel price in (
) and the consumed mass of fuel in (
), respectively. The second term in (
16) denotes a cost that refers to batteries degradation due to discharging.
is its price and
is the discharged power of the batteries in portion
x. As mentioned before, it is assumed that the ship provides the possibility of charging electric vehicles. The third term is the total income for charging electrical vehicles on board
and
are the price and power of charging electrical vehicles at the portion
x, respectively.
is the traveling time at portion
x in (h). The last term in the objective function is a penalty that prevents fast variations and fluctuations in the speed of the ship during the sailing. Parameter
K denotes the importance of this penalty function in the optimization.
Constraint (
17) represents the relation between speed and time period of each portion. Constraint (
18) defines the relation between fuel consumption and output power of diesel power generator using Equations (
11) and (
12). Equation (
19) denotes the relation between motors’ power, speed, resistant, an weather condition.
Constraint (
20) corresponds to the maximum output power of diesel generator where
is the rated power of the diesel generator. Changing the operation point of the diesel generator happens at the beginning of the portion
x and is limited. Constraint (
21) limits the variation of the diesel generator’s output power when the ship arrives at the portion
x.
Constraints (
22)–(
26) are related to the batteries operation limitations.
and
are upper and lower bounds of the batteries state of charge (SOC), respectively. The charging and discharging power of the batteries is limited to
in (
23). Constraint (
24) is used to determine the charging or discharging state of the batteries. Adjusting the zero or one value to
helps us to assign charging or discharging efficiencies to the batteries operation in constraint (
25). The equality constraint (
25) is used to update the energy storage of the batteries at the end of each portion of the trip. Constraints in (
26) assign the initial and final energy storage of the batteries.
Traveling time period is limited by (
27). Total available mass of fuel is limited to
in (
28).
In this paper, it is assumed that the emission control policies are various in different portions of the sailing route. Sets
and
refer to the portions close to the start and ending points of the sailing routes, respectively. The maximum value for the emission index in sets
and
are different. Constraints (
29) and (
30) are defined to illustrate these different emission control policies. In (
29) and (
30),
F is the coefficient for converting mass of fuel to CO
2,
represents the gross tonnes of the ship, and
and
denote the emission limits in the areas of sets
and
. No emission restriction is considered for other portions of the sailing route.
Constraint (
31) limits the power transfer for charging the electric vehicles to
and constraint (
32) denotes the maximum free energy storage capacity in the candidate electric vehicles in ship for charging, i.e.,
.
Constraint (
33) represent the power generation and consumption balance of the ship. Parameter
denotes the shipboard loads except the motors power in portion
x.
Proposed optimization problem (
16)–(
33) is non-linear model. The Genetic Algorithm (GA) toolbox in MATLAB software is applied to solve this optimization problem.
4. Simulation Results
In this section, the proposed energy management strategy is applied to the real case study ship introduced in
Section 2 and
Table 1. Other required information for the simulation are presented in
Table 2. Shipboard loads are presented in
Figure 5. The understudy ship is assumed to operate on the Sweden-Denmark ferry route Goteborg-Frederikshavn. The length of the route is about 110 km and the crossing time is 5 h. The sailing route is divided into 15 portions and the length of each portion is 7.33 km.
According to the 1982 United Nations Convention on the Law of the Sea, the territorial sea of each country is a belt of coastal waters extending at most 22 km from the baseline of a coastal state. Since it is assumed that the emission controls are for the territorial waters of each country and the length of each portion is 7.33 km, the first three portions of the route are assigned to the emission control area of Denmark and last three portions of the route are assigned to the emission control area of Sweden.
Wind direction and sea state at each portion are presented in
Table 3. In
Table 3, symbols TB and H represent the tail or beam wind and head wind respectively, and symbols S4, S5, and S6 represent the sea states 4, 5, and 6 respectively. According to (
13) and (
14) and information in
Table 3, values of motors’ efficiency in (
15) at each portion of the route is calculated as shown in
Figure 6. As shown in
Figure 6, in first seven portions the weather condition affects the motors’ efficiency less than the last eight portions of the sailing route. In next subsections, first, the simulation results of the proposed model (
16)–(
33) that is refereed as the base case is presented and compared with the case that no emission policy restrictions are considered. Then, impacts of weather condition on the simulation results are investigated and operation costs at different operation cases are compared.
4.1. Simulation Results of the Proposed Energy Management Method
Optimal scheduling results of different variables are presented in
Figure 7,
Figure 8,
Figure 9,
Figure 10 and
Figure 11. In
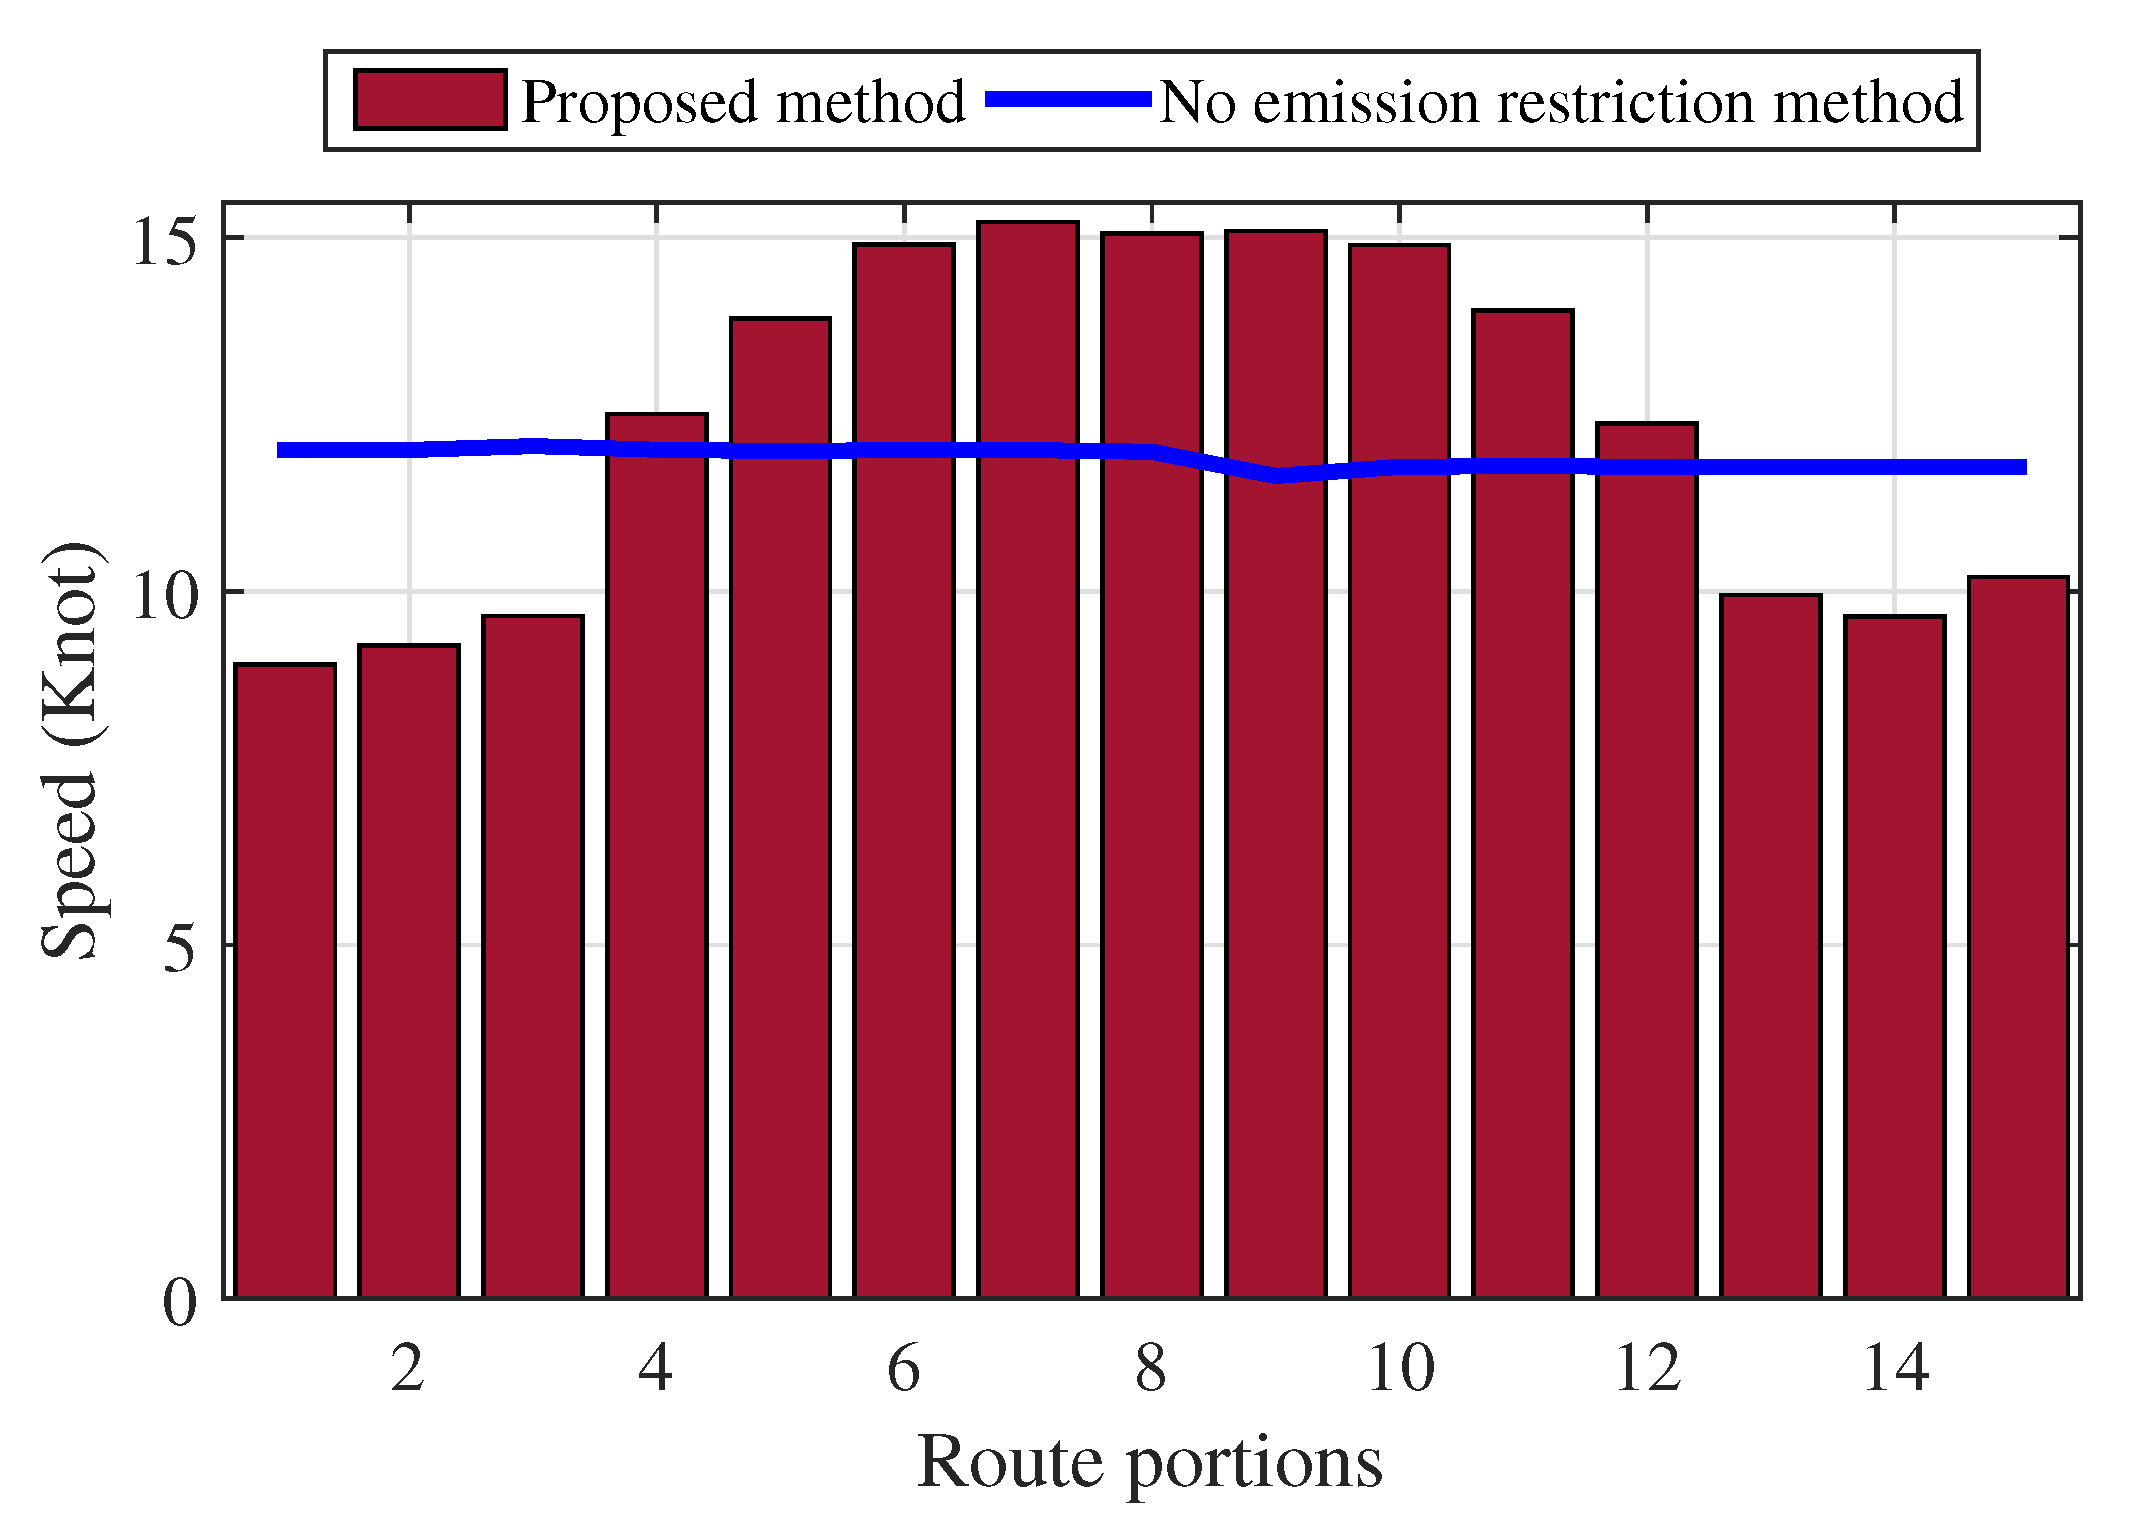
Figure 7, the speed is presented in Knot unit that is more common unit for speed measurement at seas. We have
(m/s)
(km/h). As shown in
Figure 7, emission limitations impose reducing the ship’ speed in first and last three portions of the route. Since the emission limitation in first three portions are more than emission limitations in the last three portions, the speed in first three portion is scheduled less than the speed in the last three portions. In international waters, i.e., portions 4–12, the ship’s speed changes such that the fast variations in the speed is prevented, the power ramp rate constraint of the diesel generator is satisfied and the ship arrives to the distention on time. This has let to an almost symmetrical scheduling for the speed in these portions.
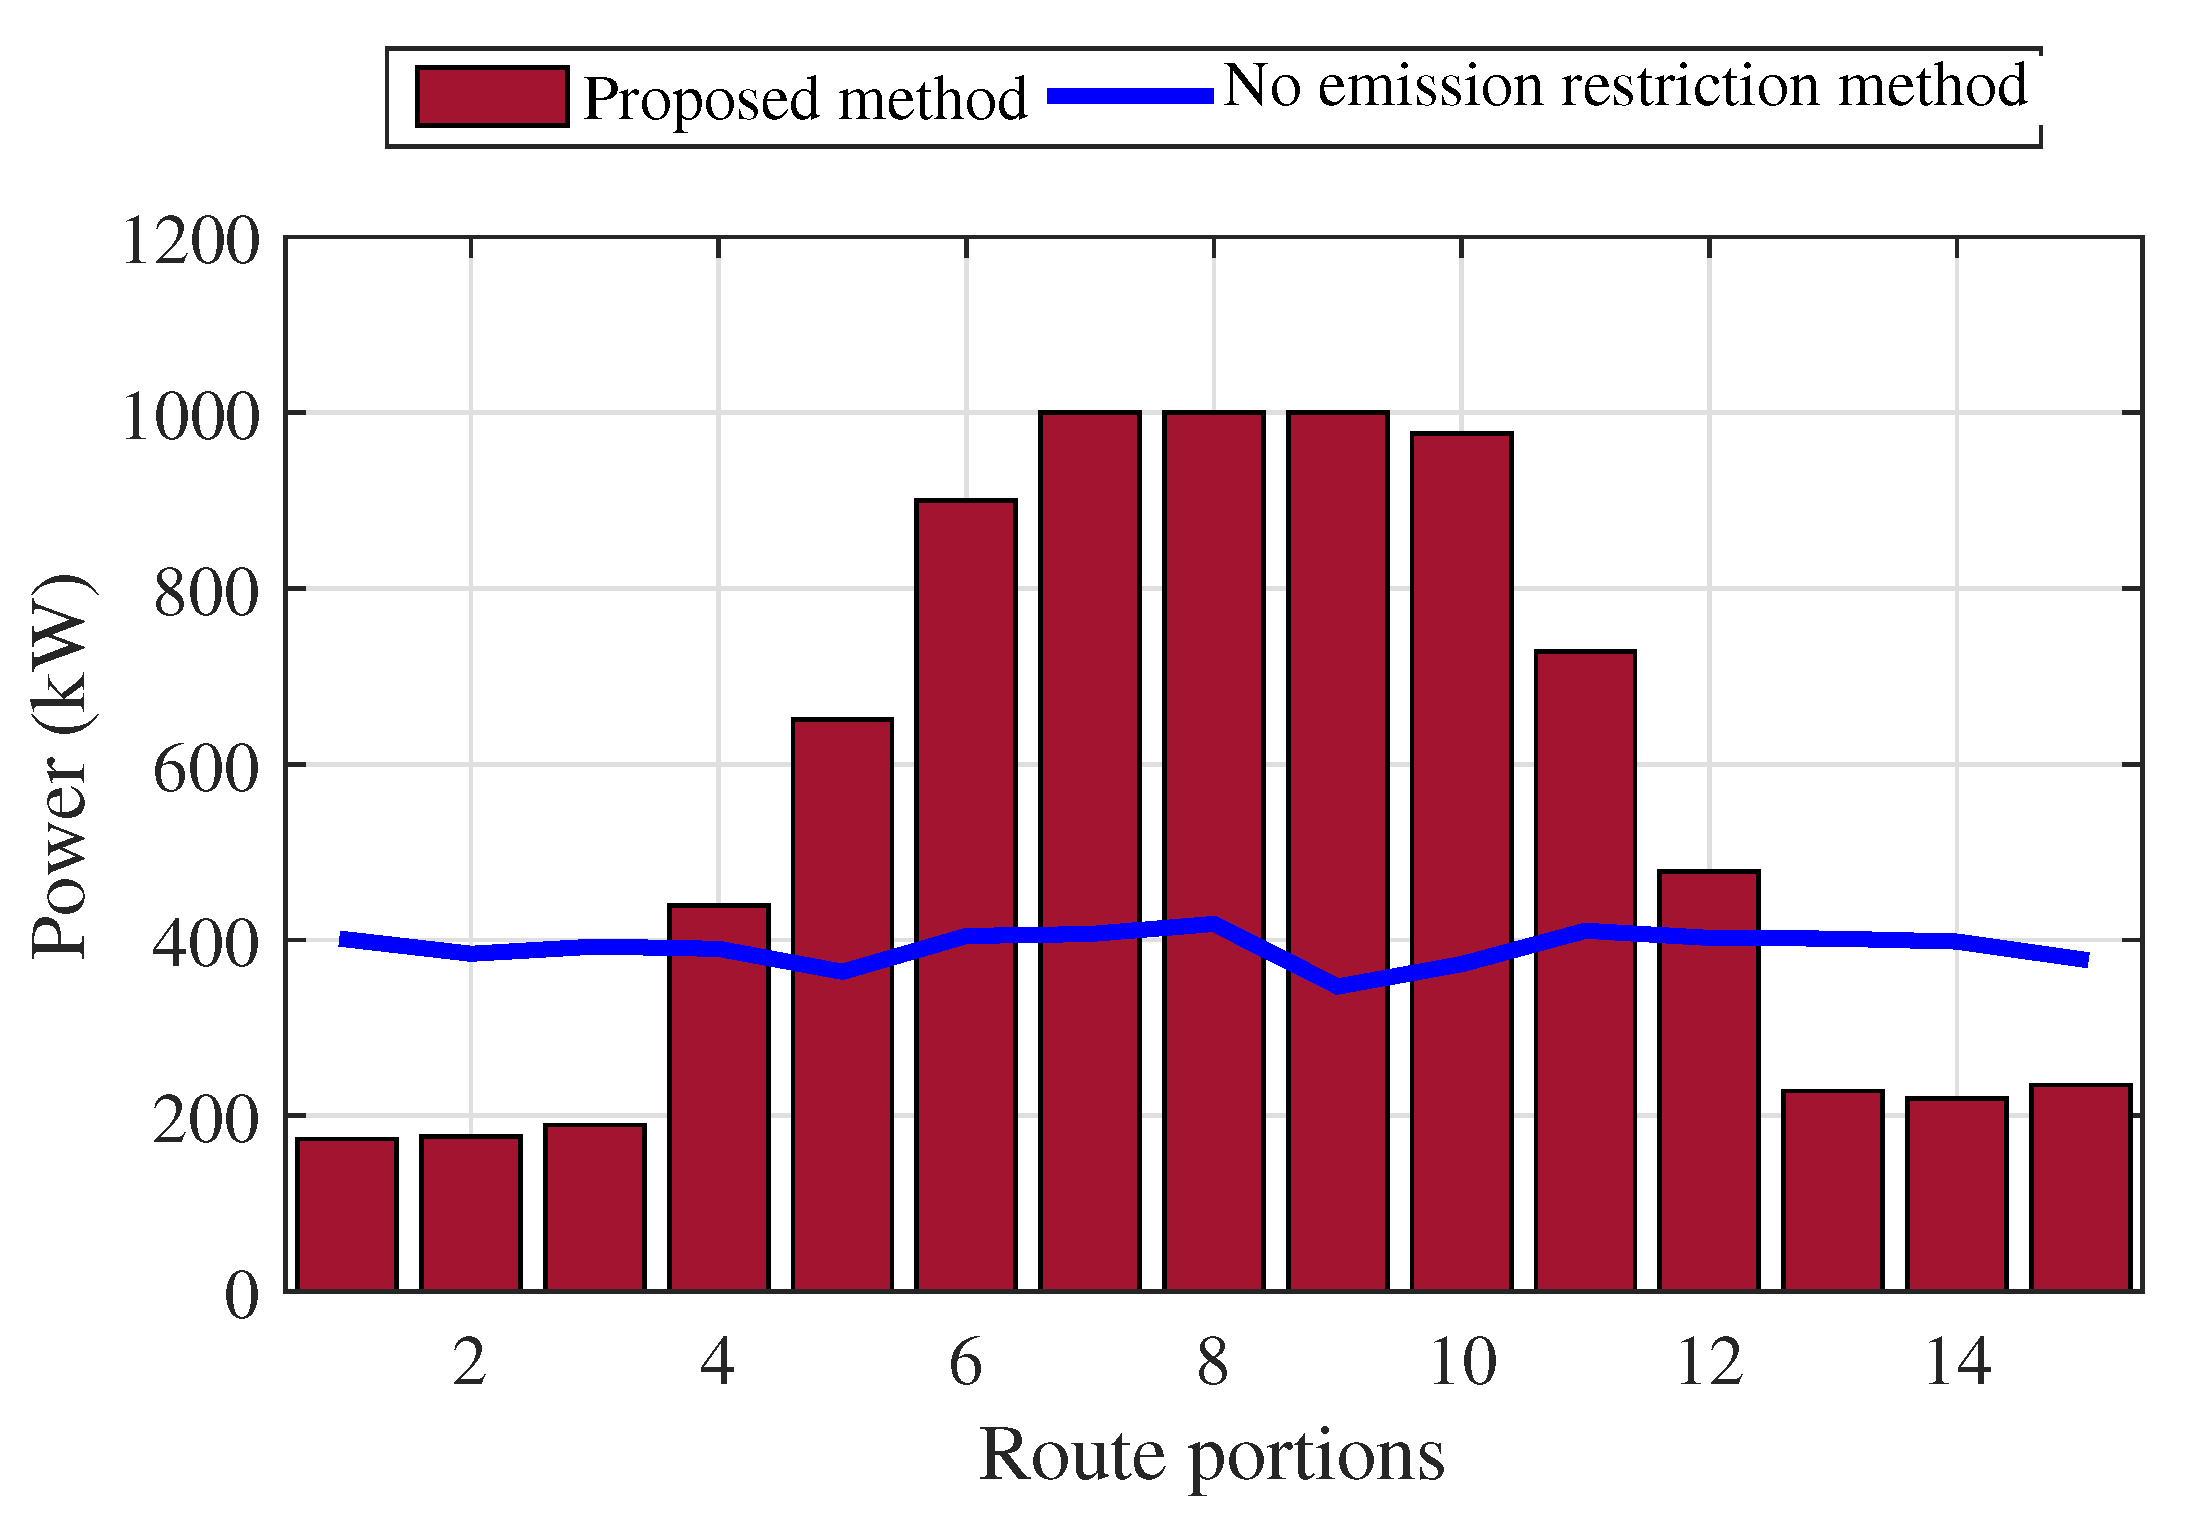
Scheduled output powers of the diesel generator are presented in
Figure 8. According to
Figure 8 diesel generator’s output power has a trend similar to the trend of speed due to the direct dependency of speed to power. In international waters, produced energy by the diesel generator in the First 50% of the route is about 6.5% less than its produced energy in the next 50% of the route. This happens because in the First 50% of the route the efficiency of the motors are high and hence, less energy is needed to reach to the scheduled speed. Power ramp rate constraint of the diesel generator is activated in portions 12 and 13.
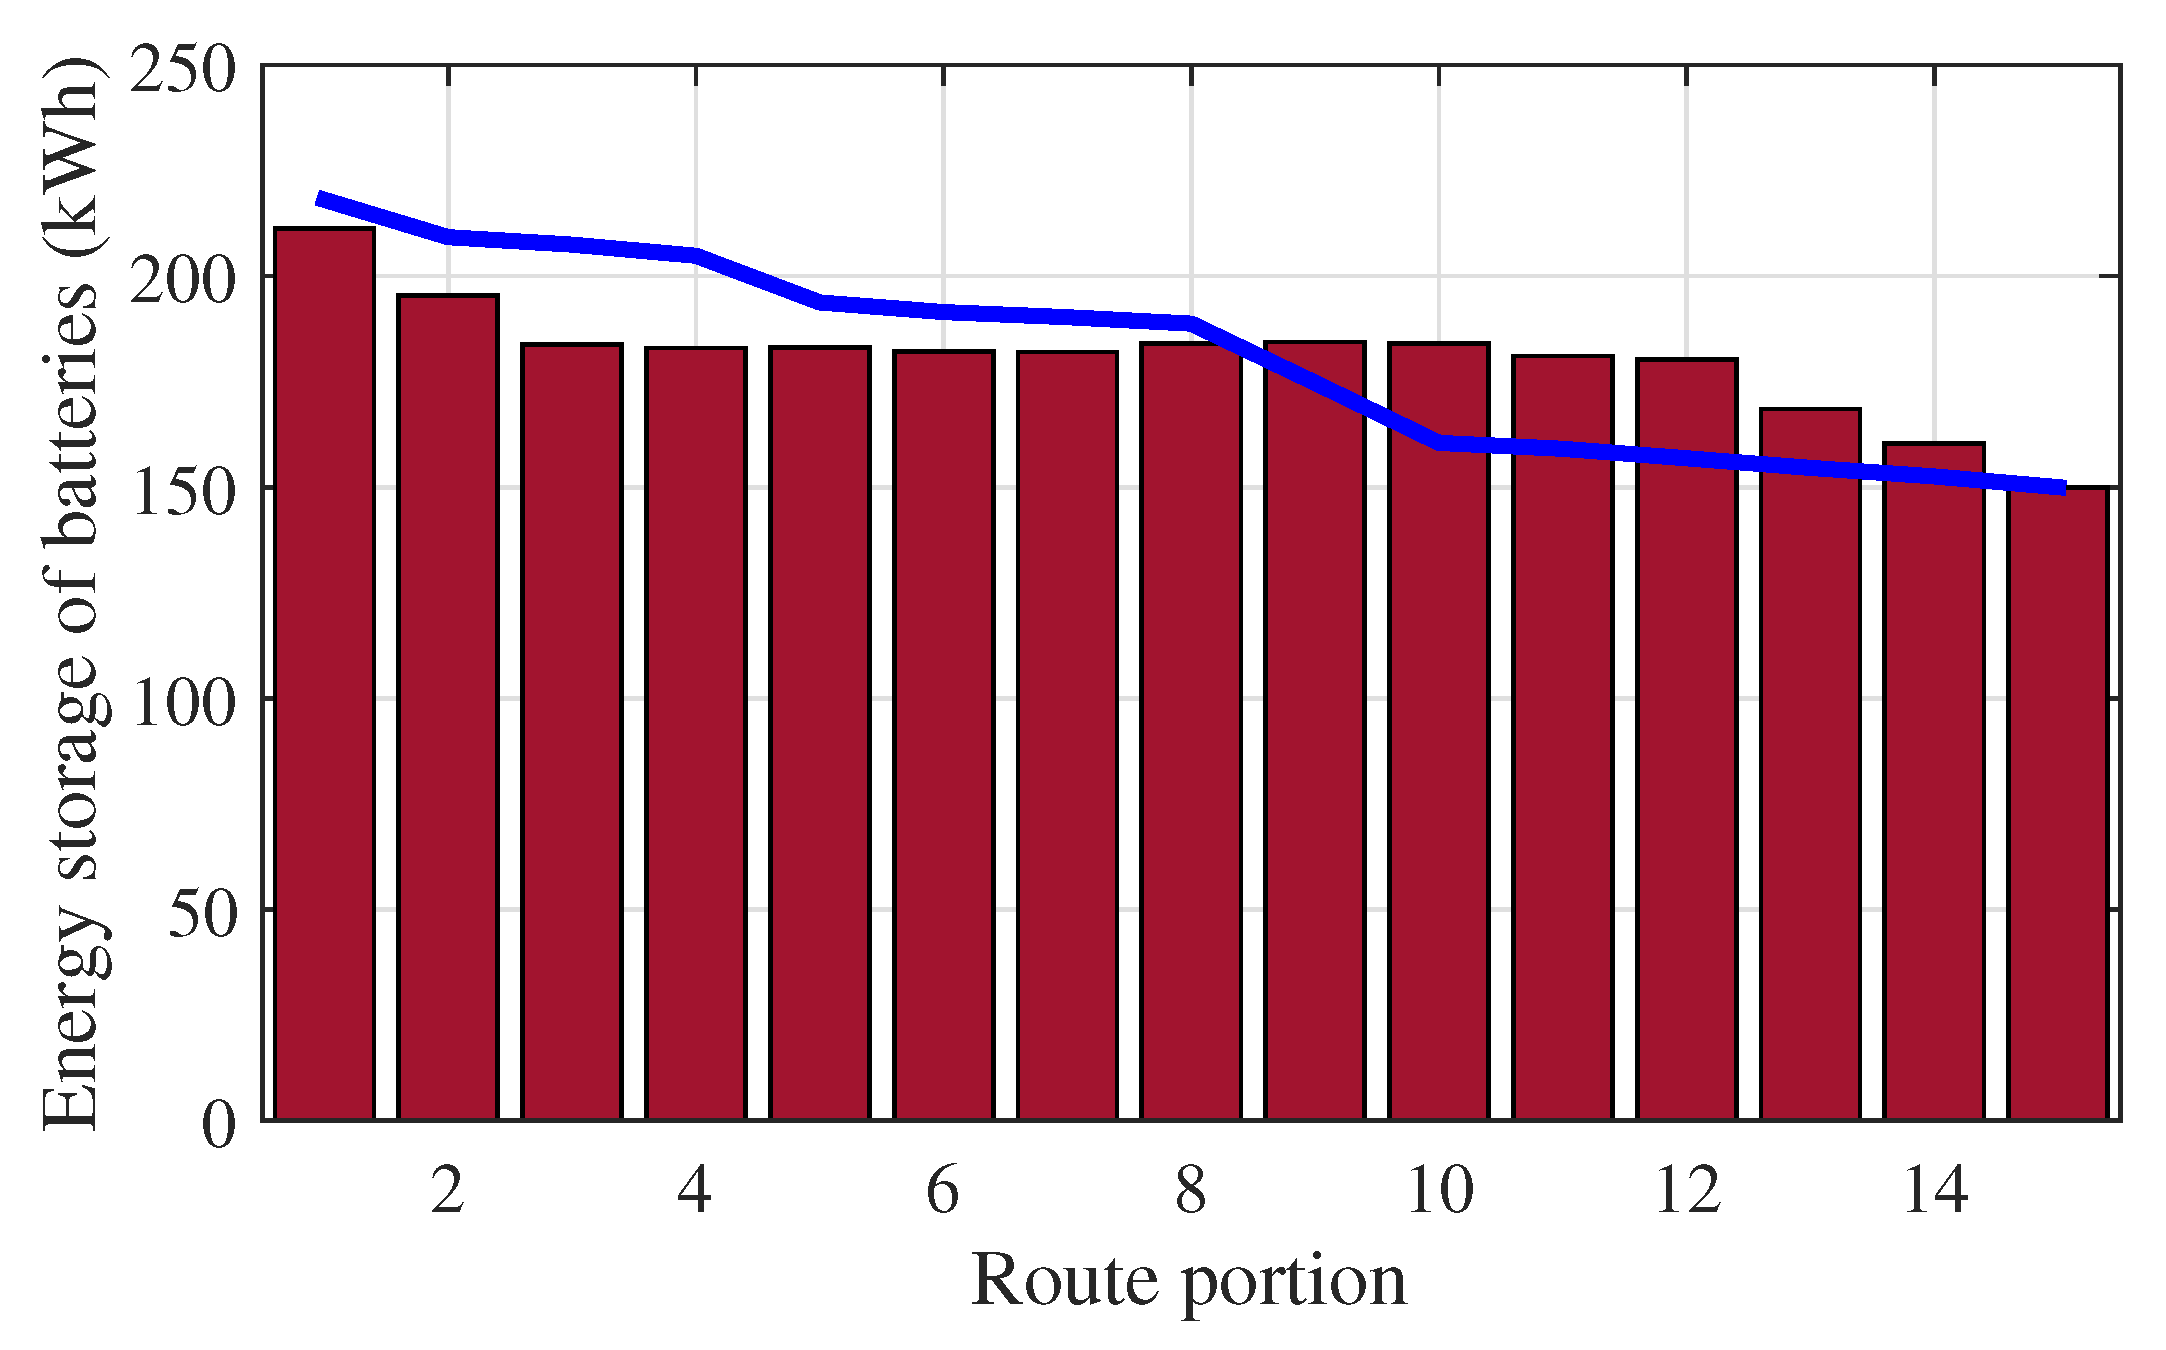
Figure 9 compares the batteries’ operation in the base case and the case that emission restrictions are not considered. When emission restrictions are ignored the batteries are discharged step by step during the sailing, but when the emission restriction are considered the battery is discharged mostly in first and last three portions. In fact batteries’ energy is discharged in these portions for supplying the motors instead of producing energy by diesel generator to meet the emission policy restrictions and also arrive to the destination on time.
According to
Figure 10, EVs are mostly charged when the ship is in international waters and sail in a stable speed. The average charged power of the EVs reduces when the ship is in the areas with emission restriction and when the speed changes rapidly.
Values of the emission index used in (
29) and (
30) are presented in
Figure 11. As shown in
Figure 11, emission is controlled in the first and last three portions of the route compared to the case that emission restrictions are not considered in the model.
Figure 11 also shows that for the understudy system, considering the emission restrictions in some areas has led to increasing the total value of emission index over all route portions about 34%. So, it can be concluded that local emission limitations might help for reducing the emission in specific areas but increases the emission in overall which is not proper environmentally.
4.2. Impacts of Weather Condition on the Results
In order to study the impacts of weather conditions on the results, a simulation is performed after removing equations related to weather conditions, i.e., Equations (
13)–(
15) from the optimization problem. Simulation results are presented in
Figure 12,
Figure 13 and
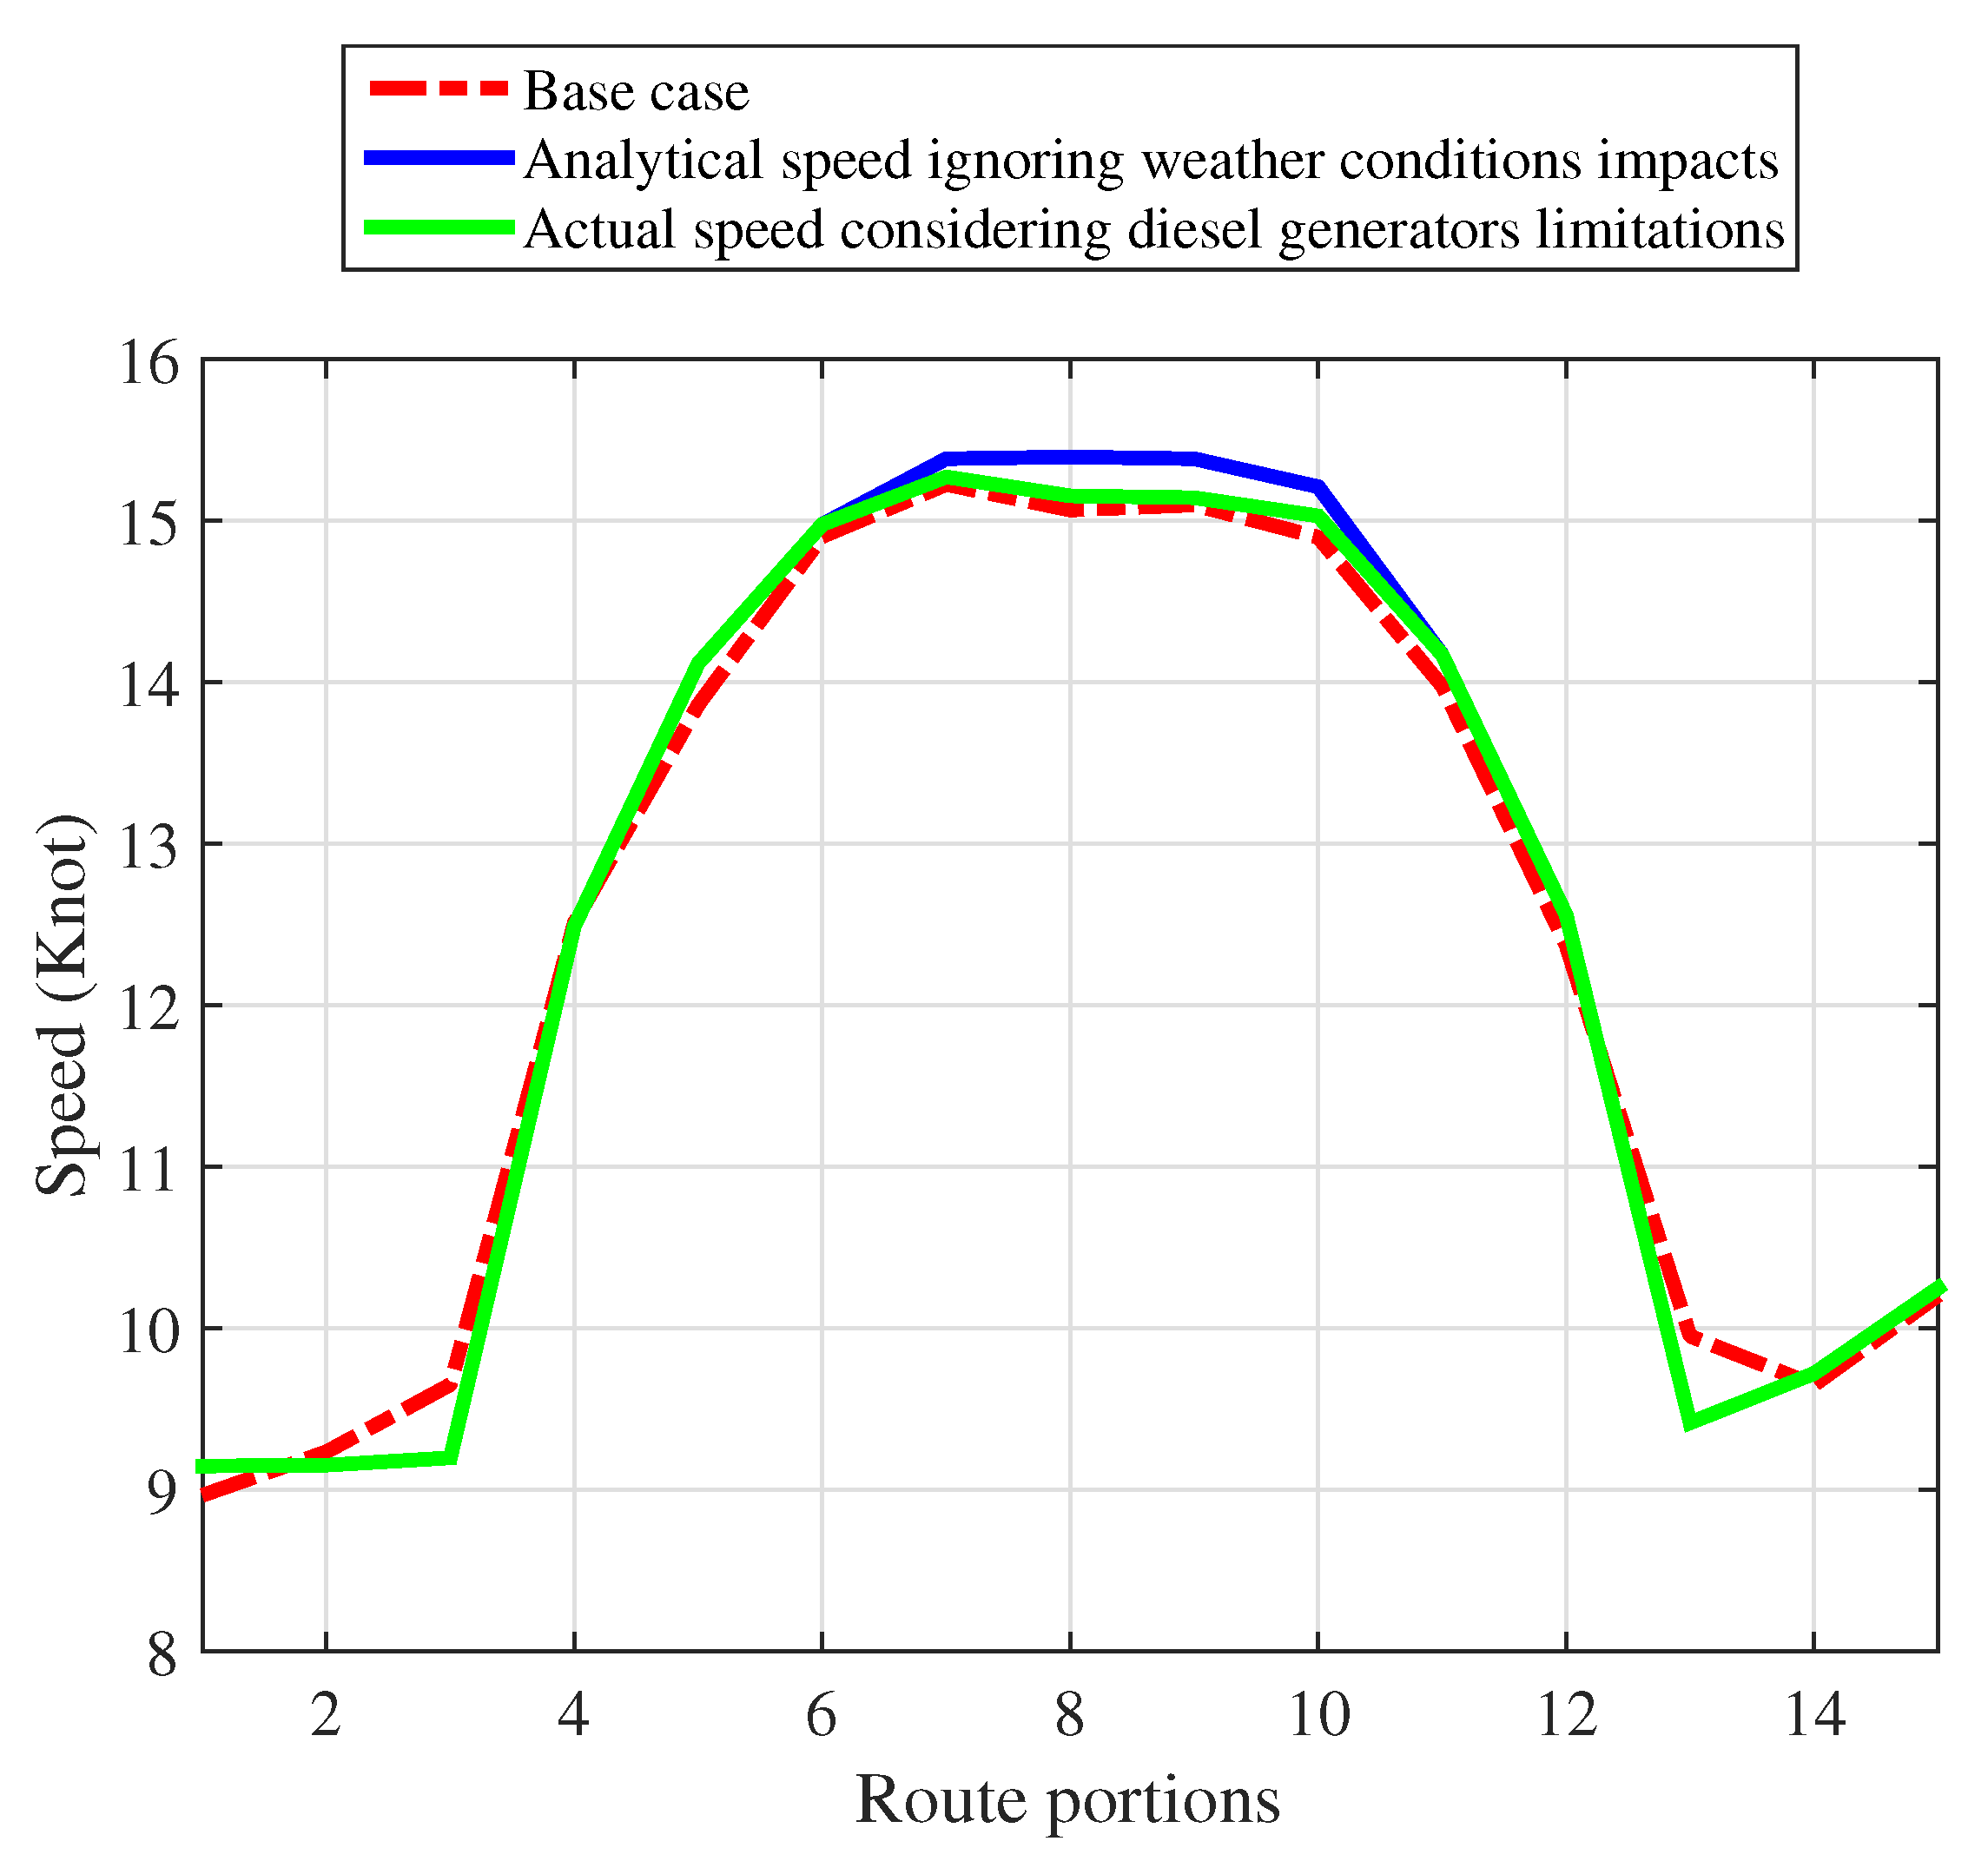
Figure 14. As shown in
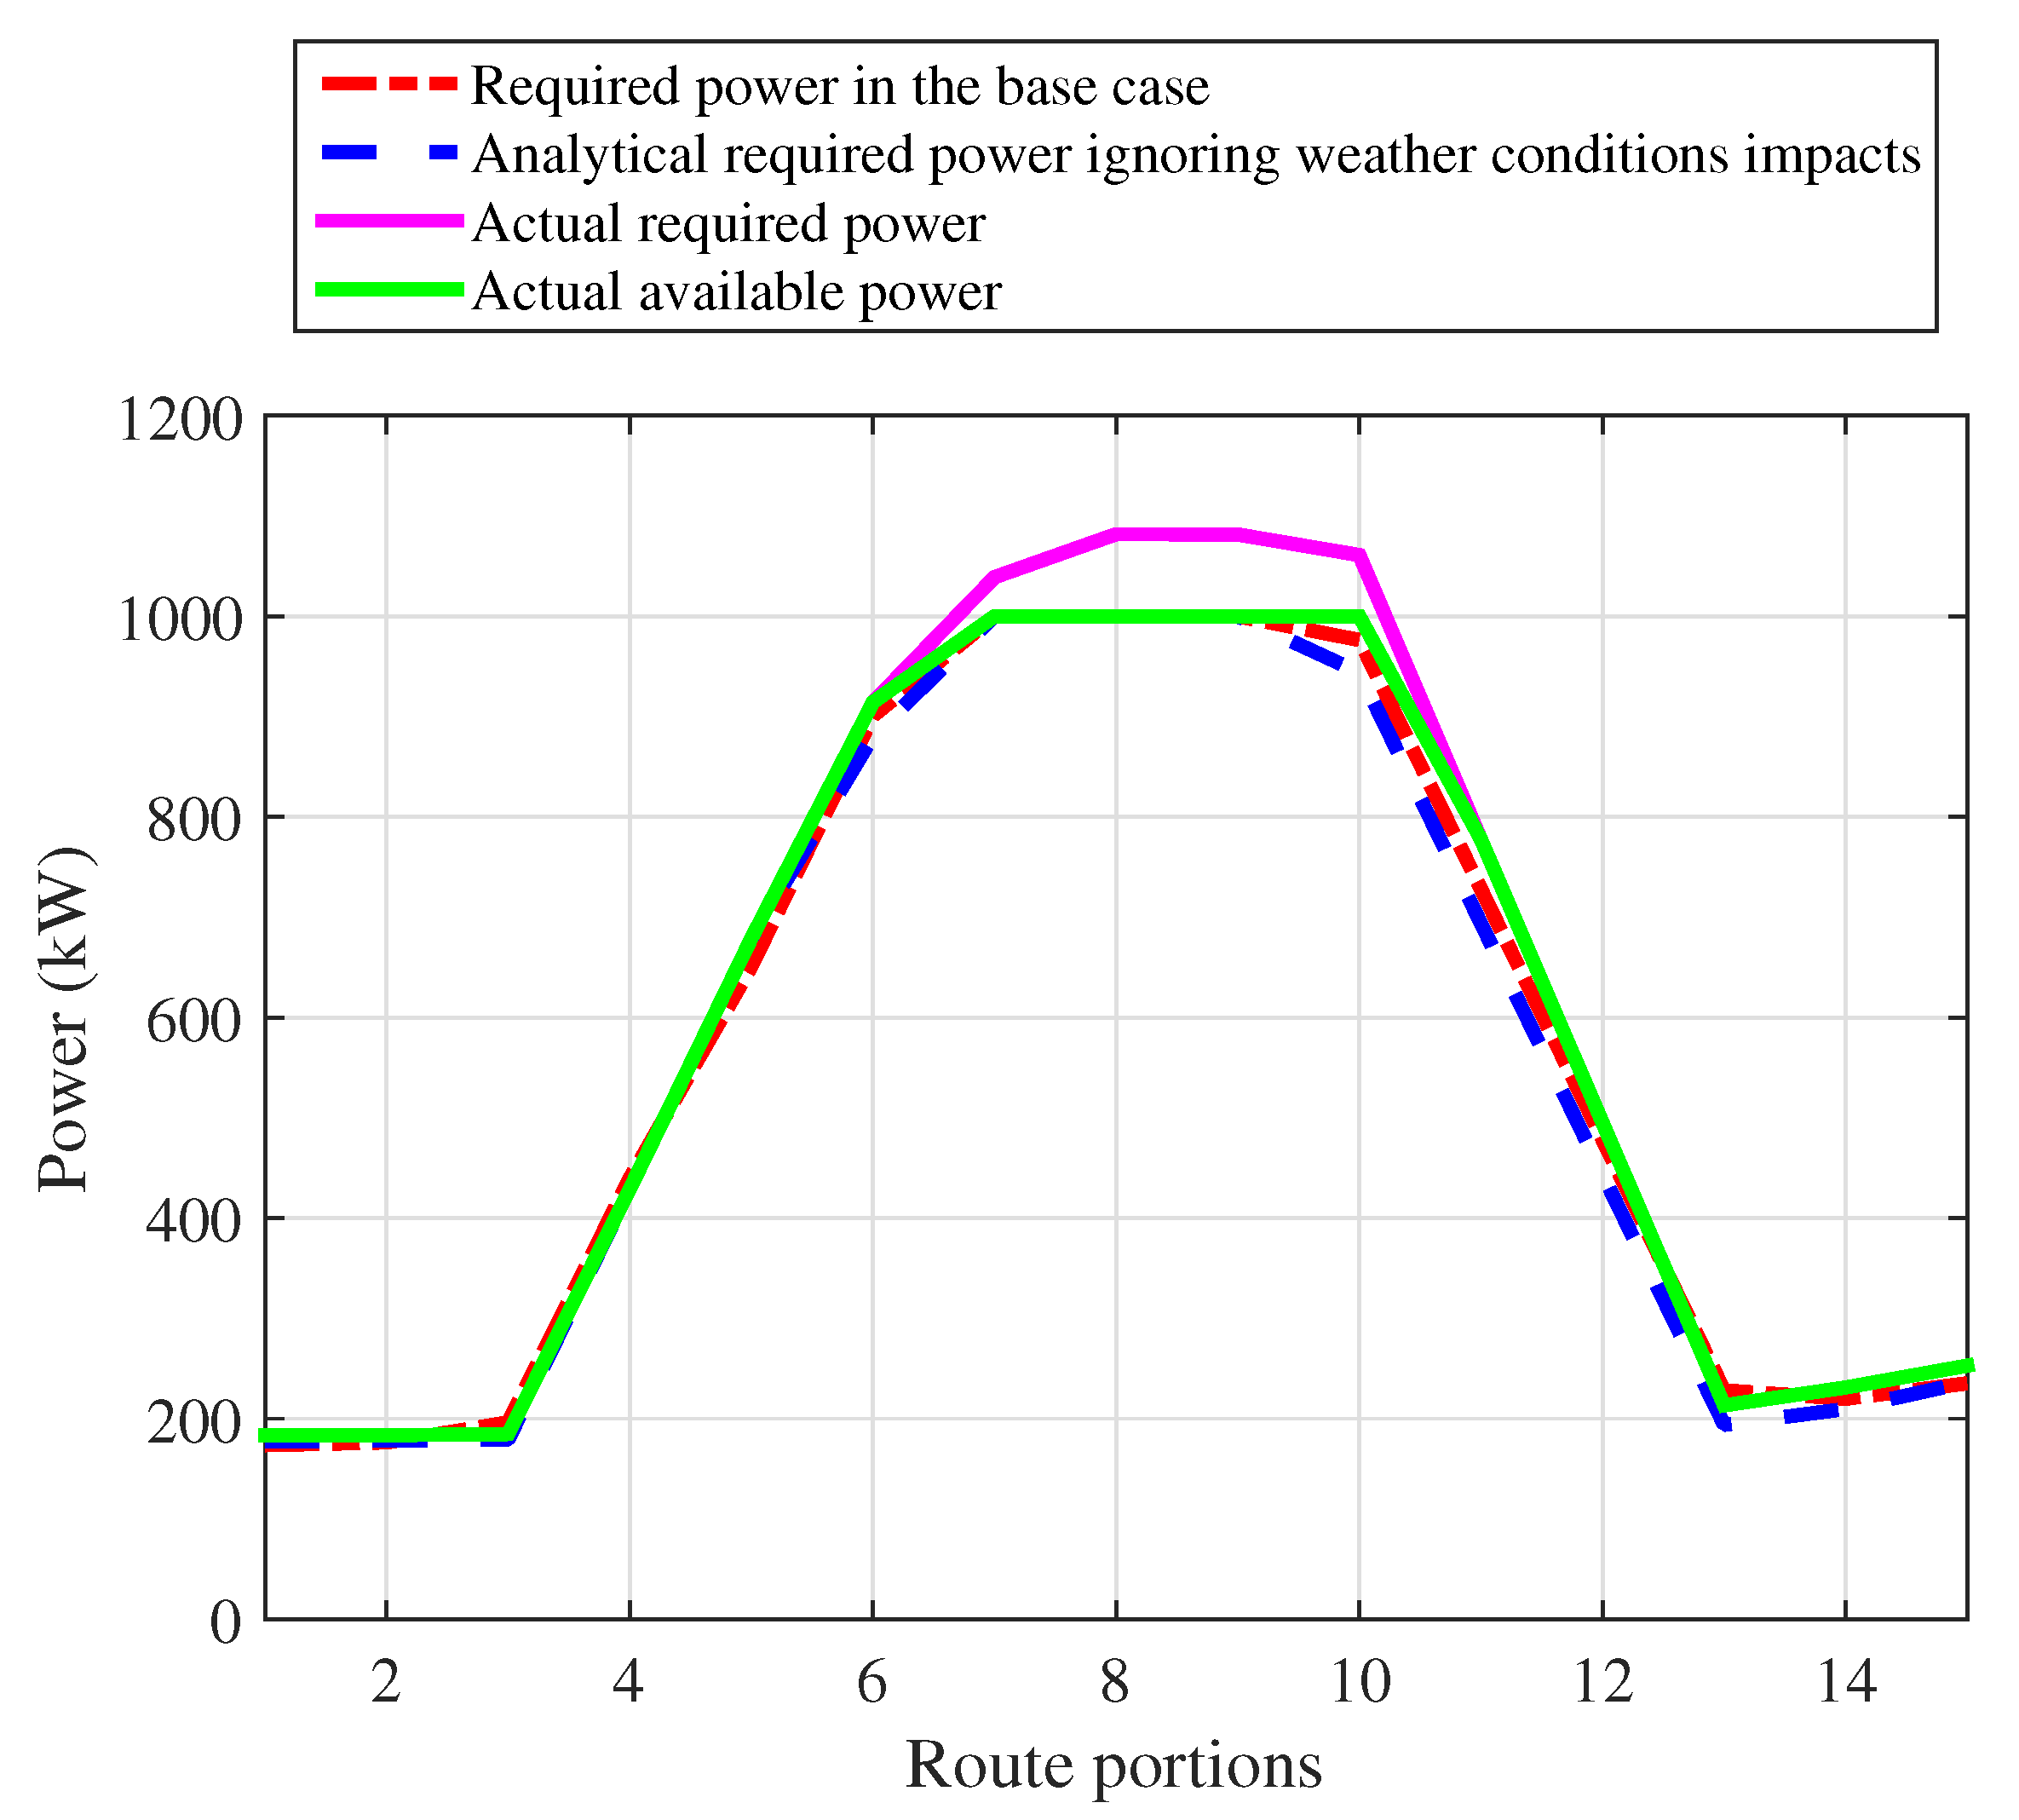
Figure 12 and
Figure 13, ignoring the weather conditions in the formulation results less estimated generated power by diesel generator (dashed blue line) and more estimated speed (blue line) for the ship in some portions when the motors’ efficiency decreases in the base case. This is obviously the result of ignoring the wind direction and sea state in the model. However, although these impacts are ignored in the mathematical formulation, they will affect the ship operation in practice. In fact, in order to reach to the scheduled analytical speed (blue line) in
Figure 13, the actual required output power for diesel generator will be similar to the
Figure 12 (pink line). But this power is above the maximum output power of the diesel generator and the output power will be set on the maximum value in these portions (green line). This leads to reduction in the speed of the ship in these portions of the route and could lead to delay on arriving the ship to its destination.
The charging and discharging scheduling of the batteries is also affected by ignoring the impacts of weather conditions in the optimization problem.
Figure 14 compares the charging and discharging scheduling of the batteries in the case of ignoring the impacts of weather condition with the base case. According to
Figure 14, while in the base case the most discharged power of the batteries are used in first and last three portions, the batteries are discharged almost uniformly in the case that the impacts of weather condition are ignored. This difference is explained as follows. The output power of diesel generator in both cases is limited in the first and last three portions because of the emission restrictions in the first and last three portions of the route. Now, due to the impacts of weather condition on the motors’ efficiency more required power is calculated for the motors in the base case compared to the case that the impacts of weather condition are ignored. Since, the output power of the diesel generator is limited in both cases due to emission restrictions, this extra required in energy in the base case in the first and last three portions is obtained from the batteries. This leads to more discharged power of batteries in the first and last three portions at the base case compared to the case that the impacts of weather condition are ignored.
It should be noted that in this paper only the impacts of three consecutive sea state conditions out of thirteen different conditions are considered in the model. Considering more states can highlight the impacts of weather conditions on the energy management results significantly.
4.3. Comparing the Operation Cost of the Ship in Different Cases
In this subsection, the ship’s operation cost is investigated in different cases. Understudy cases are as follows:
- Case 1:
fixed speed, discharged power of batteries, and charged power in EVs in all portions;
- Case 2:
optimal resources scheduling without emission policy restrictions;
- Case 3:
optimal resources scheduling without considering weather condition; and
- Case 4:
optimal resources scheduling considering weather conditions and emission restrictions.
Simulation results are presented in
Table 4. As shown in
Table 4, case 2 is the least fuel consumption and operation cost case in which there is no emission limitation and also the impacts of weather conditions are considered in the model. Case 1 that is the most common method for supplying the resources in the ship is about 0.8% more expensive because of ignoring the impacts of weather condition. When the emission restrictions are considered in the model (case 4), the operation cost increases about 28%. If the weather conditions are ignored in the formulation (case 3), analytical operation cost obtains USD 782 but in practice the operation cost will be USD 833.69 due to impacts of weather conditions on the realized operation of the ship. This means that considering the weather condition in the formulation can reduce the total operation cost up to 3.5%.

 ,
, 


