Article

From “Coal to Gas” to “Coal to Biomass”: The Strategic Choice of Social Capital in China

1
School of Business Administration, Shandong Women’s University, Jinan 250300, China
2
Institute of Agricultural Resources and Regional Planning, Chinese Academy of Agricultural Sciences, Beijing 100081, China
3
Department of Economics and Rural Development, Gembloux Agro-Bio Tech, University of Liège, 5030 Gembloux, Belgium
4
School of Economics and Management, Chongqing Normal University, Chongqing 400030, China
5
Research Center for Agricultural Green Development in China, Beijing 100081, China
*
Author to whom correspondence should be addressed.
Energies 2020, 13(16), 4171; https://doi.org/10.3390/en13164171
Submission received: 2 July 2020 / Revised: 4 August 2020 / Accepted: 10 August 2020 / Published: 12 August 2020
(This article belongs to the Special Issue Renewable Energy and Capital Markets)

Abstract

:
Currently, the Chinese government is promoting the transformation of clean energy in rural areas to reduce the consumption of coal to cope with the smog. It is mainly based on “coal to gas”. The development of biomass resources in agricultural areas is an alternative means of energy supply. In order to improve rural energy structure, we propose to upgrade “coal to gas” to “coal to biomass” derived from centralized biogas production (CBP) and straw-briquetting fuel (SBF). This study deals with the question of financing such projects. The public–private partnership (PPP) model is seen as a response that can mobilize social capital to finance investments in these new modes of production and energy supply in rural areas. Based on an analysis of the strengths, weaknesses, opportunities and threats (SWOT) of the two projects considered above, an analytic hierarchy process (AHP) was carried out with the assistance of experts in order to clarify the strategic choices which are more suitable for investors. First, we built a PPP strategic-decision model. The decision model was divided into four strategies (pioneering strategy, struggling strategy, conservative strategy and striving strategy) and two development intensities (conservative and proactive). We used this method to construct a SWOT–AHP model of the PPP strategy for CBP and SBF based on the investigation from the experts. The strategic-decision model identified that a pioneering strategy based on opportunity type is promised for SBF, while a more aggressive type strategy in struggling strategy is essential for the CBP. In order to encourage investors to adopt a positive and optimistic attitude towards the two projects, the public authorities have a role of guidance to ensure the mobilization of the social capital necessary for the construction of the projects.

Graphical Abstract

1. Introduction

In order to cope with smog in northern China, the Chinese government is actively promoting the transformation of clean energy such as “coal to gas” and “coal to electricity” [1]. During the winter, a sudden large-scale increase in gas consumption has led to “gas shortages” in many regions [2]. Various governance measures require huge investments [3,4]. Biomass energy utilization is an effective supplementary method. This method is developing towards clean utilization—bringing with it a large number of new technologies and new models [5,6]. The development of clean energy utilization in rural areas—especially the energy utilization of straw—is an essential indicator of sustainable development in rural areas [7,8]. According to the third national agricultural census data, in 2016, 49.3% of the households mainly used gas as cooking and heating energy [9]. Of the country’s farmers, 44% and 24% use firewood and coal as the primary cooking and heating fuels, respectively, and that regional differences are significant [10]. In northern China, close to 200 million tons of standard coal is used for rural heating. Most farmers use fire beds, wood stoves, coal stoves and other heating methods: the clean-heating level is less than 15% [11,12,13]. The development of clean energy is an important task to improve the energy structure, ensure energy security and promote the construction of an ecological civilization [14]. China aims to use about 30 million tons of biomass-forming fuel annually by the end of 2020. Today, the annual utilization of biomass gas (biogas, bio-natural gas, biomass gasification, etc.) is about 10 billion cubic meters. By 2035, the annual utilization of biomass-forming fuel is planned to be about 50 million tons, with an annual utilization of biomass gas of about 25 billion cubic meters [15].
Currently—to make full use of rural biomass resources in rural areas of China to improve rural energy structure—the government is vigorously promoting centralized biogas production (CBP) project and straw-briquetting fuel (SBF) projects. Therefore, we propose “coal to biomass” to replace “coal to gas” to build an energy structure improvement model based on CBP and SBF in rural areas [16]. However, in the biomass resource energy utilization project, there are problems, such as insufficient financial input and unreasonable capital investment structure. Through the investigation of large and medium-sized biogas projects in the Hebei Province from June to July 2018, we found that in the large and medium-sized biogas projects in rural areas, although the market demand is relatively large, there are still great difficulties with financing [17]. The government should guide social capital to invest in agricultural infrastructure construction to effectively meet the funding needs [18]. In December 2016, the first agricultural sector public–private partnership (PPP) guidance document was proposed to vigorously promote PPP in the agricultural sector [19]. With the increasing support of the government, the agricultural sector is becoming a hot-spot for PPP investment [20].
The PPP model refers to various partnerships established between the public and private sectors to provide public goods [21]. It builds partnerships between the public and private sectors to leverage their strengths and achieve win–win cooperation [22]. Therefore, the PPP model is favored and widely used in the field of public infrastructure construction [23,24,25]. It originated in the UK and quickly gained widespread application and promotion in the global public goods sector [26].
The social capital referred to in this article is different from the definition of the sociological category. It is the definition of economics category, and it has distinctive Chinese characteristics. The Chinese government official documents describe it as cooperation between the government and social capital, but the English expression is PPP. This may seems contradictory, but it is actually a description that fits the characteristics of China. It is clearly defined in the official documents of the Chinese government as: “social capital refers to domestic and foreign corporate legal persons that have established a modern enterprise system, but excluding government-owned financing platform companies and other controlling state-owned enterprises [27]“. In the UK, analysts usually divide economic activities into the public sector and the private sector [28]. The adoption of the public and private sector cooperation model is to use market forces, give play to the professional advantages of the private sector, improve the quality and efficiency of public products and public services and maximize public interests. The situation in China is obviously different from the UK; its important feature is that the state-owned economy is dominant. State-owned enterprises obviously do not belong to the private sector as understood by the UK. However, they cannot be completely equivalent to the public sector because state-owned enterprises still must follow the requirements of the modern enterprise system to engage in production and business activities in accordance with market rules and have their own profit requirements. In this case, China cannot strictly divide investment activities into public and private sectors in accordance with the same logic of the UK, but into government investment activities and corporate investment activities [29]. The enterprises mentioned here include private enterprises, state-owned enterprises and foreign-funded enterprises. Therefore, China’s “government-social capital cooperation” emphasizes cooperation between the government and various types of social capital entities. The social capital mentioned herein refers to various types of enterprises—including state-owned enterprises. This means that the PPP model promoted by China has similarities in basic concepts, framework mechanisms and evaluation standards with that of the cooperation between the public and private sectors emphasized in the UK, but with obvious Chinese characteristics. With the deepening of China’s investment system reform, the proportion of non-state-owned enterprises as the main body of social capital investment in the PPP model should gradually increase, so that the concrete practice of promoting the government-social capital cooperation in China is gradually approaching internationally. However, this transition is likely a very long process.
PPP investment faces a series of opportunities and challenges in rural regions and the field of agricultural resource utilization [30,31,32,33]. Our investigation in the North China Plain found that there were many successful cases in the vast rural areas of using biogas and straw briquetting to improve the rural energy structure and control rural-related air pollution. However, because “coal to natural gas” can achieve significant effects in the short term, “coal to biomass” is often overlooked. Wang et al. did research from the perspectives of model selection [16] and residents’ willingness [17], but none have studied the social capital’s willingness for the “coal to biomass” project. How we can attract social capital to solve the funding problem is an intricate problem that the public sector needs to solve. Therefore, it is necessary to understand the strategic choice of social capital and to specify policies in a targeted manner.
Therefore, this study analyzes the strategic choices of social capital for CBP projects and SBF projects. We collect data through two rounds of surveys. We use the SWOT analysis method to qualitatively evaluate the strengths, weaknesses, opportunities and threats of PPP investment for two types of projects [34]. We use the AHP analysis method to quantitatively evaluate the weight of each factor [35]. We clarify the type of PPP strategy and matching the PPP strategy that is most suitable for project development. We hope to provide a basis for decision-making by government and social capital.

2. Materials and Methods

2.1. Methods

The main functional activities of strategic selection are divided into three phases [36]. The first phase is the information input. In this phase, we incorporate, organize and classify information—including information collected or considered—as well as information on the strengths, weaknesses, opportunities and threats of organizations that directly influence the strategy. The second is the match. This phase relies on the information obtained during the information input phase to match external opportunities and threats with internal strengths and weaknesses. In order to effectively build an alternative strategy, matching external and internal important factors is critical. The third phase is decision-making. In this phase, matching techniques define alternative strategies, while analysis and intuition provide the basis for strategic decision-making. At this point, the strategic management team needs to reexamine the organization’s ultimate purpose, evaluate the context in which the organization operates and evaluate the organization’s alternative strategy.
As one of the strategic planning methods, SWOT analysis is widely used to define organizations and company development strategies. However, it is also used to assess people or investment projects [37]. The SWOT method is universally used in strategic research because of its intuitive analysis and simple use [38]. The reliability and scientific of the SWOT analysis depends mainly on the capabilities and expertise of the participants [36]. Tzelepi et al. studied the challenges in the scenario of lignite substitution with biomass using a SWOT analysis in order to achieve the coal phase-out EU goal [39]. Kordana et al. laid the foundation for the development of a strategy to develop drain water heat recovery systems by the SWOT/TOWS method [40].
As a decision-making method, AHP was firstly proposed by Professor T. L. Saaty of the University of Pittsburgh. It is a process of layering and structuring multiple influencing factors [41]. The biggest feature of AHP is that the qualitative description is transformed into a quantitative way to express the subjective judgment of the evaluator [42], it offers a reliable basis for the development of scientific and rational decision-making goals [43]. Numata et al. used AHP to conduct barrier analyses for the deployment of renewable-based minigrids in Myanmar [44]; Iva and Mateo also used the AHP approach to choose optimal solar power plant locations in Croatia [45]. However, AHP has its limitations. In fact, it is difficult to ask the respondents to repeat evaluations, as their judgments are not consistent.
Combining the SWOT analysis method with the AHP analysis method—and based on the SWOT qualitative descriptive analysis method—the quantitative analysis method AHP is introduced to quantify the more complicated strategic decision problems in reality, and the elements in the decision-making process can be systematically evaluated. The priority of this enhances the ability of SWOT analysis in strategic decision-making [46].
Kurttila et al. applied AHP–SWOT analysis to the strategic decision of Finnish forestry for the first time [47]. In recent years, many scholars have adopted the AHP–SWOT analysis method in decision-making processes in different fields. Shrestha et al. applied AHP–SWOT analysis to the strategic decision-making of forestry and animal husbandry complex systems in central and southern Florida [46]; Oliver Gottfried et al. applied SWOT–AHP–TOWS analyses to provide a reference for strategic decision-making of private investment in biogas [48]. Other areas of application include the biomass energy industry [49,50], water resources [51,52], new energy transportation [53], solar energy [54], cultural tourism [55,56,57], aquaculture [58], electronic consumption [59], etc.

2.2. Data Collection

2.2.1. SWOT Analysis

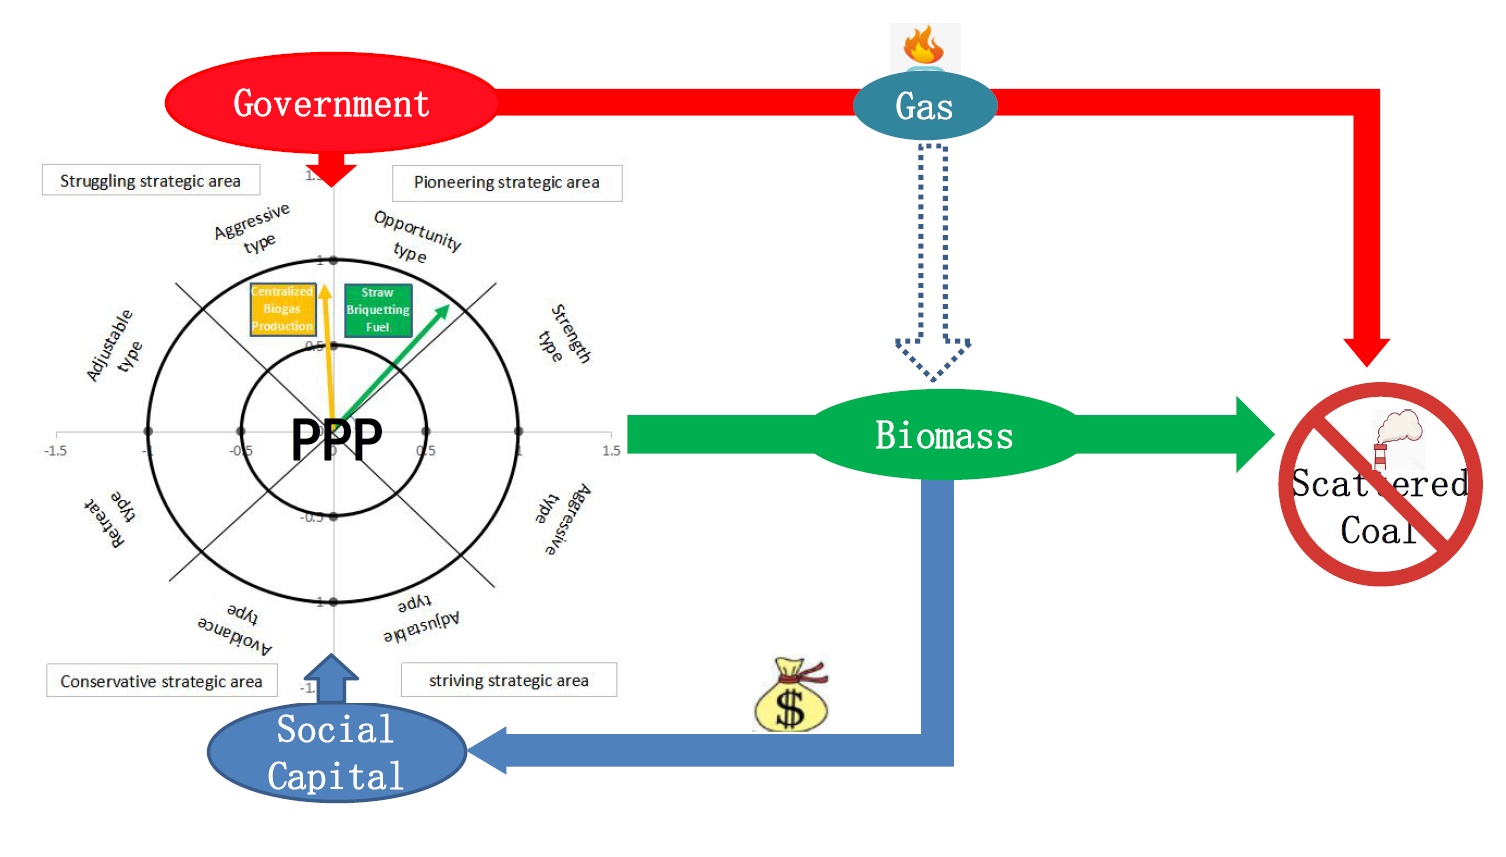
First, by consulting the literature and field research methods, we identified a database, then organized experts to screen, and finally determine the key factors of the strategy, the strengths (S) and weaknesses (W) of the internal environment and opportunities (O) and threats (T) of the external environment. From June to July 2018, we investigated in Hebei Province and Shandong Province, constructing a list of key factors for the PPP strategy of the CBP and SBF projects. The main reasons for choosing these two provinces as the investigation objects were mainly based on: (1) Both of the provinces are located in areas with relatively serious air pollution; (2) both have promoted the “coal to gas”; (3) straw resources are relatively abundant; (4) both are vigorously carrying out the PPP model in various fields.
In January–February 2019, 50 people were invited to screen key factors through questionnaires and interviews. All of these 50 people were professionals in the biomass energy industry. Among them, 32 were employed in a biomass energy enterprise (mainly worked as the investment managers, senior executives, etc., 19 of them had PPP project investment experience, and 13 had received PPP investment training.); 7 scientific researchers lacked PPP investment experience, but they had academic research on PPP investment; 2 administrative staffs worked in the government, they had PPP investment management experience in the public sector; 4 administrative staffs worked in industry associations, they participated the preparation of research reports on PPP investment projects; 5 doctoral candidates, who focused on the subject of biomass resource utilization and had studied PPP investment expertise at a deeper level. In the questionnaire design, we listed 6–10 factors for each SWOT group and asked the respondents to rank the importance of the factors in each group of the lists based on their own understanding of the project. According to the order of importance, we calculated the score for each factor—and based on the score for each group—filtered out 4 key factors.

2.2.2. AHP Analysis

On the basis of determining the key factors of SWOT, in April 2019, 20 experts who were focused on the utilization of biomass resources were invited to evaluate quantitatively by the Delphi method. The 20 experts were all from biomass energy enterprise, mainly served as investment managers, senior executives, etc. The experts were also very professional in the SWOT survey. Among the experts, more than 70% had worked for more than 5 years in the biomass energy industry. All of them had a bachelor’s degree or above. Nineteen experts had PPP project investment experience, and 1 had received PPP investment training. The evaluation used the 1–9 scale method (Table 1) [41]. The methods mainly included questionnaires, interviews and comparing the S, W, 0, T groups and the elements in each group. Then, we scored them to obtain their relative important values. After two rounds of scoring and communication, the expert pair-wise comparison scores were weighted proportionately to find the final numeric rating in rounding. Finally, we obtained the judgment matrix of SWOT groups and the judgment matrix of each subfactor [42].
When all the indicators are compared, a comparison judgment matrix can be obtained:
B = ( b i j ) n × n = [ b 11 b 12 b 1 i b 1 n b 21 b i 1 b ii b n 1 b nn ]
b i j is expressed under the criterion layer B , the importance of B i is relative to B j .
Calculating the weighting factor. According to the judgment matrix, finding the largest eigenvalue.
The feature vector w corresponding to λ max is normalized, that is, the order of importance of each evaluation factor is sorted. The formula for calculating λ max is as follows:
B w = λ max w
Then calculating the geometric mean of each row element of the judgment matrix B :
w ¯ i = j = 1 n b i j n ( i = 1 , 2 , 3 , , n )
where n is the order of the judgment matrix B .
Then normalizing the vector:
W ¯ = ( W ¯ 1 , W ¯ 2 , W ¯ 3 , , W ¯ n , ) T
w i = w i ¯ j = 1 n w j ¯ ( i = 1 , 2 , 3 , , n )
where w i is the weight coefficient value of each index sought, and the last weight coefficient values constitute the weight vector:
w = ( w 1 , w 2 , w 3 w n ) T .
We also conducted a consistency check. The purpose of the consistency check was to confirm whether the weight distribution obtained above is reasonable. If the matrix failed the consistency check, it was necessary to provide feedback to the scorer to make appropriate modifications to the indicator score. The evaluation indicators were calculated as follows:
C R = C I / R I .
In the judgment matrix, CR is the random consistency ratio. CI is an indicator for measuring the deviation of the judgment matrix from consistency:
C I = λ max n n 1
RI is the average random consistency index of the judgment matrix. The values of the specific 1–9 order RI are as follows (Table 2) [41].
When CR ≤ 0.1, judgment matrix B is generally considered to have satisfactory consistency. Otherwise, the judgment value should be adjusted until the consistency check is passed.
The process of determining the key factors was as follows: Since the criterion layer was divided into four categories of S/W/O/T in the process of analytic selection of key factors, only the weight of factors under a single criterion is calculated and the calculation of combined weights can be omitted. In principle, factors with a weight coefficient greater than 1/n (n is the number of factors under each criterion) are key factors.

2.3. Calculation

This process of calculating the collected data, include strategy quadrilateral, strategy azimuth and strategy intensity coefficient. The specific calculation process is as follows [43,55].
The calculation process of the strategy quadrilateral is:
First, by calculating the weights within each group, we can get the local priority:
Si/Wi/Oi/Ti, i = 1, 2...a
Second, by calculating the weights between groups, we get Sw, Ww, Ow, Tw.
Third, we calculate the global priority GSi/GWi/GOi/GTi
GSi = Sw × Si, i = 1, 2...a
GWi = Ww × Wi, i = 1, 2...a
GOi = Ow × Oi, i = 1, 2...a
GTi = Tw × Ti, i = 1, 2...a
Forth, according to the weight of each factor, we calculate the total strengths, total weaknesses, total opportunities and total threats. The formula is as follows:
Total strengths: S =
G S i / a , i = 1 , 2 , , a
Total weaknesses: W =
G W i / a , i = 1 , 2 , , a
Total opportunities: O =
G O i / a , i = 1 , 2 , , a
Total threats: T =
G T i / a , i = 1 , 2 , , a
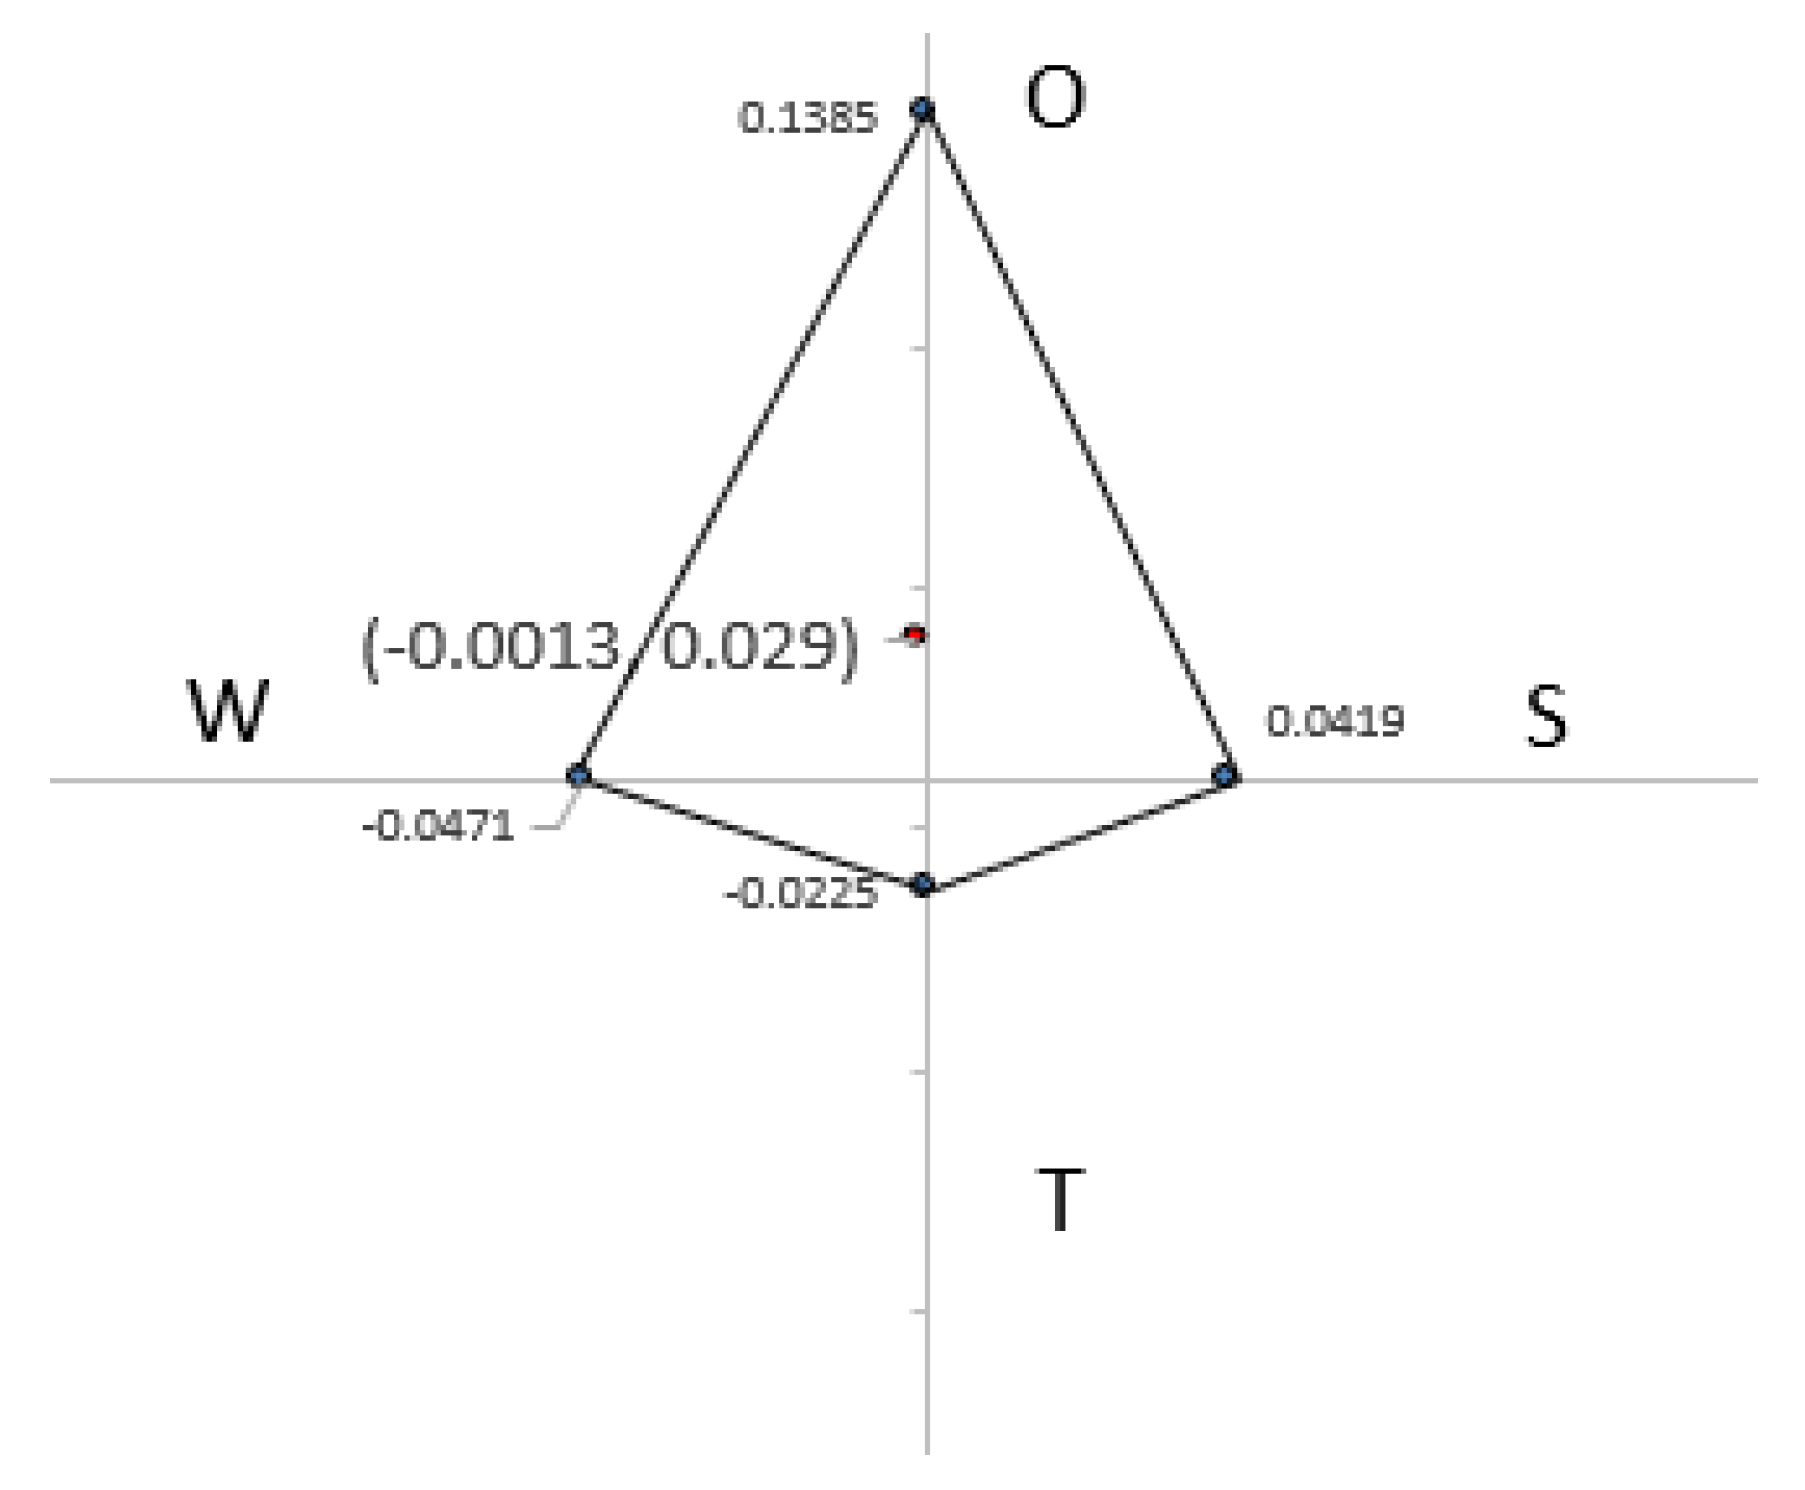
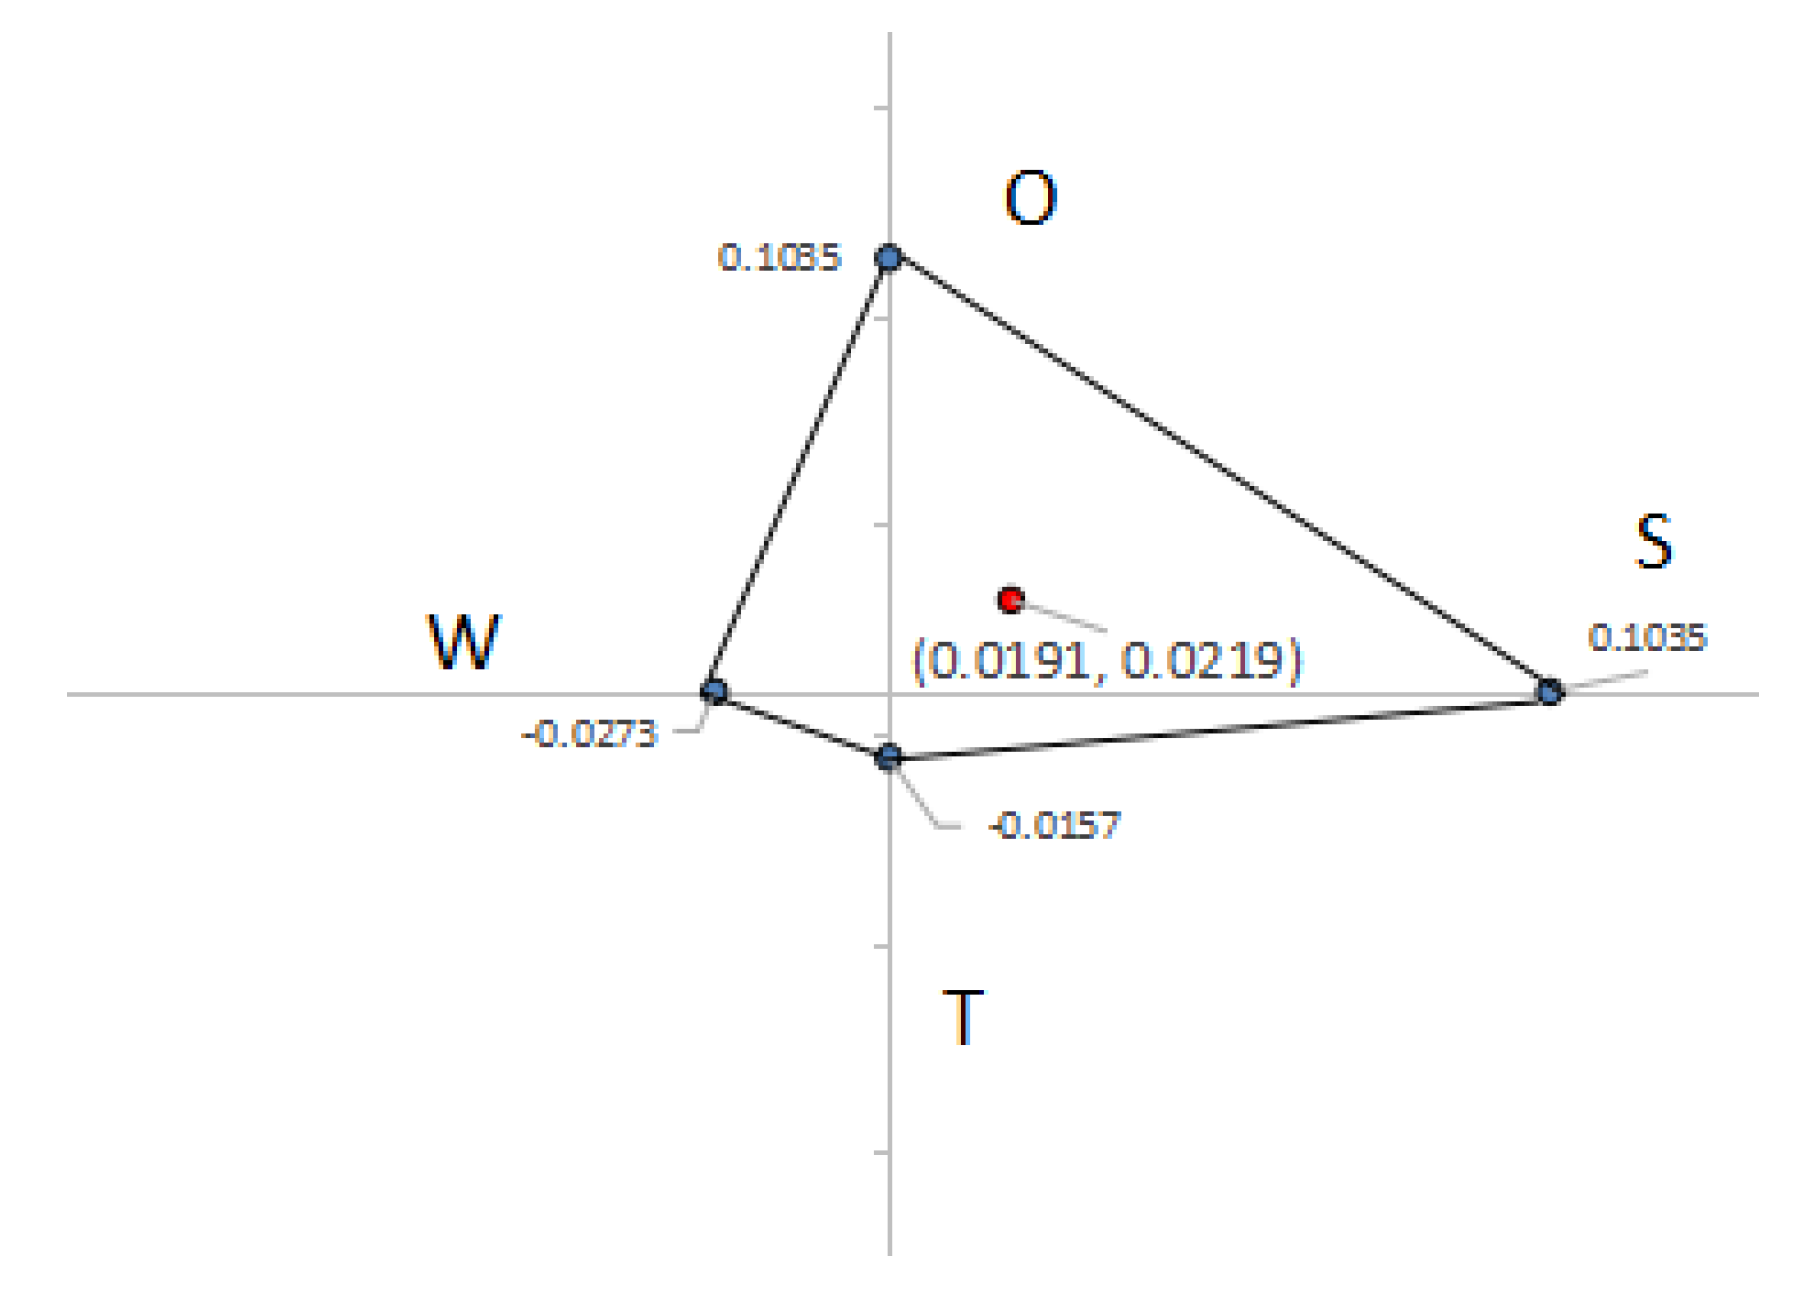
The four variables of S/W/O/T are each a semi-axis to form a coordinate system. The four-point connection is obtained in turn to obtain the development strategy quadrilateral, and the center of gravity of the quadrilateral reflects the combined effect of the four factors. That is to say, the corresponding development strategy of the interval where the center of gravity coordinates is taken.
The center of gravity coordinates of the strategic quadrilateral is P ( X , Y )
P ( X , Y ) = ( x i / 4 , y i / 4 )
Respectively, x i = S + W and y i = O + T .
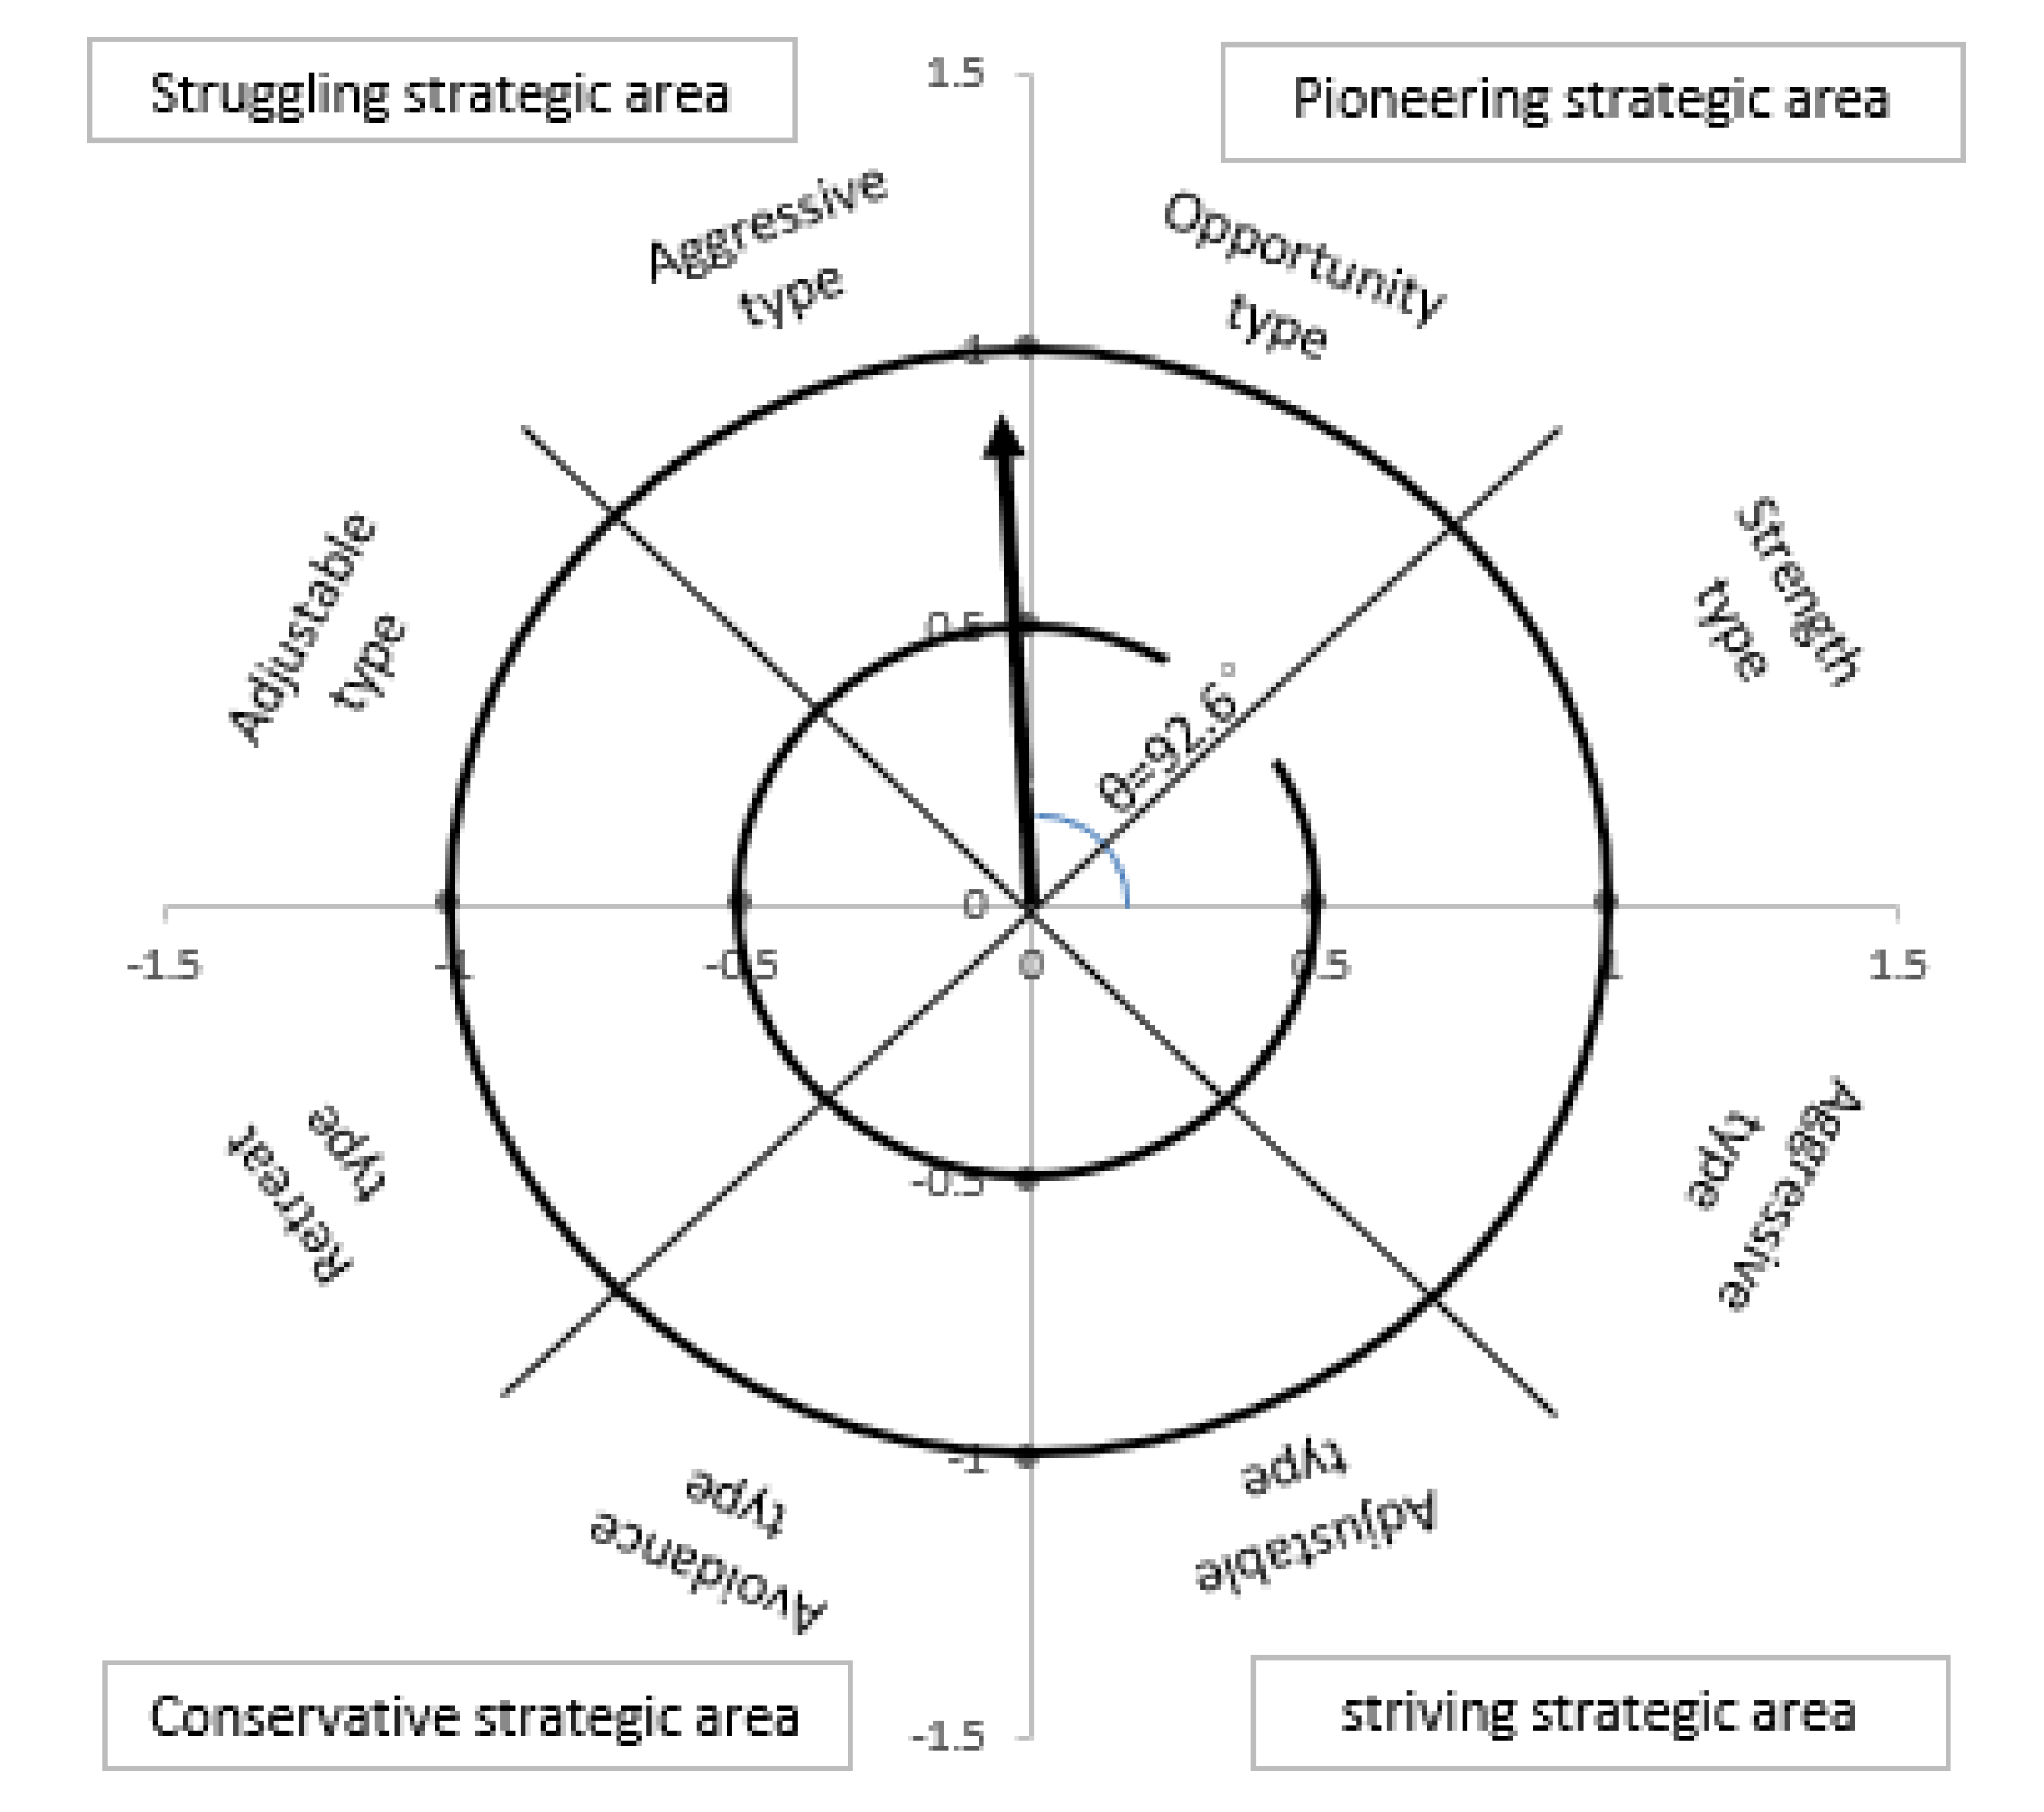
The calculation process of the strategy azimuth is:
The strategic azimuth angle θ (0 ≤ θ ≤ 2π) = arctan (Y/X). In particular, when X = 0 and Y > 0, θ = π/2, when X = 0 and Y < 0, θ = 3π/2. The strategy type is determined according to the θ size.
The calculation process of the strategy intensity coefficient is:
For the same type of strategy, we can adopt a positive development attitude or conservative attitude. The specific strategic positive intensity and strategic negative intensity need to be considered comprehensively [43,55]. Therefore, it can be judged by calculating the strategic intensity coefficient ρ.
The strategic positive intensity is U = O × S, where O and S, respectively represent opportunities and strengths, that is, the strategic positive intensity is the result of the interaction of external opportunities and internal strengths;
The strategic negative intensity is V = T × W, where T and W, respectively represent threats and weaknesses, that is, the strategic negative intensity is the result of the interaction of external threats and internal weaknesses.
What kind of intensity should be taken requires a combination of the strategic positive intensity and the strategic negative intensity. It can be judged by calculating the strategic intensity coefficient. The strategic intensity coefficient ρ is defined as ρ = U/(U + V), ρ ∈ [0, 1], and the magnitude of ρ reflects the intensity of implementation of the strategic type. As the value of U increasing, the strategic intensity coefficient increases, indicating that the strategic intensity is enhanced. As the V value increasing, the strategic intensity coefficient decreases, indicating that the strategic intensity is weakened. Generally, 0.5 is used as a critical point. When ρ > 0.5, a positive strategy is adopted; when ρ < 0.5, a conservative strategy should be adopted.

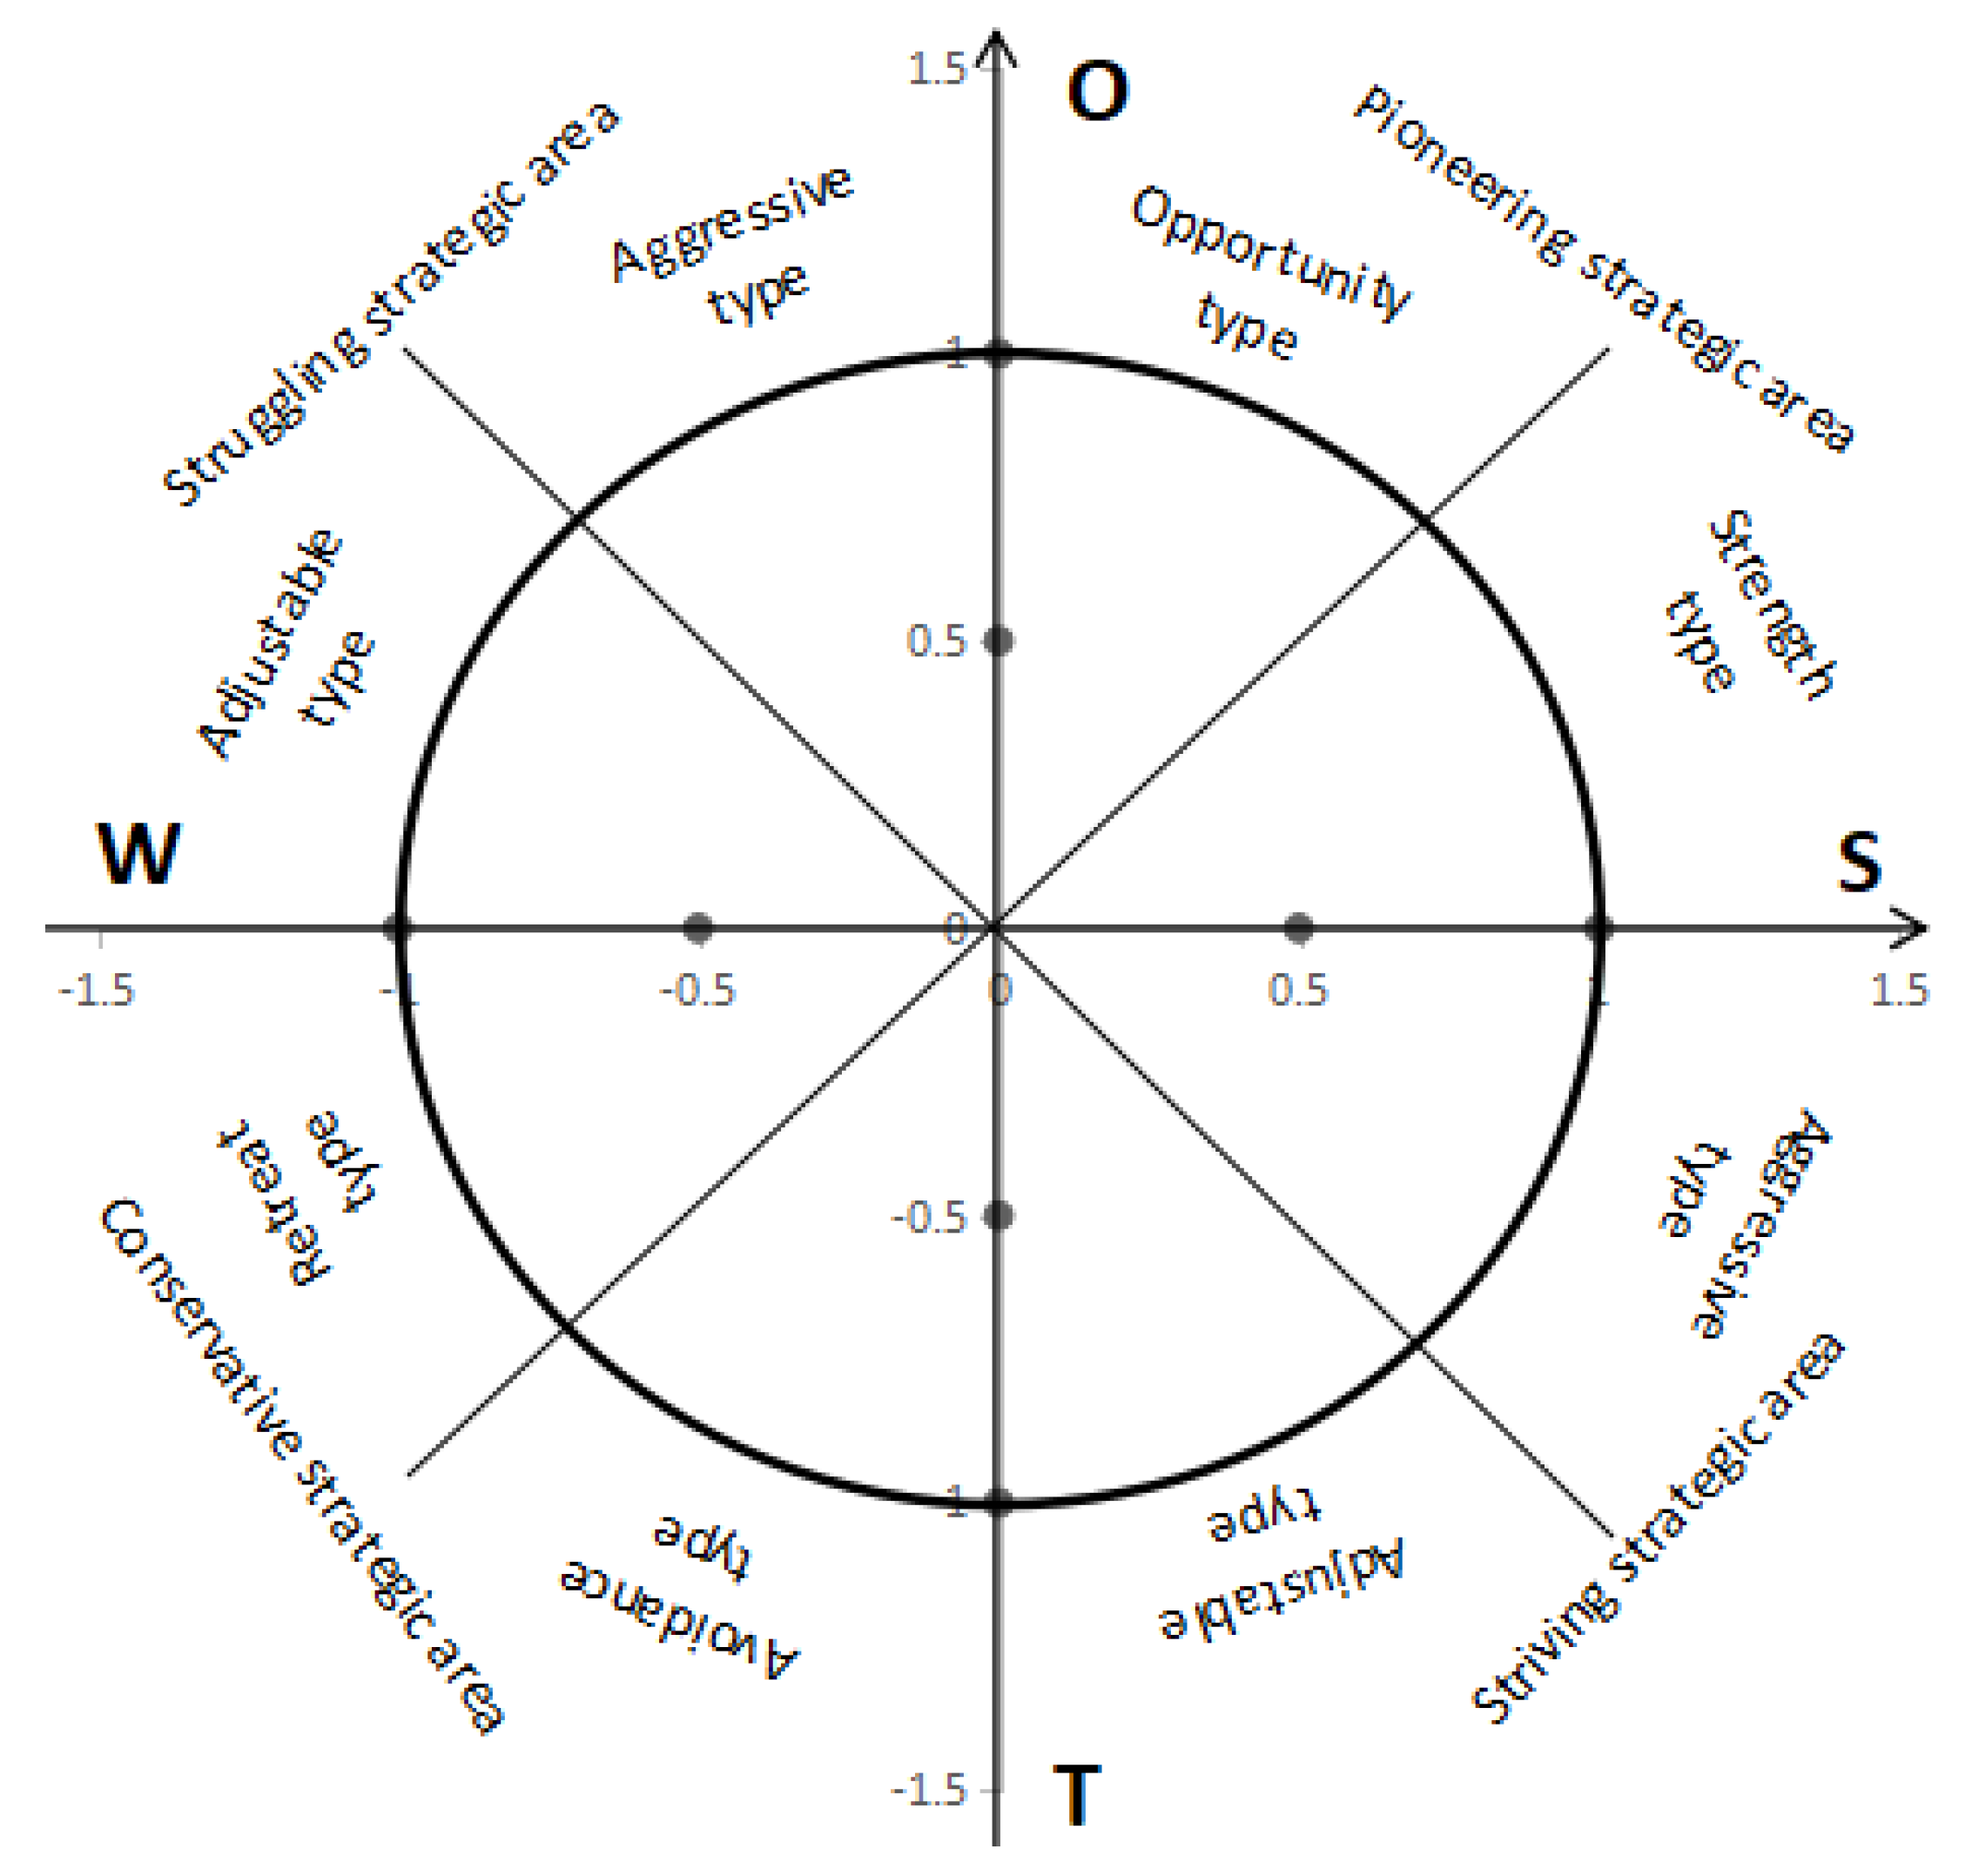
2.4. Modeling and Judgment

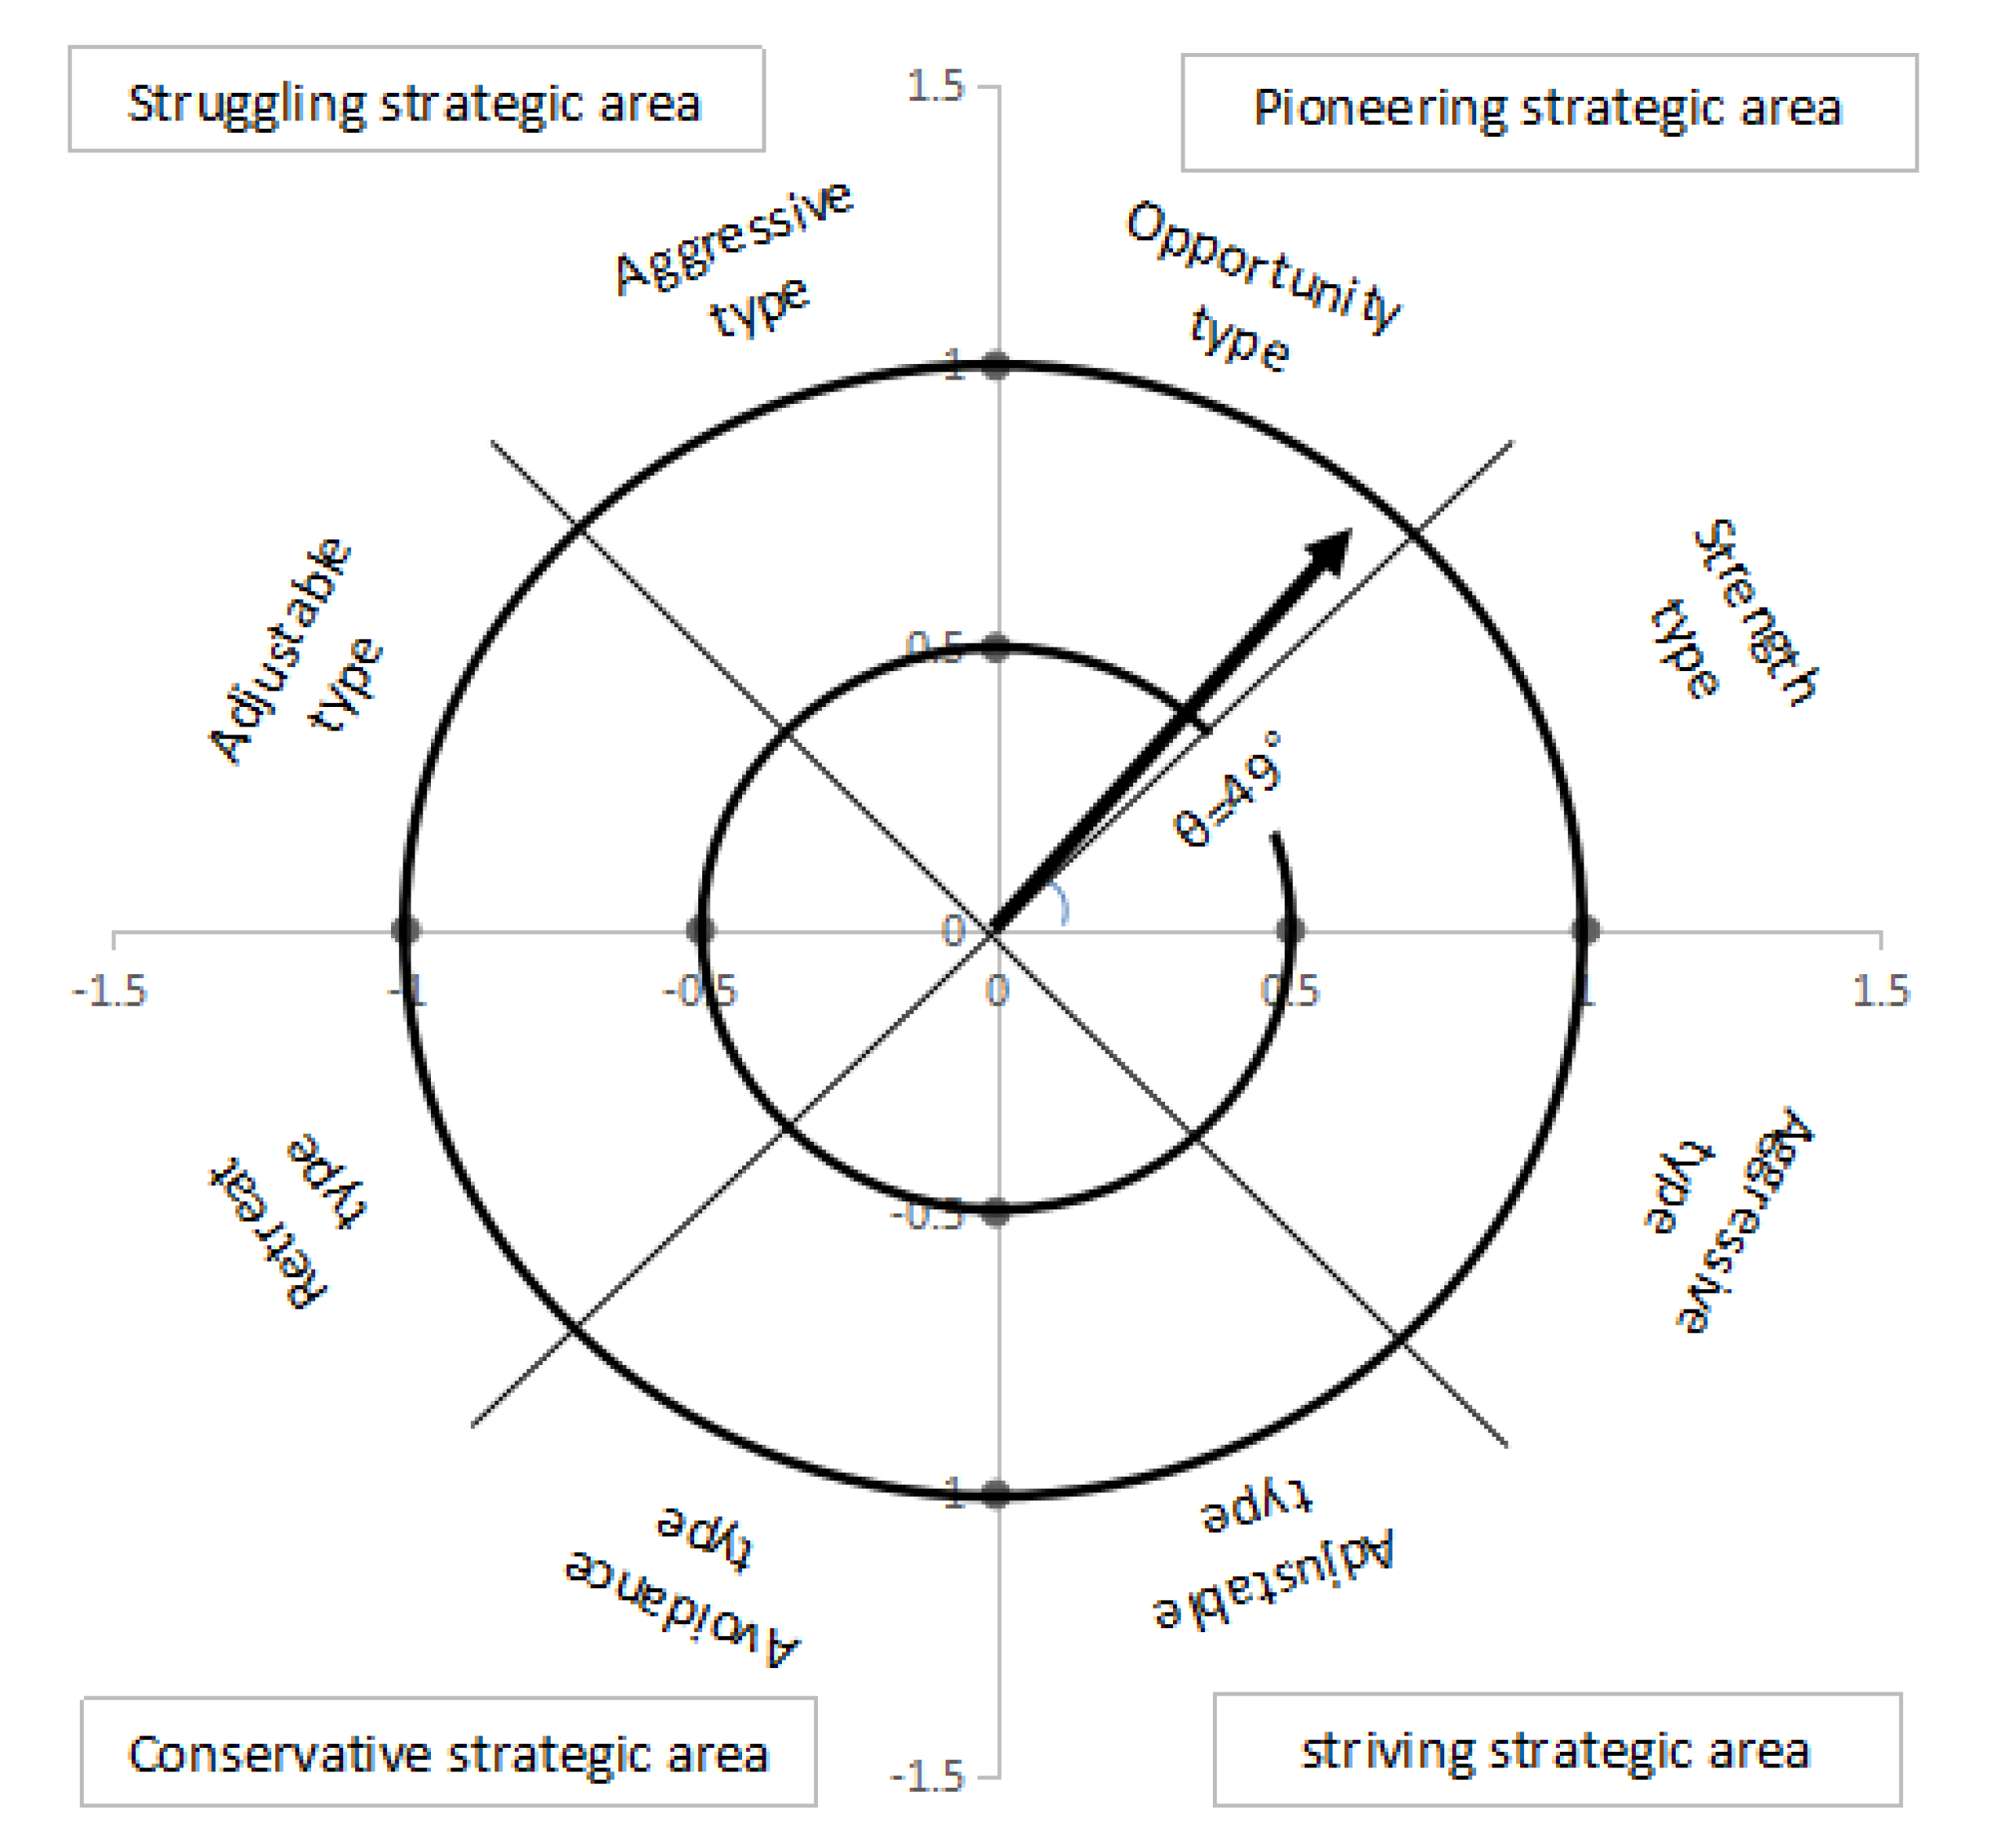
A generally accepted judgment criterion for vector (θ, ρ) is as Figure 1.
Pioneering strategy (S–O strategy): In this region, opportunities and advantages dominate. This means that the opportunities and advantages of the project are great. Efforts should be made to get the maximum utilization of these opportunities and advantages and to take measures to accelerate the implementation of the project. According to the value of θ, it is divided into two types. The group 0 < θ < π/4 is named “strength type”. In this region, the advantage of the project itself is more obvious, and the capital investment should be increased. The group π/4 < θ < π/2 is named “opportunity type”. In this region, the opportunities of the project are more obvious, and the project opportunities should be seized to speed up the project implementation progress. As the value of ρ increasing, the opportunities and advantages of pioneering strategies will be more significant.
Struggling strategy (W–O strategy): Opportunities and weaknesses coexist in this region. This means that while seizing the opportunity, we should fully recognize the weaknesses of the project, reduce the negative impact of the weakness and even turn the weakness into an advantage through various means. According to the value of θ, it is divided into two types. The group π/2 < θ < 3π/4 is named “aggressive type”. In this region, the opportunity has obvious advantages, and the opportunity should be grasped cautiously. As the value of ρ increasing, a more positive attitude should be adopted. The group 3π/4 < θ < π is named “adjustable type”. In this region, weakness is greater than the opportunity, the weakness of the project itself should be fully recognized, the weaknesses should be reduced through various means, and the opportunity should be considered on the basis of fully adjusting the weaknesses. As the value of ρ increasing, a more positive attitude should be taken.
Conservative strategy (W–T strategy): In this region, internal weaknesses and external threats coexist, which means that the risk of this project is large, a conservative strategy should be adopted. It should take waiting and avoiding strategy for this type of project. According to the value of θ, it is divided into two types. The group π < θ < 5π/4 is named “retreat type”. In this region, the disadvantage is greater than the threat. The group 5π/4 < θ < 3π/2 is named “avoidance type”. In this region, the threat is greater than the disadvantage. Under these two strategies, it should stay on the sidelines of the project and do not get involved easily. As the value of ρ increasing, it can try to evaluate the project with a more positive attitude.
Striving strategy (S–T strategy): In this region, internal strengths coexist with external threats. This means that while making full use of the project’s advantages, it is essential to fully understand the external threats, reduce the adverse impact of external threats and even turn external threats into opportunities through various means. According to the value of θ, it is divided into two types. The group 3π/2 < θ < 7π/4 is named “adjustable type”. In this region, the external threat is greater than the advantage, the external threat should be fully recognized, the threat should be reduced through various conversion strategies. As the value of ρ increasing, a more positive attitude should be taken. The group 7π/4 < θ < 2π is named “aggressive type”. In this region, the advantage is greater than the threat. The advantage of the project itself should be fully utilized. On the basis of fully understanding and striving to transform external threats, it should give full play to its own advantages and be prudent to invest. As the value of ρ increasing, a more positive attitude should be taken.

2.5. Results Evaluation

After results were obtained from the SWOT–AHP analysis, the results and strategies were submitted to all the 50 experts. The experts were invited to assess the rationality and appropriateness of the results, evaluate whether the results meet their expectations and consult their willingness to provide additional comments in the interview. Expert interviews were conducted by way of real-time communication face-to-face, over the telephone or over the internet. The experts were asked to rate each part (factors, AHP priority and strategies) in three ranks: disagree, acceptable, agree.

3. Centralized Biogas Production Project

3.1. Data Collection

3.1.1. SWOT Analysis

Large and medium-sized CBP projects in rural areas usually use agricultural waste as the primary anaerobic fermentation raw material to produce biogas. It also provides a unified biogas supply in communities like villages and towns. According to the national standard “Technical specification for large and medium-sized biogas projects (GB/T51063-2014)” issued by the Ministry of housing and urban-rural development, the output of civil biogas projects should not be less than 500 m3/d [60]. In practical applications, the pool capacity parameter of a single fermenter is 500 m3 to 2000 m3 [61]. According to the survey, most of the government-funded demonstration projects are from 2 × 1000 m3 to 2 × 2000 m3. The project mainly adopts a mesophilic fermentation process. The CBP project is an essential way for the utilization of new energy of straw resources in China. The technology is relatively mature and is moving towards the stage of industrialization. Based on the biogas engineering design data, which obtained from Chengdu Energy and Environmental Engineering Design Institute of the Ministry of Agriculture and Rural Affairs, the cost of 200-m3 to 1000-m3 medium-sized CBP stations, the biogas production cost from $0.60/m3 to $0.39/m3. The project has the characteristics of high ecological benefits and strong government support.
Through the investigation, the SWOT analysis matrix of the PPP strategy was established (Table 3).

3.1.2. AHP Analysis

The results show that CR = 0.0983 < 0.1, λmax = 4.265, the consistency test of the matrix is qualified, and the analysis result is desirable (Table 4). The influence of opportunity on strategic choice is much higher than the other three groups, which is 0.5542; The intensity of the inferior influence is second, which is 0.1883; The intensity of the advantage is similar to the disadvantage, which is 0.1675; The impact of threat is the smallest, which is 0.0900.
According to the results of the SWOT–AHP analysis within each group (Table 5), the main strength is “S3: Broaden financing methods”, the score is 0.5563, which ultimately making it easy to expand from traditional methods such as BT and BOT to the private sector and financial assets such as banks and fund securities.
“W2: Low input–output ratio” is regarded as the main weakness, the score is 0.3574. The project construction investment is high, and the production cost is high, but the product output is low, and the price is low.
In the opportunity group, the highest score is “O1: Policy efforts continue to increase”, the score is 0.4424.
The main threat is considered to be “T4: Highly dependent on government support”, the score is 0.5641.
Then, we calculated the global priority and order. It was found that the influence of various factors in the SWOT group on the strategic choice of PPP investment (Table 6). Obviously, the top four factors were O1, O2, O4, S3; the last four factors with least importance were T2, S1, T1, W3.

3.2. Calculation

Strategy quadrilateral was calculated as:
S = 0.0419, W = −0.0471, O = 0.1385, T = −0.0225
By connecting 4 points in turn, we determined the development strategy quadrilateral (Figure 2). The center of gravity is P(X, Y) = P(∑Xi/4, ∑Yi/4) = (−0.0013, 0.029), the strategic coordinates are in the second quadrant of the strategic quadrilateral.
According to P(X, Y) = (−0.0013, 0.029), strategy azimuth was calculated as:
θ = arctan(0.029/(−0.0013)) ≈ 92.6°, and the strategic azimuth is in the second quadrant, which belongs to the competitive strategy area.
Strategy intensity coefficient was calculated as:
U = 0.0058; V = 0.0011
It can be seen from the above calculation that the implementation strength of the CBP project by PPP investment is ρ = U/(U + V) = 0.84. Ρ > 0.5, the CBP project PPP strategy should adopt positive aggressive strategy.

3.3. Strategy Judgment

The coordinates (θ, ρ) = (92.6°, 0.84) (Figure 3) show that in the PPP strategy environment of the CBP project, the external development opportunities are large, but the weaknesses still obvious and an aggressive strategy in struggling strategic area should be adopted.

3.4. Results Evaluation

The SWOT factor, AHP priority and finalized strategy were submitted to all the 50 experts. They rated the results. The score from experts did not show a significant difference. Of the experts, 86% expressed their agreement with the results of this research. Six percent of the experts disagree with the results. Eight percent of the experts think that the result was acceptable. This indicated that the results from the questionnaire were well reproducible and that the research method was convincing. After further investigation, we found that few experts disagreed with the results based on differences in their perceptions and expectations of the project.

3.5. Discussion

The PPP strategy of Chinese CBP projects should focus on adopting aggressive type strategy in struggling strategic area (W–O strategy), that is, social capital should take the initiative to seize opportunities and overcome weaknesses. To date, under the opportunity of a series of favorable policy guarantees such as accelerating the rural revitalization strategy, the government of all levels have paid more attention to this kind of projects and introduced a large number of support policies [62,63]. It also superimposes the unprecedented attention to the PPP financing method [64], and the multiple benefits are superimposed, which brings huge opportunities to the social capital. In view of the project’s own weaknesses [65,66], high construction and production costs, weak market-based profitability, uncertain return period, and lack of project attractiveness, it can take fully tapping new technologies and new models, coupled with the government’s support policies, fully resolve and hedge the disadvantages of the project, improve project profitability, increase project input and output rate, return on capital investment and achieve stable return of capital. It can continuously promote the PPP investment process of CBP projects.
While adopting the W–O strategy, we should also actively use strength to reduce the adverse effects of external threats. The introduction of the PPP mode has broadened the financing method and expanded from traditional methods such as BT and BOT to financial assets such as the private sector and banks and fund securities [67,68]. It can alleviate project financing constraints and ease the problem of insufficient investment by attracting social capital investment. For social capital, it has opened up potential investment markets. It has increased the efficiency of project supply [69]. These strengths brought from the PPP mode, combined with the external opportunities of the project, can further amplify the strengths. Moreover, it must gradually get rid of excessive dependence on the government [30], through specialized operations, as well as various compliance provisions. Through the operation of the project, the parties will gradually help each other to improve the supporting systems and mechanisms to ensure the safety of capital [70]. Through the new technology and new model, the project’s market competitiveness will be gradually improved, and the uncertain external environment will be used to internalize the strengths and competitiveness of the project.

4. Straw-Briquetting Fuel Project

4.1. Data Collection

4.1.1. SWOT Analysis

Straw-briquetting fuel refers to the utilization of biomass materials such as straw to produce solid fuels such as rods, granules or lumps under a certain pressure. According to the industry standards of the Ministry of Agriculture “Technical conditions for biomass solid briquette fuel (NY/T 1878–2010)” issued by the Ministry of Agriculture of China, regarding the density of briquette fuel, pellet fuel should be ≥1000 kg/m3 and rod (block) fuel should be ≥800 kg/m3; Regarding the low calorific value, if the main raw material is herbaceous, it should be ≥13.4 MJ/kg and if the main raw material is woody, it should be ≥16.9 MJ/kg [71]. The development of such fuels can enrich the basic energy supply of rural life and save farmers’ living costs. As an important development direction of future renewable energy technology, the market demand and profit space are inestimable. In 2018, the utilization of SBF reached 18 million tons [72], which was mainly used as farmers’ cooking and heating energy, industrial boilers and fuel for power plants. Against the background of continuous growth in energy demand and rising energy prices, China is actively developing new and renewable energy sources. The development prospects of SBF are very broad. In the last several years, a series of policies to support industrial development were introduced [73,74].
Through the investigation, the SWOT analysis matrix of the PPP strategy of the CBP project was established (Table 7).

4.1.2. AHP Analysis

The results show that CR = 0.0568 < 0.1, λmax = 4.1533, the consistency test of the matrix is qualified and the analysis result is desirable (Table 8). The impact intensity of the strengths and the opportunities is 0.4140; The intensity of the weaknesses is 0.1090; The threats are the smallest, 0.0629.
According to the results of the SWOT–AHP analysis within each group (Table 9), the main strength is “S3: Broaden financing methods”, the score is 0.4659, which ultimately makes it easy to expand from traditional methods such as BT and BOT to the private sector and financial assets such as banks and fund securities.
“W3: Higher production costs” is regarded as the main weakness, the score is 0.4224. The production cost is high, but the product output is low, and the price is low.
In the opportunity group, the highest score is “O1: Policy efforts continue to increase”, the score is 0.5431.
The main threat is considered to be “T4: Highly dependent on government support”, the score is 0.5538.
Then, calculating the global priority and order. It can be found that the influence of various factors in the SWOT group on the strategic choice of PPP investment (Table 10): Obviously, the top four factors are O1, S3, S1, O2; the last four factors with least importance are T2, T1, W4, W2.

4.2. Calculation

Strategy quadrilateral was calculated as:
S = 0.1035, W = −0.0273, O = 0.1035, T = −0.0157.
By connecting 4 points in turn to, we get the development strategy quadrilateral (Figure 4). The center of gravity is P(X, Y) = P(∑Xi/4, ∑Yi/4) = (0.0191, 0.0219), the strategic coordinates are in the first quadrant of the strategic quadrilateral.
According to P(X, Y) = (0.0191, 0.0219), strategy azimuth was calculated as:
θ = arctan(0.0219/0.0191) ≈ 49°, and the strategic azimuth is in the first quadrant, which belongs to the opportunity strategy area.
Strategy intensity coefficient was calculated as:
U = 0.0107; V = 0.0004
It can be seen from the above calculation that the implementation strength of the SBF project by PPP investment is ρ = U/(U + V) = 0.96. Ρ > 0.5, the SBF project PPP strategy should adopt a positive opportunity strategy.

4.3. Strategy Judgment

The coordinates (θ, ρ) = (49°, 0.96) (Figure 5) show that in the PPP strategy environment of the SBF project, strengths and opportunities coexist, an opportunity type strategy in the pioneering strategic area (S–O strategy) should be adopted.

4.4. Results Evaluation

The SWOT factor, AHP priority and finalized strategy were resubmitted to the experts. They rated the results. The score from experts did not show a significant difference. Eighty-two percent of the experts expressed agreement with the results. Eight percent of experts disagreed with the results of this study. Ten percent of experts thought the result was acceptable. This indicates that the results from the questionnaire were well reproducible and that the research method was convincing. After further investigation, we found that because of the differences in their perceptions and expectations of the project, few experts disagreed with the results.

4.5. Discussion

The PPP strategy of a SBF project should focus on an opportunity-type of strategy in pioneering strategic area (S–O strategy)—that is, the social capital should take the initiative to actively seize the opportunity and give full play to its strengths. To date—under the opportunity of a series of favorable policy guarantees such as accelerating rural revitalization strategy and ecological civilization construction [75]—the government has paid more attention to this kind of project. A large number of support policies have been introduced. This model also superimposes an unprecedented attention to PPP financing methods and the rich experience of domestic PPP investment in agriculture. The multiple benefits of superposition have brought considerable opportunities to the capital side. In addition, it should give full play to the advantages brought by the PPP mode. We must broaden financing methods through PPP mode to alleviate project financing constraints. By attracting social capital investment, the problem of insufficient investment total is alleviated. By fostering the professionalism of social capital, it can make the project more flexible and adapt to market changes [76]. With good external opportunities and these advantages, the capital side can fully attack and develop in this field.
While adopting the S–O strategy, social capital must always guard against external threats. Social capital should actively resolve the inferior disadvantages of the project itself, remove obstacles and hidden dangers, by the motivated opportunity-oriented strategy. In response to the projects’ own disadvantages, we will actively develop new technologies and new modes, do a good job of internal control through specialized teams and operational personnel and gradually overcome weaknesses such as high production costs and weak market-based profitability [77]. Social capital can fully resolve and hedge the weaknesses and threats of the project by coupled with the advantages and opportunities of the project to improve project profitability, reduce production costs and increase capital return on investment [78]. The uncertain external environment will be transformed into the external environment and the competitiveness of the project will achieve a stable return on capital. It can continuously promote the PPP investment process of SBF projects.

5. Conclusions and Recommendations

From the strategic choice of social capital to the two projects of CBP and SBF, it is clear that social capital maintains a positive and optimistic investment attitude towards the projects. Therefore, we hold the views that by promoting the two models in rural areas, the public sector policy focus on fostering its advantages of the PPP model and attract the social fund to participate in the construction and operation, thus to realize the marketization of the projects. By analyzing the PPP investment strategies of the two projects, it is found that in the process of promoting the energy utilization of straw resources in rural areas, the social capital should formulate corresponding investment strategies according to the different characteristics of the projects. The CBP project should focus on the negotiation with the public sector to get maximum policy support. In fact, it is precisely. For the reason that the government is facing intense pressure on the issue of environmental protection. In particular, local governments are facing administrative pressure on air pollution control from the higher-level governments. Therefore, to promote the CBP projects, the government has adopted preferential policies, such as investment promotion, site selection and product promotion, even the supporting policies during the operation stage are all very active. The SBF project can adopt a more flexible support method. In addition to being able to benefit policy dividends which similar to the CBP project that due to the government’s environmental governance pressure, SBF project has a good market adaptability and it is more attractive to social capital. To promote the SBF project, the government can return from a “nanny” to a “waiter” and fully endow social capital autonomously.
Although many factors involved in the SWOT analysis of the two projects are the same. With the AHP analysis, the importance of each factor is quite different. SWOT–AHP analysis applied to straw utilization PPP strategy research, which solved a series of problems such as reliability and scientific deficiency that rely solely on SWOT qualitative analysis. In particular—after applying the AHP to give weights to various factors—the method provides a clear strategic choice for decision-makers by constructing a strategic quadrilateral and determining the center of gravity to map the strategic orientation to the coordinate points. This is especially important for CBP projects and SBF projects that require introducing capital from all parties. Government decision-making departments can choose whether to introduce the corresponding financial and policy support according to the judgment result of the method, select the corresponding social capital, make scientific decision-making and effectively avoid launching projects blindly. Social capital can also choose the corresponding strategic countermeasures when making investment decisions. The decision-making result of the method can be used to determine the investment in project construction and to implement the policy. The shortcoming of the SWOT–AHP analysis method is that the method is limited to solving the problem of strategic choice and has not yet solved the specific strategic measures and countermeasures. We expect that in the future, through further exploration, a systematic analysis method that takes into account strategic measures will be established.

Author Contributions

All authors were involved in preparing the manuscript. Conceptualization, Q.W., T.D., and C.Y.; methodology, Q.W.; software, Q.W., Y.Y.; validation, Q.W., Y.Y., C.Y., and T.D.; formal analysis, Q.W. and J.J.; investigation, Q.W. and B.S.; resources, C.Y. and Y.Y.; data curation, Q.W.; writing—original draft preparation, Q.W. and C.Y.; writing—review and editing, Q.W., J.J., B.S., and C.Y.; visualization, Q.W.; supervision, C.Y., Y.Y., and T.D.; project administration, Q.W., C.Y., and T.D.; funding acquisition, C.Y. All authors have read and agreed to the published version of the manuscript.

Funding

This research was funded by Major Program of National Fund of Philosophy and Social Science of China, Grant Number 18ZDA048, China Agriculture Research System-Green Manure, Grant Number CARS-22-G25. The APC was funded by above funds.

Acknowledgments

Our deepest gratitude goes to the anonymous reviewers for their careful work and thoughtful suggestions that have helped improve this study substantially.

Conflicts of Interest

The authors declare no conflict of interest.

References

  1. Xu, S.; Ge, J. Sustainable shifting from coal to gas in North China: An analysis of resident satisfaction. Energy Policy 2020, 138, 111296. [Google Scholar] [CrossRef]
  2. Liu, G.; Dong, X.; Jiang, Q.; Dong, C.; Li, J. Natural gas consumption of urban households in China and corresponding influencing factors. Energy Policy 2018, 122, 17–26. [Google Scholar] [CrossRef]
  3. Huang, X.; Cheng, L.; Chien, H.; Jiang, H.; Yang, X.; Yin, C. Sustainability of returning wheat straw to field in Hebei, Shandong and Jiangsu provinces: A contingent valuation method. J. Clean. Prod. 2019, 213, 1290–1298. [Google Scholar] [CrossRef]
  4. Yang, X.; Cheng, L.; Yin, C.; Lebailly, P.; Azadi, H. Urban residents’ willingness to pay for corn straw burning ban in Henan, China: Application of payment card. J. Clean. Prod. 2018, 193, 471–478. [Google Scholar] [CrossRef]
  5. Lu, J.; Muhmood, A.; Czekała, W.; Mazurkiewicz, J.; Dach, J.; Dong, R. Untargeted metabolite profiling for screening bioactive compounds in digestate of manure under anaerobic digestion. Water 2019, 11, 2420. [Google Scholar] [CrossRef] [Green Version]
  6. Meng, L.; Alengebawy, A.; Ai, P.; Jin, K.; Chen, M.; Pan, Y. Techno-economic assessment of three modes of large-scale crop residue utilization projects in china. Energies 2020, 13, 3729. [Google Scholar] [CrossRef]
  7. Qiu, H.; Yan, J.; Jiang, Y.; Li, D. Analysis of the status quo and influencing factors of rural renewable energy consumption in China. J. BJ Inst. Technol. 2015, 17, 10–15, (In Chinese with English Abstract). [Google Scholar]
  8. Yang, X.; Cheng, L.; Huang, X.; Zhang, Y.; Yin, C.; Lebailly, P. Incentive mechanism to promote corn stalk return sustainably in Henan, China. Sci. Total Environ. 2020, 738, 139775. [Google Scholar] [CrossRef]
  9. NBS. China Statistical Yearbook 2018; China Statistics Press: Beijing, China, 2018. (In Chinese)
  10. Office of the Third National Agricultural Census. Main Data Bulletin of the Third National Agricultural Census; Office of the Third National Agricultural Census: Beijing, China, 2017. (In Chinese)
  11. Liu, J.; Hou, B.; Ma, X.; Liao, H. Solid fuel use for cooking and its health effects on the elderly in rural China. Environ. Sci. Pollut. R. 2018, 25, 3669–3680. [Google Scholar] [CrossRef]
  12. NDRC. Clean Heating Planning in the North China in Winter (2017–2021); NDRC: Beijing, China, 2018. (In Chinese)
  13. Liao, H.; Tang, X.; Wei, Y. Solid fuel use in rural China and its health effects. Renew. Sustain. Energy Rev. 2016, 60, 900–908. [Google Scholar] [CrossRef]
  14. Xi, J. Winning a Comprehensively Completed Well-off Society and Winning the Great Victory of Socialism with Chinese Characteristics in the New Era; People’s Publishing House: Beijing, China, 2017. (In Chinese) [Google Scholar]
  15. NDRC; NEA. Guidance on Promoting the Development of Biomass Heat Supply ([2017] No. 2123); National Development and Reform Commission (NDRC): Beijing, China; National Energy Administration (NEA): Beijing, China, 2017.
  16. Wang, Q.; Dogot, T.; Huang, X.; Fang, L.; Yin, C. Coupling of rural energy structure and straw utilization: Based on cases in Hebei, China. Sustainability 2020, 12, 983. [Google Scholar] [CrossRef] [Green Version]
  17. Wang, Q.; Dogot, T.; Wu, G.; Huang, X.; Yin, C. Residents’ willingness for centralized biogas production in Hebei and Shandong Provinces. Sustainability 2019, 11, 7175. [Google Scholar] [CrossRef] [Green Version]
  18. Wei, Y.; Liao, H.; Wang, K. China Energy Report (2014): Energy Poverty Research; China Science Press: Beijing, China, 2014. [Google Scholar]
  19. NDRC; MOA. Guiding Opinions on Promoting Government and Social Capital Cooperation in the Field of Agriculture ([2016] No. 2574); National Development and Reform Commission (NDRC): Beijing, China; Ministry of Agriculture (MOA): Beijing, China, 2016.
  20. He, P.; Liu, S. Agricultural infrastructure PPP investment strategy and path selection. Agric. Econ. Manag. 2018, 1, 67–75, (In Chinese with English abstract). [Google Scholar]
  21. Yescombe, E.R.; Farquharson, E. Chapter 2—What are public-private partnerships? In Public-Private Partnerships for Infrastructure, 2nd ed.; Yescombe, E.R., Farquharson, E., Eds.; Butterworth-Heinemann: Oxford, UK, 2018; pp. 7–24. [Google Scholar]
  22. Keers, B.B.M.; van Fenema, P.C. Managing risks in public-private partnership formation projects. Int. J. Proj. Manag. 2018, 36, 861–875. [Google Scholar] [CrossRef]
  23. Samii, R.; Van Wassenhove, L.N.; Bhattacharya, S. An Innovative public-private partnership: New approach to development. World Dev. 2002, 30, 991–1008. [Google Scholar] [CrossRef]
  24. Zhang, S.; Gao, Y.; Feng, Z.; Sun, W. PPP application in infrastructure development in China: Institutional analysis and implications. Int. J. Proj. Manag. 2015, 33, 497–509. [Google Scholar] [CrossRef]
  25. Caperchione, E.; Demirag, I.; Grossi, G. Public sector reforms and public private partnerships: Overview and research agenda. Account. Forum 2017, 41, 1–7. [Google Scholar] [CrossRef]
  26. Spackman, M. Public–private partnerships: Lessons from the British approach. Econ. Syst. 2002, 26, 283–301. [Google Scholar] [CrossRef]
  27. Ministry of Finance of the People’s Republic of China. Operation Guide for Government and Social Capital Cooperation Model; Ministry of Finance of the People’s Republic of China: Beijing, China, 2014.
  28. Jost, G.; Dawson, M.; Shaw, D. Private sector consortia working for a public sector client—Factors that build successful relationships: Lessons from the UK. Eur. Manag. J. 2005, 23, 336–350. [Google Scholar] [CrossRef]
  29. Li, K. Correctly define the subject qualification of social capital in the PPP model. China Investig. 2015, 12, 97–99. (In Chinese) [Google Scholar]
  30. Bruce, K.; Costa, H. Enabling environment for PPPs in agricultural extension projects: Policy imperatives for impact. J. Rural Stud. 2019, 70, 87–95. [Google Scholar] [CrossRef]
  31. Galik, C.S.; Abt, R.C.; Latta, G.; Méley, A.; Henderson, J.D. Meeting renewable energy and land use objectives through public–private biomass supply partnerships. Appl. Energy 2016, 172, 264–274. [Google Scholar] [CrossRef] [Green Version]
  32. Wu, D.; Wang, S. Research development and trends of PPP model in China. J. Eng. Manag. 2014, 28, 75–80, (In Chinese with English Abstract). [Google Scholar]
  33. Bjärstig, T.; Sandström, C. Public-private partnerships in a Swedish rural context—A policy tool for the authorities to achieve sustainable rural development? J. Rural Stud. 2017, 49, 58–68. [Google Scholar] [CrossRef] [Green Version]
  34. Porter, M.E. Competitive Advantage of Nations: Creating and Sustaining Superior Performance; Simon and Schuster: New York, NY, USA, 2011. [Google Scholar]
  35. Saaty, T.L. The Analytic Hierarchy Process; McGrawHill: New York, NY, USA, 1980. [Google Scholar]
  36. Porter, M.E. Competitive Strategy; Free Press: New York, NY, USA, 1998. [Google Scholar]
  37. Pahl, N.; Richter, A. SWOT Analysis. Idea, Methodology and a Practical Approach; GRIN Publishing: Munich, Germany, 2009. [Google Scholar]
  38. Abdel-Basset, M.; Mohamed, M.; Smarandache, F. An extension of neutrosophic AHP–SWOT analysis for strategic planning and decision-making. Symmetry 2018, 10, 116. [Google Scholar] [CrossRef] [Green Version]
  39. Tzelepi, V.; Zeneli, M.; Kourkoumpas, D.; Karampinis, E.; Gypakis, A.; Nikolopoulos, N.; Grammelis, P. Biomass availability in Europe as an alternative fuel for full conversion of lignite power plants: A critical review. Energies 2020, 13, 3390. [Google Scholar] [CrossRef]
  40. Kordana, S.; Pochwat, K.; Słyś, D.; Starzec, M. Opportunities and threats of implementing drain water heat recovery units in Poland. Resources 2019, 8, 88. [Google Scholar] [CrossRef] [Green Version]
  41. Saaty, T.L. Decision Making with Dependence and Feedback: The Analytic Network Process; RWS Publication: Pittsburgh, PA, USA, 1996. [Google Scholar]
  42. Saaty, T.L. Decision making—The analytic hierarchy and network processes (AHP/ANP). J. Syst. Sci. Syst. Eng. 2004, 13, 1–35. [Google Scholar] [CrossRef]
  43. Wang, B.; Gan, S. SWOT Marketing Strategy Analysis Model. Syst. Eng.-Theory Pract. 1995, 15, 34–45, (In Chinese with English Abstract). [Google Scholar]
  44. Numata, M.; Sugiyama, M.; Mogi, G. Barrier analysis for the deployment of renewable-based mini-grids in myanmar using the Analytic Hierarchy Process (AHP). Energies 2020, 13, 1400. [Google Scholar] [CrossRef] [Green Version]
  45. Gašparović, I.; Gašparović, M. Determining optimal solar power plant locations based on remote sensing and GIS methods: A case study from croatia. Remote Sens. 2019, 11, 1481. [Google Scholar] [CrossRef] [Green Version]
  46. Shrestha, R.K.; Alavalapati, J.R.R.; Kalmbacher, R.S. Exploring the potential for silvopasture adoption in south-central Florida: An application of SWOT–AHP method. Agric. Syst. 2004, 81, 185–199. [Google Scholar] [CrossRef]
  47. Kurttila, M.; Pesonena, M.; Kangasb, J.; Miika, K. Utilizing the analytic hierarchy process AHP in SWOT analysis a hybrid method and its application to a forest-certification case. For. Policy Econ. 2000, 1, 41–52. [Google Scholar] [CrossRef]
  48. Gottfried, O.; De Clercq, D.; Blair, E.; Weng, X.; Wang, C. SWOT-AHP-TOWS analysis of private investment behavior in the Chinese biogas sector. J. Clean. Prod. 2018, 184, 632–647. [Google Scholar] [CrossRef]
  49. Okello, C.; Pindozzi, S.; Faugno, S.; Boccia, L. Appraising bioenergy alternatives in Uganda using strengths, weaknesses, opportunities and threats (SWOT)-analytical hierarchy Process (AHP) and a desirability functions approach. Energies 2014, 7, 1171–1192. [Google Scholar] [CrossRef]
  50. Yukalang, N.; Clarke, B.; Ross, K. Barriers to effective municipal solid waste management in a rapidly urbanizing area in Thailand. Int. J. Environ. Res. Public Health 2017, 14, 1013. [Google Scholar] [CrossRef] [Green Version]
  51. Gao, X.; Chen, L.; Sun, B.; Liu, Y. Employing SWOT analysis and normal cloud model for water resource sustainable utilization assessment and strategy development. Sustainability 2017, 9, 1439. [Google Scholar]
  52. Chan, N.; Roy, R.; Chaffin, B. Water governance in bangladesh: An evaluation of institutional and political context. Water 2016, 8, 403. [Google Scholar] [CrossRef] [Green Version]
  53. Wang, X.; Li, C.; Shang, J.; Yang, C.; Zhang, B.; Ke, X. Strategic choices of China’s new energy vehicle industry: An analysis based on ANP and SWOT. Energies 2017, 10, 537. [Google Scholar] [CrossRef] [Green Version]
  54. Li, W.; Ho, M.; Yang, C. Study on design strategy for sustainable development of Chinese solar term culture. Sustainability 2018, 10, 4355. [Google Scholar] [CrossRef] [Green Version]
  55. Fan, T.; Xue, D. Sustainable development of cultural industry in shaanxi province of northwest China: A SWOT and AHP analysis. Sustainability 2018, 10, 2830. [Google Scholar] [CrossRef] [Green Version]
  56. Liu, W.; Xue, Y. The Strategic Choice of Film and TV Base Development Based on AHP-SWOT Model—Taking Xiangshan Studio City as an Example. On Econ. Probl. 2018, 12, 94–101, (In Chinese with English Abstract). [Google Scholar]
  57. Kişi, N. A Strategic approach to sustainable tourism development using the A’WOT Hybrid method: A case study of Zonguldak, Turkey. Sustainability 2019, 11, 964. [Google Scholar] [CrossRef] [Green Version]
  58. Ndwandwe, S.; Weng, R. Competitive analyses of the pig industry in Swaziland. Sustainability 2018, 10, 4402. [Google Scholar] [CrossRef]
  59. Şeker, Ş.; Özgürler, M. Analysis of the turkish consumer electronics firm using SWOT-AHP method. Procedia—Soc. Behav. Sci. 2012, 58, 1544–1554. [Google Scholar] [CrossRef] [Green Version]
  60. MOHURD. Technical Specification for Large and Medium-Sized Biogas Projects; GB/T51063-2014; Ministry of Housing and Urban-Rural Development: Beijing, China, 2014.
  61. Wang, H. Emergy Analysis of Straw Biogas Centralized Gas Supply Project Based on Life Cycle Assessment. Ph.D. Thesis, Chinese Academy of Agricultural Sciences, Beijing, China, 2016. (In Chinese). [Google Scholar]
  62. Li, C.; Shen, B. Accelerating renewable energy electrification and rural economic development with an innovative business model: A case study in China. Energy Policy 2019, 127, 280–286. [Google Scholar] [CrossRef]
  63. Jia, X.; Xin, G.; Wang, F.; Li, Z. Opportunities and challenges for bioelectricity in rural China. Energy Procedia 2014, 50, 171–177. [Google Scholar]
  64. Cedrick, B.Z.E.; Long, P.W. Investment motivation in renewable energy: A PPP approach. Energy Procedia 2017, 115, 229–238. [Google Scholar] [CrossRef]
  65. Liu, Y.; Sun, C.; Xia, B.; Liu, S.; Skitmore, M. Identification of risk factors affecting ppp waste-to-energy incineration projects in China: A multiple case study. Adv. Civ. Eng. 2018, 2018, 1–16. [Google Scholar] [CrossRef]
  66. Xu, Y.; Chan, A.P.C.; Xia, B.; Qian, Q.K.; Liu, Y.; Peng, Y. Critical risk factors affecting the implementation of PPP waste-to-energy projects in China. Appl. Energ. 2015, 158, 403–411. [Google Scholar] [CrossRef] [Green Version]
  67. Biygautane, M.; Neesham, C.; Al-Yahya, K.O. Institutional entrepreneurship and infrastructure public-private partnership (PPP): Unpacking the role of social actors in implementing PPP projects. Int. J. Proj. Manag. 2019, 37, 192–219. [Google Scholar] [CrossRef]
  68. Cui, C.; Liu, Y.; Hope, A.; Wang, J. Review of studies on the public–private partnerships (PPP) for infrastructure projects. Int. J. Proj. Manag. 2018, 36, 773–794. [Google Scholar] [CrossRef]
  69. Hermans, F.; Geerling-Eiff, F.; Potters, J.; Klerkx, L. Public-private partnerships as systemic agricultural innovation policy instruments—Assessing their contribution to innovation system function dynamics. NJAS—Wagening. J. Life Sci. 2019, 88, 76–95. [Google Scholar] [CrossRef]
  70. Zou, W.; Kumaraswamy, M.; Chung, J.; Wong, J. Identifying the critical success factors for relationship management in PPP projects. Int. J. Proj. Manag. 2014, 32, 265–274. [Google Scholar] [CrossRef] [Green Version]
  71. MOA. Technical Conditions for Biomass Solid Briquette Fuel; NY/T 1878–2010; Ministry of Agriculture: Beijing, China, 2010.
  72. Guan, Y.; Tai, L.; Cheng, Z.; Chen, G.; Yan, B.; Hou, L. Biomass molded fuel in China: Current status, policies and suggestions. Sci. Total Environ. 2020, 724, 138345. [Google Scholar] [CrossRef]
  73. NPC. Renewable Energy Law of the People’s Republic of China; National People’s Congress (NPC): Beijing, China, 2006. (In Chinese)
  74. Ministry of Finance of the People’s Republic of China. Interim Measures for the Administration of Special Funds for Renewable Energy Development; Cai Jian [2015] No. 87; Ministry of Finance of the People’s Republic of China: Beijing, China, 2015; (In Chinese with English Abstract).
  75. Hansen, M.H.; Li, H.; Svarverud, R. Ecological civilization: Interpreting the Chinese past, projecting the global future. Glob. Environ. Chang. 2018, 53, 195–203. [Google Scholar] [CrossRef]
  76. An, Z.; Kangur, A.; Papageorgiou, C. On the substitution of private and public capital in production. Eur. Econ. Rev. 2019, 118, 296–311. [Google Scholar] [CrossRef]
  77. Wang, H.; Liu, Y.; Xiong, W.; Song, J. The moderating role of governance environment on the relationship between risk allocation and private investment in PPP markets: Evidence from developing countries. Int. J. Proj. Manag. 2019, 37, 117–130. [Google Scholar] [CrossRef]
  78. Meunier, D.; Quinet, E. Tips and Pitfalls in PPP design. Res. Transp. Econ. 2010, 30, 126–138. [Google Scholar] [CrossRef]
Figure 1. Coordinate of strategic types.
Energies 13 04171 g001
Figure 2. Centralized biogas production project PPP strategy quadrilateral.
Energies 13 04171 g002
Figure 3. PPP strategy type and strategic intensity of a centralized biogas production project.
Energies 13 04171 g003
Figure 4. Straw-briquetting fuel project PPP strategy quadrilateral.
Energies 13 04171 g004
Figure 5. PPP strategy type and strategic intensity of straw-briquetting fuel project.
Energies 13 04171 g005
Table 1. Saaty’s preferences in the pair-wise comparison process.
Numeric RatingJudgments of Preferences between Criterion i (Ci) and Criterion j (Cj)
1Ci and Cj is equally important
3Ci is slightly more important than Cj
5Ci is strongly more important than Cj
7Ci is very strongly more important than Cj
9Ci is extremely more important than Cj
2, 4, 6, 8Intermediate values
Table 2. RI value table of scale method.
123456789
0.000.000.580.901.121.241.321.411.45
Table 3. Strengths, weaknesses, opportunities and threats (SWOT) analysis of the public–private partnership (PPP) strategy for centralized biogas production project.
SWOTSolution LayerDescription
SS1Improve supply efficiencySocial capital can strictly control costs, which is conducive for reducing the total operating costs and improving project supply efficiency.
S2Mitigation of financing constraintsPPP mode is conducive for attracting social capital investment and alleviating the problem of insufficient investment.
S3Broaden financing methodsFrom traditional methods such as build–transfer (BT) and build–operate–transfer (BOT), it has expanded to the private sector and financial assets such as banks and fund securities.
S4Exploit potential investment marketThis type of project is a feasibility gap subsidy project, which is consistent with long-term stable income from capital requirements.
WW1Market-based profitability is weakProject attributes determined market-based profitability is weak and depends on policy support.
W2High construction and production costsProject construction investment is high, and the production cost is high, but the product output is low, and the price is low.
W3Lack of project appealThis type of project has a long investment cycle, high coordination requirements for the government, relatively low economic benefits and low project attractiveness.
W4Return period uncertaintyThe return of the project depends on the number of resources in the location, the price of the product, etc. and the return period is uncertain.
OO1Policy efforts continue to increaseBoth the country and the locality attach great importance to it and the policy support for such projects is very strong.
O2Environmental pressure–demandThe environmental protection supervision is becoming increasingly strict and the “no coal-burning”, “no firewood burning” and “gas shortage” problem is serious.
O3Rural revitalization needsUnder the background of rural revitalization, the objective needs of ecological civilization construction.
O4New technology new model rapidly updatedBiogas production technology and efficiency, high value-added products are constantly improving.
TT1Competition in other rural new energy modelsThere is competition from straw briquettes, wind power, hydropower, photovoltaic power generation, etc.
T2Macro investment environment uncertaintyThe economic and industrial structure is being continuously transformed and upgraded, and the market environment changes rapidly.
T3Incomplete system and mechanismEconomic, industrial, financial and other policies, project operations, exits and other mechanisms are all explored.
T4Highly dependent on government supportThe market relies on government prohibition of coal bans; the amount of resources depends on agricultural planning.
Table 4. Intergroup judgment matrix of centralized biogas production project.
ItemSWOTWeights (Sw)
S11/21/330.1675
W211/520.1883
O35140.5542
T1/31/21/410.0900
λmax = 4.2650, CR = 0.0983 < 0.1, accepted consistency
Table 5. Internal judgment matrix of centralized biogas production project.
ItemS1S2S3S4Weights (Si)ItemO1O2O3O4Weights (Oi)
S111/31/51/20.0808O112330.4424
S2311/330.2488O21/21320.2827
S353150.5563O31/31/311/30.0942
S421/31/510.1142O41/31/2310.1806
λmax = 4.1041, CR = 0.0386 < 0.1, accepted consistencyλmax = 4.1425, CR = 0.0528 < 0.1, accepted consistency
ItemW1W2W3W4Weights (Wi)ItemT1T2T3T4Weights (Ti)
W111330.3574T1131/21/30.1612
W211530.4061T21/311/31/50.0740
W31/31/511/30.0797T32311/50.2006
W41/31/3310.1568T435510.5641
λmax = 4.1147, CR = 0.0425 < 0.1, accepted consistencyλmax = 4.2219, CR = 0.0822 < 0.1, accepted consistency
Table 6. Results of the SWOT–analytic hierarchy process (AHP) study for centralized biogas production project.
SWOTGroup PriorityFactorsSi: Local Priority (Order)GSi: Global Priority (Order)
S0.1675S10.0808 (4)0.0135 (15)
S20.2488 (2)0.0417 (9)
S30.5563 (1)0.0932 (4)
S40.1142 (3)0.0191 (11)
W0.1883W10.3574 (2)0.0673 (6)
W20.4061 (1)0.0765 (5)
W30.0797 (4)0.0150 (13)
W40.1568 (3)0.0295 (10)
O0.5542O10.4424 (1)0.2452 (1)
O20.2827 (2)0.1567 (2)
O30.0942 (4)0.0522 (7)
O40.1806 (3)0.1001 (3)
T0.0900T10.1612 (3)0.0145 (14)
T20.0740 (4)0.0067 (16)
T30.2006 (2)0.0181 (12)
T40.5641 (1)0.0508 (8)
Table 7. SWOT analysis of PPP strategy for straw-briquetting fuel project.
SWOTSolution LayerDescription
SS1Mitigation of financing constraintsPPP mode is conducive for attracting social capital investment and alleviating the problem of insufficient investment.
S2Extended project investorDiversified investment entities can cover private enterprises, financial institutions and rural collective economic organizations.
S3Broaden financing methodsFrom traditional methods such as BT and BOT, it has expanded to the private sector and financial assets such as banks and fund securities.
S4Market development and innovation capabilitiesThe professionalism of social capital can make projects more flexible and adapt to market changes.
WW1Market-based profitability is weakThe project attributes determine the market-based profitability of such projects is weak and depends on policy support.
W2Relatively insufficient attractionLong investment cycle, high coordination requirements for the government, relatively low economic benefits and low project attractiveness
W3Higher production costsThe production cost of SBF is relatively high and there is no direct competitive advantage compared with coal and fuelwood.
W4Return period uncertaintyThe return of the project depends on the number of resources in the location, the price of the product, etc. and the return period is uncertain.
OO1Policy efforts continue to increaseBoth the country and the locality attach great importance to it and the policy support for such projects is very strong.
O2Environmental pressure–demandThe environmental protection supervision is becoming increasing strict and the “no coal-burning”, “no firewood burning” and “gas shortage” problem is serious.
O3Rural revitalization needsUnder the background of rural revitalization, the objective needs of ecological civilization construction.
O4More experience in agricultural PPP similar projectsThe state has vigorously promoted the PPP mode and the agricultural field has accumulated many experience for reference.
TT1Macro investment environment uncertaintyThe economic and industrial structure was continuously transformed and upgraded and the market environment has changed rapidly.
T2Competition in other rural new energy modelsCompetition from biogas, wind power, hydropower, photovoltaic power generation, etc.
T3Incomplete system and mechanismEconomic, industrial, financial and other policies, project operations, exits and other mechanisms are all explored.
T4Highly dependent on government supportThe market relies on the government’s prohibition of coal bans and the amount of resources depends on agricultural planning.
Table 8. Inter-group judgment matrix of straw-briquetting fuel project.
ItemSWOTWeights (Sw)
S15150.4140
W1/511/530.1090
O15150.4140
T1/51/31/510.0629
λmax = 4.1533, CR = 0.0568 < 0.1, accepted consistency
Table 9. Internal judgment matrix of straw-briquetting fuel project.
ItemS1S2S3S4Weights (Si)ItemO1O2O3O4Weights (Oi)
S1131/220.2770O113550.5431
S21/311/31/30.0923O21/31350.2760
S323140.4659O31/51/3120.1115
S41/231/410.1647O41/51/51/210.0694
λmax = 4.1836, CR = 0.0680 < 0.1, accepted consistencyλmax = 4.1308, CR = 0.0484 < 0.1, accepted consistency
ItemW1W2W3W4Weights (Wi)ItemT1T2T3T4Weights (Ti)
W114130.3718T1131/31/50.1259
W21/411/530.1243T21/311/31/50.0727
W315140.4224T33311/30.2477
W41/31/31/410.0815T455310.5538
λmax = 4.2434, CR = 0.0901 < 0.1, accepted consistencyλmax = 4.1975, CR = 0.0731 < 0.1, accepted consistency
Table 10. Results of the SWOT–AHP study for straw-briquetting fuel project.
Group PriorityFactorsSi: Local Priority (Order)GSi: Global Priority (Order)
S0.4140S10.2770 (2)0.1147 (3)
S20.0923 (4)0.0382 (9)
S30.4659 (1)0.1929 (2)
S40.1647 (3)0.0682 (5)
W0.1090W10.3718 (2)0.0405 (8)
W20.1243 (3)0.0135 (13)
W30.4224 (1)0.0460 (7)
W40.0815 (4)0.0089 (14)
O0.4140O10.5431 (1)0.2248 (1)
O20.276 (2)0.1143 (4)
O30.1115 (3)0.0462 (6)
O40.0694 (4)0.0287 (11)
T0.0629T10.1259 (3)0.0079 (15)
T20.0727 (4)0.0046 (16)
T30.2477 (2)0.0156 (12)
T40.5538 (1)0.0348 (10)

