Optimization of Apartment-Complex Layout Planning for Daylight Accessibility in a High-Density City with a Temperate Climate

Abstract
1. Introduction
2. Literature Review
2.1. Integrated Sustainable Design Process
2.2. Preference for Residential Space and the Importance of the Light Environment
2.3. National Differences about the Right of Light and Attempting to Find the Optimal Value for Improving the Urban Form and Layout
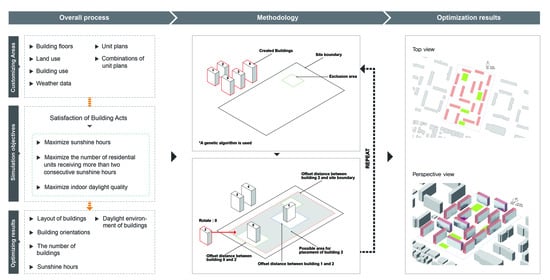
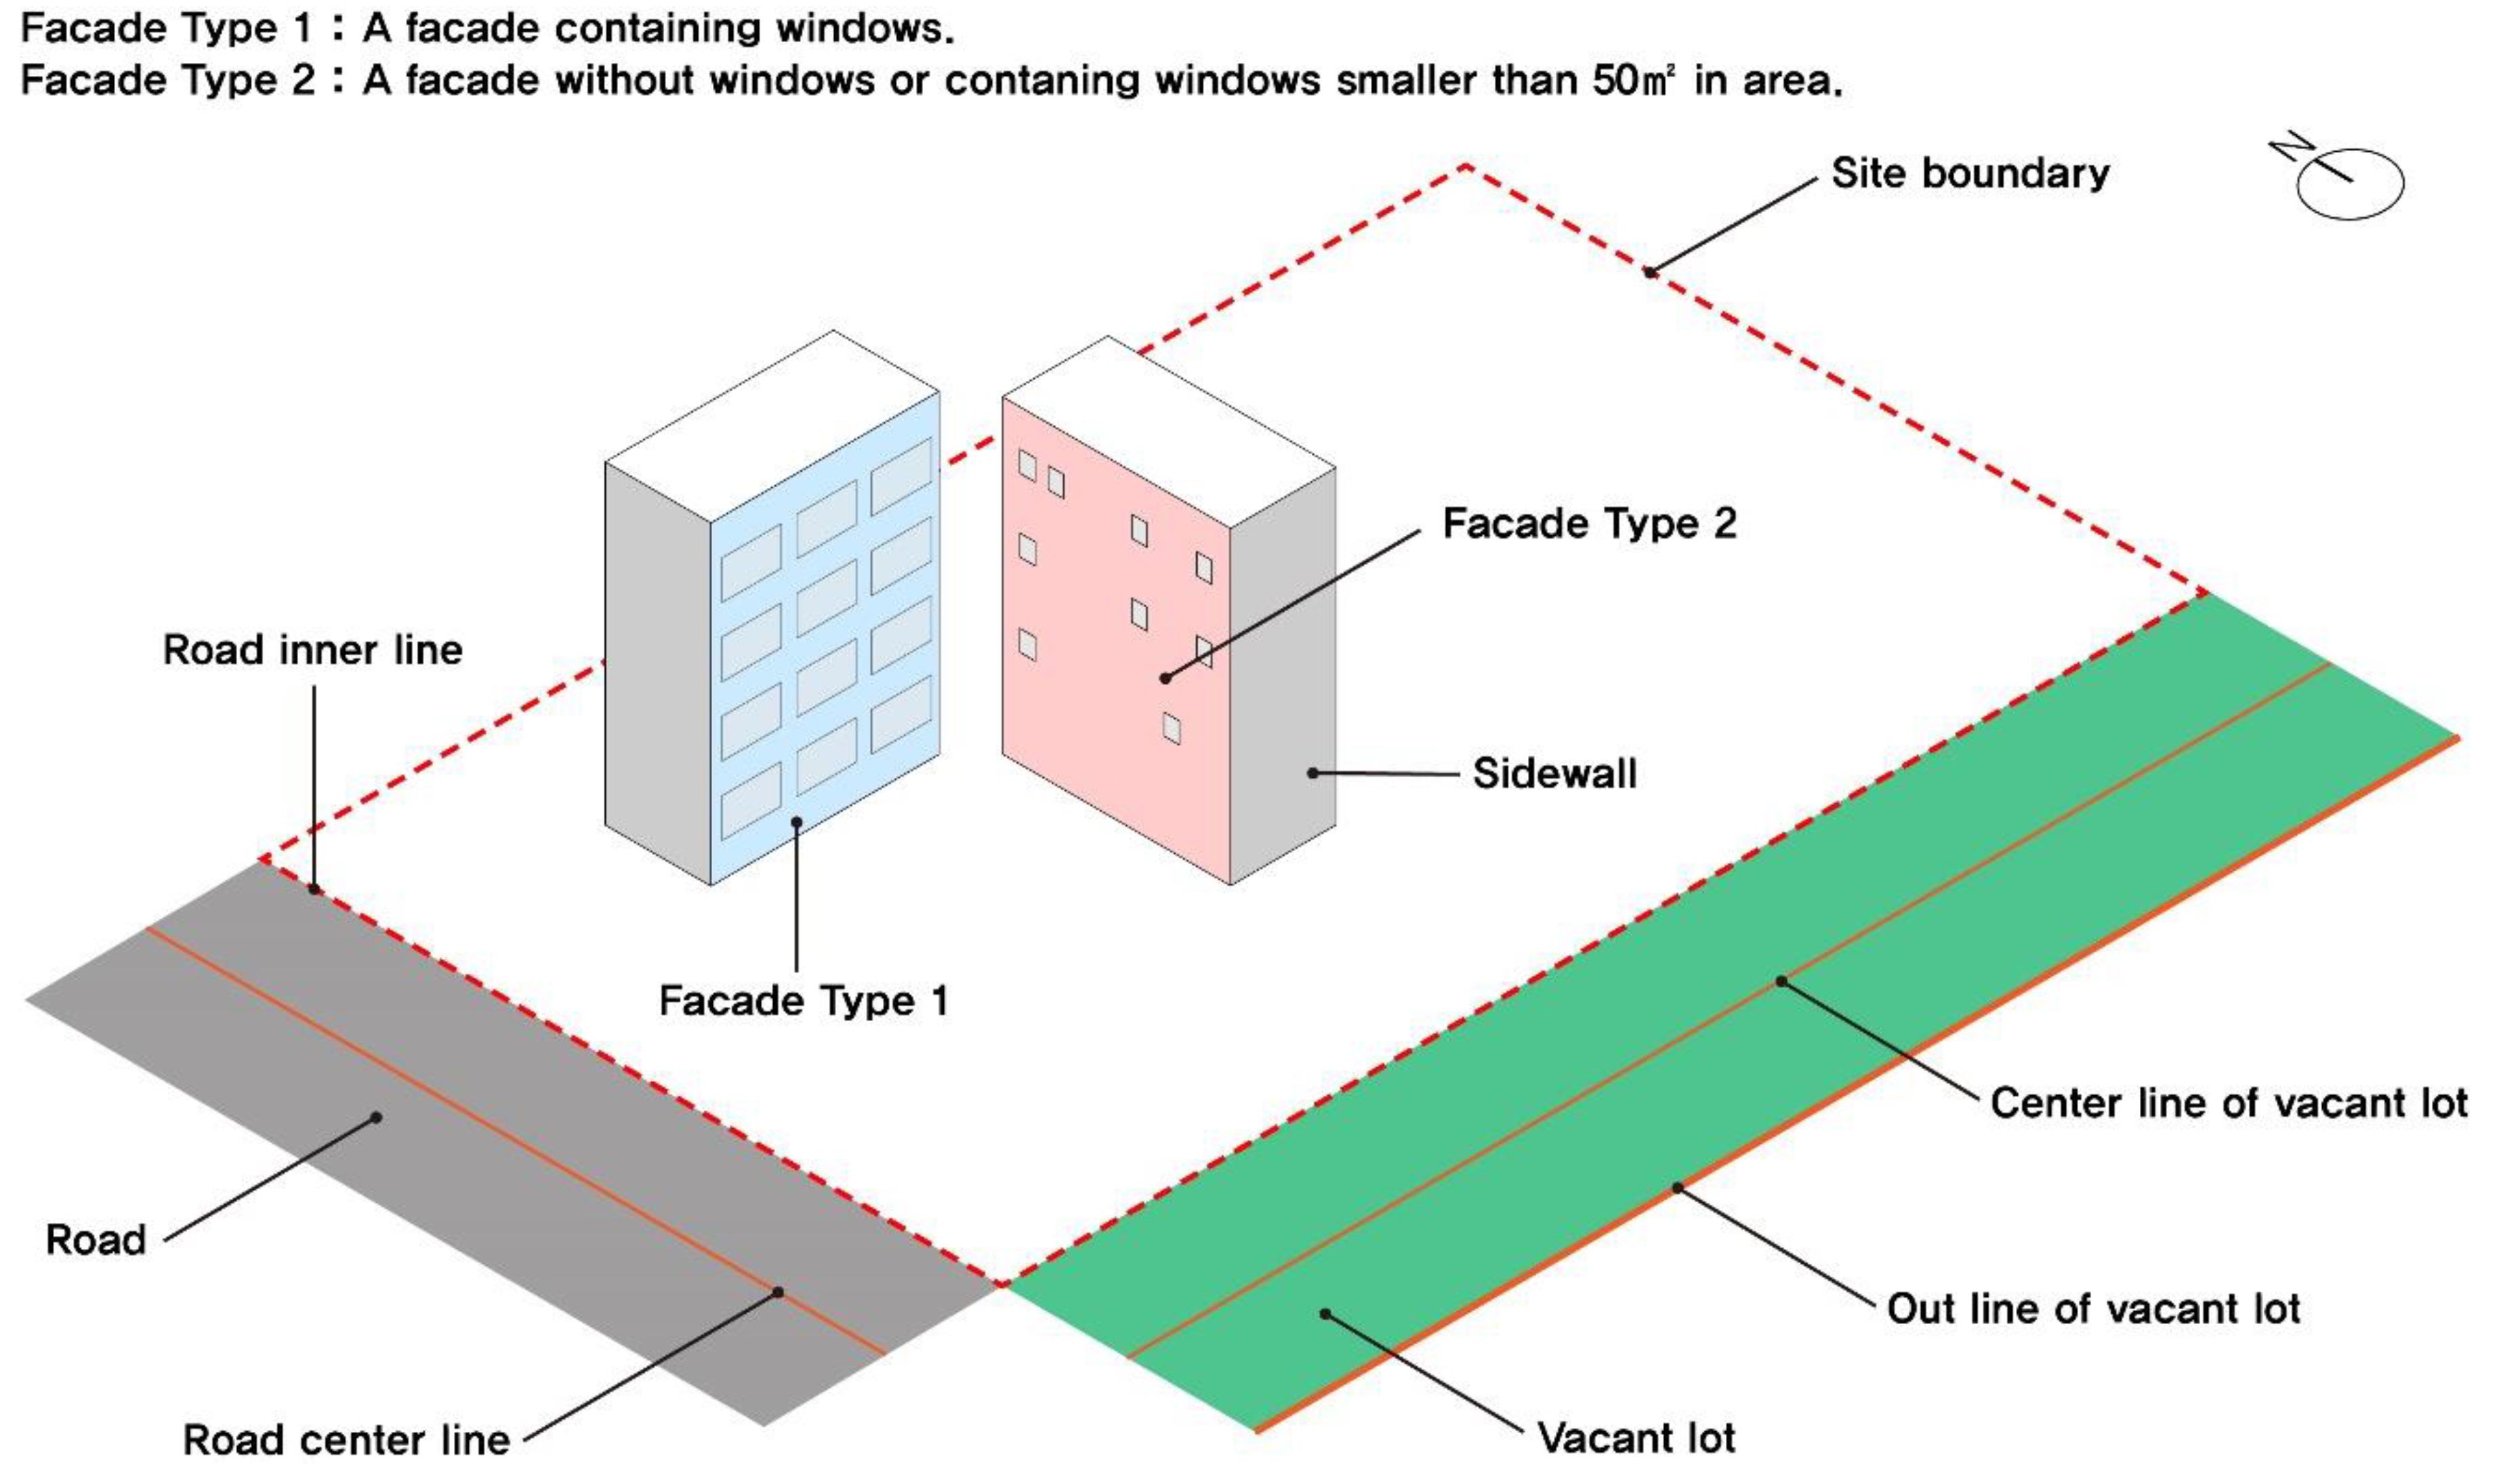
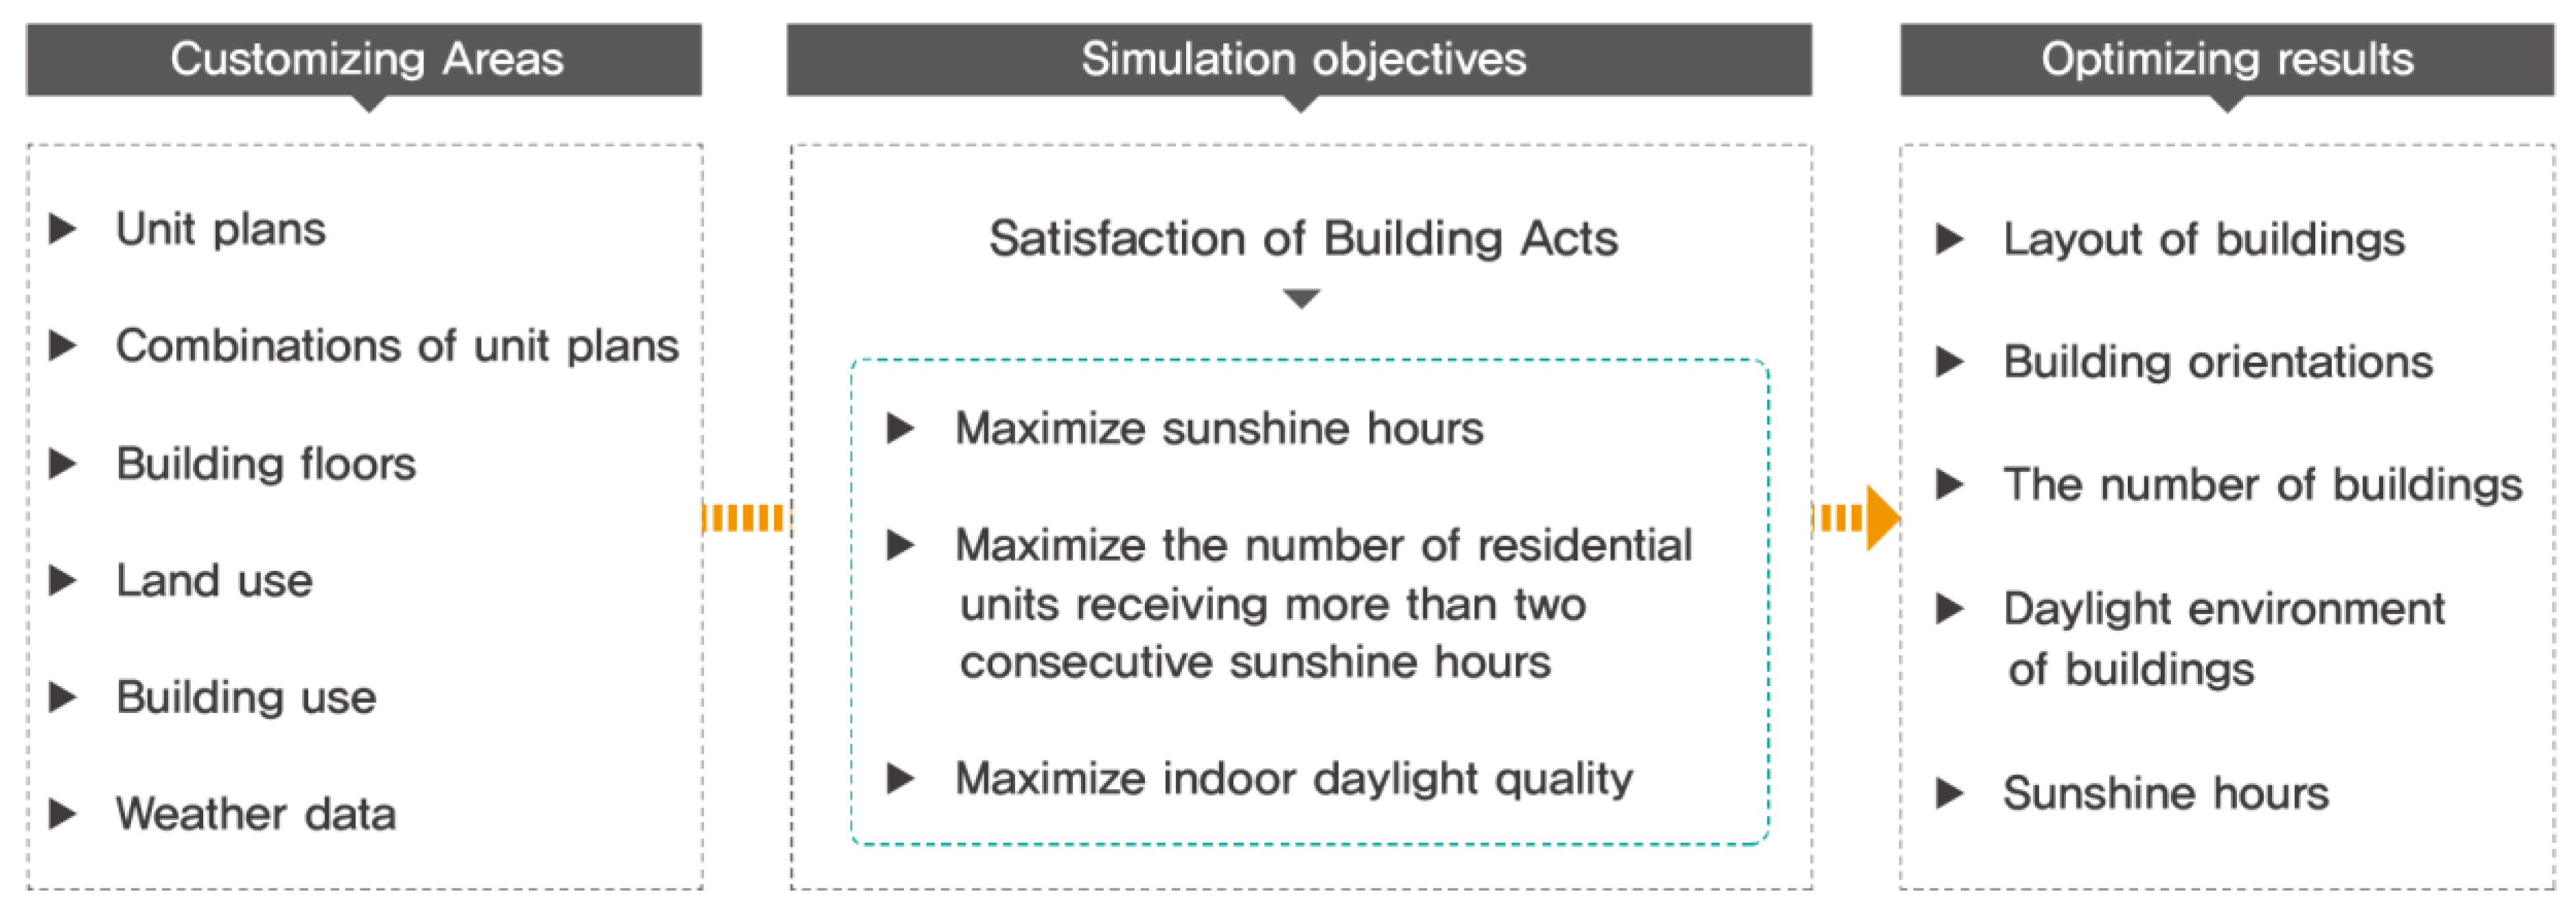
3. Methodology
4. Algorithm Development Process
4.1. Building Act Check
4.2. Building Generation
4.3. Building Layout Method
4.4. Indoor Daylight Environment Analysis
5. Genetic Algorithm Process for Discovering the Layout Plans to Maximize Fitness Value
5.1. The Evaluation Process for the Fitness Values
- Set building use, land use, location, and weather.
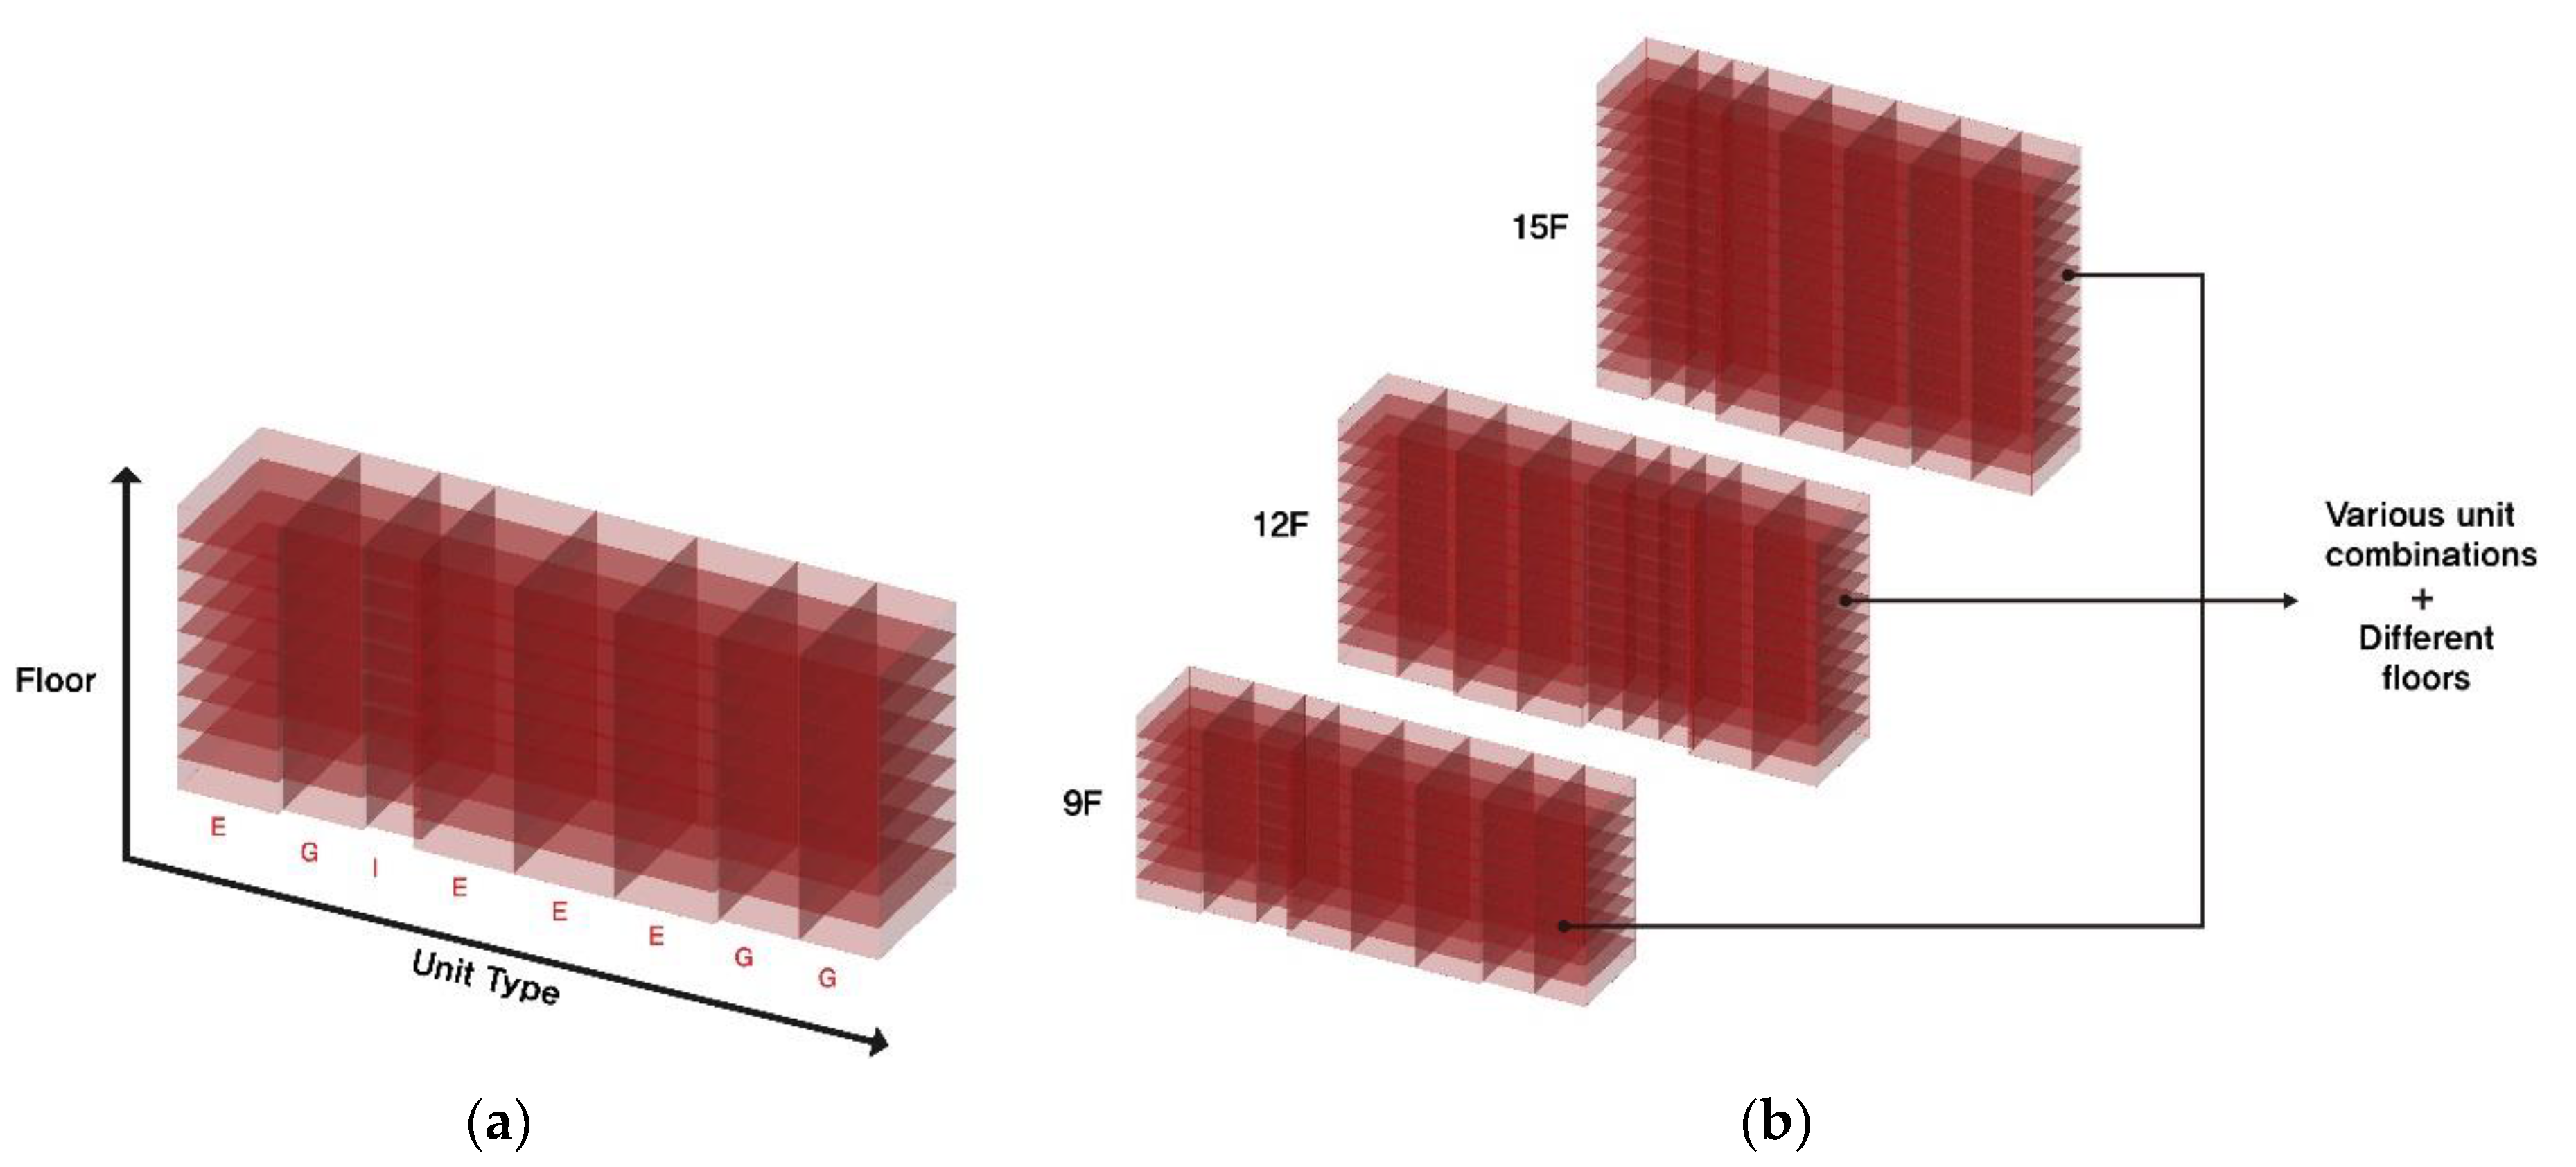
- Create buildings by setting the combination of unit plans and the number of floors.
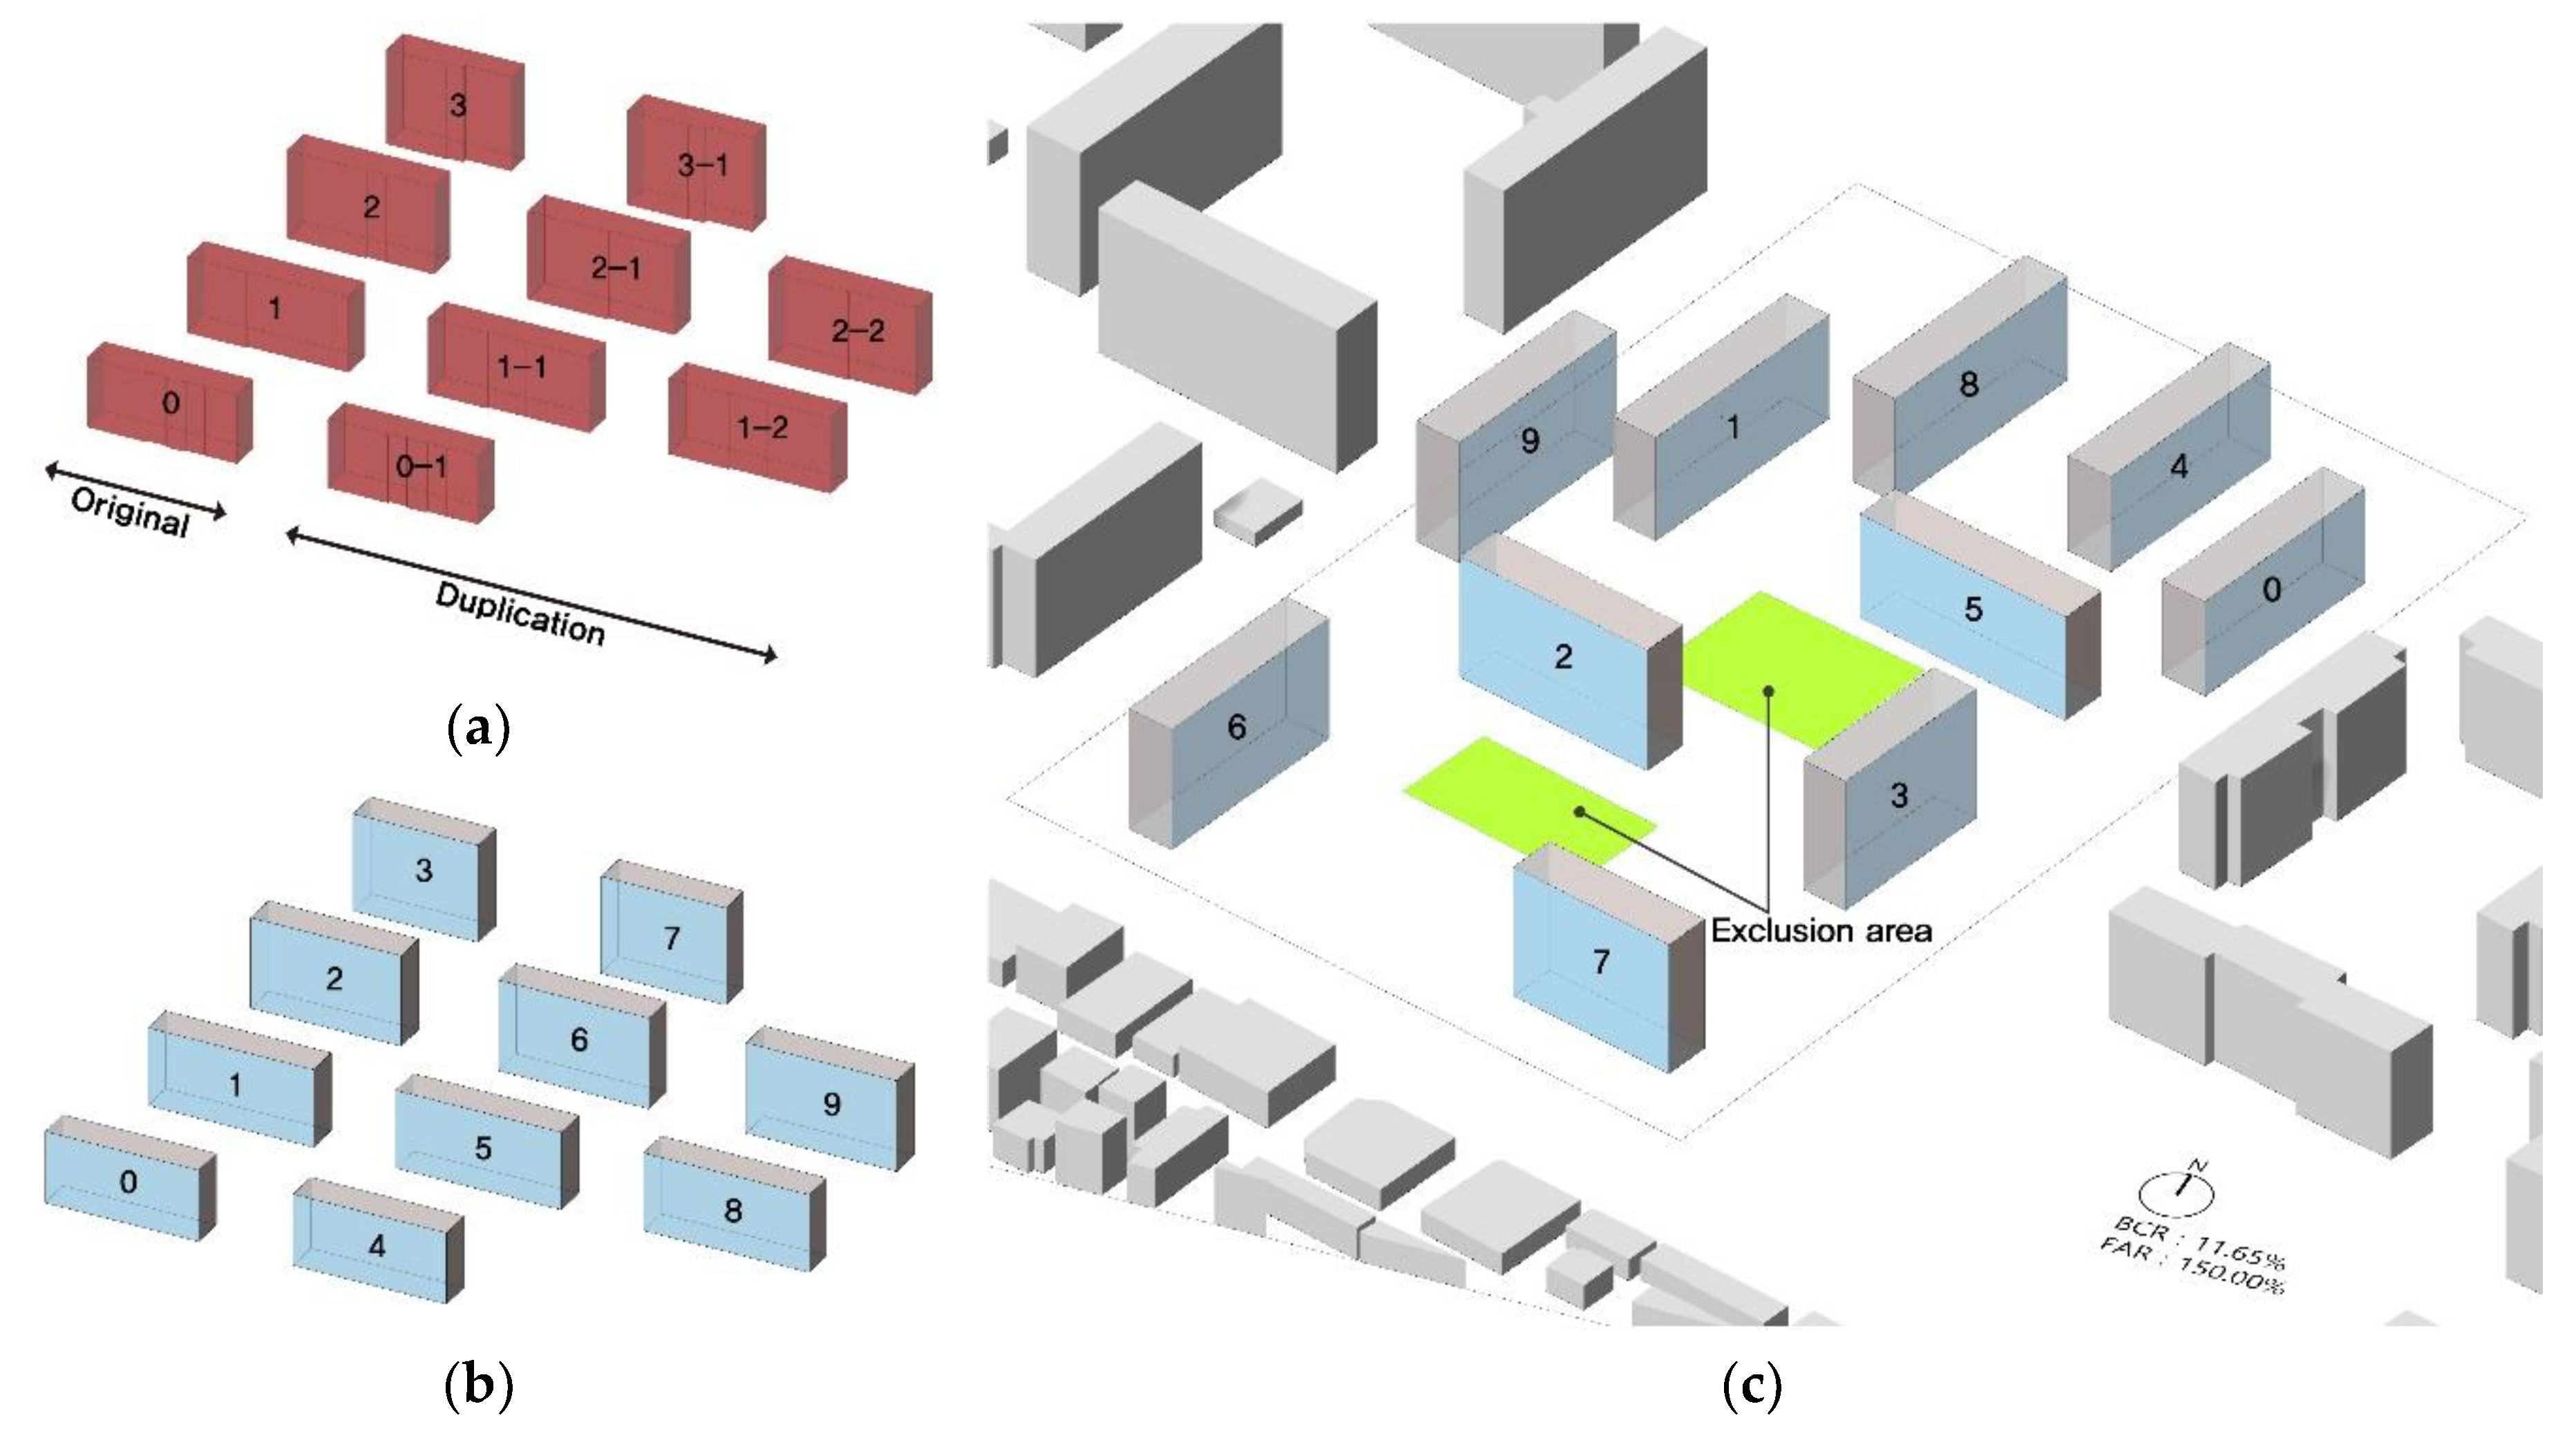
- Automatically create additional buildings while satisfying the maximum BCR and FAR.
- Generate the offset distance according to the previous set value.
- Rotate created buildings at any input rotation values.
- Place in a random area those buildings that can be placed in order. Check if there are missing buildings that cannot be placed. If so, the fitness value is evaluated as zero.
- Evaluate a fitness value for the completed layout.
5.2. The Process of the Genetic Algorithm
- Fitness function
- Selection mechanism
- Coupling algorithm
- Coalescence algorithm
- Mutation factory
6. Application of the Developed Technology to the Case
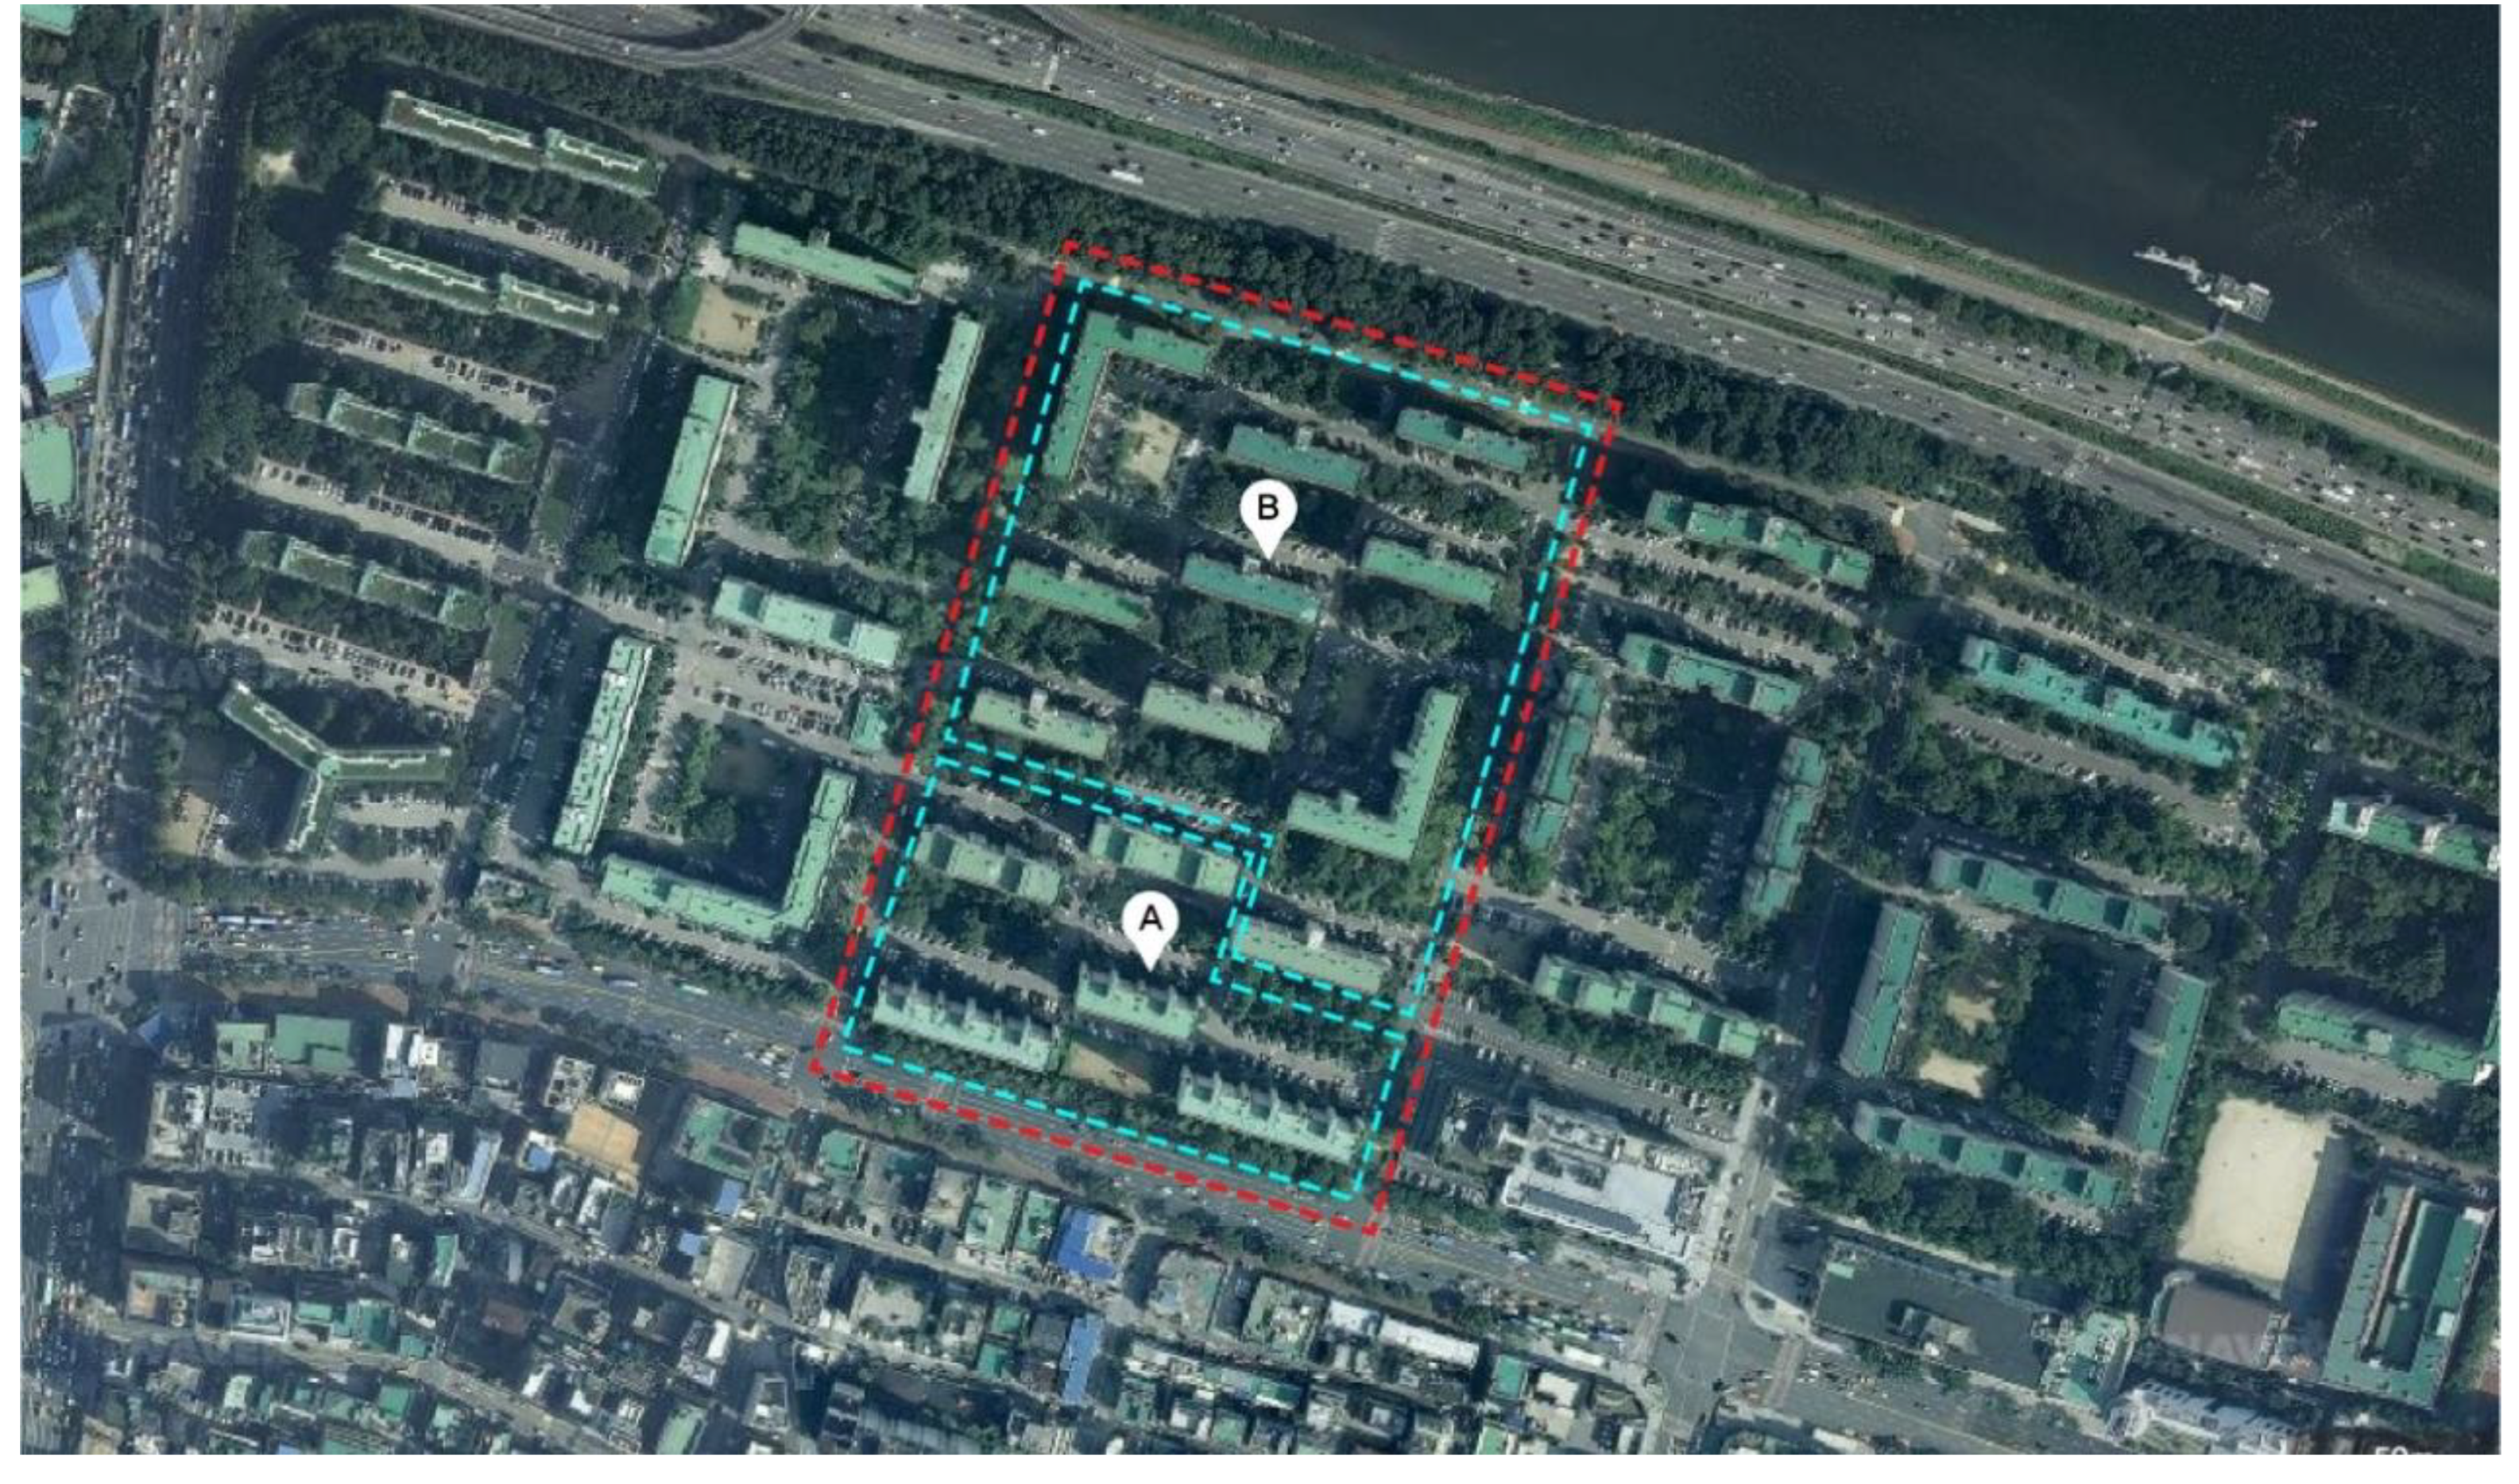
6.1. The Features of the Existing Target Apartment Complex
6.2. Optimization Results
7. Discussion
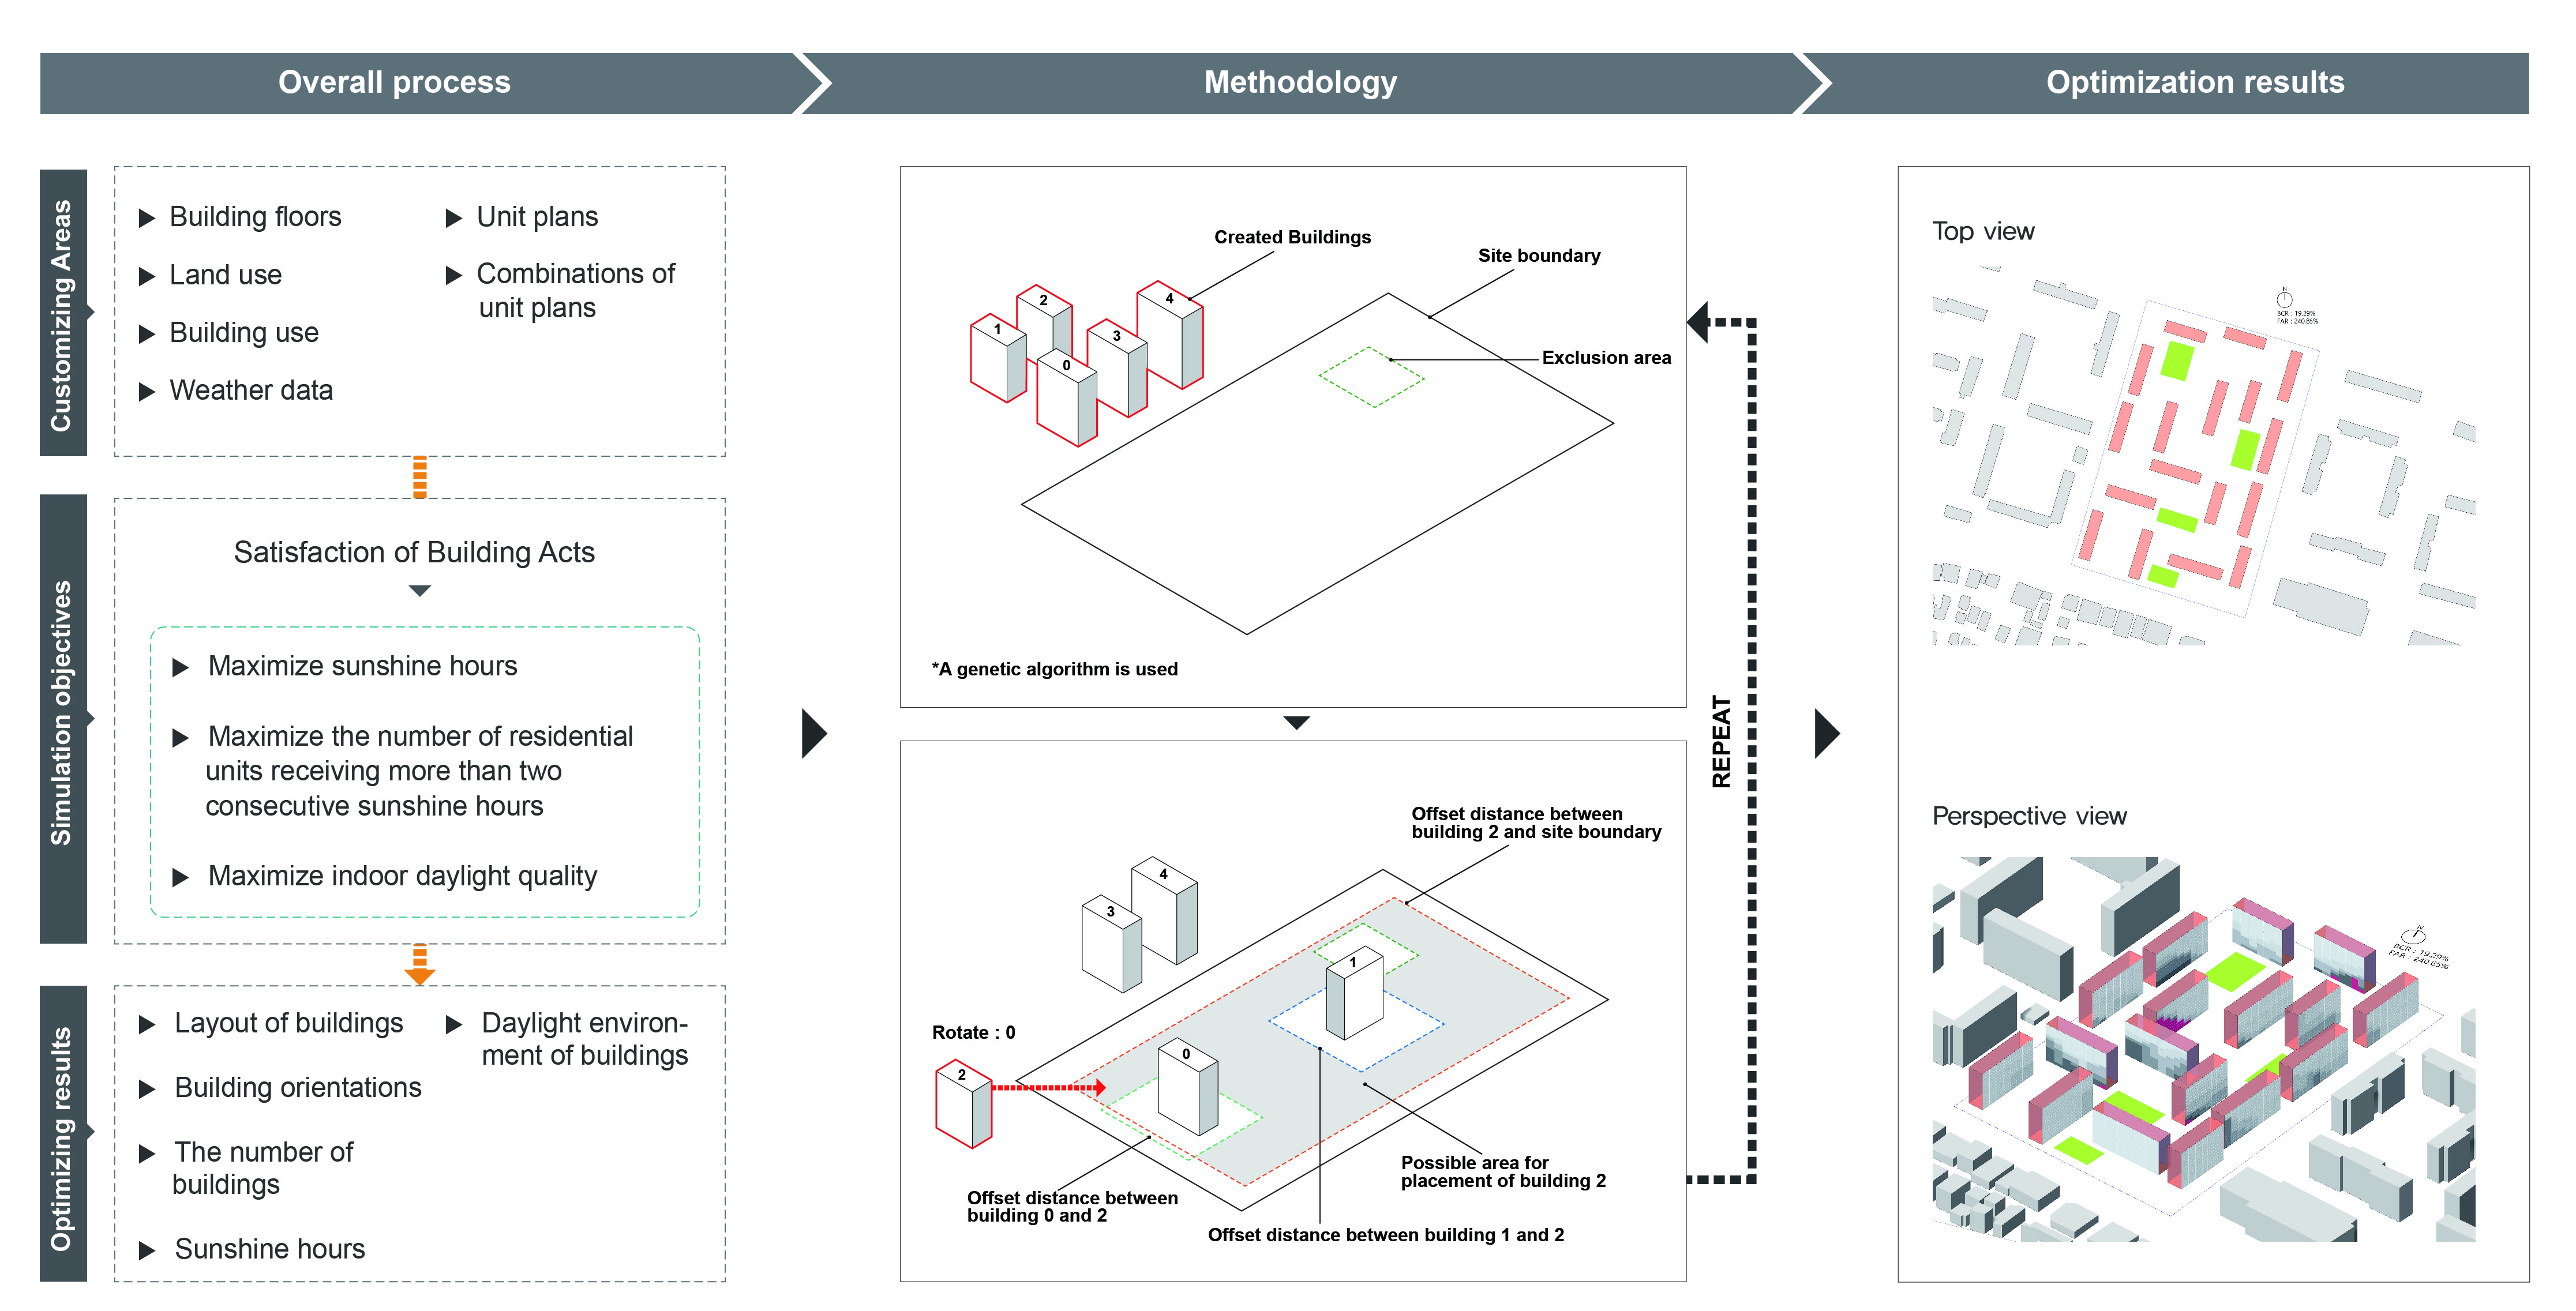
8. Definition
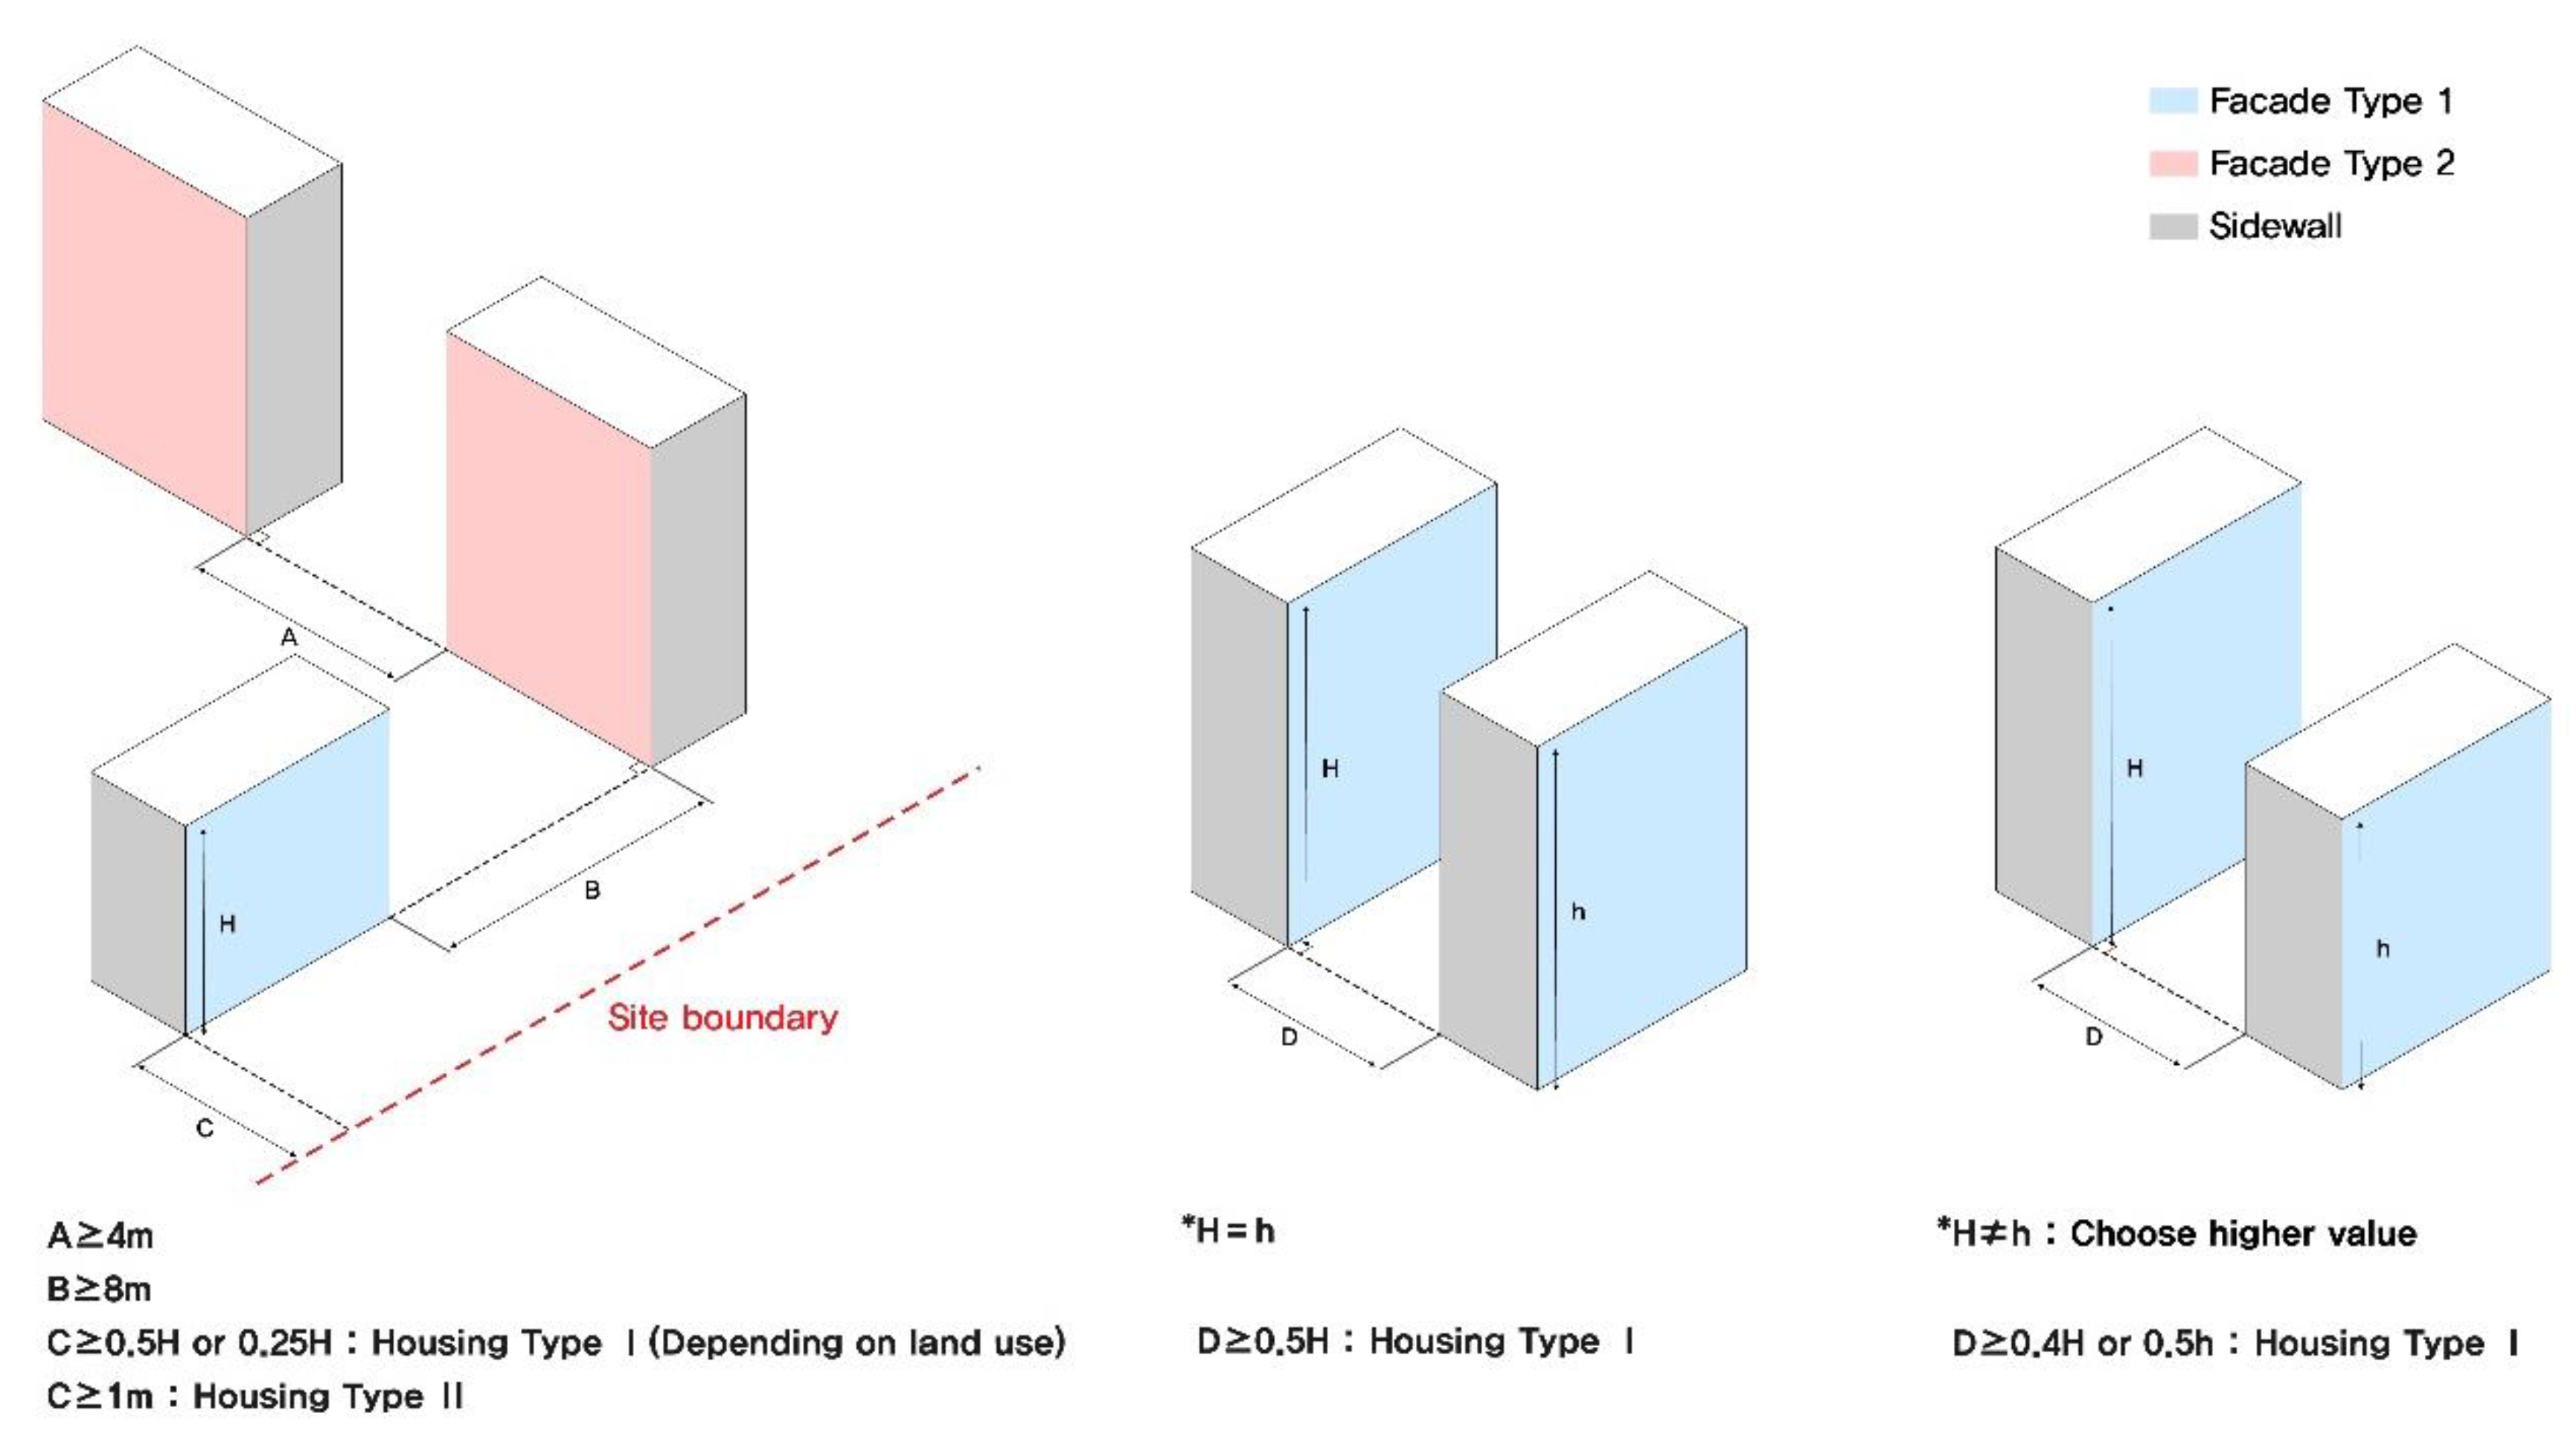
- Facade Type 1: A facade containing windows
- Facade Type 2: A facade without windows or containing the windows smaller than 50 m2 in area.
- A-1 zoning district: The area needed to protect the residential environment centered on single-family houses. It is possible to build single-family houses and neighborhood service facilities with a floor area of 1000 square meters or less.
- A-2 zoning district: The area needed to protect the residential environment centered on multi-family houses. It is possible to build single-family houses, multi-family houses, and neighborhood service facilities with a floor area of 1000 square meters or less.
- B-1 zoning district: The residential area centered on low-rise houses. It is possible to build single-family houses with floors less than five, multi-family houses, neighborhood service facilities, schools, and child and geriatric welfare institutions.
- B-2 zoning district: The residential area centered on middle-rise houses. It is possible to build single-family houses, multi-family houses, neighborhood service facilities, religious facilities, schools, and child and geriatric welfare institutions.
- B-3 zoning district: The residential area centered on middle and high-rise houses. It is possible to build single-family houses, multi-family houses, neighborhood service facilities, religious facilities, schools, and child and geriatric welfare institutions.
- Housing Type I: A house where all or part of the facilities of a building can be used jointly by several units and ensuring independent living for each residential unit. The dormitory and Housing Type II are excluded.
- Housing Type II: A house where total floor area is equal to or less than 660 m2, and the number of floors is less than five.
- Dormitory: A building used for students or workers. It has structures for joint cooking, but it does not have an independent residential space.
- Overall: Temperate weather zone with four distinct seasons. In winter, it is cold, clear, and dry under the influence of the Siberian air mass, and in summer, it is hot, cloudy, and rainy due to the influence of the North Pacific air mass. In spring and autumn, there are many clear and dry days due to the influence of mobile high pressure [42].
- Winter solstice: The standard date is December 22nd in Korea. The date is used to determine daylight accessibility for each residential unit because the sun’s southern middle altitude is the lowest, meaning that shadows are the longest on that day.
Author Contributions
Funding
Conflicts of Interest
References
- Riley, D.; Magent, C.; Horman, M. Sustainable metrics: A design process model for high performance buildings. In Proceedings of the CIB World Building Congress, Toronto, ON, Canada, 2–7 May 2004. [Google Scholar]
- Magent, C.S.; Korkmaz, S.; Klotz, L.E.; Riley, D.R. A Design Process Evaluation Method for Sustainable Buildings. Archit. Eng. Des. Manag. 2009, 5, 62–74. [Google Scholar] [CrossRef]
- Reed, W.G.; Gordon, E.B. Integrated Design and Building Process: What Research and Methodologies Are Needed? Build. Res. Inf. 2000, 28, 325–337. [Google Scholar] [CrossRef]
- Lewis, M. Integrated Design for Sustainable Buildings. ASHRAE J. 2004, 46, S22–S30. [Google Scholar]
- LEED V4 for Building Design and Construction. Available online: http://www.usgbc.org/resources/leed-v4-building-design-and-construction-current-version (accessed on 15 May 2019).
- Korea Institute of Construction Technology. Available online: https://www.gbc.re.kr/app/data/regulation/view.do (accessed on 15 May 2019).
- Montavon, M.; Scartezzini, J.-L.; Compagnon, R. Comparison of the solar energy utilisation potential of different urban environments. In Proceedings of the PLEA 2004 Conference, Eindhoven, The Netherlands, 19–22 September 2004. [Google Scholar]
- Keirstead, J.; Shah, N. Calculating Minimum Energy Urban Layouts with Mathematical Programming and Monte Carlo Analysis Techniques. Comput. Environ. Urban Syst. 2011, 35, 368–377. [Google Scholar] [CrossRef]
- Chatzipoulka, C.; Compagnon, R.; Nikolopoulou, M. Urban Geometry and Solar Availability on Façades and Ground of Real Urban Forms: Using London as a Case Study. Sol. Energy 2016, 138, 53–66. [Google Scholar] [CrossRef]
- Kirimtat, A.; Krejcar, O.; Ekici, B.; Fatih Tasgetiren, M. Multi-Objective Energy and Daylight Optimization of Amorphous Shading Devices in Buildings. Sol. Energy 2019, 185, 100–111. [Google Scholar] [CrossRef]
- Torres, S.; Sakamoto, Y. Facade Design Optimization for Daylight with a Simple Genetic Algorithm. In Proceedings of the Building Simulation, Beijing, China, 3–6 September 2007; pp. 1162–1167. [Google Scholar]
- Gagne, J.M.L.; Andersen, M. Multi-objective facade optimization for daylighting design using a genetic algorithm. In Proceedings of the SimBuild 2010—4th National Conference of IBPSA-USA, New York, NY, USA, 11–13 August 2010. [Google Scholar]
- Grasshopper—New in Rhino 6. Available online: https://www.rhino3d.com/en/6/new/grasshopper (accessed on 9 January 2020).
- Rhino 6. Available online: https://www.rhino3d.com/en/ (accessed on 9 January 2020).
- Conte, E.; Monno, V. Beyond the Building Centric Approach: A Vision for an Integrated Evaluation of Sustainable Buildings. Environ. Impact Assess. Rev. 2012, 34, 31–40. [Google Scholar] [CrossRef]
- KOSIS Korea Housing Type by Region and Income. Available online: http://kosis.kr/statHtml/statHtml.do?orgId=116&tblId=DT_MLTM_5727 (accessed on 19 November 2019).
- Choi, K.-J.; Jihn, J. A Study on the Change of the Apartment Unit Plan in National Housing—Focused on Institutional and Social Changes -. J. Korean Hous. Assoc. 2015, 26, 123–131. [Google Scholar] [CrossRef]
- Hong, S.-I.; Lim, S.-Y. A Study on the Change of the Housing Culture Koreans through the First-Generation Apartment in Korea. Asia-Pac. J. Multimed. Serv. Converg. Art Humanit. Sociol. 2018, 8, 985–998. [Google Scholar]
- Jim, C.Y.; Chen, W.Y. Impacts of Urban Environmental Elements on Residential Housing Prices in Guangzhou (China). Landsc. Urban Plan. 2006, 78, 422–434. [Google Scholar] [CrossRef]
- Chung, J.-Y. A Study on the Analysis of the Housing Preference of Newtown Apartments in Busan, Gyeongnam. J. Archit. Inst. KOREA Plan. Des. 2007, 23, 253–260. [Google Scholar]
- Moon, T.-H.; Jeong, Y.-Y. Analysis of Determinant Factors of Apartment Price Considering the Spatial Distribution and Housing Attributes. J. Korean Assoc. Geogr. Inf. Stud. 2008, 11, 68–79. [Google Scholar]
- Boubekri, M.; Hull, R.B.; Boyer, L.L. Impact of Window Size and Sunlight Penetration on Office Workers’ Mood and Satisfaction: A Novel Way of Assessing Sunlight. Environ. Behav. 1991, 23. [Google Scholar] [CrossRef]
- Hathaway, W.E. A Study into the Effects of Light on Children of Elementary School-Age—A Case of Daylight Robbery (ERIC document ED343686). Available online: https://eric.ed.gov/?id=ED343686 (accessed on 9 January 2020).
- Boubekri, M.; Cheung, I.N.; Reid, K.J.; Wang, C.-H.; Zee, P.C. Impact of Windows and Daylight Exposure on Overall Health and Sleep Quality of Office Workers: A Case-Control Pilot Study. J. Clin. Sleep Med. 2014, 10, 603–611. [Google Scholar] [CrossRef] [PubMed]
- Lim, T.S.; Lim, J.H.; Kim, B.S. Space Study on Lighting Performance for Residential Buildings by Using Simulation Analysis. KIEAE J. 2013, 13, 97–104. [Google Scholar] [CrossRef]
- 2010~2015 MOLTMA Korean Housing Manual. Available online: http://www.molit.go.kr/USR/policyData/m_34681/dtl.jsp?search=%EC%A3%BC%ED%83%9D%EC%97%85%EB%AC%B4&srch_dept_nm=&srch_dept_id=&srch_usr_nm=&srch_usr_titl=Y&srch_usr_ctnt=&search_regdate_s=&search_regdate_e=&psize=10&s_category=&p_category=&lcmspage=1&id=4181 (accessed on 10 December 2019).
- Shang, C.; Lin, K.; Hou, G. Simulating the Impact of Urban Morphology on Energy Demand—A Case Study of Yuehai, China. In Proceedings of the 49th ISOCARP Congress, Brisbane, Australia, 1–4 October 2013. [Google Scholar]
- Zhang, J.; Xu, L.; Shabunko, V.; Tay, S.E.R.; Sun, H.; Lau, S.S.Y.; Reindl, T. Impact of Urban Block Typology on Building Solar Potential and Energy Use Efficiency in Tropical High-Density City. Appl. Energy 2019, 240, 513–533. [Google Scholar] [CrossRef]
- Le, D.S. Protection of Solar Access Rights in America. Korea Public Land Law Assoc. Public Land Law Rev. 2015, 68, 1–28. [Google Scholar]
- Kim, C.H. A Law and Economic Analysis of Right to Sunlight. Korean Law Econ. Assoc. 2016, 13, 399–418. [Google Scholar]
- Burrows, A.; Johnston, D.; Zimmermann, R. Judge and Jurist: Essays in Memory of Lord Rodger of Earlsferry; Oxford University Press: Oxford, UK, 2013; ISBN 978-0-19-967734-4. [Google Scholar]
- Lee, S.-O. The Law and Political Meaning of Real Rights Law in Contemporary China. J. Law Res. 2007, 23, 201–224. [Google Scholar]
- Yoo, G.H. A Review of International Cases of Building Standards Related to Sunlight and Institutional Improvement Directions. Available online: https://www.kab.co.kr/kab/home/common/download_cnt.jsp?sMenuIdx=036015015000035021&sBoardIdx=045005125006039021&sFileIdx=045005125001 (accessed on 1 June 2020).
- Wortmann, T. Genetic Evolution vs. Function Approximation: Benchmarking Algorithms for Architectural Design Optimization. J. Comput. Des. Eng. 2019, 6, 414–428. [Google Scholar] [CrossRef]
- Yu, W.; Li, B.; Jia, H.; Zhang, M.; Wang, D. Application of Multi-Objective Genetic Algorithm to Optimize Energy Efficiency and Thermal Comfort in Building Design. Energy Build. 2015, 88, 135–143. [Google Scholar] [CrossRef]
- El Ansary, A.M.; Shalaby, M.F. Evolutionary Optimization Technique for Site Layout Planning. Sustain. Cities Soc. 2014, 11, 48–55. [Google Scholar] [CrossRef]
- Gan, V.J.L.; Wong, H.K.; Tse, K.T.; Cheng, J.C.P.; Lo, I.M.C.; Chan, C.M. Simulation-Based Evolutionary Optimization for Energy-Efficient Layout Plan Design of High-Rise Residential Buildings. J. Clean. Prod. 2019, 1375–1388. [Google Scholar] [CrossRef]
- Vermeulen, T.; Knopf-Lenoir, C.; Villon, P.; Beckers, B. Urban Layout Optimization Framework to Maximize Direct Solar Irradiation. Comput. Environ. Urban Syst. 2015, 51, 1–12. [Google Scholar] [CrossRef]
- Kämpf, J.H.; Montavon, M.; Bunyesc, J.; Bolliger, R.; Robinson, D. Optimisation of Buildings’ Solar Irradiation Availability. Sol. Energy 2010, 84, 596–603. [Google Scholar] [CrossRef]
- Kim, K.; Cho, M. Development of the Layout Method for a High-Rise Housing Complex Using Parametric Algorithm. J. Asian Archit. Build. Eng. 2020, 19, 30–47. [Google Scholar] [CrossRef]
- Korea Building Construction Law. Available online: http://www.law.go.kr/%EB%B2%95%EB%A0%B9/%EA%B1%B4%EC%B6%95%EB%B2%95 (accessed on 9 January 2020).
- Korea Meteorological Administration—Climate. Available online: https://www.kma.go.kr/eng/biz/climate_01.jsp (accessed on 3 August 2020).
- Jeung, S.J.; Sung, J.H.; Kim, B.S. Assessment of the Impacts of Climate Change on Climatic Zones Over the Korean Peninsula. Available online: https://www.hindawi.com/journals/amete/2019/5418041/ (accessed on 31 July 2020).
- Kim, Y.; Shim, K.-M.; Jung, M.-P.; Choi, I.-T.; Kang, K.-K. Study on the Change of Climate Zone in South Korea by the Climate Change Scenarios. Korean J. Agric. For. Meteorol. 2017, 19, 37–42. [Google Scholar] [CrossRef]
- Solemma LLC | DIVA. Available online: http://solemma.net/Diva.html (accessed on 14 January 2020).
- Lee, D.H.; Choi, C.H.; Lee, H.W. Comparative Research on Calculation Methods (Point Standpoint and Area Standpoint) of Sunshine Duration for Building. J. Korean Sol. Energy Soc. 2004, 24, 9–17. [Google Scholar]
- Rutton, D. Evolutionary Principles Applied to Problem Solving. Available online: https://ieatbugsforbreakfast.wordpress.com/2011/03/04/epatps01/ (accessed on 1 June 2020).
- Rutton, D. Galapagos: On the Logic and Limitations of Generic Solvers. Available online: https://www.researchgate.net/publication/264299633_Galapagos_On_the_Logic_and_Limitations_of_Generic_Solvers (accessed on 1 May 2020).
- Rutton, D. Evolutionary Solver: Coalescence. Available online: https://ieatbugsforbreakfast.wordpress.com/2011/03/05/evolutionary-solver-coalescence-algorithms/ (accessed on 1 June 2020).


| A. Building Coverage Ratio (BCR), Floor-Area Ratio (FAR) | ||
|---|---|---|
| Type | BCR | FAR |
| 1. A-1 zoning district | BCR ≤ 50% | 50% ≤ FAR ≤ 100% |
| 2. A-2 zoning district | BCR ≤ 50% | 100% ≤ FAR ≤ 150% |
| 3. B-1 zoning district | BCR ≤ 60% | 100% ≤ FAR ≤ 200% |
| 4. B-2 zoning district | BCR ≤ 60% | 150% ≤ FAR ≤ 250% |
| 5. B-3 zoning district | BCR ≤ 50% | 200% ≤ FAR ≤ 300% |
| B. Building Offset Distance According to Window Properties | ||
| Type | The Distance between the Façade with Window and the Adjacent Site Boundary | |
| Housing Type I | Housing Type II | |
| 1. Except general commercial and central commercial area | D ≥ 0.5H 1 | D ≥ 1 m |
| 2. Neighboring commercial and semi-residential area | D ≥ 0.25H | D ≥ 1 m |
| C. The Offset Distance between Buildings Based on Building Properties | ||
| Type | Interrelation | Distance |
| 1. Multi-family houses with the same height | The Facade Type 1 and other facades | D ≥ 0.5 H |
| 2. Urban type houses with the same height | The Facade Type 1 and other facades | D ≥ 0.25 H |
| 3. Multi-family houses with different heights | The Facade Type 1 and other facades | D ≥ 0.4 H or 0.5 h 2, 3 |
| 4. Urban type houses with different heights | The Facade Type 1 and other facades | D ≥ 0.2 H or 0.25 h 2, 3 |
| 5. Walls without window and other building sidewalls | The Facade Type 2 and other sidewalls | D ≥ 8 m |
| 6. Sidewalls and other building sidewalls | The sidewall and other sidewalls | D ≥ 4 m |
| D. The Right of Daylight when Close to a Vacant Lot or Road | ||
| Type | Interrelation | Distance |
| 1. Buildings and vacant lot | Facade Type 1 and centerline of the vacant lot | Same as section B |
| E. Offset Distance from Building Line According to Road Width | ||
| Type | Interrelation | Distance |
| 1. The adjacent road over 4 meters | Site boundary and the inner line of roads | 0 |
| 2. Adjacent road less than 4 meters | Site boundary and the centerline of roads | D ≥ 2 m |
| F. The Right of Sunshine Hours 4 | ||
| All residential units in the building can secure sunshine for more than two consecutive hours between 9 am and 3 pm based on the winter solstice 5 | ||
| Material Name in DIVA for Rhino-Grasshopper | Material Properties | |||
|---|---|---|---|---|
| Material Introduce | Material Type | Material Reflectivity and Transmission | ||
| Wall | Generic interior wall_50 | A purely diffuse reflector with a standard grey wall | Opaque | Reflectivity: 50% |
| Floor | Generic Floor_20 | A purely diffuse reflector with a standard floor | Opaque | Reflectivity: 20% |
| Ceiling | Generic ceiling_70 | A purely diffuse reflector with a standard ceiling | Opaque | Reflectivity: 70% |
| Window | Glaze double pane Clear_80 | Tau_vis = 0.80; SHGC 1 = 0.28 | Transparency | Visual transmittance: 80% Visual transmissivity: 87% |
| Ground | OutsideGround_20 | This is a purely diffuse reflector with a standard reflectivity | Opaque | Reflectivity: 20% |
| Setting Values | Derived Values | Variables |
|---|---|---|
| District | Land Use | Land Area | Current BCR | Current FAR | Number of Buildings | Building Floors | Building Type |
|---|---|---|---|---|---|---|---|
| A | B-3 zoning district | 21,073.5 m2 | 22% | 293% | 5 | 13 | Housing Type I |
| B | B-3 zoning district | 38,323.4 m2 | 17% | 211% | 10(12) 1 | 12 | Housing Type I |
| A + B | B-3 zoning district | 59,396.9 m2 | 19% 2 | 240% 2 | 15(17) 1 | 12, 13 | Housing Type I |
 |  |  |
| 2.1014 | 2.0675 | 2.0613 |
 |  |  |
| 2.0583 | 2.0507 | 2.0485 |
 |  |  |
| 2.0418 | 2.0376 | 2.0343 |
© 2020 by the authors. Licensee MDPI, Basel, Switzerland. This article is an open access article distributed under the terms and conditions of the Creative Commons Attribution (CC BY) license (http://creativecommons.org/licenses/by/4.0/).
Share and Cite
Lee, S.; Lee, K.S. Optimization of Apartment-Complex Layout Planning for Daylight Accessibility in a High-Density City with a Temperate Climate. Energies 2020, 13, 4172. https://doi.org/10.3390/en13164172
Lee S, Lee KS. Optimization of Apartment-Complex Layout Planning for Daylight Accessibility in a High-Density City with a Temperate Climate. Energies. 2020; 13(16):4172. https://doi.org/10.3390/en13164172
Chicago/Turabian StyleLee, Sewon, and Kyung Sun Lee. 2020. "Optimization of Apartment-Complex Layout Planning for Daylight Accessibility in a High-Density City with a Temperate Climate" Energies 13, no. 16: 4172. https://doi.org/10.3390/en13164172
APA StyleLee, S., & Lee, K. S. (2020). Optimization of Apartment-Complex Layout Planning for Daylight Accessibility in a High-Density City with a Temperate Climate. Energies, 13(16), 4172. https://doi.org/10.3390/en13164172