Article

A Design Method for Magnetically Coupled Resonant Coils Considering Transmission Objectives and Dimension Constraints

1
State Key Laboratory of Power Transmission Equipment & System Security and New Technology, Chongqing University, Chongqing 400044, China
2
Baotou Power Supply Bureau of Inner Mongolia Electric Power Group Co., Ltd, Inner Mongolia Autonomous Region, Baotou 014000, China
3
China Southern Power Grid Yunnan Electric Power Research Institute, Yunnan Province, Kunming 650217, China
*
Author to whom correspondence should be addressed.
Energies 2020, 13(16), 4144; https://doi.org/10.3390/en13164144
Submission received: 2 July 2020 / Revised: 7 August 2020 / Accepted: 7 August 2020 / Published: 11 August 2020
(This article belongs to the Section F: Electrical Engineering)

Abstract

:
This paper proposes a coil design method for the magnetically coupled resonant wireless power transfer (MCR-WPT) system. Based on the Biot–Savart law, the magnetic flux density at the observation point was derived, and the magnetic flux of the observation plane generated by the exciting coil was deduced to build the calculation model of power transfer efficiency (PTE) and power delivered to the load (PDL). The PTE and PDL curves via coil parameters could be fitted in minutes using numerical calculation. The coil was designed according to transmission objectives and dimension constraints. In addition, the calculated PTE and PDL were compared with those from finite element analysis to verify the credibility of the method. Finally, the actual curves of PTE and PDL were achieved, which showed a strong positive correlation with the corresponding curves from the calculation model. The relative average deviations of PDL curves were less than 6.11%. Meanwhile, coils designed with the numerical calculation could realize 309.80 W and 88.51%, which achieved the objectives under the constraints. The results demonstrate that the proposed method can realize a rapid and accurate coil design under constraints. It can also be applied to other coil structures or circuit topologies with strong universality.

Graphical Abstract

1. Introduction

Owing to numerous advantages, such as midrange transfer, good effect on transmission, and little influence on nonmagnetic obstacles, the magnetically coupled resonant wireless power transfer (MCR-WPT) system has been extensively applied in daily life [1,2,3,4]. Faced with different applications, the system needs to be designed based on actual demands. The demands usually refer to objectives and constraints, such as power transfer efficiency (PTE), power delivered to the load (PDL), and coil dimension. Besides the circuit topology, resonant coils are also of vital importance for realizing power transfer. The shape and size of coils can directly influence PTE and PDL [5,6,7,8]. However, studies on coil design, especially the direct relationship between coil parameters and PTE and PDL, are lacking. In addition, constraint conditions for the coil dimension are seldom considered [9]. All the above factors make rapid and scientific coil design hard to realize. Therefore, new methods need to be pursued to design resonant coils in actual applications.
Some design methods for coils in the WPT system have been proposed. Generally speaking, common design methods of coils aim to maximize the quality factor and coupling coefficient. For instance, Sun et al. acquired the optimal radius of coil by maximizing the integral of the magnetic field strength within a certain transfer distance [10]. However, they only discussed the radius and set a point on the axis as the observation point, which excessively simplified the power transfer model. Tang et al. discovered that the uniformity of the magnetic field between coils was positively correlated with the stability of the coupling coefficient and output [11]. Because the quality factor and coupling coefficient are determined by coil parameters, other methods are still needed to calculate the coil parameters in order to confirm whether the system meets transmission objectives. Specifically speaking, calculation methods are mainly mathematical models of mutual inductance and self-inductance. Raju et al. built a mutual inductance model by solving Neumann’s integral. Then, they calculated the mutual inductance of coils under various lateral displacements [12]. However, the PTE and PDL were outside of the scope of their research. Luo and Wei regionally modeled mutual inductance and self-inductance by applying Fourier–Bessel transformation and dual Fourier transformation. The method mainly involved parameters like line spacing (the distance between each turn) and the magnetic substrate [13]. Shi et al. established the mutual inductance and self-inductance model via the Biot–Savart law and then completed model validation of coil models in different transfer distances [14]. Joy et al. further validated the model in the cases of lateral and angular misalignments [15]. However, they did not explore the influence of coil parameters on PTE and PDL. Zeng et al. summarized the major design methods of coils in recent years. They discovered that although many studies have introduced multiple design methods of coil, systematic analysis and integrated theory for the influence of parameters like the coil dimension and resistance on PTE and PDL had not yet been given [16].
In this study, the theoretical derivation began with the current of the primary side, and the mutual inductance was derived through magnetic flux and modeled as a function of the dimensions and position of the coils. Then, a direct relationship between the coil parameters and PTE and PDL was deduced to realize the coil design. This method establishes a mathematic relationship between PTE and PDL and coil parameters in the view of the magnetic field. It realizes the coil design according to actual design demands and omits the optimization of the mutual inductance. The rest of the paper is structured as follows. In Section 2, the magnetic field analysis model of coils is established based on the principle of power transfer. The PTE and PDL calculation model is gained sequentially via the Simpson quadrature. In Section 3, the curves of PTE and PDL are explored using numerical calculation according to the design demands. Furthermore, the influence of coil dimension on PTE and PDL is analyzed. Then, the design of the coils is outlined. In Section 4, the experimental platform is built. By experimenting coil models within the same constraints, the actual curves of PTE and PDL are acquired. To validate the accuracy of the proposed model and the effect of the designed coils, results from the experiment and numerical calculation are compared. Moreover, a comparison is made with results from finite element analysis (FEA) to prove that the proposed method can design coils in an accurate and rapid way.

2. The PTE and PDL Calculation Model

2.1. The MCR-WPT System Model

The series–series (SS) topological MCR-WPT system is shown in Figure 1. The system uses cylindrical spiral coils, which are more complex in the computation of spatial magnetic flux.
In Figure 1, u1 is the input voltage of the primary side; RL indicates the purely resistive load; i1 and i2 are the currents; R1 and R2 signify the equivalent series resistances (ESRs) of coils; L1 and L2 are the self-inductances of coils. The coils have two main parameters including turns and radius. N1 and N2 represent the turns per coil; r1 and r2 are the radii of coils. The subscripts 1 and 2 represent parameters of the primary side and secondary side, respectively. ϕ12 is the magnetic flux through the transmitting coil produced by i2, which produces the induced voltage u12. ϕ21 is the magnetic flux through the receiving coil produced by i1, which produces the induced voltage u2. To simply describe the proposed method, the follow-up analysis is made under the preconditions of N1 = N2 = N, r1 = r2 = r, and R1 = R2 = R.
The wavelength of the electromagnetic wave in the spatial magnetic field of the WPT system is much larger than the transfer distance. It meets analytic conditions of the near-zone field and magnetoquasistatic field. The model can ignore the effect of the time-varying electric field. The magnetic field of the model can be approximately considered to be caused by a time-varying current.
The mathematical relationship between electrical parameters of the system and the magnetic flux of coils according to Faraday’s law of electromagnetic induction is shown as Equation (1) when the MCR-WPT system is on a resonant state. Because coils operate at kHz and MHz, the radiative resistance can be ignored [17,18]. The ohmic resistance RΩ is considered as the main source of power dissipation of the coils. The formula is expressed as Equation (2) with the resonant angular frequency ω, vacuum permeability μ0, radius of the wire a, and conductivity of the wire σ [17,19,20].
{ u 1 = i 1 R 1 + u 12 = i 1 R 1 N d ϕ 12 d t u 2 = N d ϕ 21 d t i 2 = u 2 R 2 + R L
R R Ω = ω μ 0 2 σ N r a

2.2. The PTE and PDL Calculation Model Applying Simpson Quadrature

Flat spiral coils are equivalent to a series of concentric circles [21], and cylindrical spiral coils can also be equivalent to a series of equally superposed circular coils. The relative error of the induced voltage between the coil and the equivalent coils at the middle cross section is within 5% according to the preliminary finite element simulation. Furthermore, for high-power MCR-WPT systems, a << r. Therefore, for the convenience of calculation, the spiral coil is simplified into N closely arranged single-turn coils with the same current.
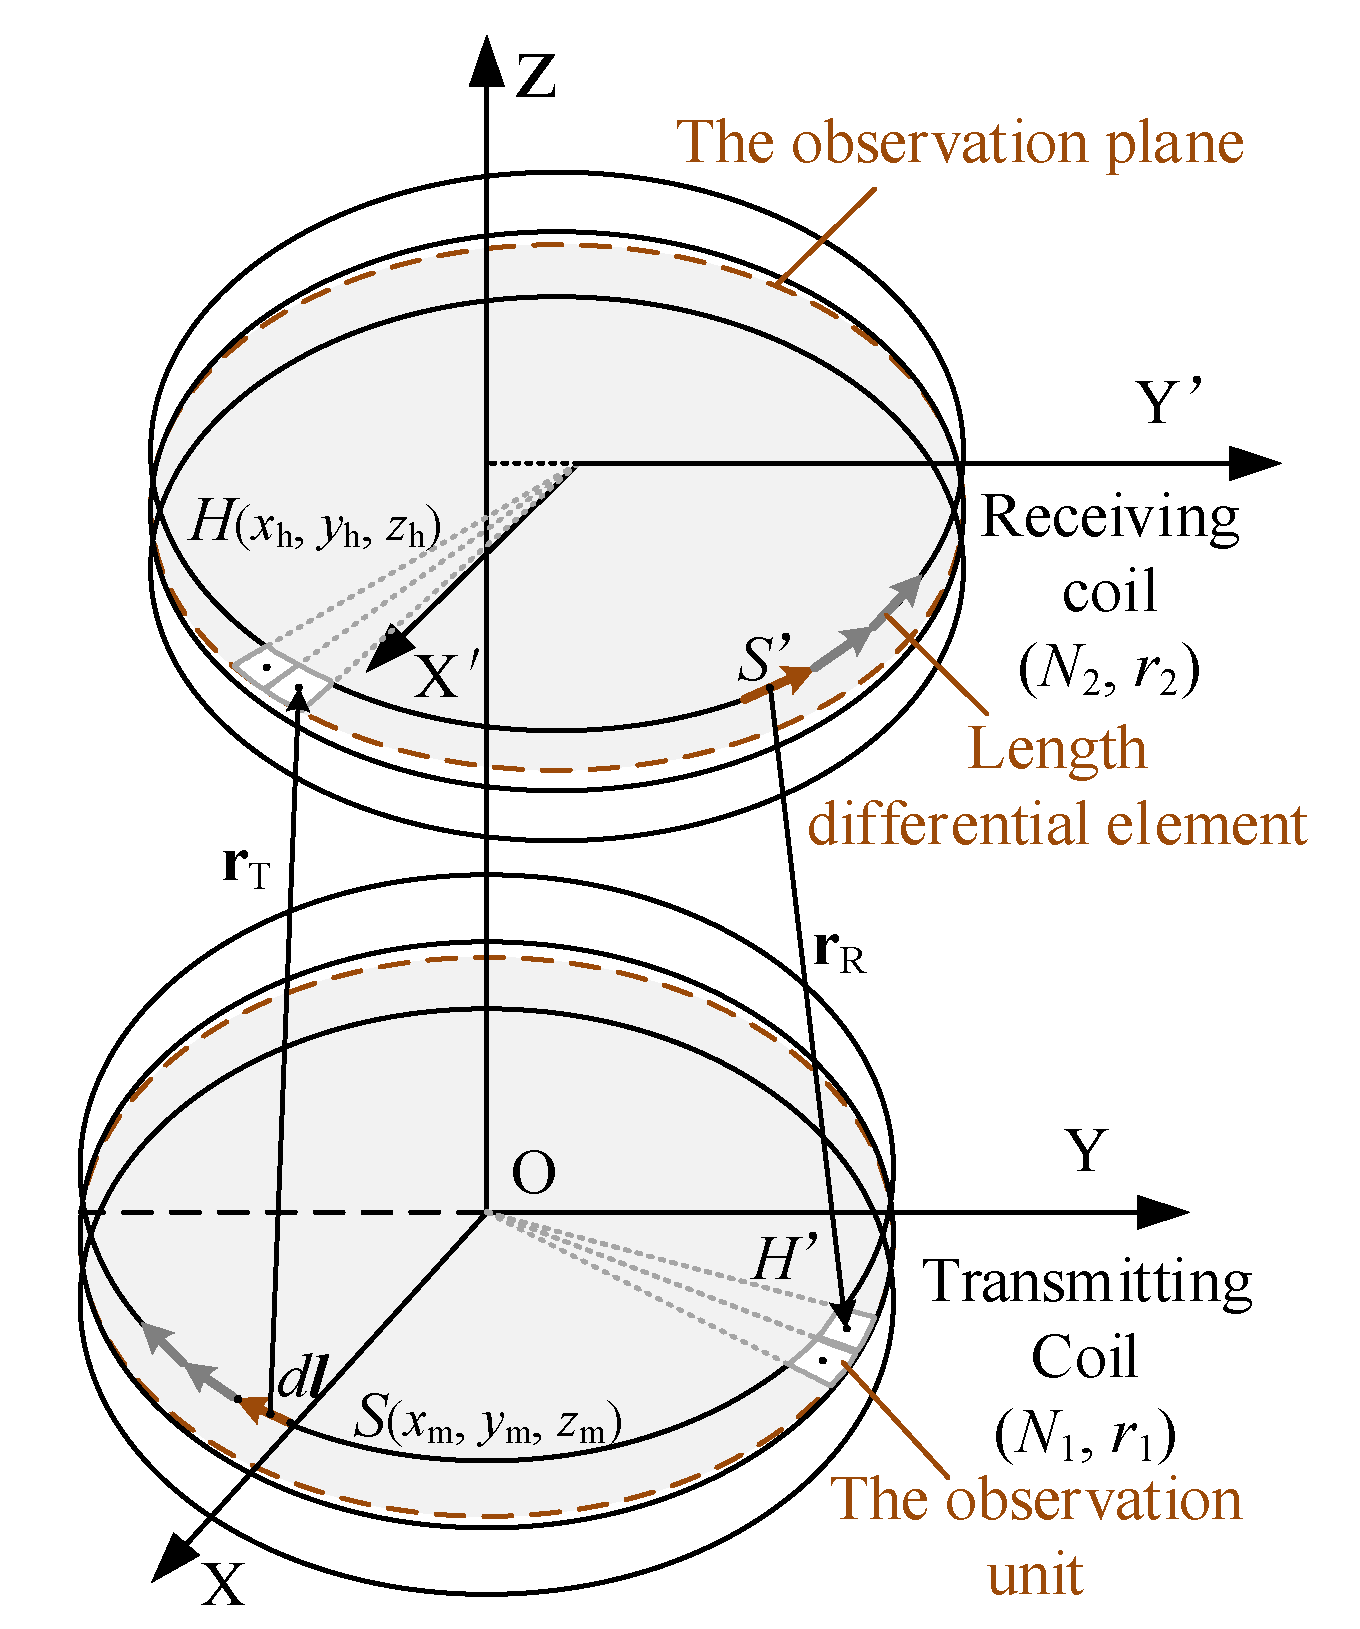
First, the magnetic field analysis model of cylindrical spiral coils is established under the condition of magnetoquasistatic field, as shown in Figure 2. The Z axis is perpendicular to the cross section of the exciting coil. The origin of the coordinate system is the center of the exciting coil’s middle cross section. In addition, the middle cross section of the exciting coil is the plane XOY, and the other coil’s middle cross section is the observation plane.
To calculate u2, the transmitting coil is set as the exciting coil. Each turn of the exciting coil is divided into Nh segments. The coordinates of the starting point, ending point, and midpoint in the j-th turn and i-th segment of the exciting coil are denoted as ( x T j i 1 , y T j i 1 , z T j i 1 ) , ( x T j i 2 , y T j i 2 , z T j i 2 ) and ( x m , y m , z m ) respectively.
Then, the observation plane is the middle cross section of the receiving coil. The observation plane is divided into numerous observation units, that is, annular sectors. When the observation units are small enough, the magnetic field inside each observation unit at any time can be approximated to a uniform magnetic field. Then, any point close to the center of a discrete unit can be chosen as the equivalent point of the unit’s magnetic flux density. The magnetic flux density B at the equivalent point can represent B inside the corresponding observation unit. The total accumulation of the magnetic flux from each observation unit is fairly close to the real magnetic flux of the entire observation plane.
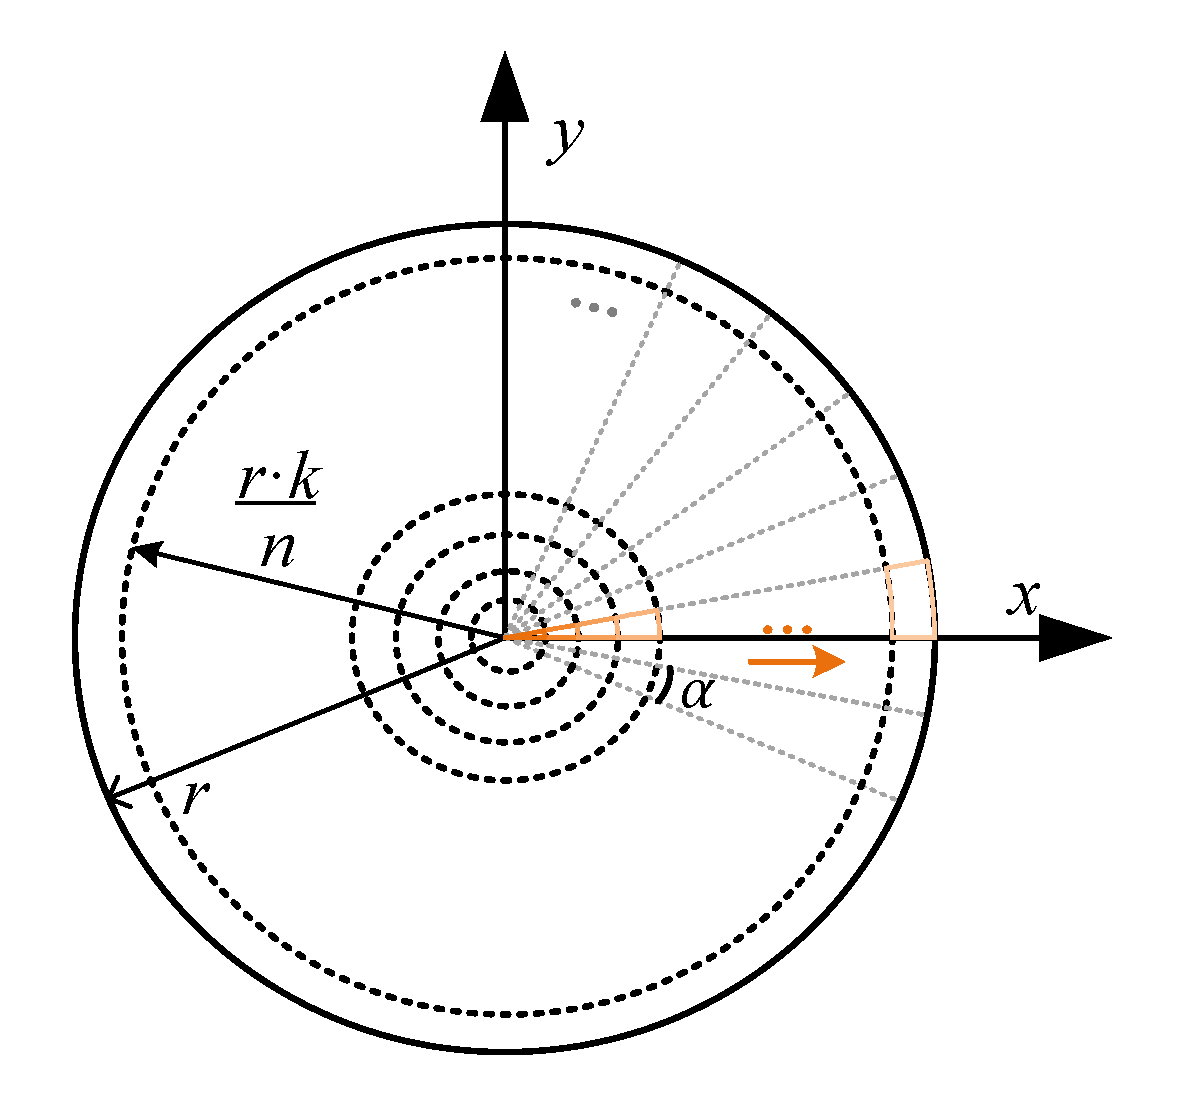
The division of the observation plane is shown in Figure 3. The radius r is uniformly divided into n segments. With the origin of axes as the center and r·k/n as the radius, n concentric circles are formed, in which k = 1, 2, 3, …, 2n−1. The concentric circles are shown in black dotted lines in Figure 3. Meanwhile, the full angle is also uniformly divided into s parts. Then, each part owns the same angle α with the value of 2π/s. The dividing lines are shown in dotted gray lines in Figure 3. The areas divided by the concentric circles and dividing lines are observation units. The units are shown in orange shades in Figure 3. Besides, the equivalent point of the h-th (h = 1, 2, …, m) observation unit is recorded as H (xh, yh, zh), where m is the total amount of observation units.
Second, the current i1 = I1msin(ωt + φ1) is regarded as the excitation. The magnetic flux density B at the center H caused by the current i1 is analyzed as follows.
The induced voltage originates from the variation over time of the magnetic flux density in Z-axis. That is, the component perpendicular to the observation plane takes effect. Hence, according to Biot-Savart Law and line integral, the Z-axis component of the B at an equivalent point caused by the j-th turn and i-th segment of the exciting coil can be deduced as B z h j i = μ 0 i 1 4 π L d l × r T | e z r T 3 . The rT is the directed line segment from the source to the field point H. Then, d l × r T | e z = d l x ( y h y ) d l y ( x h x ) .
To calculate numerical integral with a higher accuracy, the integral interval is equally divided into several segments, and the Simpson quadrature is used in each subinterval, which is the compound Simpson quadrature [22]. Applying compound Simpson quadrature, the starting point, midpoint, and ending point of the i-th subinterval are substituted into the equation of the B z h j i . The corresponding integral parts after substituting the coordinates are recorded as f(i), f(i+0.5), and f(i+1), respectively. The Equation is shown as (3).
B z h j i μ 0 r i 1 12 N h ( f ( i ) + 4 f ( i + 0.5 ) + f ( i + 1 ) )
where:
f ( i ) = ( x T j i 2 x T j i 1 ) ( y h y T j i 1 ) ( y T j i 2 y T j i 1 ) ( x h x T j i 1 ) ( ( x h x T j i 1 ) 2 + ( y h y T j i 1 ) 2 + ( z h z T j i 1 ) 2 ) 3 2 f ( i + 0.5 ) = ( x T j i 2 x T j i 1 ) ( y h y m ) ( y T j i 2 y T j i 1 ) ( x h x m ) ( ( x h x m ) 2 + ( y h y m ) 2 + ( z h z m ) 2 ) 3 2 f ( i + 1 ) = ( x T j i 2 x T j i 1 ) ( y h y T j i 2 ) ( y T j i 2 y T j i 1 ) ( x h x T j i 2 ) ( ( x h x T j i 2 ) 2 + ( y h y T j i 2 ) 2 + ( z h z T j i 2 ) 2 ) 3 2
The same calculation is conducted for the remaining Nh-1 subintervals of this turn. And the Z-axis component of the magnetic flux density B at the point H caused by the j-th turn of the coil is:
B z h j ( x h , y h ) = μ 0 r i 1 12 N h i = 1 N h ( f ( i ) + 4 f ( i + 0.5 ) + f ( i + 1 ) )
Then the Z-axis component of B from N single-turn coils at the point H is B z h ( x h , y h ) = N B z h j ( x h , y h ) And the magnetic flux of the observation plane is ϕ R T = D B z h ( x h , y h ) d σ = 0 r 0 2 π B z h ( r cos θ h , r sin θ h ) d θ r d r through surface integral.
However, the above integral is hard to gain through elementary functions. To increase the computational efficiency, the observation plane is discretized according to the division shown in Figure 3. When observation units are small enough, ϕRT is approximately expressed as Equation (5).
ϕ R T = b 2 = 1 n b 1 = 1 s B z h ( x h , y h ) α r 2 ( 2 b 2 1 ) 2 n 2 , h = b 1 + b 2 s
According to the definition of mutual inductance, the mutual inductance M of coils can be derived by RT = Mi1. And M is a function of coils’ dimensions and position which is shown in Equation (6).
M = μ 0 r 3 α N 24 n 2 N h b 2 = 1 n b 1 = 1 s i = 1 N h ( 2 b 2 1 ) ( f ( i ) + 4 f ( i + 0.5 ) + f ( i + 1 ) )
Sequentially, u2 and i2 are derived according to the model of the system in Equation (1) with ϕRTϕ21. Then using mutual inductance, the induced voltage u12 can be deduced through u12 = Md(−i2)/dt.
Then, the relationship between PTE and PDL and coil parameters (N, r) is derived, as shown in Equation (7).
{ P i n = I 1 m 2 2 ( R Ω + ω 2 M 2 R L + R Ω ) P o u t = R L 2 ( ω M I 1 m R L + R Ω ) 2 η = ω 2 M 2 R L R Ω ( R L + R Ω ) 2 + ω 2 M 2 ( R L + R Ω )
So far, the PTE and PDL calculation model of the MCR-WPT system has been achieved. The relationship between PTE and PDL and parameters like turns N and radius r can be achieved via numerical calculation. Because the independent variables are coil parameters (N, r), the design range of parameters can be directly defined. Thus, according to the design objectives, such as PTE optimization, PDL optimization, and PTE and PDL product optimization, or specific PTE and PDL requirements, the optimal coil parameters under dimension constraints can be determined.

3. Design of Resonant Coils

3.1. Design Demands

Due to numerous parameters of the MCR-WPT system, we used a set of fixed values for all system parameters, except the coil parameters, as shown in Table 1. According to the practical design requirements of another subject (an ultrasonic generator), the operating frequency f was set as 32.47 kHz.
The detailed design demands were as follows. Transmission objectives: PDL needs to be 300–350 W and PTE is above 80%. Dimension constraints: the coil diameter is 20–40 cm and the height is 50–75 mm.
According to the dimension constraints, the ranges of radius and turns were 10–20 cm and 14–20 cm, respectively. The following numerical calculation was based on the above parameters and constraints.

3.2. Hyperparameters Setting of the PTE and PDL Calculation Model

In order to increase computational efficiency of the method, the optimal values of three hyperparameters, namely, Nh, n, and s, were determined through numerical calculation. Nh is the number of dividing segments of the exciting coil, and n and s are the number of dividing segments of the radius and full angle, respectively. Three resonant coil models with (N, r) of (16, 16 cm), (22, 16 cm) and (16, 18 cm) were randomly selected as analytic objects. The following analysis was based on the coil model of (16, 16 cm). The analytic results based on the coil models of (22, 16 cm) and (16, 18 cm) were the same.
Because the influence on the calculated results of the value of hyperparameter Nh and hyperparameters n and s are independent, their optimal values were explored separately.
When the coils were coaxial, the calculated values of PTE and PDL remained unchanged when only the value of s varied. Figure 4a shows the calculated values of PTE and PDL when n varied in the range 2–20. With the increase of n, the calculated values of PTE and PDL tended to become gradually stable. Therefore, considering the accuracy of the calculated values and the computing time, n was set as 10 and s was set as 1. Figure 4b shows calculated values of PTE and PDL when Nh varied in the range 0–600 and n = 10, s = 1. The variation of Nh in 75–600 results had little influence on PTE and PDL. Therefore, considering computing accuracy, Nh was set as 400. The computing time was about 0.78 s when the algorithm took these hyperparameters and operated on the computer with CPU Intel(R) Core(TM) i5-7400 @3.00 GHz, RAM 8 GB (Intel Corporation, Portland, Oregon, USA). The annotations in Figure 4a are the mean and standard deviation of the calculated results when n varied in the range 6–20.
Figure 4c,d shows the calculated values of PTE and PDL on different n and s when the coils were noncoaxial. Similarly, the calculated values of PTE and PDL tended to become stable as n increased. The variation of Nh in the range 0–600 also had little influence on PTE and PDL. However, considering the computing time, the values of n and Nh were set as 10 and 75, respectively. As for the value of s, it was set as 1500 considering the accuracy of the calculated results. The error between the PDL when s = 1500 and s = 2000 was only 0.87 W, while the error between PTE was 0.04%. The computing time is shown in Figure 4e. The computing time was about 121.89 s when n = 10, Nh = 75, s = 1500 and operated on the mentioned CPU and RAM.

3.3. Model Verification and Resonant Coil Design

3.3.1. Model Verification

In order to verify the accuracy of the proposed method, results from the proposed model and FEA were compared. Additionally, a noncoaxial situation was considered to illustrate the universality of the method. The noncoaxial situation here refers to the radial offset.
The comparison was conducted considering coaxial coils. The results from FEA needed to obtain mutual inductance through 3D finite element simulation, and the PDL and PTE could then be calculated based on the Kirchhoff voltage laws. The equations of PDL and PTE with respect to M are shown as Equation (8) [21], where U1 is the root mean square (RMS) value of u1 and U1 = 0.9U1, dc. The 3D finite element simulation and the PTE and PDL calculation model were based on the same coil models and the same parameters of the system as f and u1. The solution type of the simulation was eddy current. The simulation took nearly 3 h in modeling and model solving. The PTE and PDL calculation model set the RMS value of the full-bridge inverter output voltage U1 = 0.9U1, dc as the given value.
P o u t = U 1 2 ( ω M ) 2 R L [ R Ω ( R Ω + R L ) + ( ω M ) 2 ] 2 η = ( ω M ) 2 R L ( R Ω + R L ) [ R Ω ( R Ω + R L ) + ( ω M ) 2 ]
The partial key data of two methods are shown in Table 2, while the complete results are shown in Figure 5. When results from FEA were treated as true values, the maximum relative errors of PDL and PTE were 9.40% and 3.68%, respectively. The relative average deviations (RADs), which are the average values of relative deviations in the same set, were lower than 3% and 1%, respectively. In addition, the variational trend of PDL from the two methods above was alike, as well as that of PTE, as shown in Figure 5. With the increase of radius and turns, the PDL dropped, the PTE increased, and curves tended to become gradually constant. Therefore, the quantitative relationship between PDL and PTE and coil parameters could be rapidly acquired via the proposed model with relatively high accuracy.
In addition, the method relating to mutual inductance evaluation proposed in Ref. [23] was compared with the proposed method. The method in Ref. [23] is based on the numerical form of the Neumann formula. The calculated results of mutual inductance M through FEA, the method in Ref. [23], and the proposed method are shown in Table 3. The coils were divided into 400 segments in the method in Ref. [23] and the proposed method. The symbol MN is the calculated results of M using the method in Ref. [23]. The symbol εr-MN is the relative error between MN and MFEA. It can be seen from the relative error that the proposed method is more accurate for most coil models.
When the coil model has a radial offset, the proposed model is also applicable. If the receiving coil has a radial offset along the x axis, the proposed model can also be conducted just by adding the deviation to the original x coordinate of the point H.
The coil with the parameters of N = 16, r = 16 cm was taken as an example. The offset was set as 0, 1 cm, 3 cm, and 5 cm. The key data and the comparison between the numerical and experimental results are both shown in Table 4.

3.3.2. Resonant Coils Design

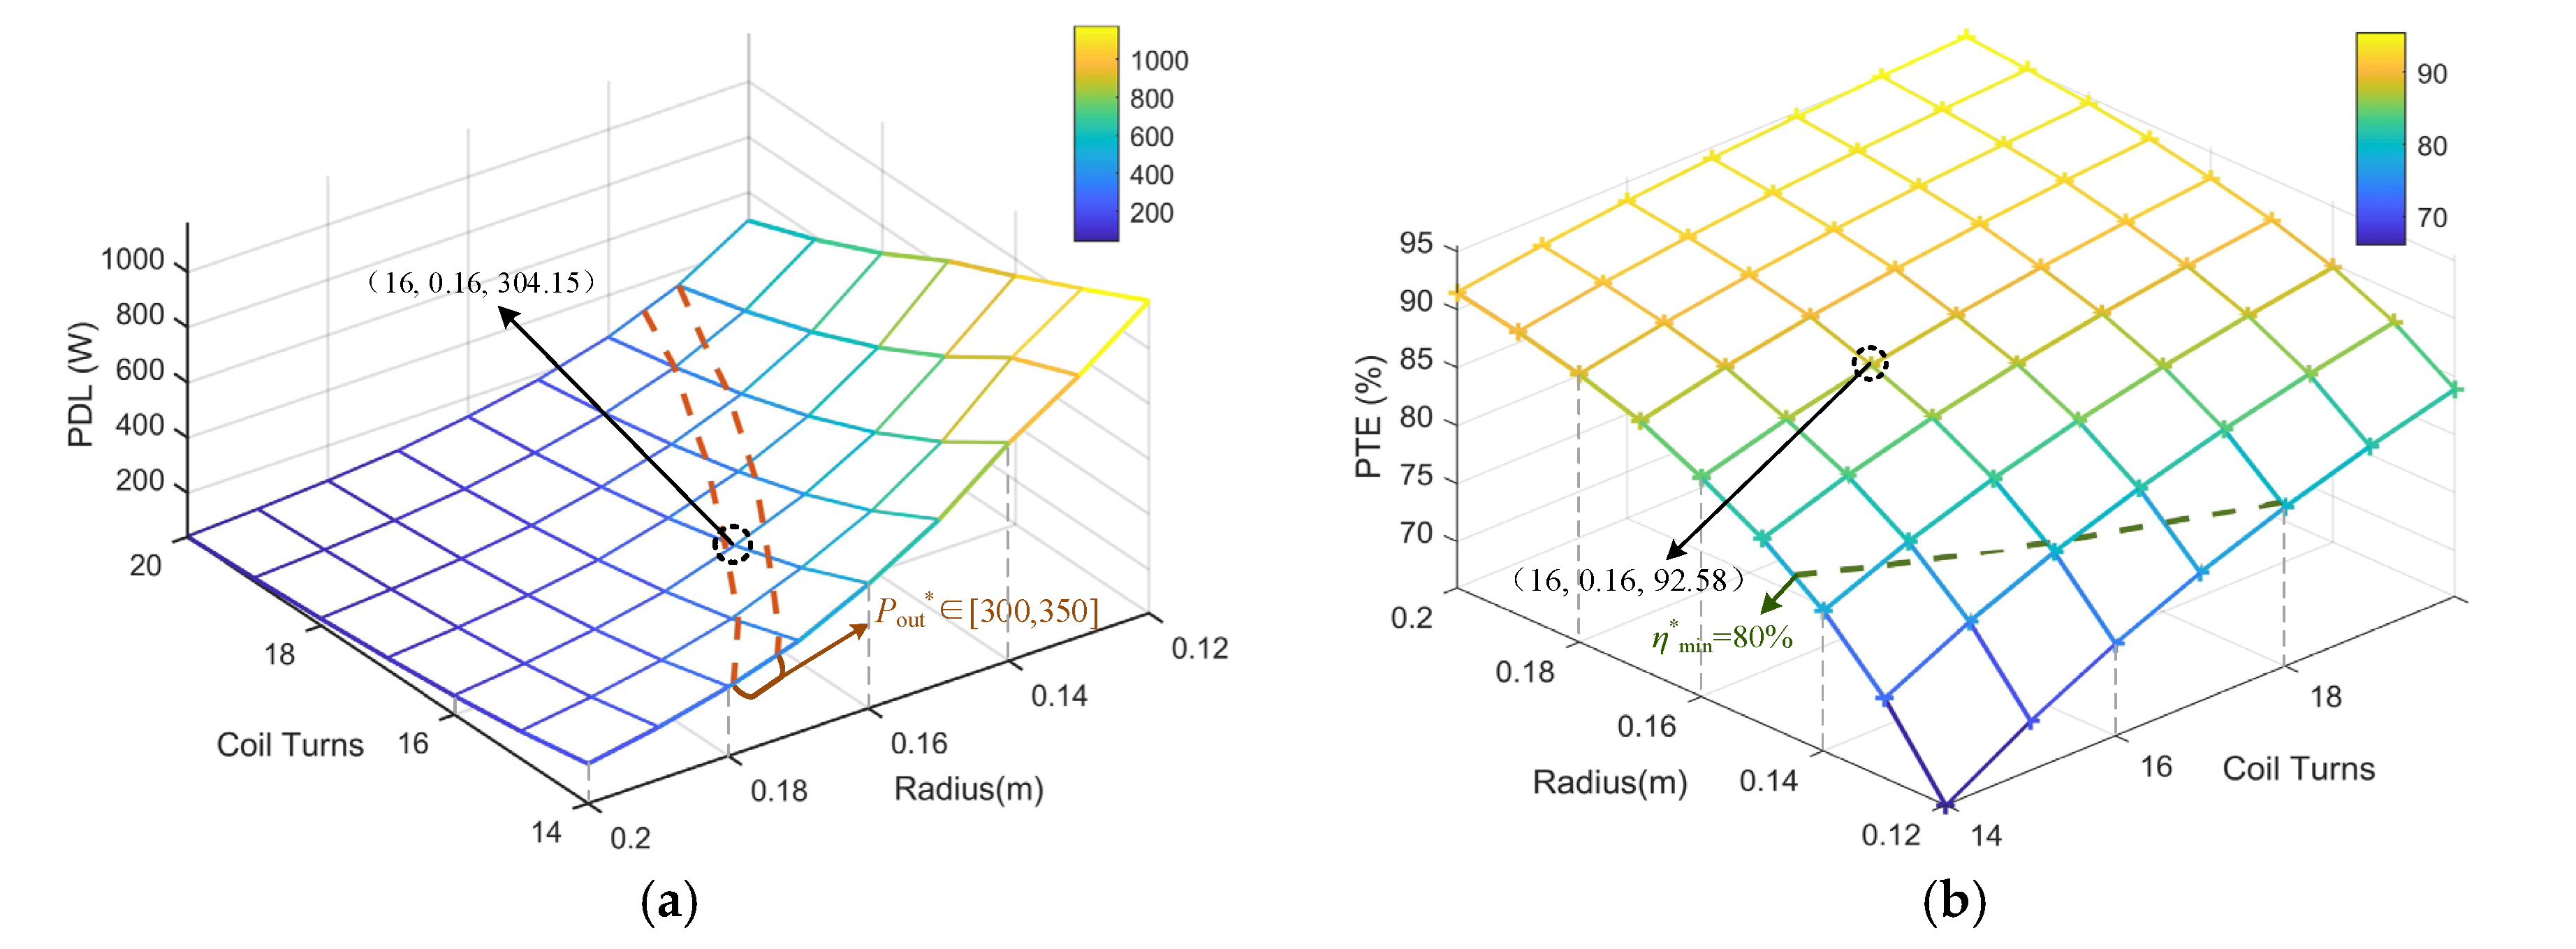
The numerical calculation was conducted according to the design demands. The numerical results are shown in Figure 6, where the red dashed lines are the lower and upper limits of the PDL target Pout*, while the green one is the lower limit of PTE target ƞ*. Due to the existence of the wire loss, PTE was considered with a margin. Then, the parameters were determined as N = 16 and r = 16 cm considering PDL, the coil dimension, material consumption for coil winding, and difficulty of coil winding. Note that other coil parameters (N, r) whose numerical results satisfies the design demands can also be selected. The designed coils are verified in Figure 5, where the critical values of PTE and PDL are marked with annotations of Pout*, ƞ* and dotted lines, respectively. This proves that the design of resonant coils can be realized according to the design demands. The quantitative relationship can also be acquired by the PDL and PTE calculation model, thus verifying the credibility of the proposed method.

4. Model Validation and Result Analysis

4.1. Experimental Method

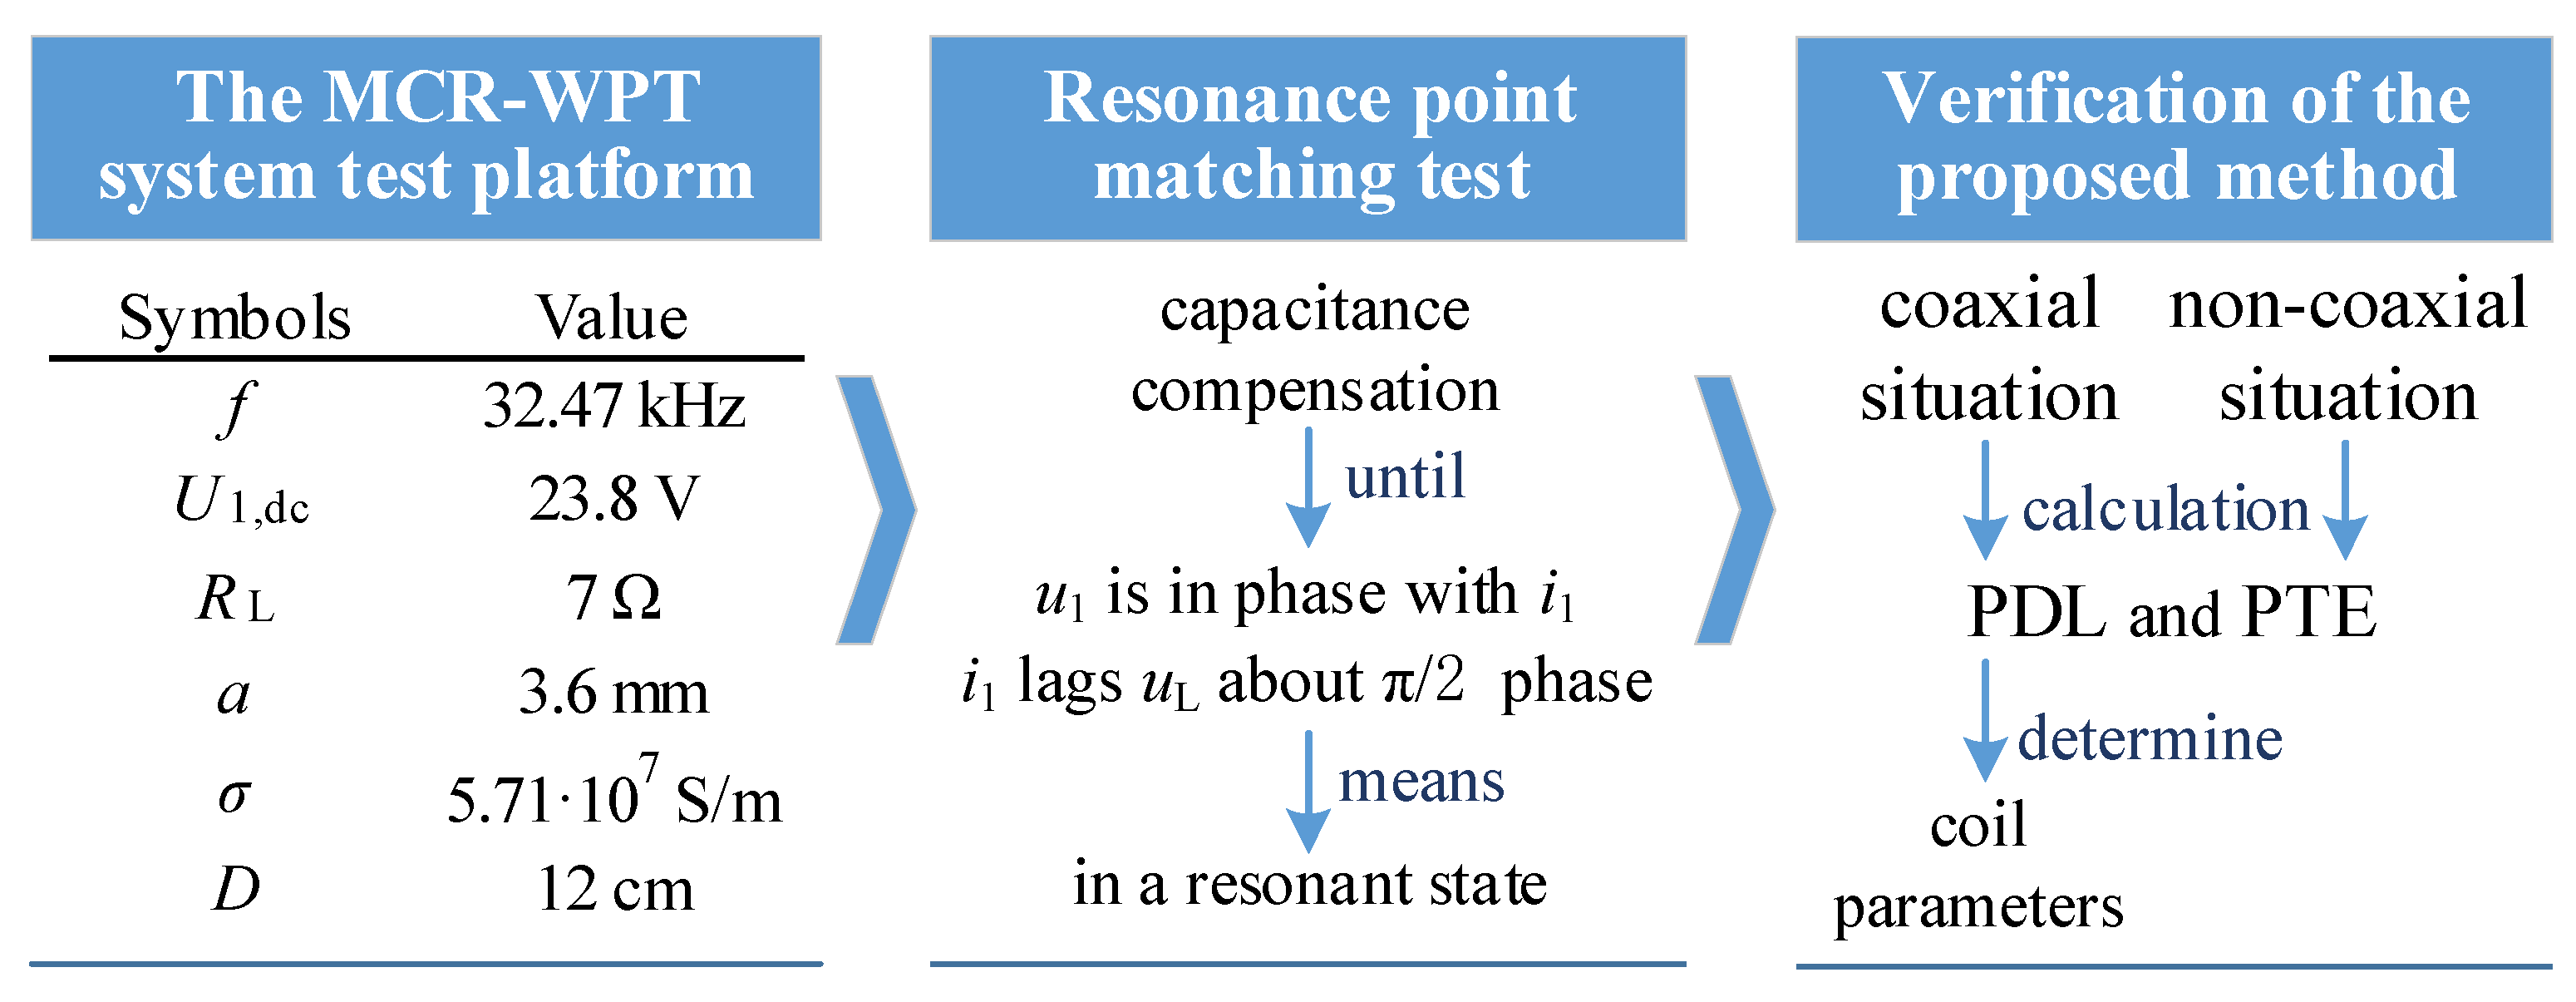
The main purpose of this section is to verify the credibility of the proposed method and the influence of coil parameters on PDL and PTE gained in the numerical calculation. Taking the same system parameters as Table 1, an experimental platform of MCR-WPT system was built. Furthermore, it was ensured that the parameters of the spiral coils met the dimension constraints. Before model validation, the resonant point was matched first to guarantee normal power transfer of the system. Then, the influence of coil radius r and turns N on PDL and PTE was explored under this frequency. The coil could then be designed based on the results. The noncoaxial situation was also explored. The flow chart is shown in Figure 7.

4.2. The Experimental Platform of MCR-WPT System

The experimental platform of SS topological MCR-WPT system built as per Figure 1 is presented in Figure 8. The full-bridge inverter module consisted of IGBT half-bridge module FF100R12KS4 (Infineon, Munich, Germany), which could realize the operating frequency f = 32.47 kHz. Coils were winded by Litz wire to reduce the skin effect [24]. The wires were all compactly winded to reduce the influence of distributed capacitance between turns and conform to the magnetic field analysis model of coils. We used plastic material for both coil formers and supporting frames to minimize the influence of the platform on magnetic field distribution. A long straight ruler supported two coils to make it convenient to measure the distance. The resistance and inductance of the circuits were measured by AGILENT 4294A (Agilent Technologies Inc., Santa Clara, California, USA) impedance analyzer to select the most suitable compensating capacitor. Its basic impedance accuracy reaches ±0.08%. The operating frequency of Pearson 4100 (Pearson Electronics, Palo Alto, California, USA) current probe when measuring current is 140 Hz–35 MHz and its sensitivity can reach 1V/A+1/−0%. TEKTRONIX TBS1104 (Tektronix, Portland, Oregon, USA) digital storage oscilloscope has 8-digit vertical resolution and ±3% DC gain accuracy. Its sample rate on each channel can reach 1 GS/s. The limit of the bandwidth is 20 MHz, and it is compatible with the chosen current probe. Thus, it was selected to sample the voltage and signals of the current probe.

4.3. Resonant Point Matching

By matching the resonant capacitance, the precondition that both sides are in a resonant state was satisfied. After both sides met the resonant condition, the follow-up model validation was conducted.
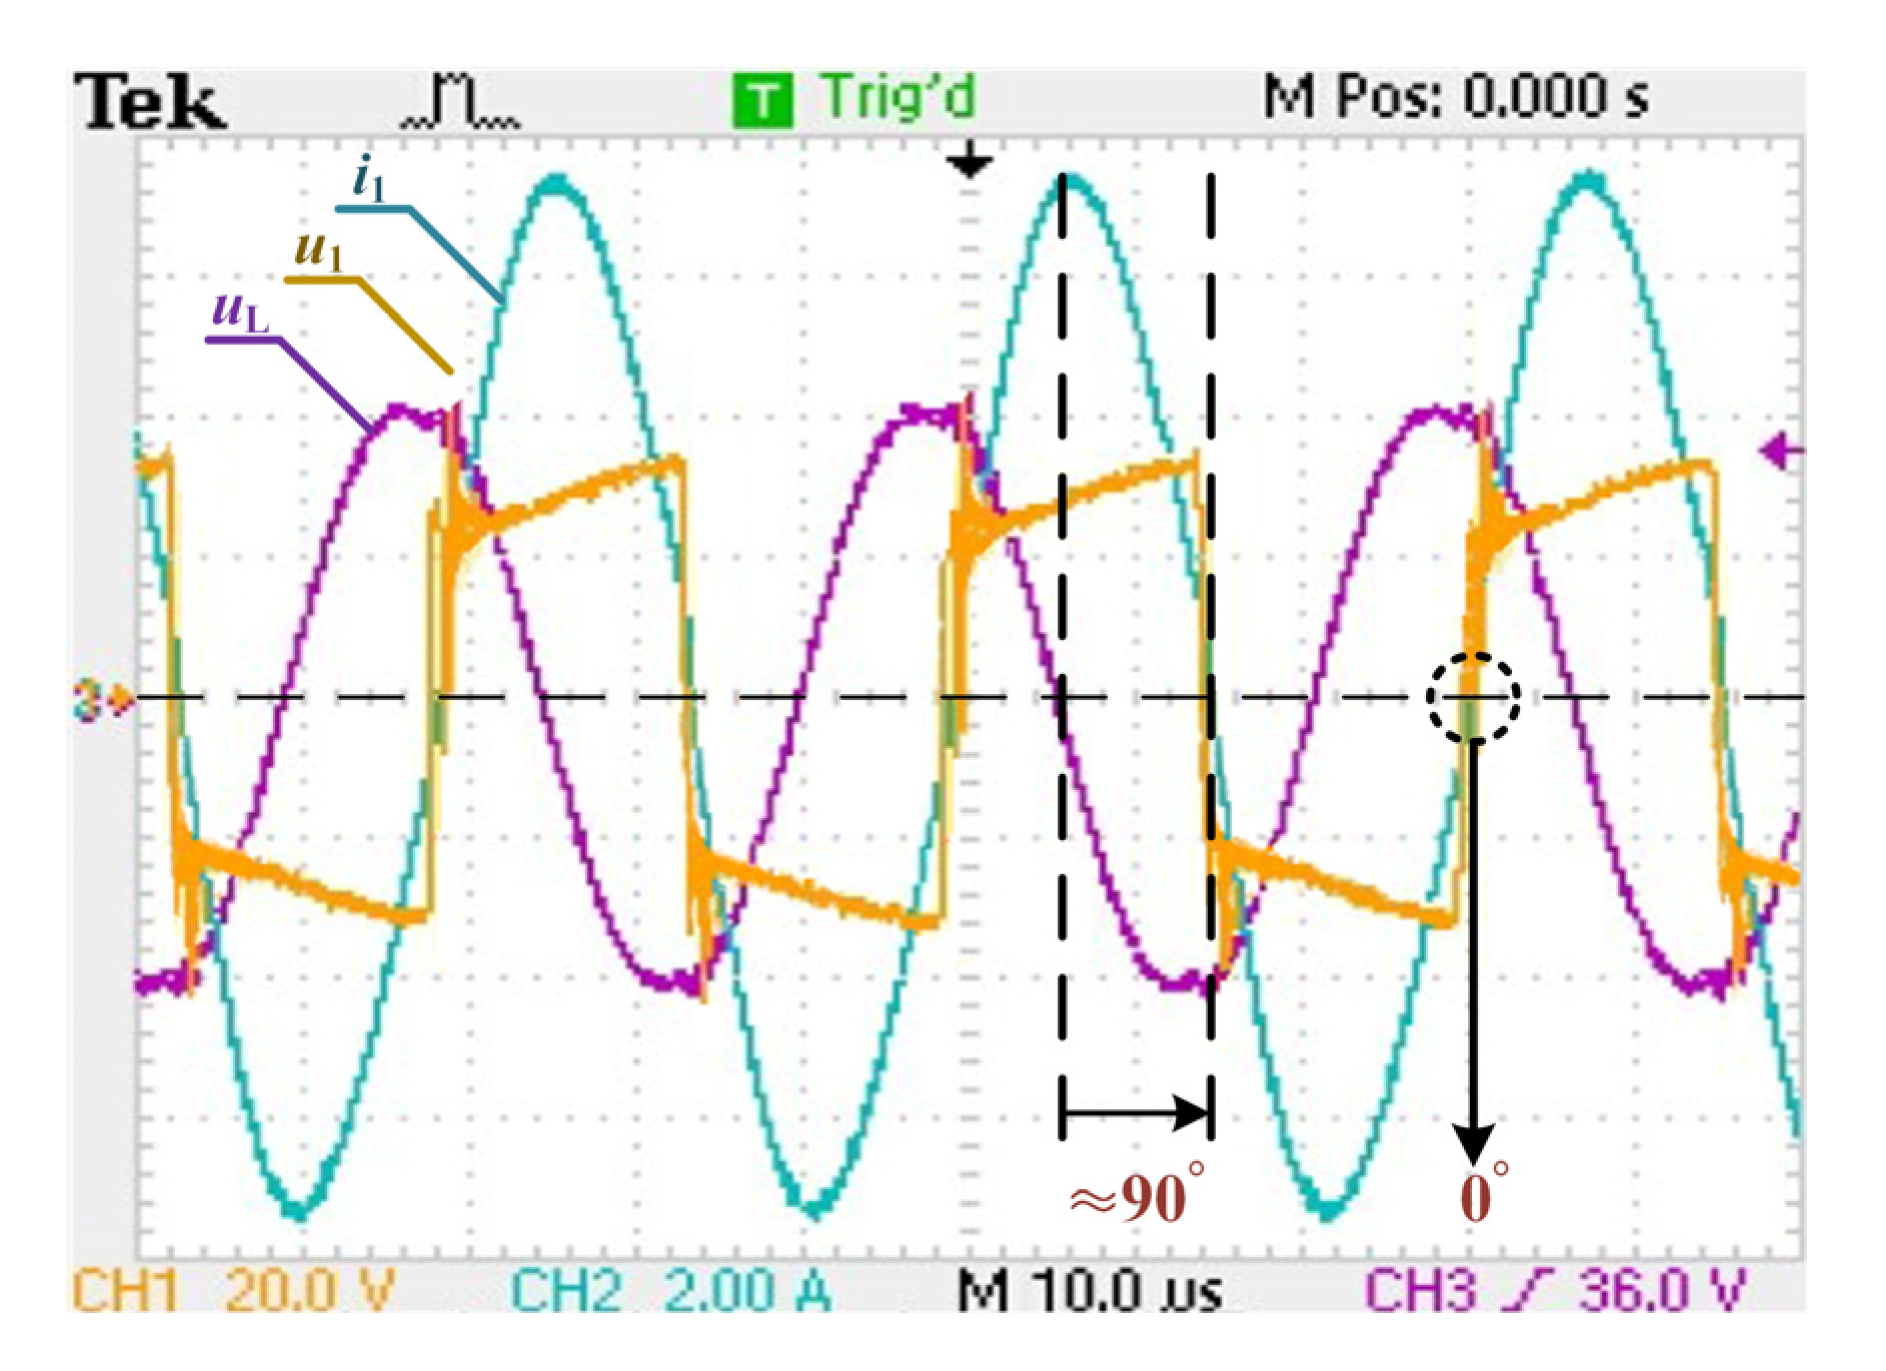
The coil model with r = 16 cm and N = 12 was taken as an example. The capacitor with a suitable capacitance was selected for the compensation till the waveforms of u1, i1 and voltage uL across the load reached the states shown in Figure 9. At this time, u1 and i1 were in phase, and i1 lagged behind uL for about π/2. The phase relationship between i1 and u2 met the theoretical derivation. Therefore, both sides were considered to reach the resonant state.

4.4. Result Analysis

The results in the coaxial situation was analyzed first. Keeping turns N = 16 unchanged and taking several values between 12.5 cm and 20 cm as the coil radii, the coil models were formed. The voltage U1,dc was kept constant. After the power stably transferred, the primary side current I1, inverter output voltage U1, and load voltage UL were measured to calculate the PTE and PDL. The above data points were compared with the numerical results listed in Table 2, as shown in Table 4. The fitted curves are shown in Figure 10a.
Then, keeping the coil radius r = 16 cm unchanged and taking integers in 14 and 20 as coil turns, the same experiment and measurements were conducted. The comparison is shown in Figure 10b.
“-■-”, “--”, and “-○-” represent the fitted curves of PTE gained through the experiment, the PTE and PDL calculation model, and FEA respectively, while “-★-”, “--”, and “-▲-” represent fitted curves of PDL through the above three approaches, respectively.
According to Figure 10, the following results were analyzed.

4.4.1. PDL

Variational trends of PDL curves from the experiment and numerical calculation based on the proposed model showed a strong positive correlation, and the numerical values were close. The Pearson’s correlation coefficient (PCC) can describe the level of similarity between two vectors. The value of PCC in the range 0.8–1 means two vectors present a strong positive correlation. The curve can also be expressed as a vector, which is formed by the data points on the curve. For the PDL curves gained through the experiment and numerical calculation, the PCCs of curves over r and N were 0.993 and 0.996, respectively, while the RADs were 6.11% and 2.17%, respectively. As for the PDL curves gained through the experiment and FEA, the PCCs of curves over r and N were 0.987 and 0.985, respectively, while the RADs were 14.33% and 6.46%, respectively. However, when the PDL data within 12 cm and 14 cm of radius were excluded from the RAD calculation, the RAD between PDL curves over r gained through the experiment and numerical calculation was only 3.57%. The larger deviation in this range might have resulted from two reasons, namely, the larger leakage magnetic flux [25] and the larger ratio of circuital resistance in the input resistance. Because the circuital resistance excluding the ESR of the coil was not calculated in the derivation, the larger ratio of circuital resistance made the deviation of the value of i1 larger. This led to a further considerable effect on the value of i2 and PDL.

4.4.2. PTE

Variational trends of PTE curves from the experiment and numerical calculation based on the proposed method also showed a strong positive correlation. However, possibly owing to the wire loss in the experiment, numerical values had a certain deviation, and error in the PDL numerical calculation made the deviation larger. The quantity mean ± standard deviation (mean ± SD) describes the dispersion degree of the deviation between curves. A lower dispersion degree means the cause of the deviation is more likely to be always present in all coil models. For the PTE curves gained through the experiment and numerical calculation, the PCCs of curves over r and N were 0.987 and 0.994, respectively, while the mean ± SD of the deviation were 5.90 ± 2.18% and 4.03 ± 1.21%, respectively. As for the PTE curves gained through the experiment and FEA, the PCCs of curves over r and N were 0.980 and 0.998, respectively, while the mean ±SD of the deviation were 8.74 ± 3.48% and 4.63 ± 1.73%, respectively.

4.4.3. Actual Transmission Effect of the System with Designed Coils

For the design demands, the optimal coil parameters confirmed by the experiment were consistent with those confirmed by numerical calculation, that is, N = 16 and r = 16 cm. With this coil model, the PDL of the system reached 309.80 W and the PTE was about 88.51%, which was about 8% better than the target PTE.
Then, the results in the noncoaxial situation were analyzed. The parameters of the system were the same as those in Table 1. The coil parameters were N = 16 and r = 16 cm. The offset along the x axis was also set as 0, 1 cm, 3 cm, and 5 cm. The experimental results are listed in the Table 5. The values of the PDL were similar when the offset was within 3 cm. This was probably due to the system being close to the state of critical coupling. The values of PTE presented a continuous descent. The numerical and experimental results both had the same trend.
In summary, the variational trends of PTE and PDL curves from the proposed model had a strong correlation with those from the experiment, and the numerical values were also approximately the same as the calculated values from the experiment. The designed coils based on this relationship reached transmission objectives in the experiment. Additionally, the noncoaxial situation, which refers to the radial offset, could also be analyzed by the proposed method. The proposed method can therefore be applied to practical resonant coils design.

5. Conclusions

Based on the magnetic resonance principle of the MCR-WPT system, a magnetic field analysis model is proposed in this work. First, the PTE and PDL calculation model was obtained. The quantitative relationship between PTE and PDL and coil parameters was acquired through numerical calculation. Thus, the coil design could be realized according to the actual demands. Experiments proved that the designed coils reached the actual transmission objectives. The PTE and PDL calculation model could rapidly and accurately realize the design of resonant coils. The proposed method has credibility as well as strong universality for its possible application to other circuit topologies or coil structures like planar coils. It provides a theoretical basis for research on the effect of coil parameters on PTE and PDL. It also provides an idea for coil design under dimension constraints and practical engineering applications in MCR-WPT systems.

Author Contributions

Conceptualization, J.W.; methodology, C.S. and P.Z.; software, C.S., S.O., R.Z., and Z.S.; validation, C.S. and P.Z.; formal analysis, J.W.; investigation, S.O. and R.Z.; resources, Z.X. and Z.S.; data curation, S.O. and R.Z.; writing—original draft preparation, C.S.; writing—review and editing, J.W. and C.S.; visualization, Z.X.; supervision, C.S., P.Z., and Z.X. All authors have read and agreed to the published version of the manuscript.

Funding

This research was funded by the National Natural Science Foundations of China, grant number 51677009, and the Chongqing Natural Science Foundation, grant number cstc2019jsyj-yzysbAX0021.

Conflicts of Interest

The authors declare no conflict of interest.

References

  1. Zhao, Z.; Liu, F.; Chen, K. New Progress of Wireless Charging Technology for Electric Vehicles. Trans. China Electrotech. Soc. 2016, 31, 30–40. [Google Scholar]
  2. Sun, L.; Ma, D.; Tang, H. A review of recent trends in wireless power transfer technology and its applications in electric vehicle wireless charging. Renew. Sustain. Energy Rev. 2018, 91, 490–503. [Google Scholar] [CrossRef]
  3. Li, Y.; Xu, Q.; Lin, T.; Hu, J.; He, Z.; Mai, R. Analysis and Design of Load-Independent Output Current or Output Voltage of a Three-Coil Wireless Power Transfer System. IEEE Trans. Transp. Electrif. 2018, 4, 364–375. [Google Scholar] [CrossRef]
  4. Mizuno, K.; Shinohara, N.; Miyakoshi, J. In Vitro Evaluation of Genotoxic Effects under Magnetic Resonant Coupling Wireless Power Transfer. Int. J. Environ. Res. Public Health 2015, 12, 3853–3863. [Google Scholar] [CrossRef] [Green Version]
  5. Pratik, U.; Varghese, B.J.; Azad, A.; Pantic, Z. Optimum Design of Decoupled Concentric Coils for Operation in Double-Receiver Wireless Power Transfer Systems. IEEE J. Emerg. Sel. Top. Power Electron. 2019, 7, 1982–1998. [Google Scholar] [CrossRef]
  6. Arakawa, T.; Goguri, S.; Krogmeier, J.V.; Kruger, A.; Love, D.J.; Mudumbai, R.; Swabey, M.A. Optimizing Wireless Power Transfer From Multiple Transmit Coils. IEEE Access 2018, 6, 23828–23838. [Google Scholar] [CrossRef]
  7. Kim, T.-H.; Yun, G.-H.; Lee, W.Y.; Yook, J.-G. Asymmetric Coil Structures for Highly Efficient Wireless Power Transfer Systems. IEEE Trans. Microw. Theory Tech. 2018, 66, 3443–3451. [Google Scholar] [CrossRef]
  8. Li, S.; Liao, C.; Wang, L.; Guo, Y.; Zhu, Q. A review of the Impacts of Coil Design on System Efficiency ofWireless Power Transmission. Trans. China Electrotech. Soc. 2015, 30, 270–275. [Google Scholar]
  9. Liu, X.; Xia, C.; Yuan, X. Study of the Circular Flat Spiral Coil Structure Effect on Wireless Power Transfer System Performance. Energies 2018, 11, 2875. [Google Scholar] [CrossRef] [Green Version]
  10. Sun, T.; Xie, X.; Wang, Z. Wireless Power Antennas. In Wireless Power Transfer for Medical Microsystems; Sun, T., Xie, X., Wang, Z., Eds.; Springer: New York, NY, USA, 2013; pp. 41–85. [Google Scholar]
  11. Tang, S.C.; Lun, T.L.T.; Guo, Z.Y.; Kwok, K.W.; McDannold, N.J. Intermediate Range Wireless Power Transfer With Segmented Coil Transmitters for Implantable Heart Pumps. IEEE Trans. Power Electron. 2017, 32, 3844–3857. [Google Scholar] [CrossRef]
  12. Raju, S.; Wu, R.; Chan, M.; Yue, C.P. Modeling of Mutual Coupling Between Planar Inductors in Wireless Power Applications. IEEE Trans. Power Electron. 2014, 29, 481–490. [Google Scholar] [CrossRef]
  13. Luo, Z.; Wei, X. Analysis of Square and Circular Planar Spiral Coils in Wireless Power Transfer System for Electric Vehicles. IEEE Trans. Ind. Electron. 2018, 65, 331–341. [Google Scholar] [CrossRef]
  14. Shi, Z.H.; Chen, X.Y.; Qiu, Z.C. Modeling of Mutual Inductance Between Superconducting Pancake Coils Used in Wireless Power Transfer (WPT) Systems. IEEE Trans. Appl. Supercond. 2019, 29, 1–4. [Google Scholar] [CrossRef]
  15. Joy, E.R.; Dalal, A.; Kumar, P. Accurate Computation of Mutual Inductance of Two Air Core Square Coils with Lateral and Angular Misalignments in a Flat Planar Surface. IEEE Trans. Magn. 2013, 50, 1–9. [Google Scholar] [CrossRef]
  16. Zeng, Y.; Qiu, D.; Zhang, B. Review of Coil Designs for Magnetic Resonant Wireless Power Transfer System. J. Power Supply 2019, 17, 94–104. [Google Scholar]
  17. Karalis, A.; Joannopoulos, J.D.; Soljacic, M. Efficient wireless non-radiative mid-range energy transfer. Ann. Phys. 2008, 323, 34–48. [Google Scholar] [CrossRef] [Green Version]
  18. Hu, W.; Yi, L.; Liu, Z.; Yan, H. Loss Analysis and Improvement of All Parts of Magnetic Resonant Wireless Power Transfer System. In Proceedings of the 2015 Chinese Automation Congress (CAC 2015), Wuhan, China, 27–29 November 2015; pp. 2251–2256. [Google Scholar]
  19. Li, Y.; Wei, Y.; Wang, Q.; Huang, Y.; Cheng, J. Design Method of High Efficiency Class-E Inverter Applied to Magnetic Coupled Resonant Wireless Power Transmission System. Trans. China Electrotech. Soc. 2019, 34, 219–225. [Google Scholar]
  20. Zhang, X.; Yang, Q.; Zhang, X.; Li, Y.; Jin, L.; Zhang, P. Modeling and Experimental Verification for a Novel Wireless Power Transmission System via Electromagnetic Resonant Coupling. Trans. China Electrotech. Soc. 2014, 29, 185–190. [Google Scholar]
  21. Lv, C. The Coil Optimization Analysis for Magnetic Coupling Resonance Wireless Power Transfer System. Master’s Thesis, Beijing Jiaotong University, Beijing, China, 2015. [Google Scholar]
  22. Velleman, D.J. The generalized Simpson’s rule. Am. Math. Mon. 2005, 112, 342–350. [Google Scholar] [CrossRef]
  23. Niculae, D.; Iordache, M.; Dumitriu, L. Magnetic coupling analysis in wireless transfer energy. In Proceedings of the 2011 7th International Symposium on Advanced Topics in Electrical Engineering (ATEE), Bucharest, Romania, 12–14 May 2011; pp. 1–4. [Google Scholar]
  24. Pantic, Z.; Lukic, S. Computationally-Efficient, Generalized Expressions for the Proximity-Effect in Multi-Layer, Multi-Turn Tubular Coils for Wireless Power Transfer Systems. IEEE Trans. Magn. 2013, 49, 5404–5416. [Google Scholar] [CrossRef]
  25. Yu, X.; Liu, Y.; Liu, P.; Wang, J.; Wu, Z. Further Exploration of the distribution of magnetic field and the magnetic flux leakage phenomenon of the finite length solenoid. Phys. Eng. 2016, 26, 68–71. [Google Scholar]
Figure 1. Structure diagram of the magnetically coupled resonant wireless power transfer (MCR-WPT) system with series–series (SS) topology.
Energies 13 04144 g001
Figure 2. The magnetic field analysis model of the resonant coils.
Energies 13 04144 g002
Figure 3. Schematic diagram of the observation plane division.
Energies 13 04144 g003
Figure 4. The impact of hyperparameters on calculated values of power delivered to the load (PDL) and power transmission efficiency (PTE): (a) PDL and PTE on different n when coils are coaxial; (b) PDL and PTE on different Nh when coils are coaxial; (c) PDL on different n and s when coils are noncoaxial; (d) PTE on different n and s when coils are noncoaxial; (e) Computing time of the calculation model on different n and s when coils are noncoaxial.
Energies 13 04144 g004
Figure 5. Comparison of results of the proposed model and FEA: (a) coil turns; (b) radius.
Energies 13 04144 g005
Figure 6. The PTE and PDL of coil models with the constrained coil parameters: (a) PDL; (b) PTE.
Energies 13 04144 g006
Figure 7. The flow chart of model validation.
Energies 13 04144 g007
Figure 8. The experimental platform of the MCR-WPT system.
Energies 13 04144 g008
Figure 9. The phase relationship between voltage and current.
Energies 13 04144 g009
Figure 10. Experimental results of PTE and PDL versus coil parameters: (a) radius; (b) coil turns.
Energies 13 04144 g010
Table 1. Parameters of the MCR-WPT system.
SymbolQuantityValue
fOperating frequency32.47 kHz
U1,dcInput voltage23.80 V
RLLoad resistance7 Ω
aRadius of the wire3.60 mm
σWire conductivity5.71·107 S/m
DDistance12 cm
Table 2. Results based on finite element analysis (FEA) and the proposed model.
Nr (cm)Results from FEAResults from the Proposed ModelRelative Errors
MFEA (μH)I1max (A)Pout (W)ƞ (W)M (μH)Pout (W)ƞ (%)εr-M (%)εr-Pout (%)εr-ƞ (%)
161310.1648.92621.0085.149.86557.4382.012.959.403.68
1514.7024.66382.4892.1814.53373.0891.211.162.471.06
1616.7019.40305.3693.5716.69304.1592.580.060.401.05
1720.2013.41212.4494.1519.85201.2593.151.735.281.07
1823.4610.04160.4294.9323.22154.2794.571.023.830.34
2030.076.2099.7895.7929.9899.3695.660.300.430.14
121610.6545.42684.8589.6210.50664.3188.051.413.001.75
1413.6728.29435.5291.5113.47420.9490.801.463.350.78
1616.7019.40305.3693.5716.69304.1592.580.060.401.05
1820.1613.43211.6693.6720.05207.3493.550.552.040.13
2023.559.95158.1394.4523.26153.4894.241.232.940.22
2226.997.63121.6994.7426.58117.2594.601.523.650.15
Table 3. Comparison of the calculated value of mutual inductance.
Nr (W)M from FEAM from the Ref. [23]M from the Proposed ModelRelative Errors
MFEA (μH)MN (μH)M (μH)εr-MN (%)εr-M (%)
161310.169.489.866.692.95
1514.7015.0314.532.241.16
1616.7016.8916.691.140.06
1720.2020.6119.852.031.73
1823.4623.6923.220.981.02
2030.0730.4029.981.100.30
121610.6510.8710.502.071.41
1413.6713.8213.471.101.46
1616.7016.8916.691.140.06
1820.1620.0220.050.690.55
2023.5523.1823.261.571.23
2226.9926.3226.582.481.52
Table 4. Results from the proposed model and the experiment.
Nr (cm)Results from the Proposed ModelResults from the ExperimentErrors
Pout (W)ƞ (%)Pout (W)ƞ (%)εr-Pout (%)Δƞ (%)
1613557.4382.01508.568.879.62 13.14
14459.8286.31436.875.485.27 10.83
15373.0891.21365.380.962.13 10.25
16304.1592.58309.888.511.82 4.07
18154.2794.5714789.894.95 4.68
1416420.9490.840184.124.97 6.68
15358.991.83351.986.341.99 5.49
16304.1592.58309.888.511.82 4.07
17252.6993.1125389.410.12 3.7
18207.3493.55199.1490.474.12 3.08
20153.4894.24147.691.223.98 3.02
Table 5. Results of the noncoaxial situation.
OffsetNumerical ResultsExperimental ResultsError
ΔxPout (W)ƞ (W)Pout (W)ƞ (%)εr-Pout (%)Δƞ (%)
0304.1592.58309.8088.511.824.09
1303.4192.14309.3487.861.924.87
3303.0089.90308.9185.291.915.41
5300.4285.46305.2981.221.605.22