1. Introduction
The use of fossil fuels increases the CO
2 concentration in the atmosphere [
1]. This has a direct effect on climate change, which is considered as the most urgent problem of our time [
2,
3]. Therefore, the decarbonization of energy production needs to be the target for research, the economy, and society. The heating and cooling sector has been recognized as a priority to achieve emission reduction targets set for the European energy market [
4]. Germany has ambitious climate targets and wants to reduce greenhouse gas emissions by up to 95% by 2050 compared to 1990. This can only be achieved with a reduction in primary energy consumption and an intended increase in renewable energies in the electricity sector to 80% [
5]. Half of the final energy is required in the form of heating and cooling [
6,
7]. So far, the share of renewable energies is only about 14.5% in the heating sector [
8].
A decisive technology for the reduction of primary energy use and greenhouse gas emissions in the energy sector is combined heat and power (CHP) technology. With this technology, the primary energy input can be reduced by up to a third compared to separate production of electricity and heat design [
9]. In Germany, the potential of combined heat and power generation should be utilized to save fossil fuels. For this reason, the German cogeneration law, Kraft-Wärme-Kopplungs Gesetz (KWKG) 2016, sets the target for significantly increasing the generation capacity of CHP plants by 2025, in addition to promoting heat storage facilities [
10,
11]. The KWKG 2017 proposes a CHP over-dimensioning in district heating by promoting high installed power and low full utilization hours [
12]. Unlike conventional CHP plants, which were mostly operated in baseline with full load and a low installed power [
13]. The target of this law is to increase the flexibility of existing CHP plants for adapting to the increased number of renewable producers and the resulting continuous reduction of the residual load in the near future [
14].
In the future electricity prices will have much stronger and unpredictable fluctuations [
14]. The resulting change in the electricity market design emphasizes the importance of flexible CHP plants regarding electricity market participation. Plant flexibility plays an important role in balancing power demand and supply in highly decarbonized systems [
15]. The temporal decoupling of produced electricity and heat via heat storage enables the flexible operation of the CHP and ensures the security of supply. There is a need for firm capacity additions and flexibility measures to reduce the carbon intensity in energy systems [
4]. Bioenergy is a promising controllable alternative to the fluctuating energy of wind and solar. Biomass CHP systems especially address renewable energy targets as well as grid stability issues [
16].
Energy system modeling offers plant operators the opportunity to improve the economic efficiency of their participation in the electricity market by individually regulating and dimensioning storage facilities and generation plants.
Kavvadiasa et al., performed unit commitment and economic dispatch simulations considering the whole European Union (EU) power system. The study deals with the combination of the heat and power sector and its impact on CO
2 emissions [
4]. The influence of the gained flexibility on the EU power system examined in this study does not address the issue of suitable system configurations for climate-neutral heating networks. In comparison, the present work shows concrete possibilities for decarbonized heating networks on a smaller scale without losing sight of flexibility and sectoral coupling.
Nytten et al., investigated the combination of flexibly operated CHP units and heat storages, whereby flexibility was understood as the time for a delayed operation [
17]. Thus, the flexibility of CHP plant dispatch was addressed via a storage implementation similar to the introduced model described in the following. However, unlike to our main intention, the aim was not to minimize CO
2 emissions in the heating system since their focus was heating system flexibilization.
Le Dréau et al., implemented a flexibility factor that defines whether the heating network is flexible enough to transfer heat demand from high-priced to low-priced electricity [
18]. The work considered demand-side flexibility with short-term heat storages in residential buildings. In contrast to this decentralized flexibility option, the present paper considers as well this price strategy, but in a central district heating network with a long-term heat storage.
Sartor et al., examined the integration of short-term as well as long-term heat storage into a heating system with a biomass CHP unit [
19]. The focus lies on finding the cost of heat optimum of a storage size with the aim of reducing the CO
2 output, but without considering electricity market participation as an additional source of income.
The mentioned studies deal, similar to the present study, with flexible plant operation or cost-efficient unit commitment in heating systems. However, since there are missing findings on carbon neutrality of flexibly operated heating networks, including European electricity market signals, the work described in the following contributes to current research and shows new possibilities for network operators to decarbonize their system efficiently.
The aim of this paper is to implement the flexible mode of biomass plant operation in a modeled heating grid with reduced carbon intensity. The use of a long-term heat storage and the implementation of a biomass boiler allows the replacement of the peak load boiler supply. Different scenario simulations provide information which system compositions, controlling adjustments, and component dimensions are possible for a heating network without fossil fuels. The results from the simulated heat network model should create an incentive for heat network operators to reduce their emissions by presenting concrete constellations and dimensions of the analyzed district heating system.
After the description of the considered heat network and the structure of the simulation model with the used key parameters and the controlling strategy (
Section 2), the results of three annual scenarios with different component dimensions are presented (
Section 3). Finally, the relevance of the findings for research is discussed and an orientation for future decarbonized heating networks is given (
Section 4).
2. Methods
After a detailed description of the model with the fundamental equations and key data in [
20], the present paper introduces in the methods section mainly new implemented model parts and regulations. A dynamic thermal-hydraulic simulation model of a district heating system was programmed within the software environment MATLAB. The network behavior with bi-directional mass flows and mixing temperatures of water flows from different pipes was implemented. Additionally, the instationary behavior of the storage with the layer temperatures, charging behavior, and heat losses was considered. The unit commitment is performed under consideration of the day-ahead the European Power Exchange (EPEX) SPOT prices [
20].
Figure 1 shows the structure of the simulated heating network, which intends to cover the heat load completely without fossil fuels.
Since the consumers in the heat network are connected to the national electricity grid, only the heat load is included in the simulation model. The electricity generated by the CHP plant is thus fed into the power grid and marketed via the EPEX Spot. The consumption in the district heating system is modelled on basis of heat network data described in the following. The anonymized heat demand data was normalized to a number of 1000 persons to be supplied and has a time resolution of 15 minutes. With an annual heat consumption of 9688 MWh
th and a peak load of 5.63 MW
th, the grid mass flows vary between 3 and 18 kg/s. The average flow temperature of the grid is about 90 °C and the return temperature is about 60 °C. Based on the data of the considered heat network, a flow temperature control dependent on the ambient temperature is implemented in the model. For this purpose, weather data from 2017 of the German Weather Service in the geographical area of the analyzed heating network is used [
21]. In order to model the flow temperature of the real network as accurately as possible, a flow temperature of 83 °C in months with an average temperature > 10 °C and otherwise a flow temperature of 90 °C is chosen. The measured and the modelled course of the grid temperatures in a summer and a winter month of the analyzed heating network was validated in previous work [
20].
The peak load boiler, which is not illustrated in
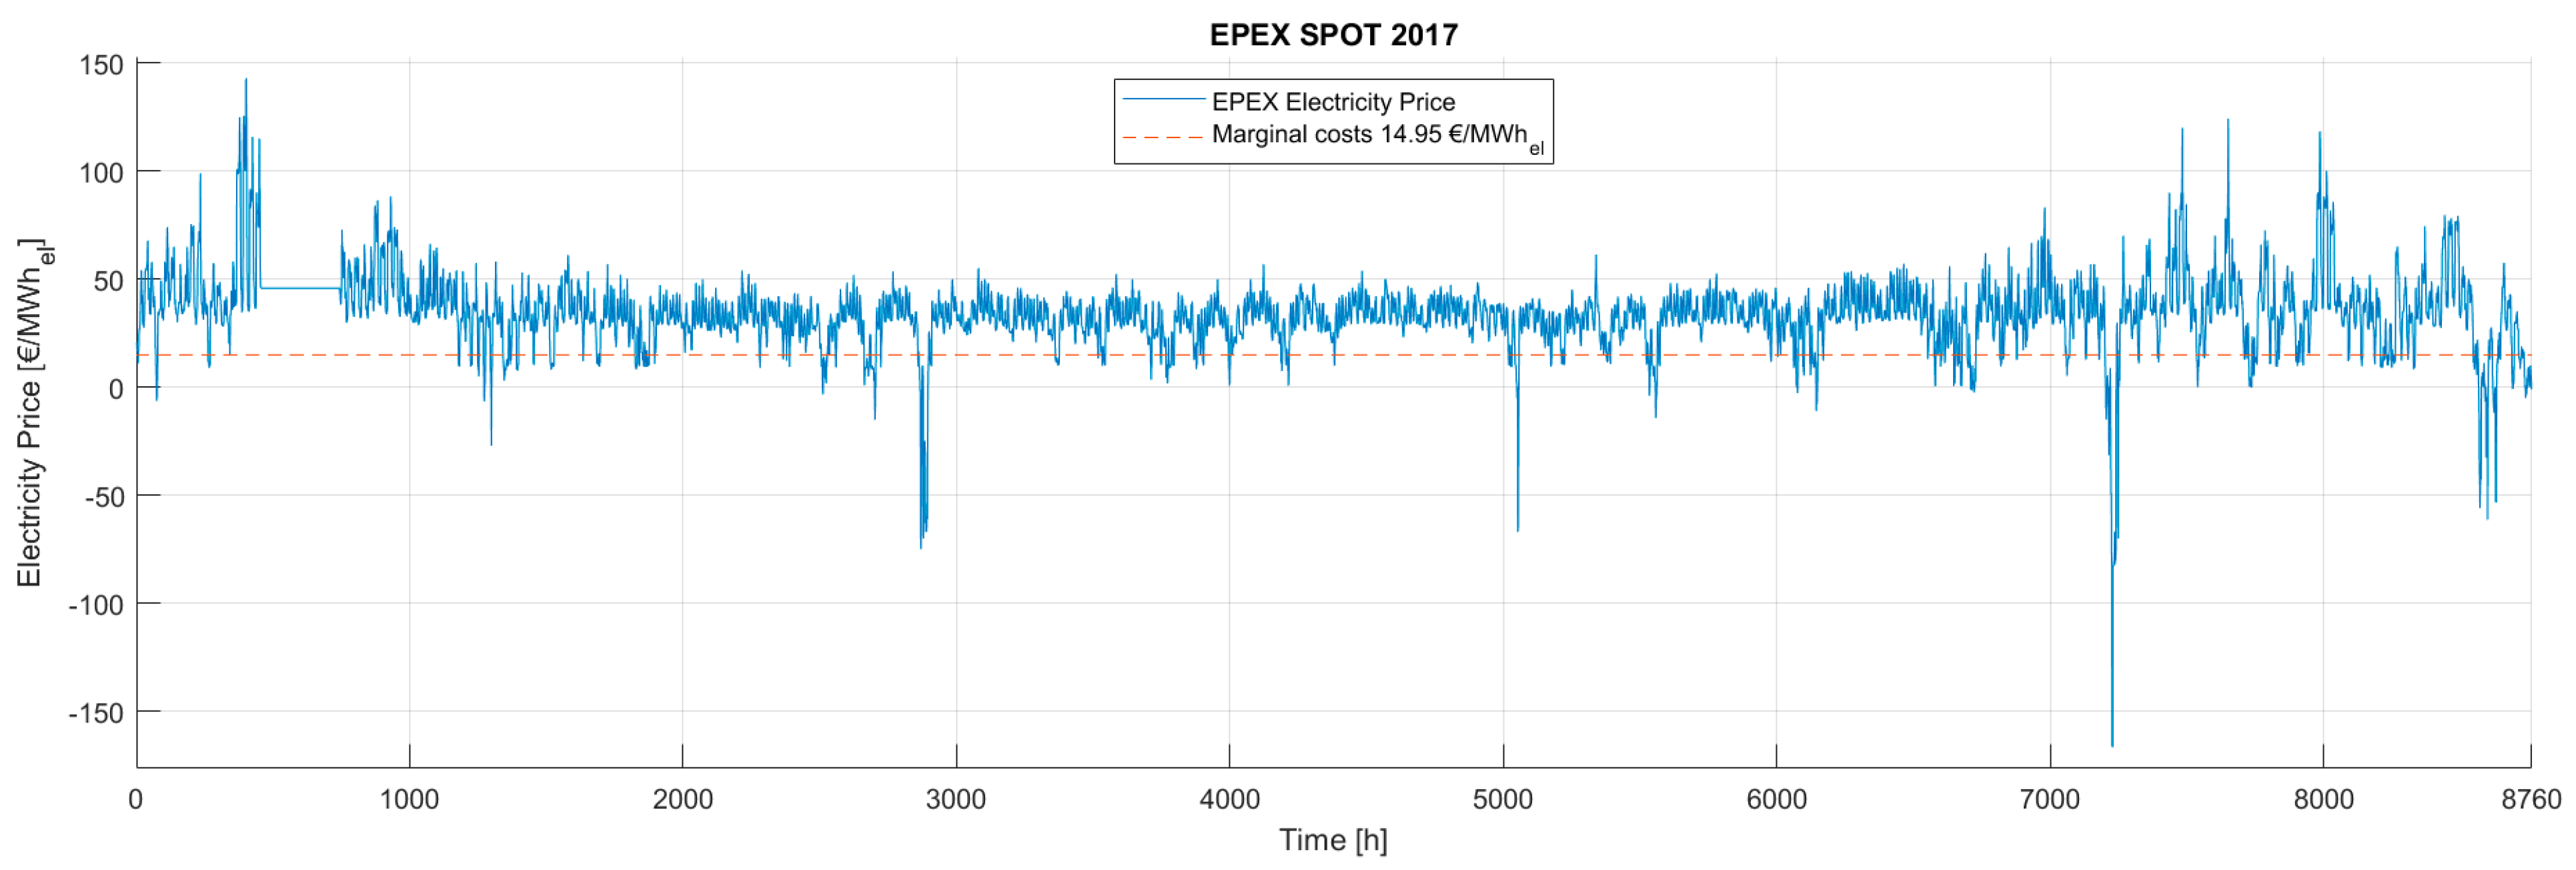
Figure 1, has a back-up function in the heating network. The biomass CHP unit, which is a wood gasifier system and has a modular structure, as well as the biomass heating plant, serve as power and heat producers. The long-term heat storage is used for the temporal decoupling of the CHP plant’s power and heat generation. This allows the CHP plant to operate on an electric-driven basis so that it can react to the EPEX price signals. As soon as the price is higher than the marginal costs, the CHP dispatch is profitable and the plant starts (
Figure 2) [
20].
Figure 2 shows the implemented EPEX prices of the year 2017 (blue) and the calculated marginal costs (red) of 14.95 €/MWh
el, according to which the CHP plant is dispatched. The marginal costs consist of the specific maintenance and fuel costs minus the heat credit and the KWKG funding rate (
Table 1).
With the electrical CHP efficiency of 28.5% result specific fuel costs of about 6.67 ct/kWh
el (
Table 1 and
Table 2). The heat credit is calculated from the fuel costs that would arise for heat generation of the peak load boiler, but is gratuitously available from the heat generated in the coupled production of the electric-driven CHP plant [
20]. The cogeneration law funding rate is a German subsidy in the KWKG 2014 [
22].
The configuration of the generation plants used for the scenario simulations in
Section 3 is listed in
Table 2.
The dimensioning and the dynamic behavior of the generation plants, like load gradients, start-up and shut-down times, temperature-dependent efficiencies, and minimum modulations are described in detail in [
20].
The simulation results present mass, energy, and cost flows of the different model components in a 3-min time-step ∆
t. The input and output data, as well as the different modules into which the simulation model is divided, are shown in
Figure 3. A comparable model is used and described in [
20].
The simulation model is divided into different modules (
Figure 3). First, the Controller Module accesses the input data for making an operational decision and defining the default values for the different system components. The operating status of the hydraulics and the individual mass flows are set in the Controller Module. The Heating grid Module calculates the grid return temperature using the specified grid flow temperature, which is a function of the ambient temperature, and the heat demand input data. Afterwards, the CHP Module determines a target modulation, accessing to the modulation value of the last time step and the actual modulation. Additionally, it computes the CHP plant power outputs. The Peak load boiler Module works according to the same principle, except that here the efficiency curves, as a function of the grid temperatures, are included. The Hydraulic Module manages the mass flows and temperatures, depending on the actual components in operation. In addition, it updates the charging and discharging temperatures of the heat storage. The Heat storage Module, as the only instationary model, determines the storage temperature stratification, the input and output mass flows, as well as the losses over the side walls. The dispatch and regulation of the biomass boiler, which is described in the next paragraph, is integrated as well in the Heat storage Module. Finally, the Economy Module calculates the costs and revenues for the current time step. In the next time-step ∆t, the sequence of the described modules starts again. More details on the different simulation modules are published in [
20].
A possible operating mode of a biomass boiler for supplying a local heating network is in combination with a heat storage. This decouples the time-variable demand from the supply and the heating plant can operate in a stationary mode. The heating plant is thus only operated when the storage tank needs to be filled. This mode of operation is applied at an examined German biomass heating plant (see
Appendix A). The control system is based on temperature measurements distributed over the height of the storage tank and is intended to monitor its state of charge. Temperature thresholds determine at which point the heating plant is switched on-or-off.
Hence, it made sense to couple the biomass boiler to the storage hydraulically and in terms of control technology in the model as well. Thus, the biomass boiler was implemented in the storage module, as it is hydraulically connected to the first and last storage temperature layer. The equal mass flow, which flows from the heating plant into the first storage layer, goes back from the lowest storage layer to the biomass boiler as return flow. The temperatures of the storage layers are mixed with the temperatures of the boiler mass flow. When discharging or charging the storage with the mass flow from the heating network, the corresponding mixing temperatures are calculated under consideration of the losses through the tank walls [
20]. While the biomass boiler only operates with nominal power, it is important to ensure that its mass flow does not exceed the maximum storage charging mass flow of 18 kg/s. In this case, the boiler switches off. A threshold of the storage level for starting the heating plant and thus the charging of the storage is implemented as a control mechanism. As soon as the storage level falls below 20% of the storage capacity, the biomass boiler charges the storage. The storage level level
Storage is calculated from the ratio of the number of temperature layers hotter than 84.99 °C N
Tlayers>Tlayers,max to the total layer number N
layers of 152 (1).
where level
Storage is Storage level. N
Tlayers>Tlayers,max is Number of layers, which are hotter than 84.99 °C and N
layers is total number of temperature layers.
At levelStorage < 0.99%, or when the first temperature layer is below the minimum flow temperature of 84.49 °C, it is assumed, that the storage is fully discharged. Storage charging stops at levelStorage of 98.99%. This hysteresis is implemented to prevent the system from switching ON/OFF too often.
The consumer and producer side of the modeled heating network are validated, so that the plausibility of the simulation results in this paper can be expected [
20]. Nevertheless, the following assumptions lead to corresponding limitations of the simulation model.
The biomass boiler can only be operated at nominal power, since the hydraulic connection to the storage enables a modulating function. Due to the hydraulic complexity and the lack of data for the installation of the heat network pipes, the grid losses were only considered with a constant factor. The annual thermal efficiency for the modeled heating network is assumed to be 0.9 [
26]. As pressure drops in the pipes are not considered in the model, the electricity demand of the network pumps is implemented with 1.5% of the annual heat energy [
26].
Table 3 illustrates an overview of the operation plant design used for the analyzed scenario simulations in
Section 3.
The scenarios differ in terms of the CHP plant and storage tank dimension. In all scenarios, the peak load boiler was accessible, but the biomass boiler was only available in Scenario 3.
3. Results and Discussion
The following annual scenario simulations point out possibilities for the conceptual design of heating networks without using fossil fuels. The most important annual values of the simulation results are shown in
Table A1 (
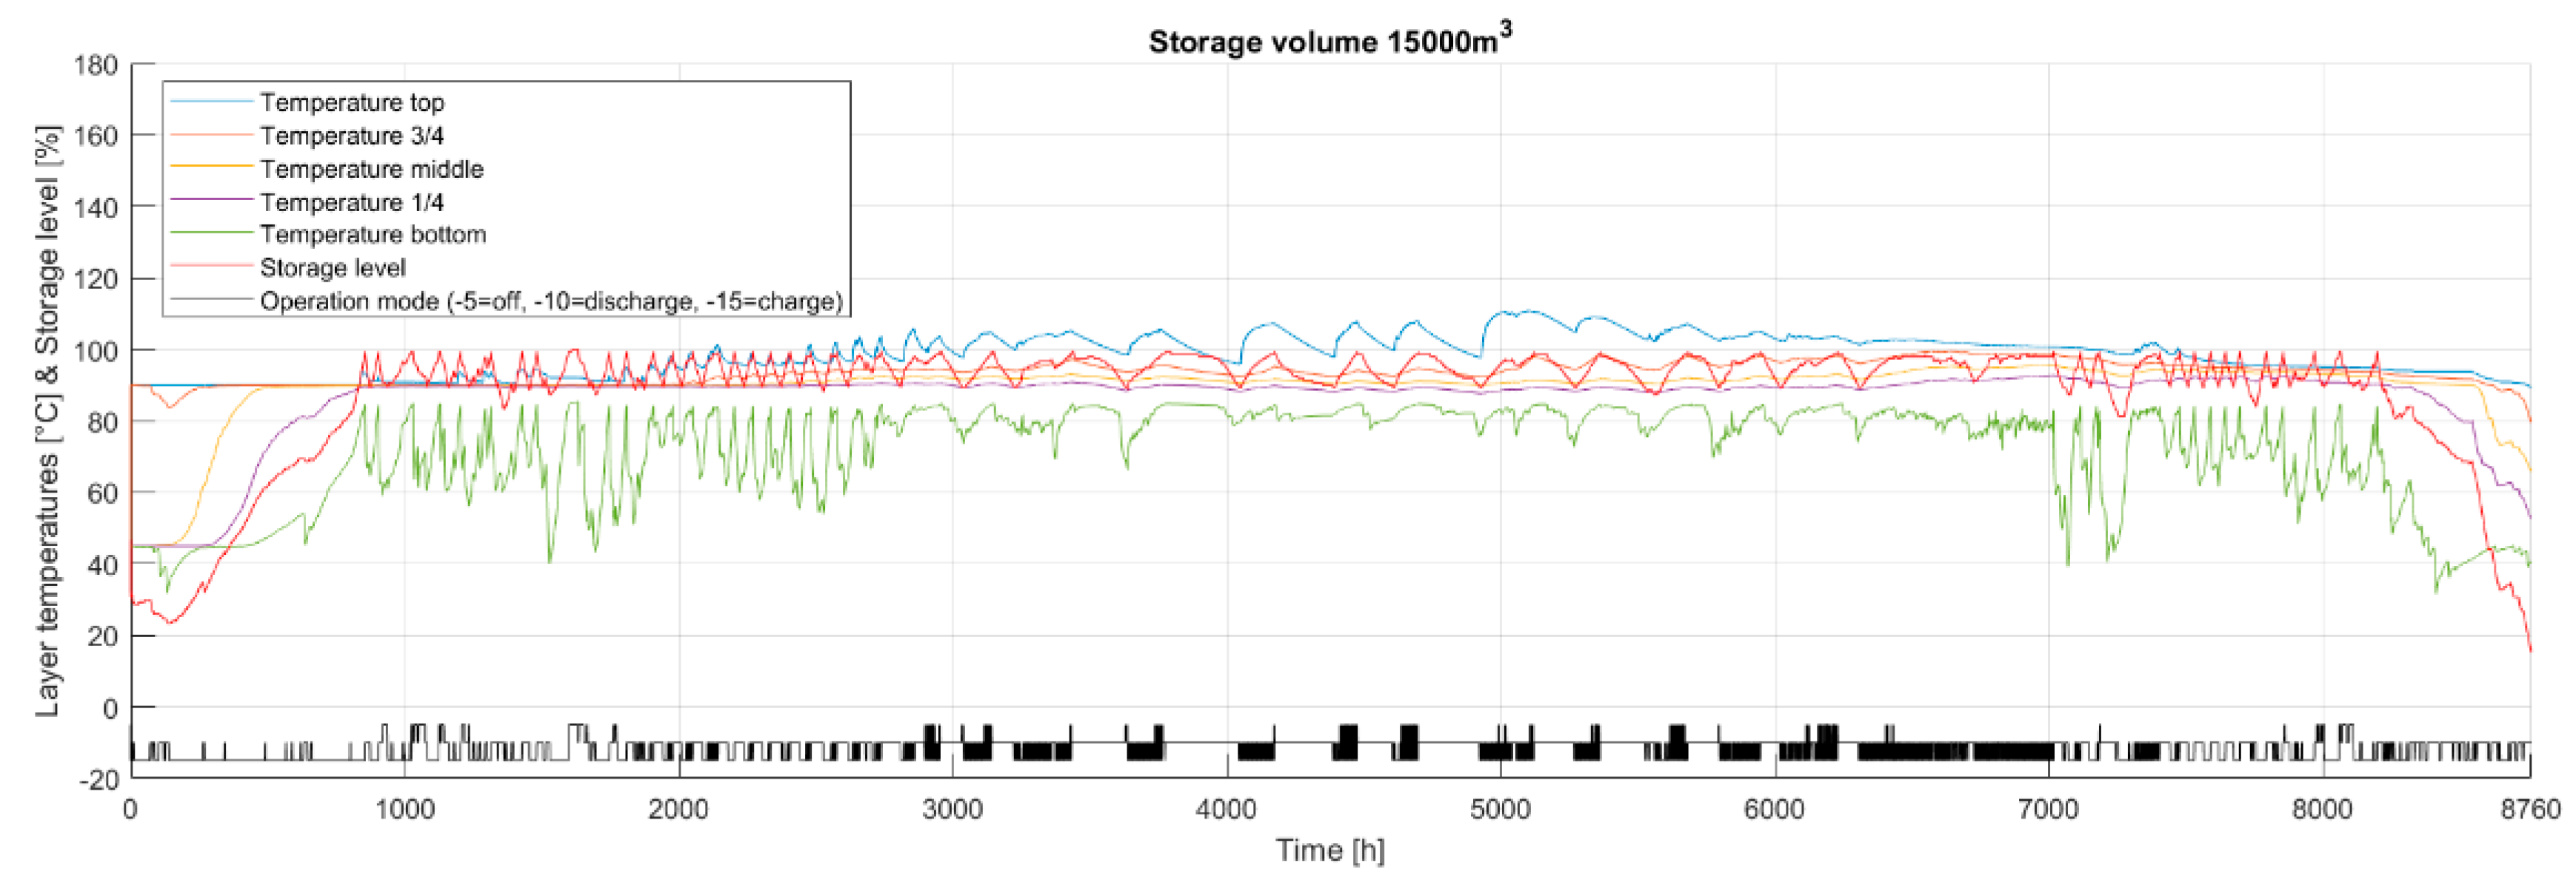
Appendix B). The control strategy and the dimensioning of the individual model components play a significant role for the simulation results. Another important factor is size of the storage capacity, as the heat storage can adopt the modulating function of the peak load boiler in the district heating system. A storage level of 50% is assumed for the simulation initialization, as this results from realistic starting levels in multi-year simulations. For this purpose, the associated layer temperature matrix of the storage, the storage level, and the storage energy of the initial state are required. In order to obtain these values, simulations in advance with the respective storage size were performed. The procedure to get this initialization data is discussed using
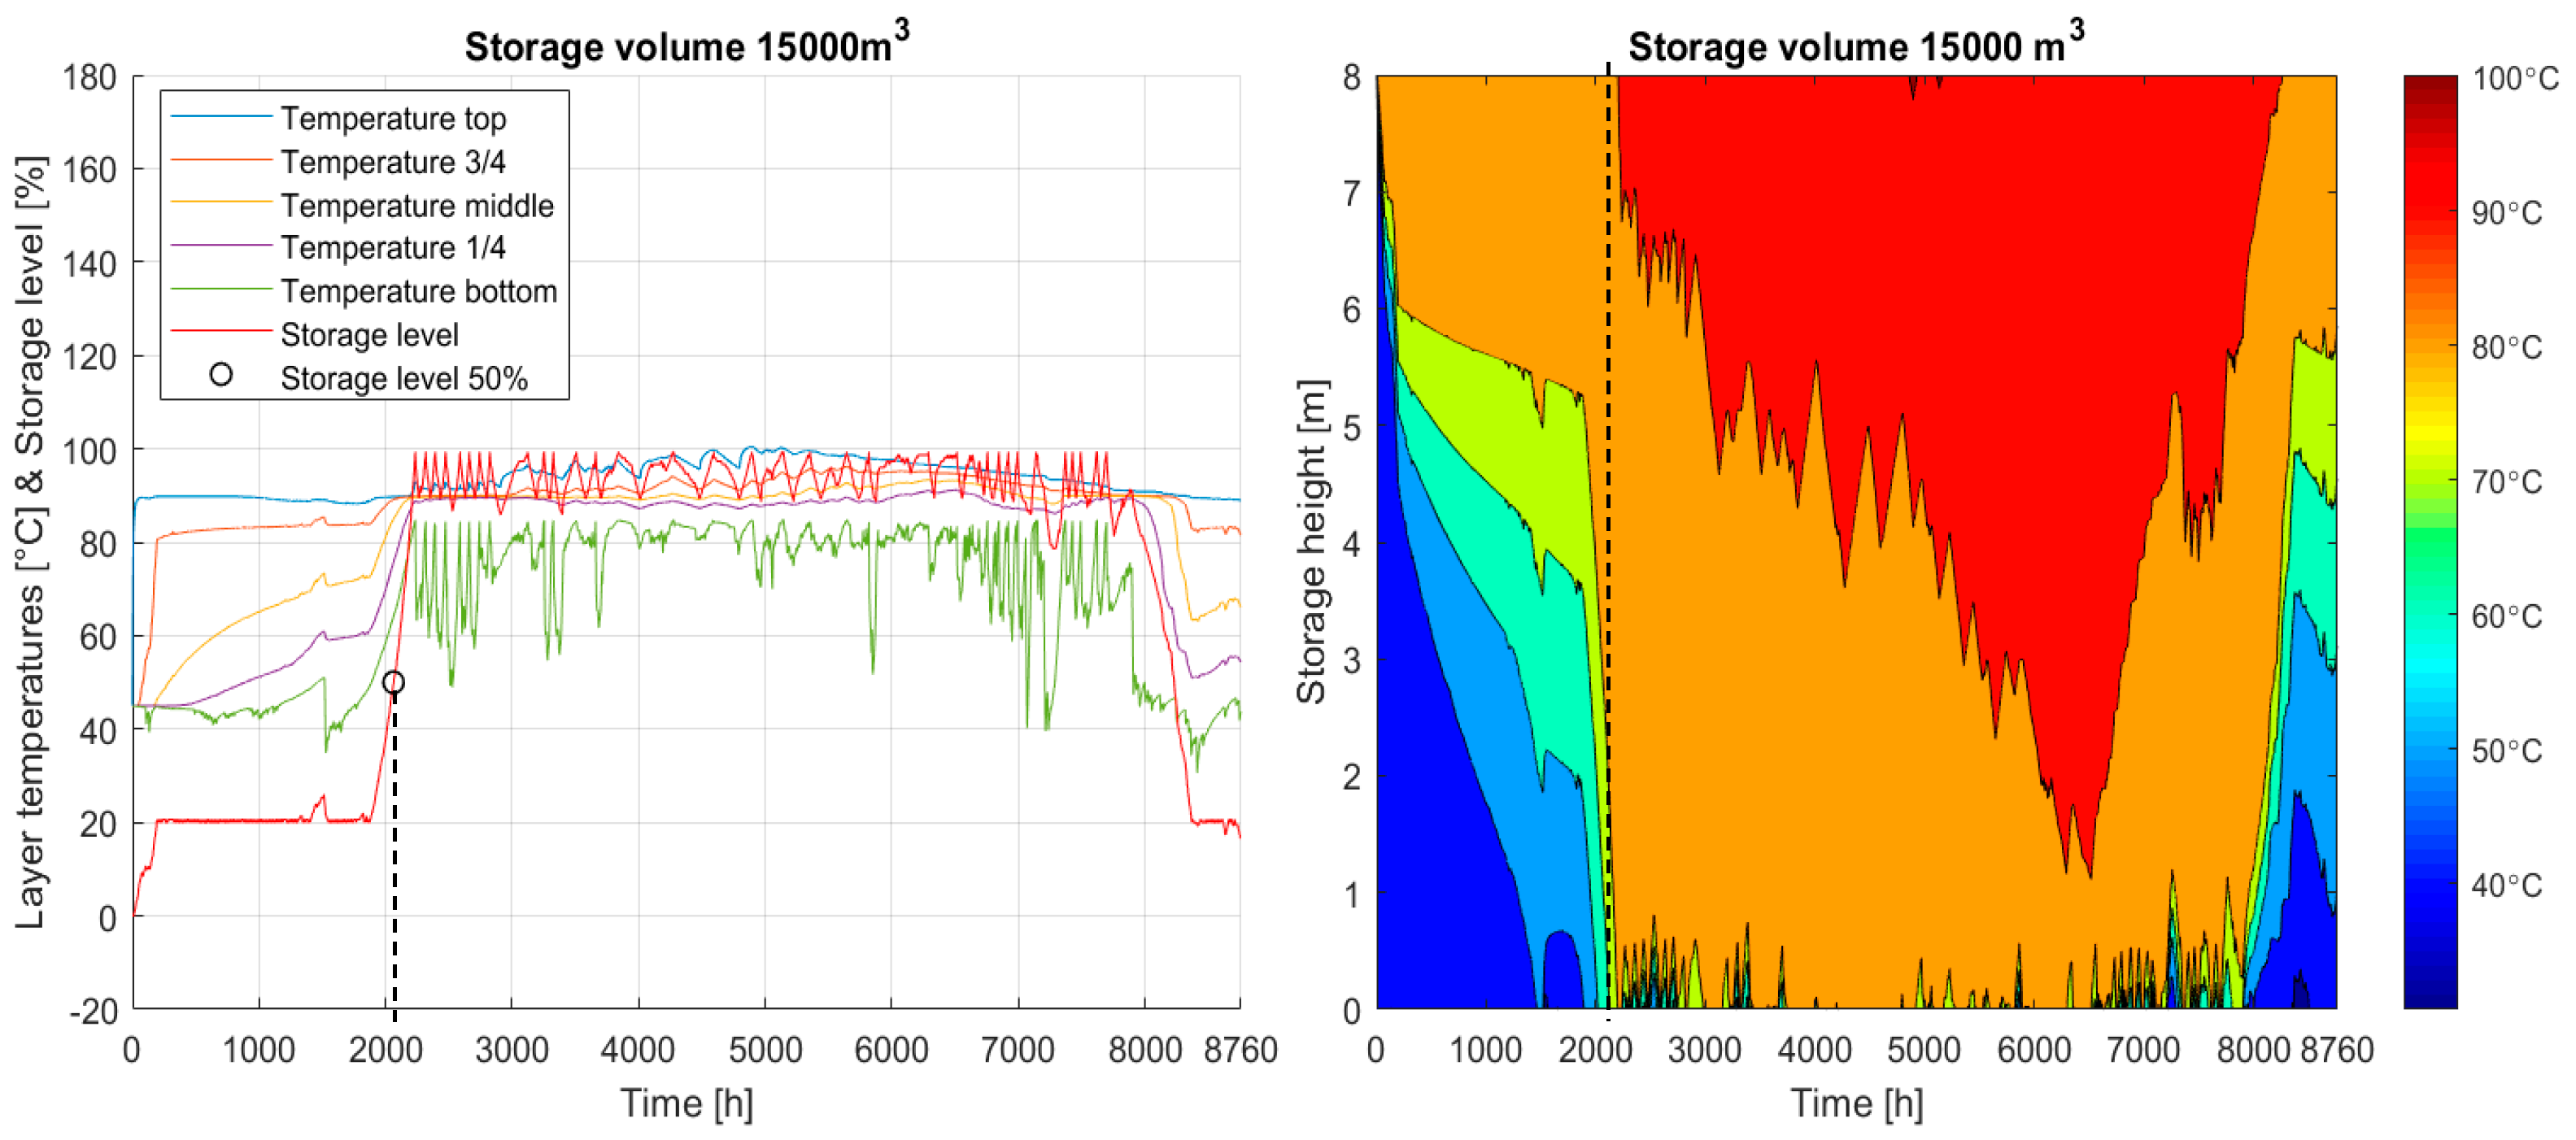
Figure 4.
The following annual simulations show possibilities for modeling a heating network without the use of fossil fuels. Besides the control of the individual components, especially their dimensioning plays an important role.
The left plot shows the level of the 15,000 m3 sized storage tank in red. The other lines represent the different layer temperatures in the stratified storage. The right contour plot displays the different layer temperatures over the tank height.
For the initialization of the simulation scenarios described in the following, a storage level of 50% is required. The round circle together with the dashed line marks the time (27 March at 22:39) of this storage state (left plot). The right plot also marks the specific temperature stratification over the storage height with a dashed line. The visualized layer temperature vector is now used as initial state for the simulations with the respective storage volume.
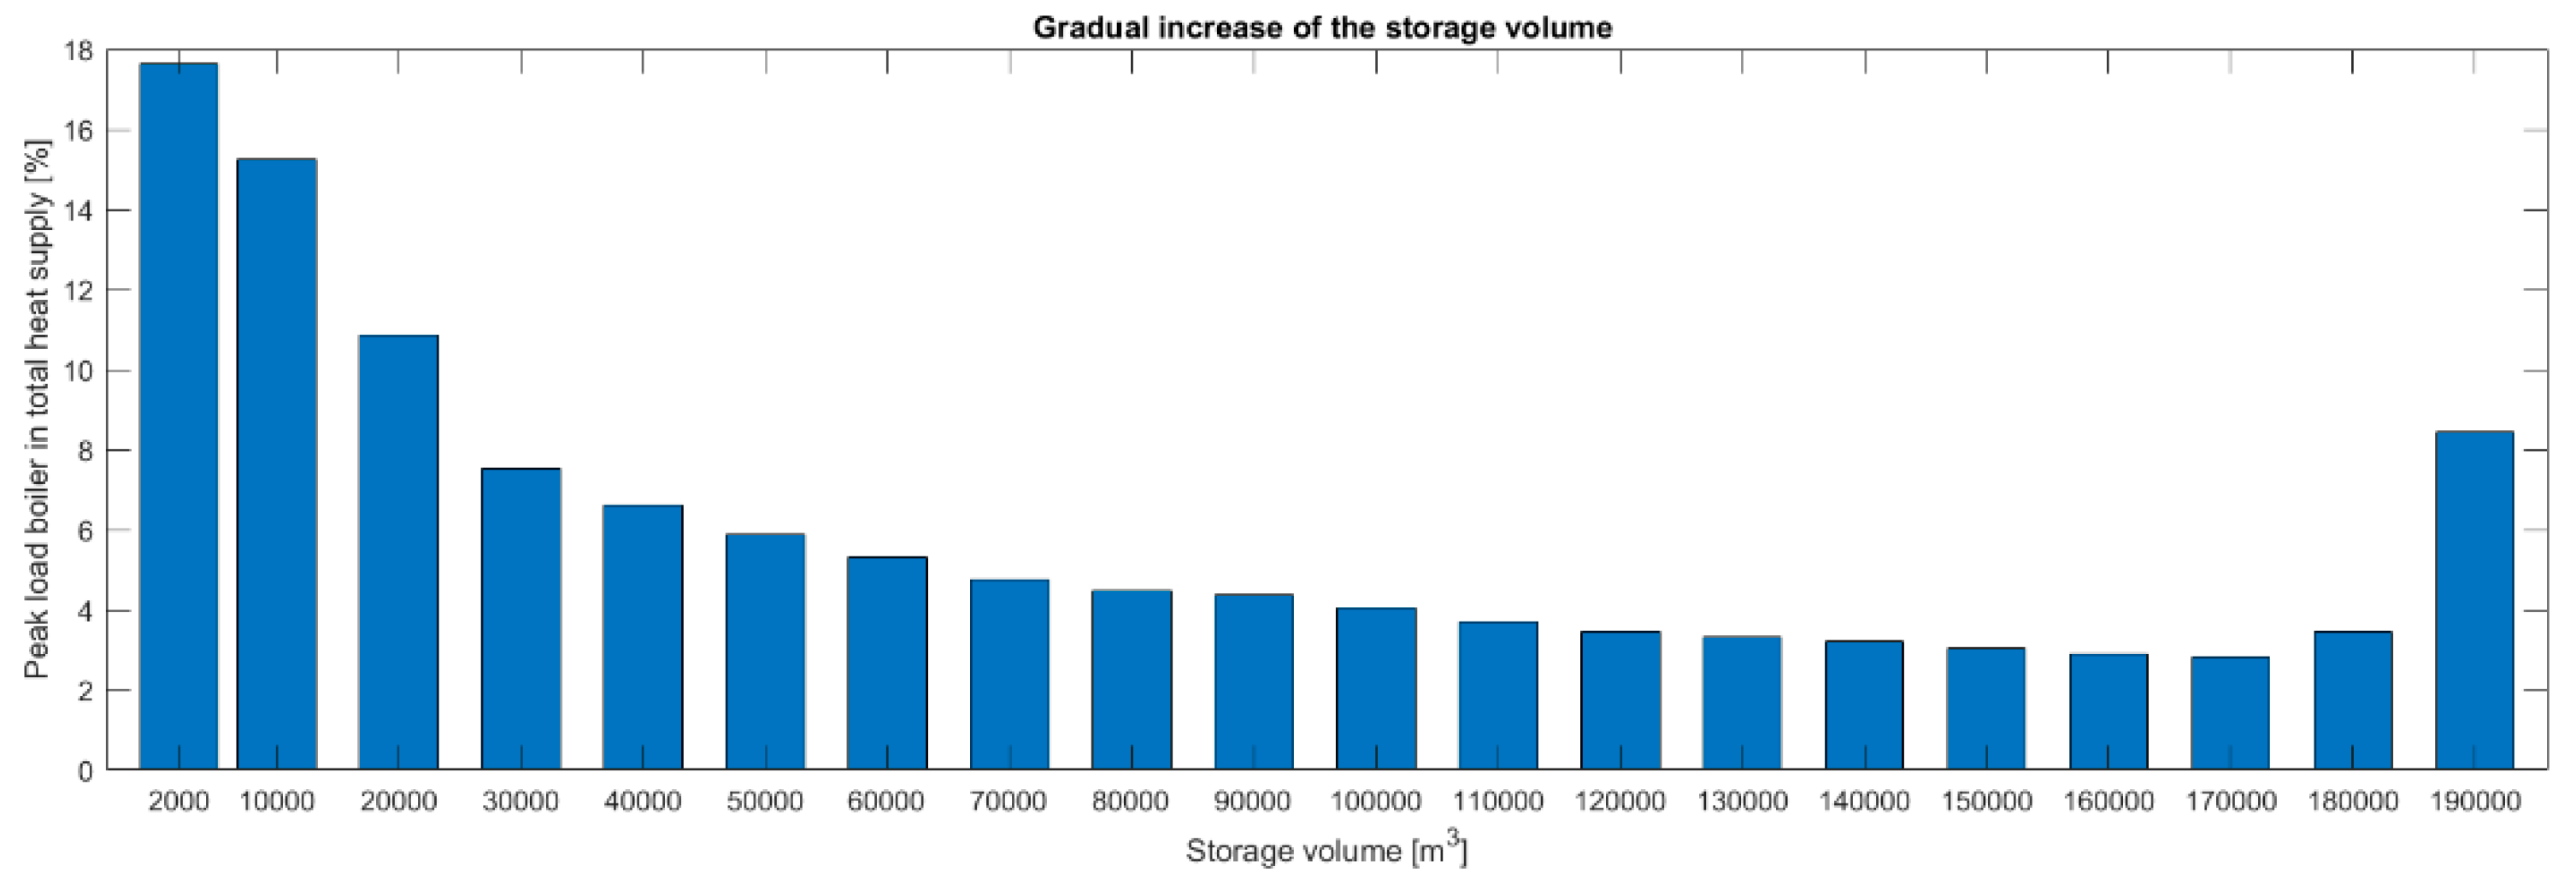
Scenario 1 has the configuration with CHP plant 1 and the peak load boiler (
Table 2). The storage volume was increased from 2000 m
3 to 190,000 m
3 in order to replace the peak load boiler and save fossil fuel.
Figure 5 shows the share of the peak load boiler in the total heat supply with increasing the storage volume in annual simulations.
It is found that the peak load boiler is used most with the start storage volume of 2000 m
3. In this simulation, it contributes with 17.63% to the heat supply. The lowest use with 2.83% of the heat supply is achieved with a storage volume of 170,000 m
3. A volume expansion above 170,000 m
3 results in a higher peak load boiler supply (
Figure 5). As long as the heating plant generation in the simulations is identical, the external storage energy input consequently heats the tank content less in line with increasing storage volume. This results in a lower storage level, which has an effect on the storage dispatch. In this case—storage volumes above 170,000 m
3—the storage level is too low for supplying the heat network and thus the peak load boiler is used instead.
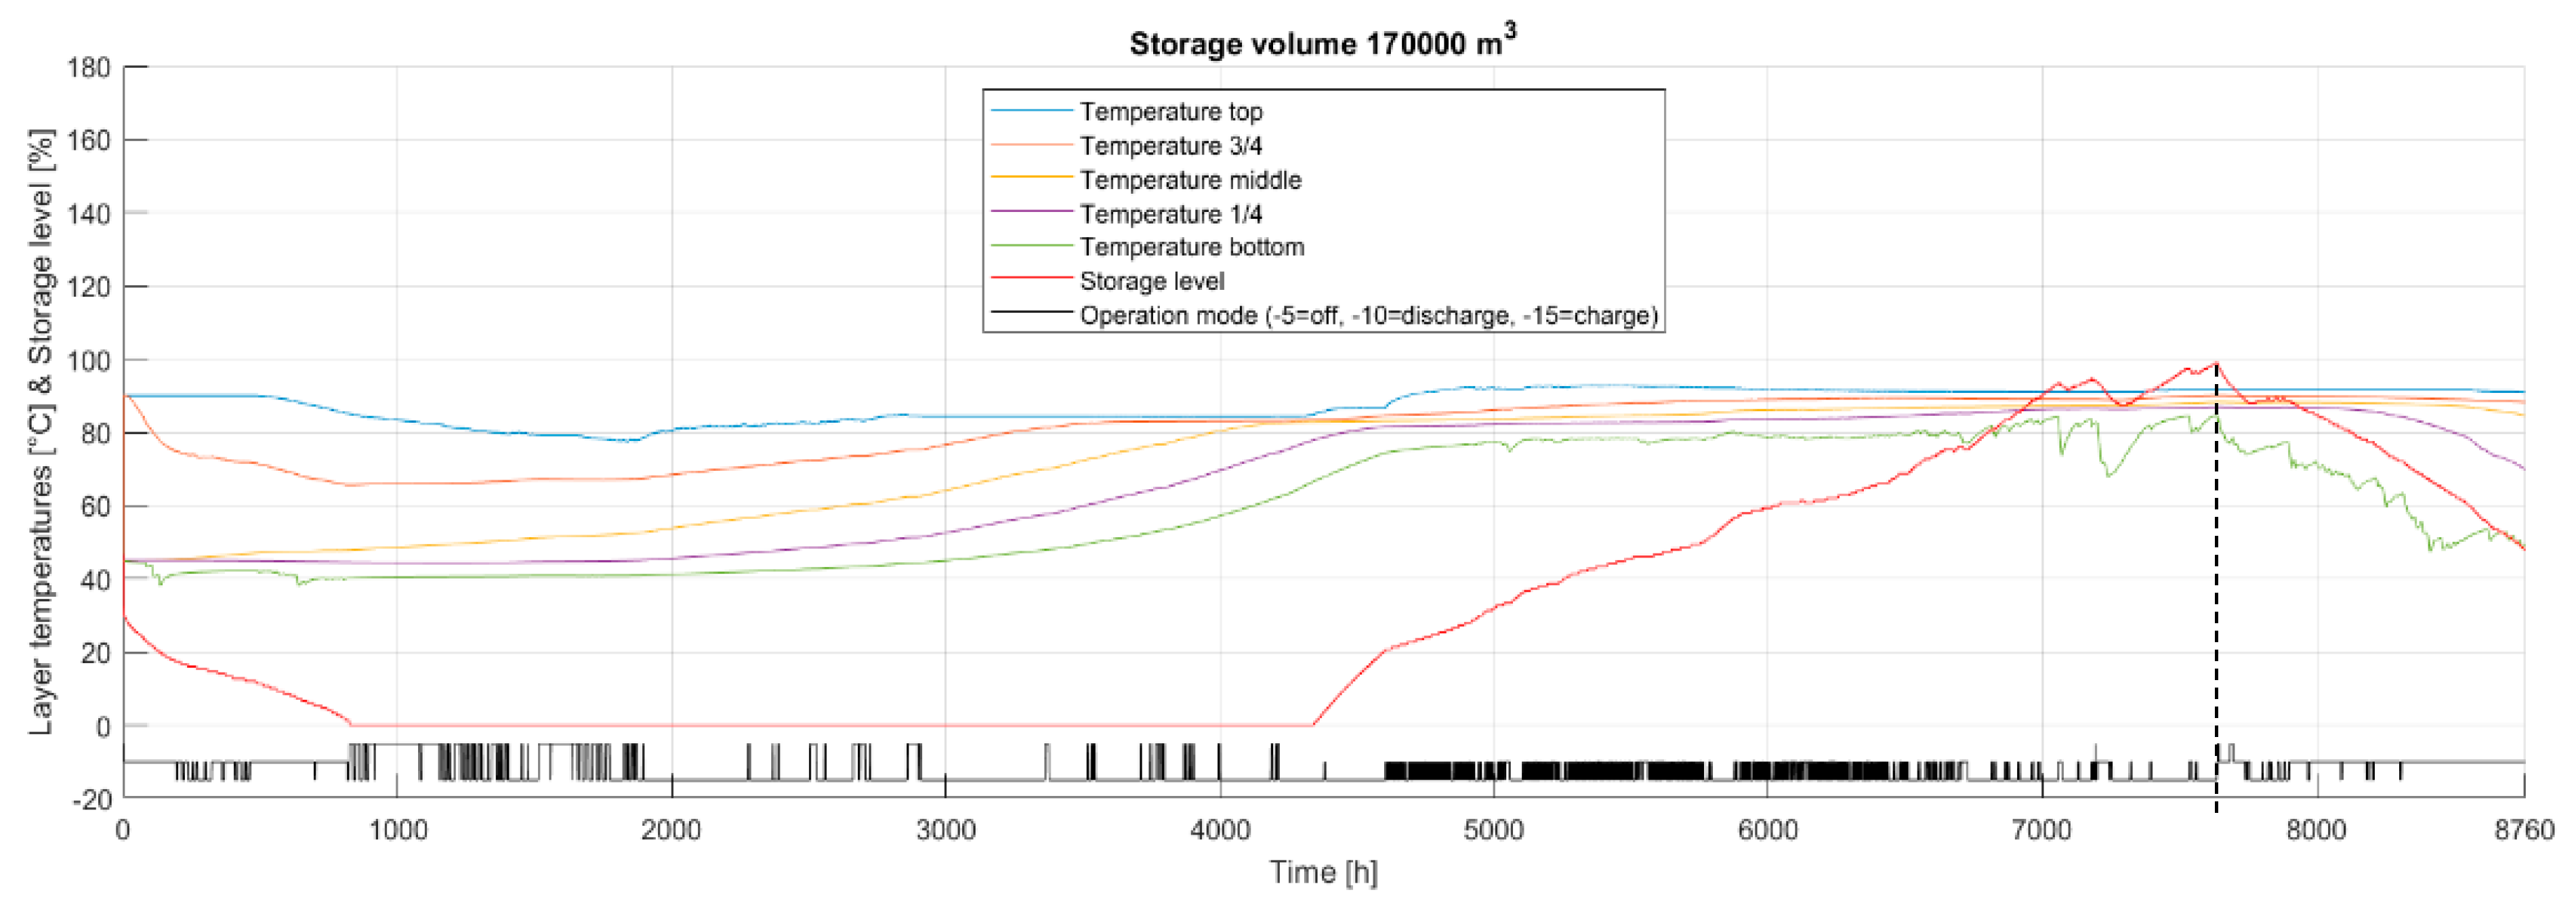
Figure 6 shows the storage parameter within one year with the storage volume of 170,000 m
3.
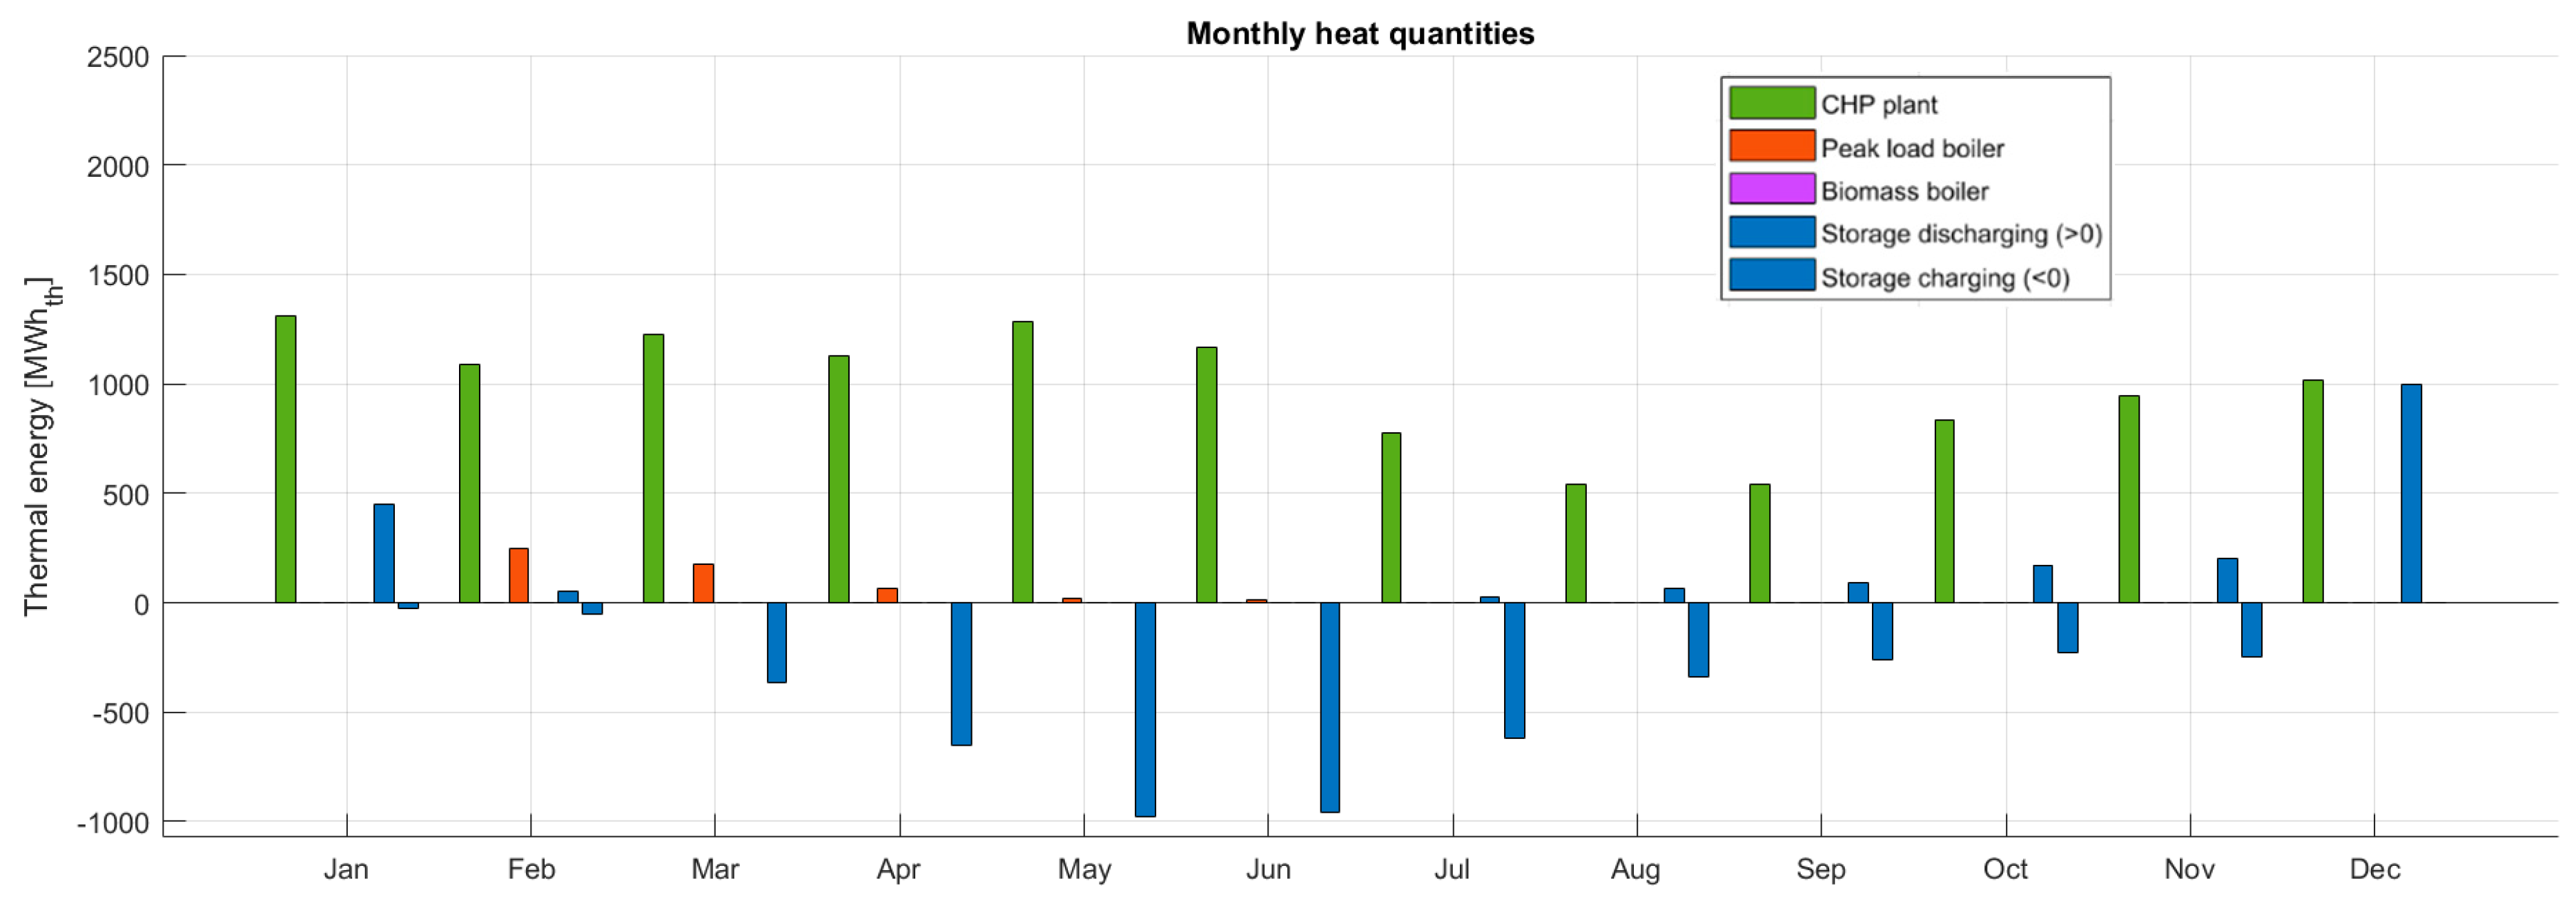
The red line represents the storage level and the other colored lines display the layer temperature profile. The black stepped signal at the bottom of the plot indicates the operating mode of the heat storage (−5 = off, −10 = storage discharge, −15 = storage charge). The dashed line marks the time (16 November at 01:12) when the capacity limit is reached. With the set generation configuration, a further volume increase would not result in any additional useful storage energy for the overall system.
Figure 7 shows the produced thermal energy of the CHP plant (green), the peak load boiler (red), and the heat storage (blue) of Scenario 1. The blue bars distinguish the charging and discharging process of the heat storage. The bar is placed on the positive y-axis when discharging and on the negative y-axis when charging the storage. During the months February to June the peak load boiler is still required to cover the heat demand, because during this time the storage is completely discharged (
Figure 6). Thus, with the specified component dimensioning and without an additional generation unit, a complete network decarbonization cannot be achieved.
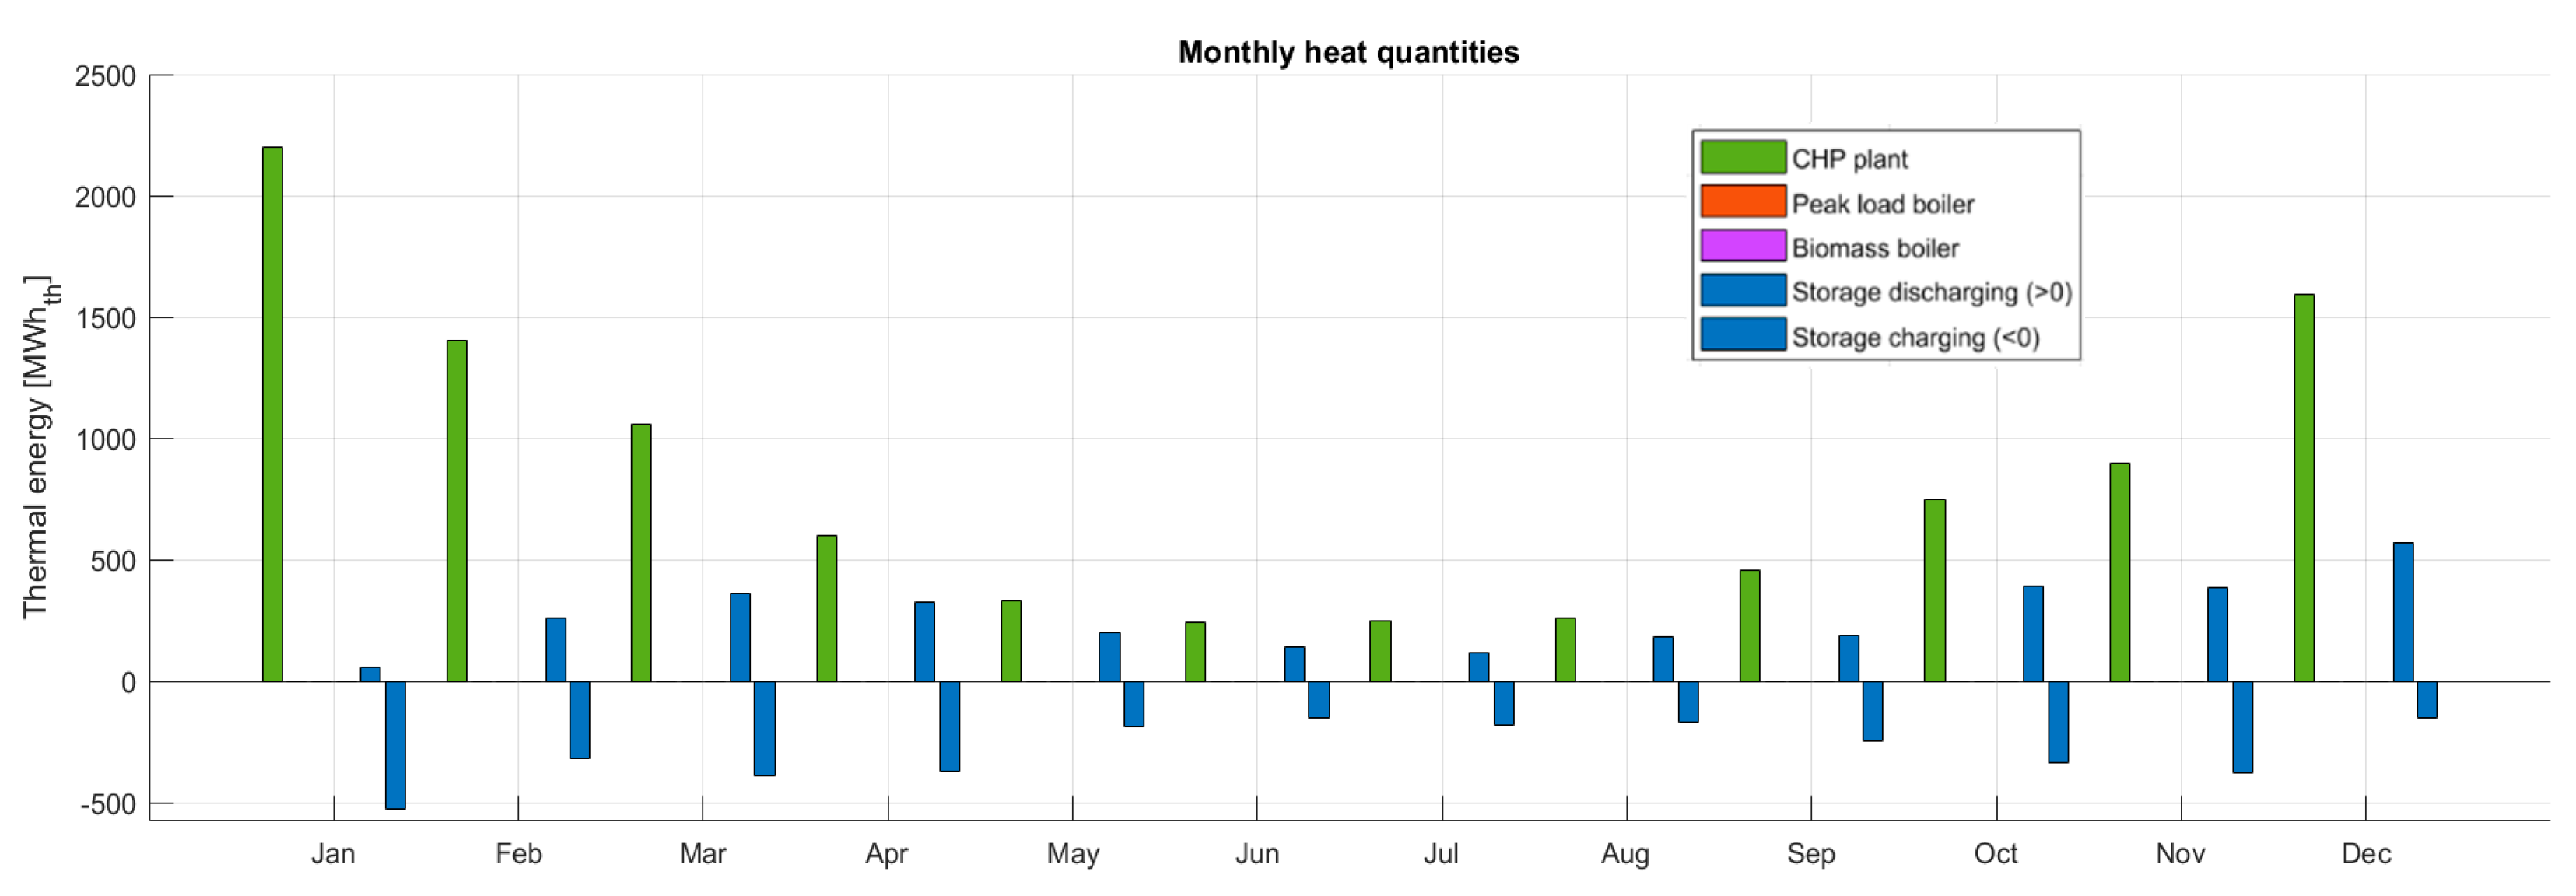
In Scenario 2, the CHP output is increased to 2 MW
el (CHP plant 2,
Table 2). This simulation investigates to what extent the storage size can be reduced with the set configuration. The monthly heat quantities with a storage volume of 15,000 m
3 of Scenario 2 are plotted in
Figure 8.
As illustrated before, the monthly heat quantities of the CHP unit are marked green and the thermal energy of the storage is marked blue.
Figure 8 points out that with the higher CHP output the peak load boiler can be replaced with a reduced storage volume of 15,000 m
3. The storage can now completely adopt the modulating function of the peak load boiler for one year.
Figure 9 shows the storage parameter trend within a year with the configuration for Scenario 2.
Comparing the storage level (red) of Scenario 1 (
Figure 9) with Scenario 2 (
Figure 6), it becomes apparent that the storage is never completely discharged. Due to the higher thermal output of the CHP unit, the storage is charged far more frequently as the operation mode (black) shows. Thus, a storage volume of 15,000 m
3 is sufficient to cover the heat demand without using the peak load boiler.
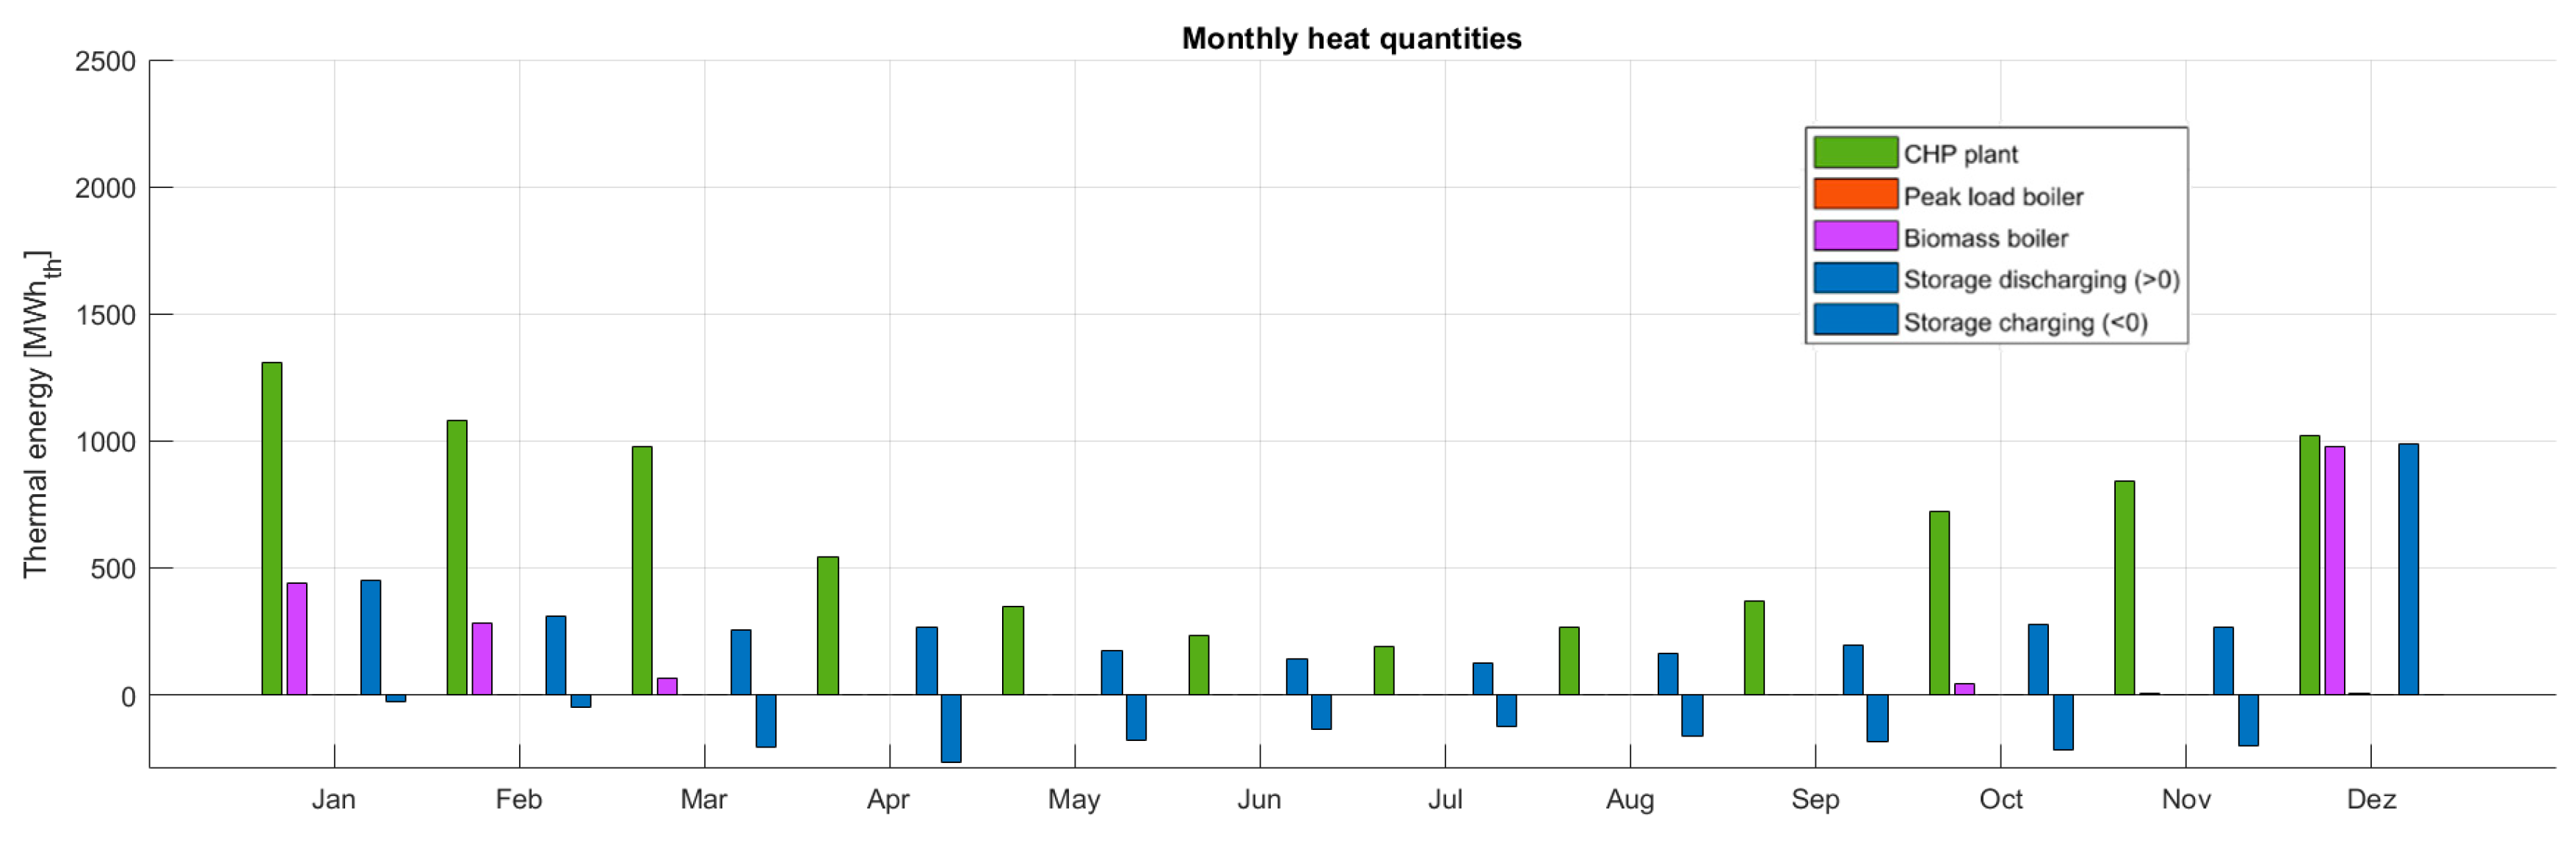
In Scenario 3, the modelled heating plant is used, which was introduced in
Section 2. The biomass boiler charges the storage as soon as the storage level falls below 20% (see control strategy in
Section 2). The plant cannot be modulated or operated in stages and only runs with nominal power. As the mass flow rate is directly proportional to the thermal output and due to the mass flow limitation of 18 kg/s during storage charging, a nominal power chosen too high would prevent the biomass boiler from starting. However, a nominal output that is too low would reduce the added value of the biomass heating plant. A nominal power of 2 MW
th has proven to be an appropriate choice for the third scenario configuration. With this additional generation plant, an oversizing of the CHP unit can be avoided and the basic setting of 1.2 MW
el can be maintained (CHP plant 1,
Table 2). The storage volume is set to 2000 m
3.
Figure 10 shows the monthly heat quantities of Scenario 3.
In this scenario, a storage capacity of 2000 m
3 is sufficient to avoid the peak load boiler dispatch. The biomass boiler (purple) runs in the winter months October to March.
Figure 11 displays the different storage parameter of Scenario 3.
Despite the significantly lower storage volume and the additional heating plant, the storage level (red) remains at the capacity limit less often than in Scenario 2 (
Figure 9). In the second scenario, the storage is fully charged about 34% of the time, while in Scenario 3 it is fully charged about 27% of the time. In both cases, the CHP unit is dispatched with its nominal power according to the EPEX price signals, if it is possible with the storage limit and the heat demand (
Section 2). In Scenario 2, the higher thermal output of the CHP plant 2 charges the storage in less time. This leads to longer remaining time at the storage capacity limit, which increases the ON/OFF switches of CHP plant 2. That is why CHP plant 2 has about 1200 more starting procedures. This is an indicator that EPEX market participation in Scenario 2 is restricted by the storage capacity, which is even higher than in Scenario 3. With the additional heating plant, the storage size can be reduced and the CHP plant has the possibility of achieving higher revenues in the electricity market.
4. Conclusions
The target of decarbonizing energy systems is primarily directed at the heating and cooling sector, as this accounts for almost half of the European consumption. In order to reduce carbon intensity, the use of renewable energy sources and a flexible mode of operation of heat network producers is an important factor. With this focus, the heat network and plant operators can react to changing electricity market conditions.
This paper presents simulation results of a modeled district heating system with an electric-driven CHP plant, a peak load boiler, a biomass heating plant, and a long-term heat storage.
The aim of the annual simulations in MATLAB is to determine which controlling and dimensioning of the different network components are necessary to obtain a system without using fossil fuels. This is equivalent with replacing the peak load boiler in the modeled heat network.
For this purpose, three scenarios of the district heating model were considered in detail:
in the first annual simulation, the CHP plant had a nominal electric power of 1200 kWel. With this configuration, the peak load boiler could not be replaced even with a storage volume of 170,000 m3;
in the second scenario, the electrical output of the CHP plant was increased by 800 kWel. With this dimensioning, a decarbonization with a storage volume of 15,000 m3 was possible;
in the third simulation, a biomass heating plant with 2 MWth was implemented in the model, while using the CHP plant of the first scenario for the simulation. With the additional regenerative producer, the replacement of the peak load boiler in the heating network could be realized with a storage volume of 2000 m3.
The last two scenarios describe a district heating network without using fossil fuels. The scenario comparison shows that in the third scenario the CHP plant has more opportunities to participate in the European Power Exchange market, despite a smaller storage capacity. The added biomass boiler significantly reduces storage capacity without having to increase the CHP plant output. Thus, the system configuration of the third scenario has an economic advantage in two respects.
An interesting addition to the heat network model for further investigations is the implementation of a heat pump. In addition to increasing the efficiency via further sector coupling and electricity market participation, it has the advantage of a modulating function. This leads to a relief of the heat storage, whereby the storage capacity can be further reduced.
Simple recommendations for decarbonized overall energy systems are not possible due to the individual boundary conditions of each heating network with different producer dimensions and regulations. Nevertheless, the investigation of the multidimensionality is an important factor for the development of new system compositions for further emission reduction of the European energy supply.


