Article

A Case Study of the Water Abundance Evaluation of Roof Aquifer Based on the Development Height of Water-Conducting Fracture Zone

1
State Key Laboratory of Coal Resources and Safe Mining, School of Mines, China University of Mining & Technology, Xuzhou 221116, China
2
National Energy Group Ningxia Coal Industry Co. LTD, Yinchuan 750000, China
3
Mining Engineering and Geology School, Xinjiang Institute of Engineering, Urumqi 830023, Xinjiang Uygur Autonomous Region, China
*
Author to whom correspondence should be addressed.
Energies 2020, 13(16), 4095; https://doi.org/10.3390/en13164095
Submission received: 3 July 2020 / Revised: 31 July 2020 / Accepted: 3 August 2020 / Published: 7 August 2020

Abstract

:
In the eastern mining area of Ningxia, China, multi-layered sandstone aquifers are widely distributed in the underground. However, the water abundance of these aquifers is not clear, which brings great challenges to the prevention and control of mine water disaster. In this paper, five mining areas in eastern Ningxia were taken as the study area, and the distribution characteristics of aquifer and the mine water filling source were analyzed through the analysis of geological data and numerical simulation. Finally, the lithology influencing index (LII) was constructed, and the water abundance of the aquifer was evaluated. The results show that the sandstone aquifer III in the lower part of the Jurassic Zhiluo formation is the main water-source aquifer of the #2 coal seam in the study area, while the middle aquifer II and the upper aquifer I are indirect water-source aquifers; the areas with extremely strong and strong water abundance are Maiduoshan, Hongliu, the south of Shicaocun, southeast and southwest of Meihuajing, and the central and southern areas of Shuangma mining areas; when the depth of water drainage boreholes in the roof reaches the development height of the water-conducting fracture zone, the pre-drainage measures can effectively control the mining inrush water of the working face and ensure the safety production. This research is of great significance to the prevention and control of mine water disaster.

1. Introduction

Along with the gradual depletion of high-quality coal resources in eastern China, the focus of coal mining is gradually shifted to the northwest region [1,2]. Rich in coal resources, the eastern Ningxia is an important coal production base in China [3]. However, multi-layered sandstone aquifers are widely distributed in the eastern Ningxia, and their water-abundance characteristics of the multi-layered sandstone aquifers are unknown, which brings safety risks in mine production in this area. The strain energy accumulated in the places where rock deformation, caused by mining activities, occurs. When the stored energy reaches a certain level, a large amount of energy will be released, leading to cracks in overburden layers [4]. Those longitudinal fractures gradually develop to water-conducting pathways and connect overburden aquifers and mining space, resulting in the water inrush from aquifers into the mine [5,6]. When the water inrush is out of control, flooding accidents can be caused, resulting in a large number of casualties and huge economic losses. Moreover, owing to the formation of groundwater depression cone, groundwater continues to flow into the mine under the effect of overflow supply, which may cause a huge loss of groundwater resources [7,8]. The hydrogeological condition has a direct effect on the economic benefit of a coal mine company [9]. Hence, the water inrush caused by coal mining is an important factor restricting the development of the eastern Ningxia mining area, and the research on the property and instability mechanism of overburden aquifers above the coal seam is the basis of water disaster control.
Zha Hao et al. [10] researched the fracture development of the sandstone aquifer above a shallow seam by simulation experiments. Cui et al. [11] utilized the physical similar material simulation experiment and acoustic emission monitoring method to research the failure rule of overlying layers. The magnetotelluric method was applied to the analyze the failure features of aquifers [12]. The evolution processes of rock fracture and mechanisms of water inrush hazards occurring in Luotuoshan coal mine were analyzed by fracture-hydraulic flow coupling functions [13]. The quantitative relationship between hydraulic properties of overburden aquifer and mining processes was established, based on in situ continuous measurements [14]. The evolution processes of permeability of aquifer and self-healing of fractures were studied through experiments carried out in a laboratory [15,16]. In addition, it was found that the property of the aquitard beneath an aquifer was a crucial factor of the coal extraction influence on the aquifer [17]. In terms of the sources of aquifer recharge or water inrush of mines, the combination of hydrochemical analysis with other analysis methods was an effective instrument [18,19,20]. Meanwhile, the ascertainment of inrush water resources can also be achieved by the analysis of fracture development of overburden strata [21,22].
Five mining areas are taken as the research focus in this paper, including Meihuajing, Shicaocun, Hongliu, Maiduoshan, and Shuangma mining areas. To clearly understand the characteristics of the water abundance of the roof aquifer in the study area and the mine water inrush, the development height of the water-conducting fracture zone, the source of the water inrush, and the characteristics of the water abundance of the aquifer above the coal seam are studied in this paper. From the perspective of mining safety, the water abundance characteristics of the roof aquifer are revealed. This research can be taken as an important theoretical basis to guide the long-term mine water prevention and control method.

2. Overview of the Study Area

2.1. Geographical Location

Five mining areas are contained in the study area and distributed in a north–south strip, including Meihuajing, Shicaocun, Hongliu, Maiduoshan, and Shuangma mining areas. It extends about 44 km from north to south and 5.5–11.8 km from east to west, with a total area of about 370.67 km2. The study area is located in the east of Ningxia and the west of Ordos Basin. It belongs to a typical semi-desert and semi-arid continental climate. The surface of the study area is mostly the semi-desert and the low hilly area, most of which are covered with vertical and horizontal sand dunes. The geographical location is shown in Figure 1.

2.2. Aquifer Division in the Study Area

The geological data obtained from a total of 629 drilling holes were analyzed. The main coal seam in the study area is #2 coal seam with an average buried depth of 548 m, on which there are multi-layer Zhiluo formation aquifers. According to the geological data obtained from drilling, the lithology and combination structure characteristics, aquifer burial conditions, hydraulic properties, and other factors are considered, and the strata above the #2 coal seam can be classified into aquifer and aquiclude (Figure 2). Aquifer III in the lower part of Zhiluo formation is mostly the direct roof of #2 coal seam in the study area, and is mainly composed of coarse-grained sandstone, followed by medium-grained sandstone. The stratigraphic development of Aquifer III is relatively stable with a thickness of 0–165.77 m. Aquifer II in the middle part of Zhiluo formation is mainly composed of medium-grained sandstone and fine-grained sandstone. The stratigraphy varies greatly, with a thickness of 0–279.75 m. Aquifer I in the upper part of Zhiluo formation in the study area is mainly composed of weathered medium-grained sandstone and coarse-grained sandstone with the argillaceous cementation. The buried depth of the top boundary is 31.35–108.55 m, with an average buried depth of 68.31 m. It is a shallow buried area, and the buried depth of the groundwater level is 1.97 m. Besides, a unified aquifer is formed by partial Aquifer I in the upper part of Zhiluo formation and the aquifer of Anding formation or the Quaternary sedimentary aquifer. Aquiclude III of Zhiluo formation is mostly composed of silty mudstone, sandy mudstone, and siltstone, with a thickness of 0–250.8 m. Aquiclude II of Zhiluo formation is mainly composed of mudstone, silty mudstone, and siltstone, with a thickness of 0–270.18 m. Aquiclude I of Anding formation is far away from #2 coal seam, which has little influence on the coal seam mining. Therefore, Aquiclude I is not discussed in this study. In the south of Hongliu and the north of Shuangma mining areas, the Zhiluo formation is denuded owing to the influence of fault uplift. The thickness distribution characteristics of each aquifer and aquiclude in Zhiluo formation are shown in Figure 3.

3. Estimation of Development Height of Water-Conducting Fracture Zone in Coal Seam Roof

3.1. Empirical Calculation Method of Development Height of Water-Conducting Fracture Zone

After coal mining, overburden strata are deformed and destroyed. According to the failure mode and degree of rock strata, the goaf can be divided into three zones, that is, the caving zone, fracture zone, and bending subsidence zone. A large number of fractures are produced in the strata of the collapse zone and fracture zone, and become the pathway of water flow. Therefore, the collapse zone and fracture zone are collectively called the water-conducting fracture zone (Figure 4). The water-conducting fracture zone, connecting the overburden aquifer and the goaf, is the main pathway for the aquifer water to enter the goaf or working face. It is very important to judge the development height of the water-conducting fracture zone to evaluate the influence of aquifer water on coal mining.
The compressive strength of some overburden samples of the main coal seam roof in the study area is less than 20 MPa, and that of the rest is between 20 and 116 MPa, with an average of 24 MPa. According to the classification standard in the Regulations for Coal Pillar Retention and Pressed Coal Mining in Buildings, Water Bodies, Railways, and Main Roadways, the samples are classified into soft or medium hard categories. Considering that the sample is mainly composed of medium-grained sandstone, siltstone, mudstone, and argillaceous sandstone, for the sake of safety, the empirical formula is used for calculating the height of the water-conducting fracture zone of medium hard rock stratum in this paper. The detailed Equation (1) is expressed as follows [23]:
H W = 100 M 1.6 M + 3.6 ± 5.6
where HW is the upper boundary height of water-conducting fracture zone, m; ∑M is the accumulative mining thickness, m.

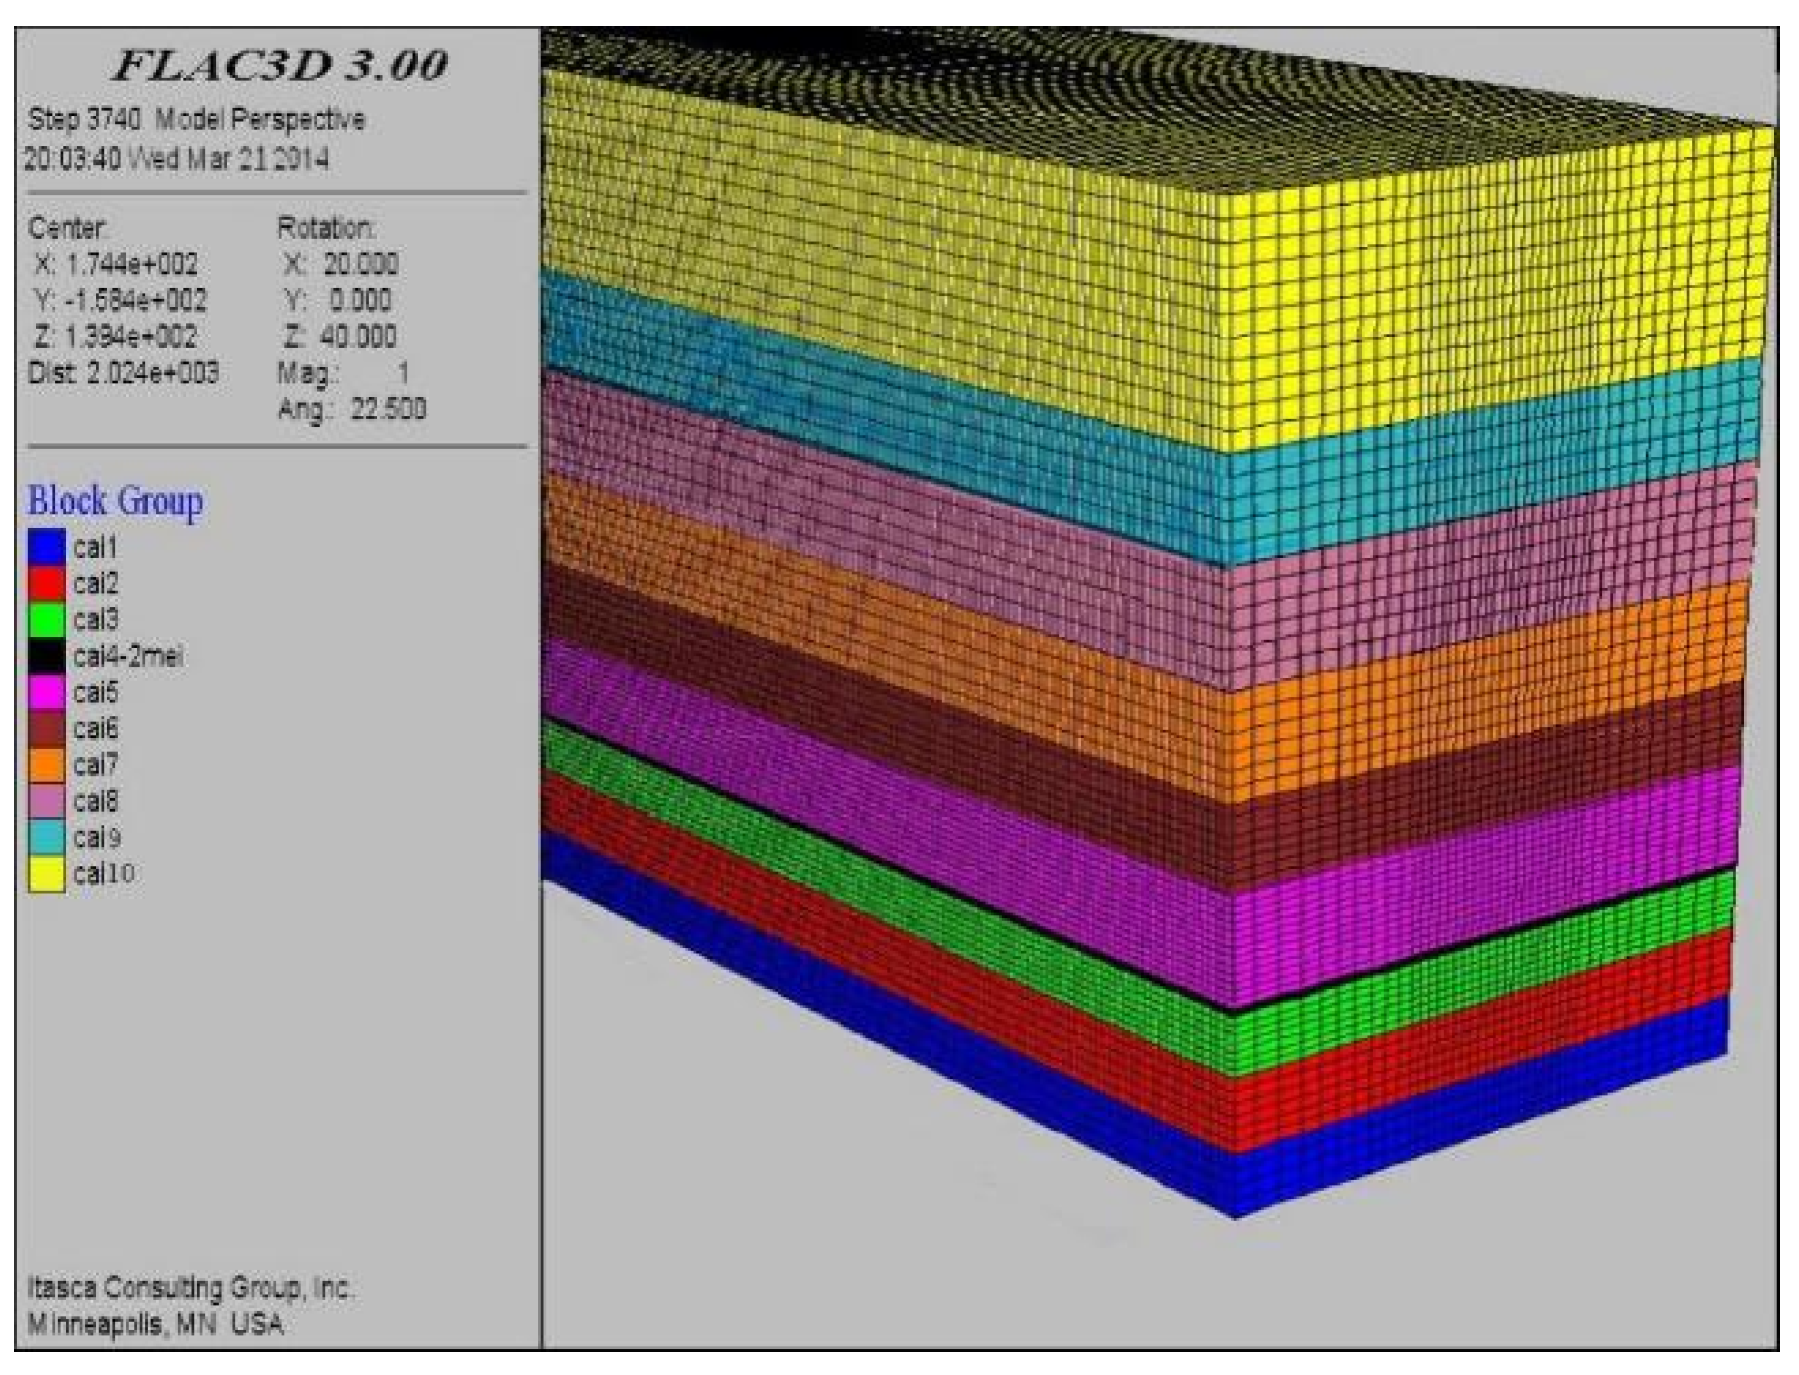
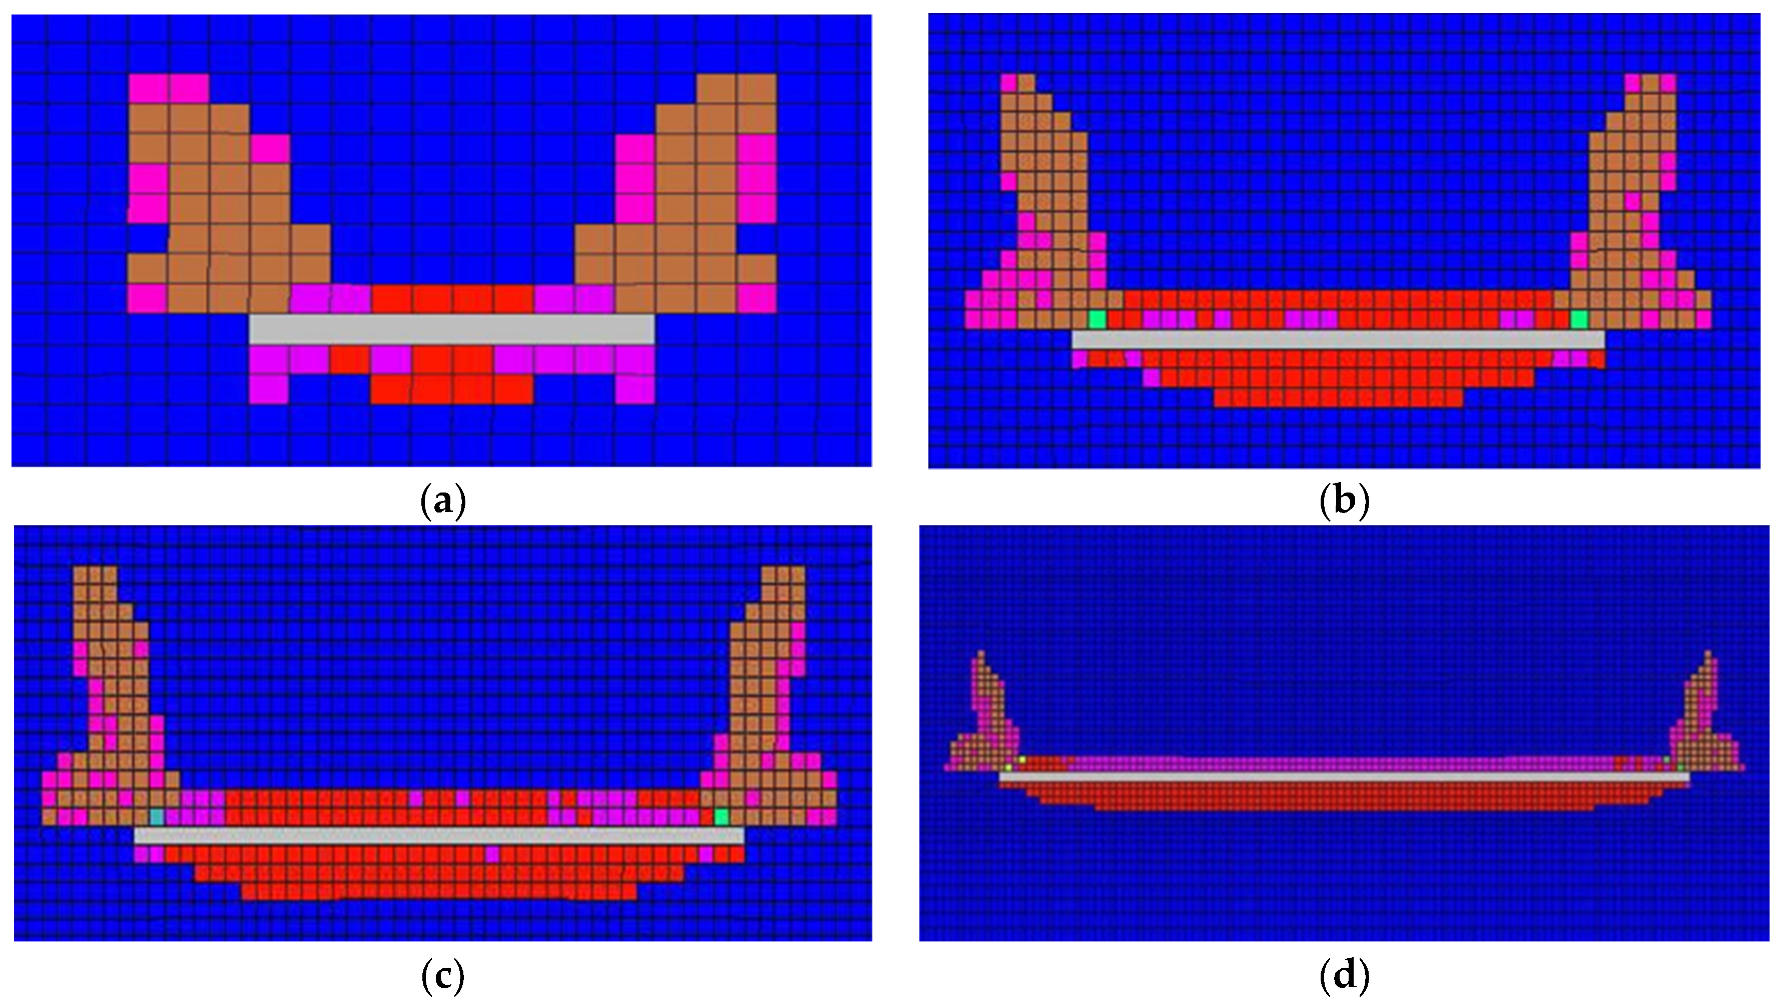
3.2. Numerical Simulation Analysis of Height of Water-Conducting Fracture Zone

The calculation formula of the development height of the water-conducting fracture zone is the empirical formula obtained by summarizing a large number of measured data of the fracture zone. The calculation result is reasonable to some extent, and there is a certain deviation from the actual result. In this paper, based on the actual geological data, the numerical model of mining in the study area is established, and the development height of the water-conducting fracture zone is analyzed. The simulation results are used to modify the values calculated by the empirical formula, so as to obtain more accurate estimation results of the development height of the water-conducting fracture zone.
#2 coal seam is the main coal seam in the study area, with multiple aquifers and aquicludes. To study the development height of the water conducting fracture zone in the five mining areas, five numerical models are respectively established and simulated according to the geological data of the five mines. The development process of the water-conducting fracture zone is similar in each mining area. For simplicity, only the numerical simulation results of Hongliu mine are analyzed in this paper.
The sedimentary relationship of Hongliu mine is shown in Figure 5. According to the actual geological conditions of the strata, the length, width, and height (i.e., Y, X, and Z directions) of the model are 1000 m, 300 m, and 446.50 m, respectively. The numerical simulation software FLAC3D (5.00, Itasca Consulting Group, Inc., Minneapolis, Minnesota, USA) was used. The established numerical model is shown in Figure 6. The rock core obtained was tested, and the mechanical parameters of each stratum were obtained, as shown in Table 1.
According to the above design scheme, the model is used to simulate the excavation of #2 coal seam, and the development height of water-conducting fracture after mining is analyzed. Figure 7 shows the change of the failure range of the roof and floor during the advance process.
As shown in Figure 7, when the working face advances to 50 m, the height of the roof fracture zone reaches 35 m; when the working face advances to 150 m, the height of the roof fracture zone reaches 57 m; when the working face advances to 200 m, the height of the roof fracture zone increases to about 68 m. As the working face continues to advance, the height of the overburden fracture zone develops slowly and does not increase after reaching the maximum of 73 m.

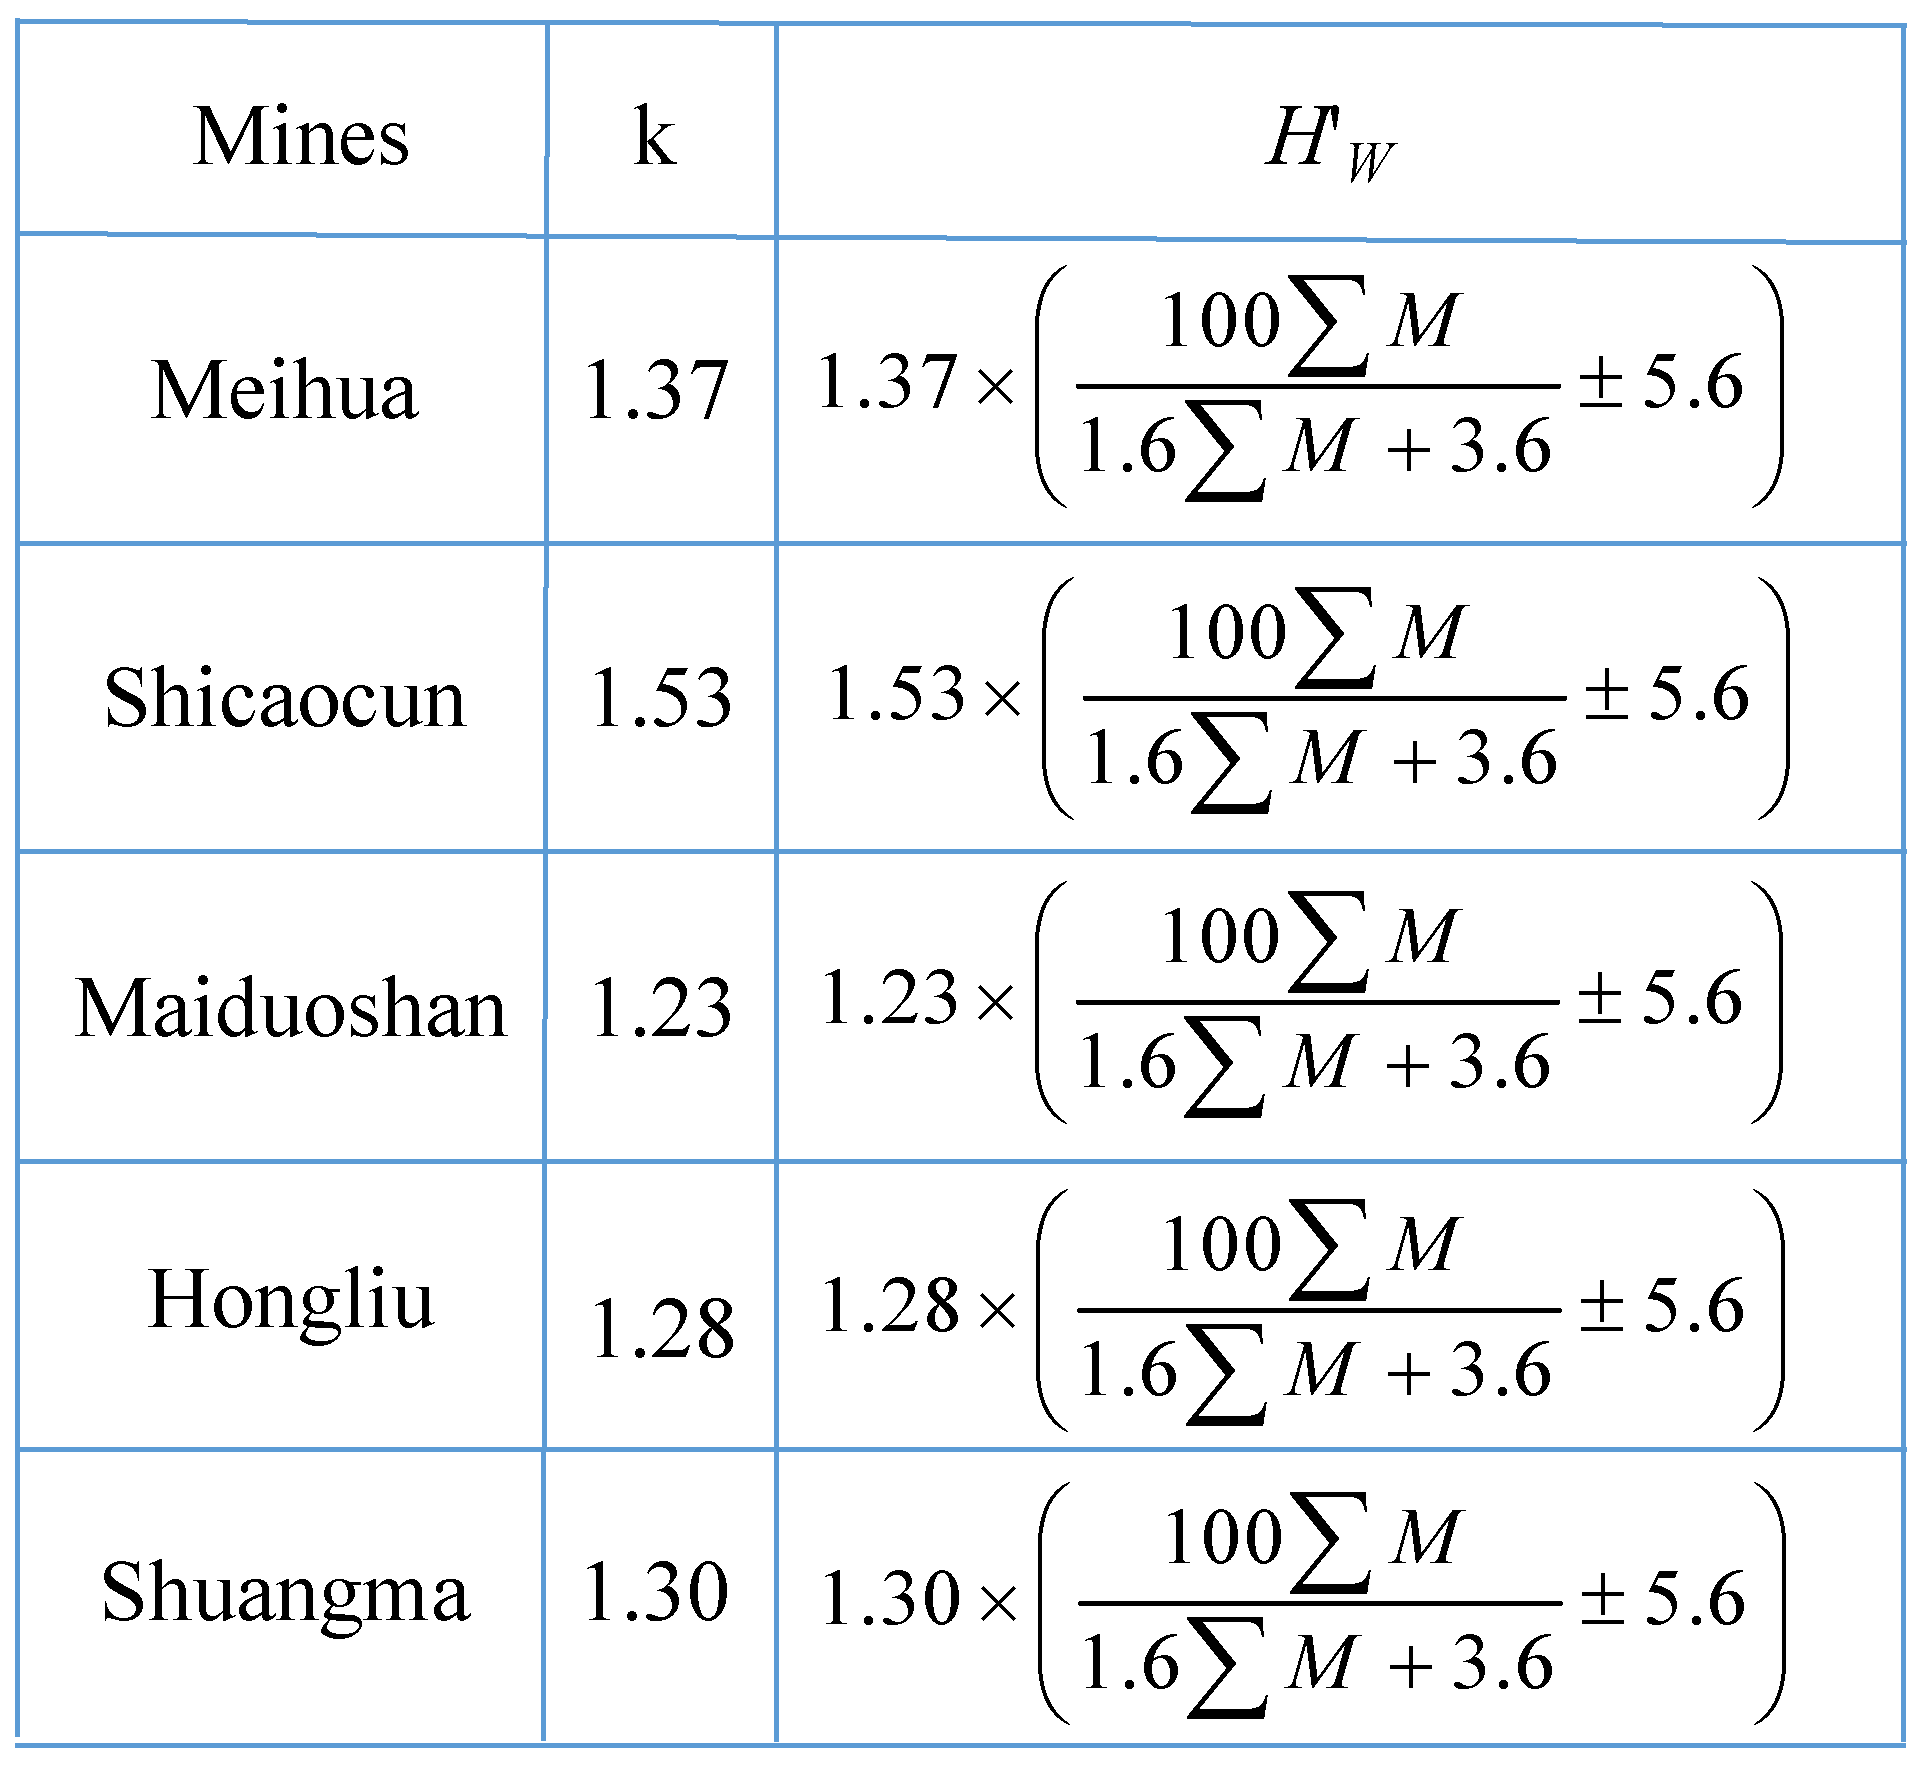
3.3. Correction and Calculation of Development Height of Water-Conducting Fracture Zone

Through the numerical simulation analysis, the development height of the water-conducting fracture zone of each mining area is determined: 72.2 m of Meihuajing, 83 m of Shicaocun, 73 m of Hongliu, 66 m of Maidongshan, and 67.6 m of Shuangma. According to the empirical formula, the maximum fracture height of each mine is 52.8 m in Meihuajing, 54.5 m in Shicaocun, 57.3 m in Hongliu, 53.7 m in Maidongshan, and 51.8 m in Shuangma. The results of numerical simulation are compared with that of empirical formula, and a ratio coefficient k is obtained. The empirical formula is modified by proportion, and the development height HW of the water-conducting fracture zone after the modification of each mine is obtained (Figure 8).
According to the modified calculation formula of the development height of the water-conducting fracture zone and the thickness of the coal seam of each mine obtained from the drilling data, the development height of the water-conducting fracture zone after the mining is calculated for each mining area, and the corresponding contour map is shown in Figure 9.
According to Figure 9, the development heights of the roof water-conducting fracture zone are beyond the total thickness of aquifer III and aquiclude III, except in the southern part of Maduoshan mine. There is no effective water-resisting layer between the aquifer III in the lower part of Zhiluo formation and the main mining coal seam. There are high development heights of the water-conducting fracture zone in the northeast of Meihuajing, the west of Shigoucun, the north of Hongliu, the north of Maiduoshan, and the south of Shuangma mining areas. Therefore, in the study area, aquifer III in the lower part of Zhiluo formation is mostly the direct overburden roof of #2 coal seam, partial or the total thickness of aquifer III enters the water fracture zones, forming the direct water-source aquifer of #2 coal seam. However, owing to the thick aquiclude III of Zhiluo formation in most areas, the water-conducting fracture zone is not developed to the aquifer II and aquifer I of Zhiluo formation. Therefore, under the action of overflow recharge, the aquifers II and III of Zhiluo formation are indirect water-inrush aquifers. In some areas, owing to the thin aquifer III and aquiclude III of Zhiluo formation, the aquifer II of Zhiluo formation is also channeled by fractures and becomes a direct water-source aquifer.

4. Evaluation of the Water Abundance of the Sandstone Aquifer of the Roof within the Development Height of the Water-Conducting Fracture Zone

4.1. Variation Characteristics of Sandstone Aquifer Thickness within the Development Height of Water-Conducting Fracture

The thickness of the reservoir rock layer is the key factor to determine the water-abundance strength of aquifer and the storage state of groundwater [24]. When the coefficient of hydraulic conductivity is used to evaluate the water abundance, the variation of the hydraulic conductivity is controlled by the thickness of the water-bearing rock layer if the influence of the hydraulic conductivity is ignored. The aquifer of the water-conducting fracture zone is the direct water-inrush aquifer of the coal seam, so the thickness of the aquifer within the development height of the water-conducting fracture zone is taken as the standard to evaluate the water abundance of rock strata. According to the geological data, the contour map of the total thickness of sandstone within the fracture zone is made (Figure 10). It is worth noting that, when the water-conducting fracture zone passes through the aquifer floor, the aquifer within the whole influence range of fracture is considered to be the direct source of mine water. Therefore, the total thickness of the aquifer within this range should be counted.
It can be seen from Figure 10 that the total thickness of sandstone within the influence range of the water-conducting fracture zone is 0–291.50 m, with an average thickness of 77.6 m. Maiduoshan has the thickest and most wide distribution of sandstone, followed by Hongliu and Shicaocun; Shuangma and Meihuajing have relatively thin sandstone. The thickness of sandstone is mainly between 40 and 60 m for Meihuajing; 60 and 80 m for Shicaocun; 100 and 140 m for Maiduoshan; and 80 and 100 m for Hongliu; while Shuangma has a relatively even distribution of sandstone, mainly between 40 and 80 m.

4.2. Establishment of Lithology Influencing Index for the Roof

In this study, the lithology influencing index (LII) is established to quantitatively describe the effect of combination characteristics of coal seam roof lithology and the thickness of aquifer on the water abundance. The specific calculation method of LII is as follows: (1) the thickness of the water-bearing medium, including the thickness of medium-grained sandstone and fine-grained sandstone, is multiplied by a conversion coefficient, and the calculated result is equivalent to the thickness of coarse-grained sandstone; (2) the content of sandstone, the number of sand mud combination layers, core recovery percentage, and other factors are considered for the establishment of LII.

4.2.1. Equivalent Thickness of Lithology

Generally, the coarser the sandstone particles, the better the water abundance. In this study, the thickness of medium-grained sandstone and fine-grained sandstone is converted into the thickness of coarse-grained sandstone: medium-grained sandstone times the equivalent coefficient of 0.8, and fine-grained sandstone times the equivalent coefficient of 0.6.

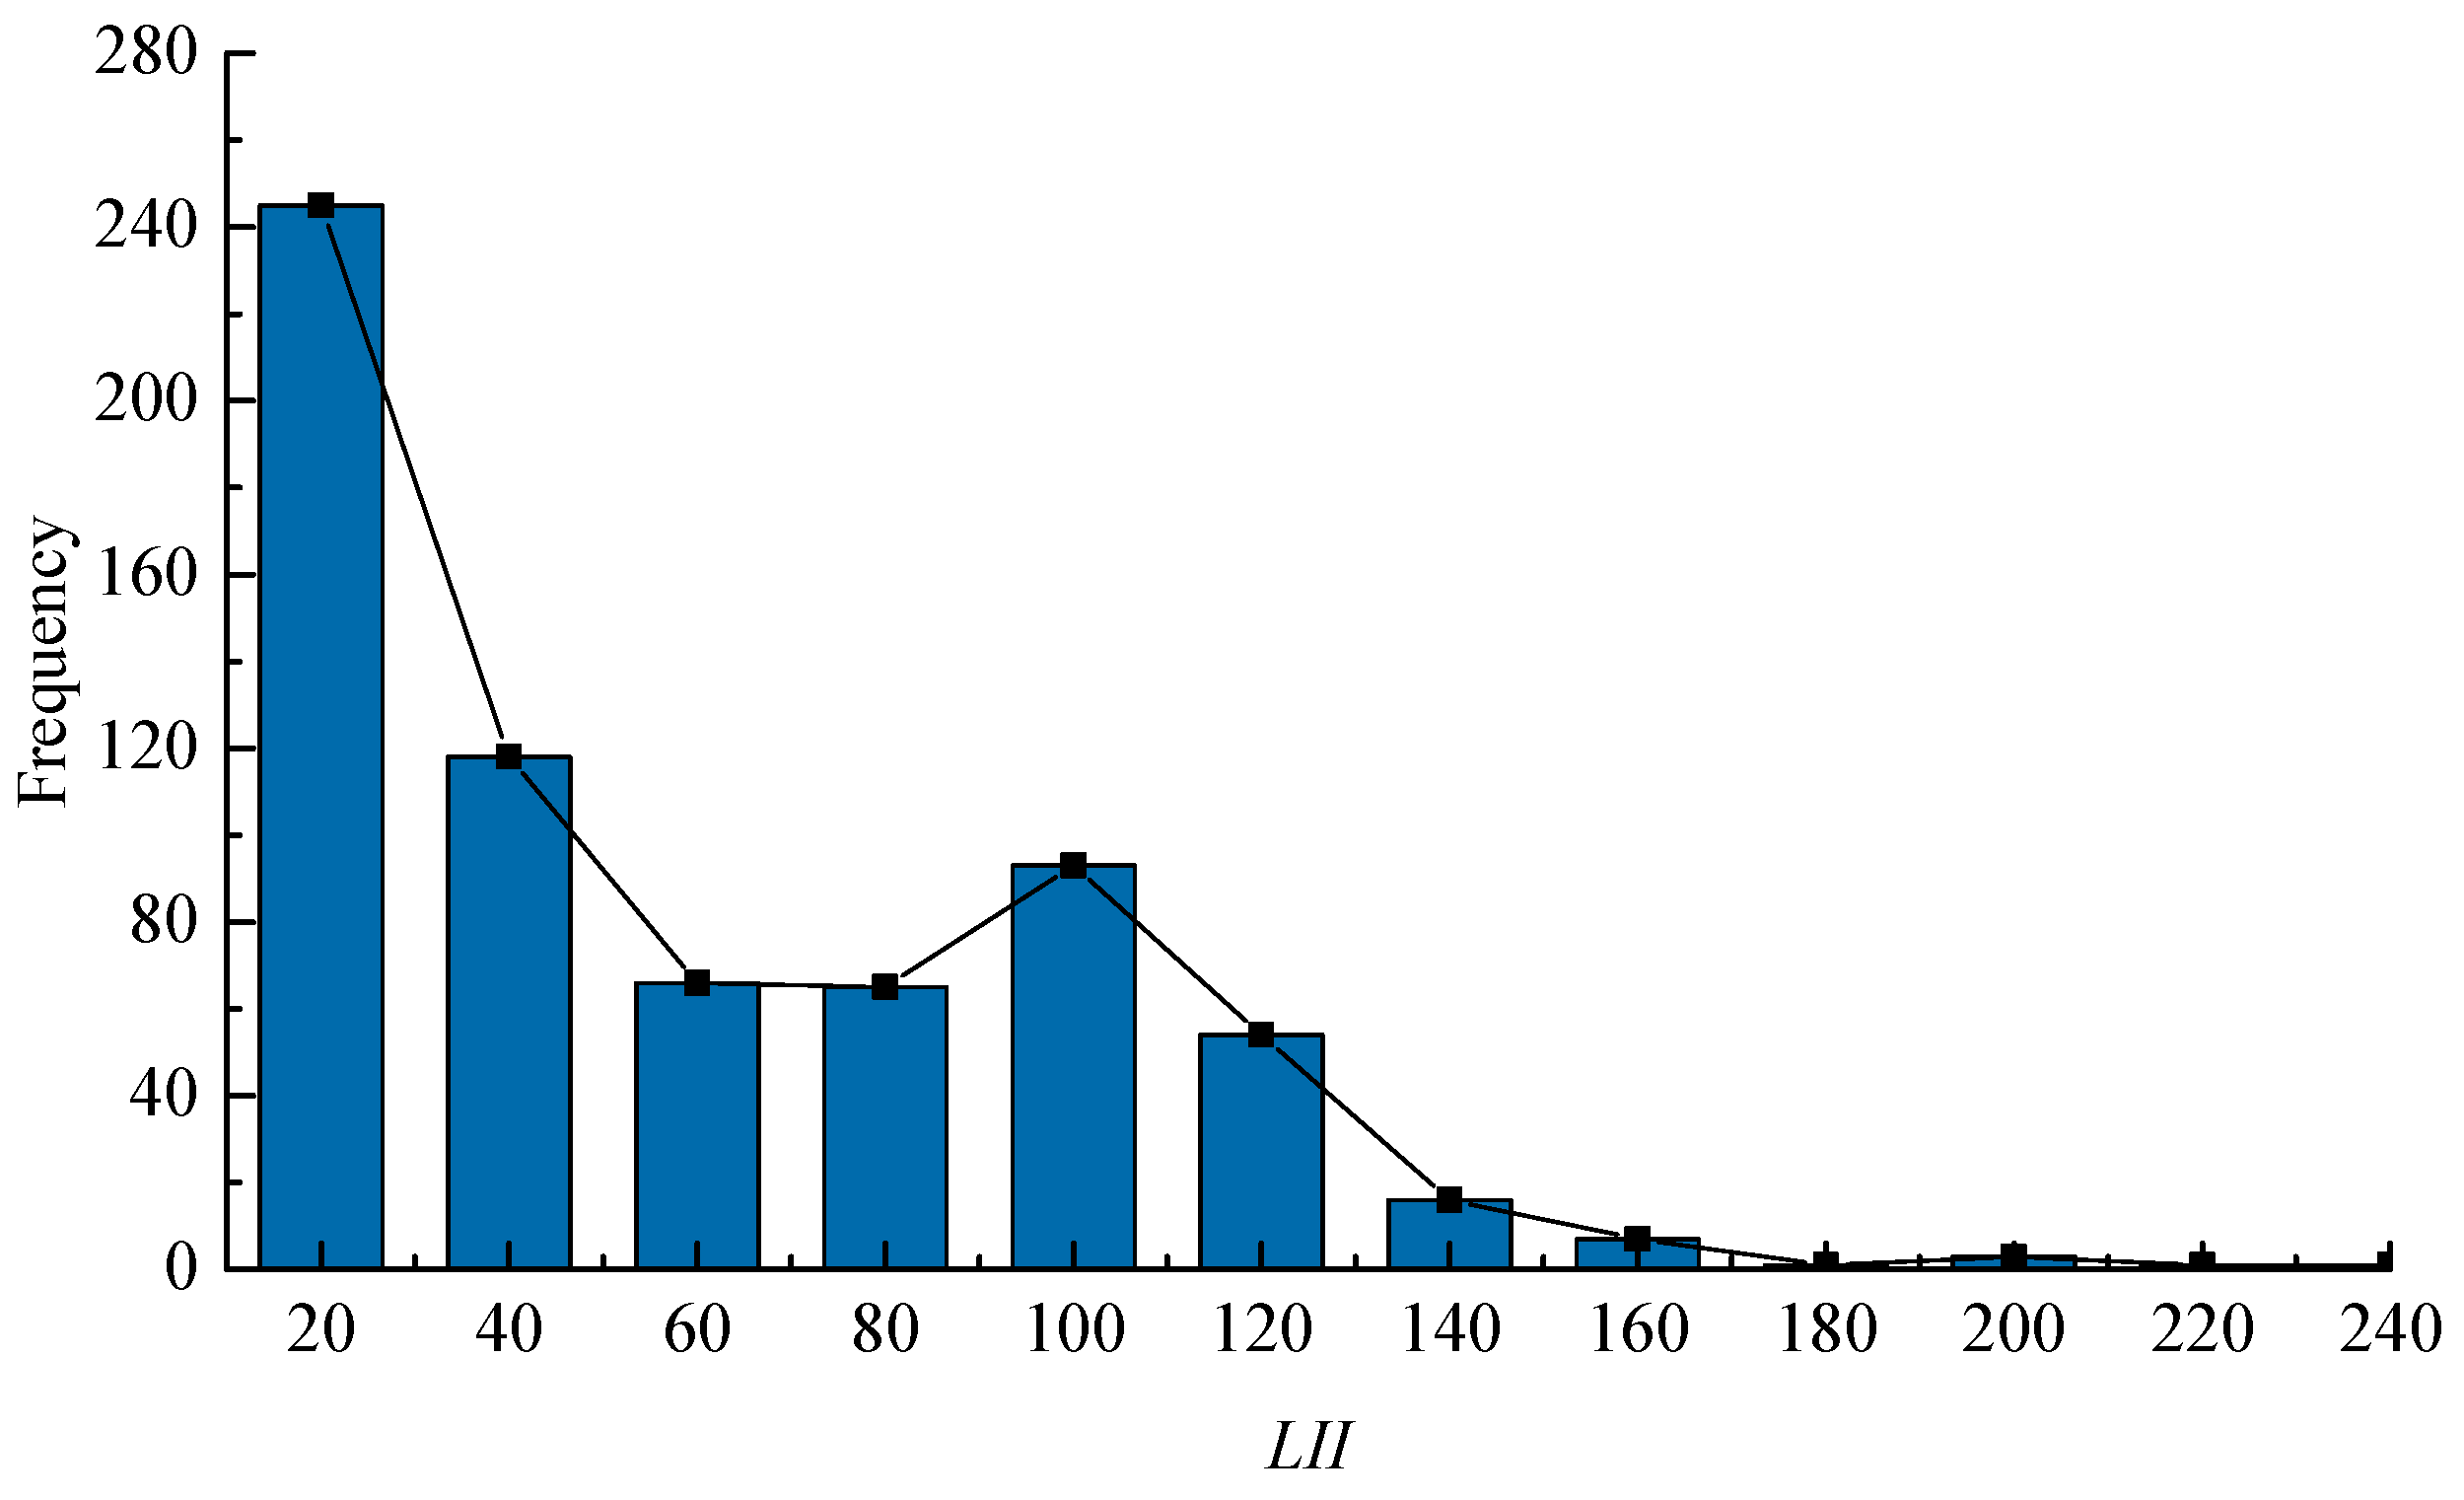
4.2.2. Establishment of LII

The higher the content of sandstone, the greater the proportion of water-bearing medium, and the higher the water abundance property. Therefore, the percentage of sandstone is positively correlated with the LII under the unchanged condition. Besides, the more the sand-mud interbedding combination, the weaker the water-conducting property, and the more obvious the water resistance property. Hence, the number of sand-mud interbedding layers is negatively correlated with the LII under the unchanged condition. On the basis of the above analysis, the expression of the lithology influencing index (LII) is constructed as follows:
L I I = ( M c g + a × M m g + b × M f g ) n
where LII is the lithology development influence index; Mcg, Mmg, and Mfg are the thickness of coarse-grained sandstone, medium-grained sandstone, and fine-grained sandstone, respectively. a, b are the equivalent ratios of medium-grained sandstone and fine-grained sandstone, and a = 0.8 and b = 0.6. Ps is the total percentage of coarse-grained sandstone, medium-grained sandstone, and fine-grained sandstone of one drilled core. n is the interbedding number of mudstone (or siltstone) and sandstone.

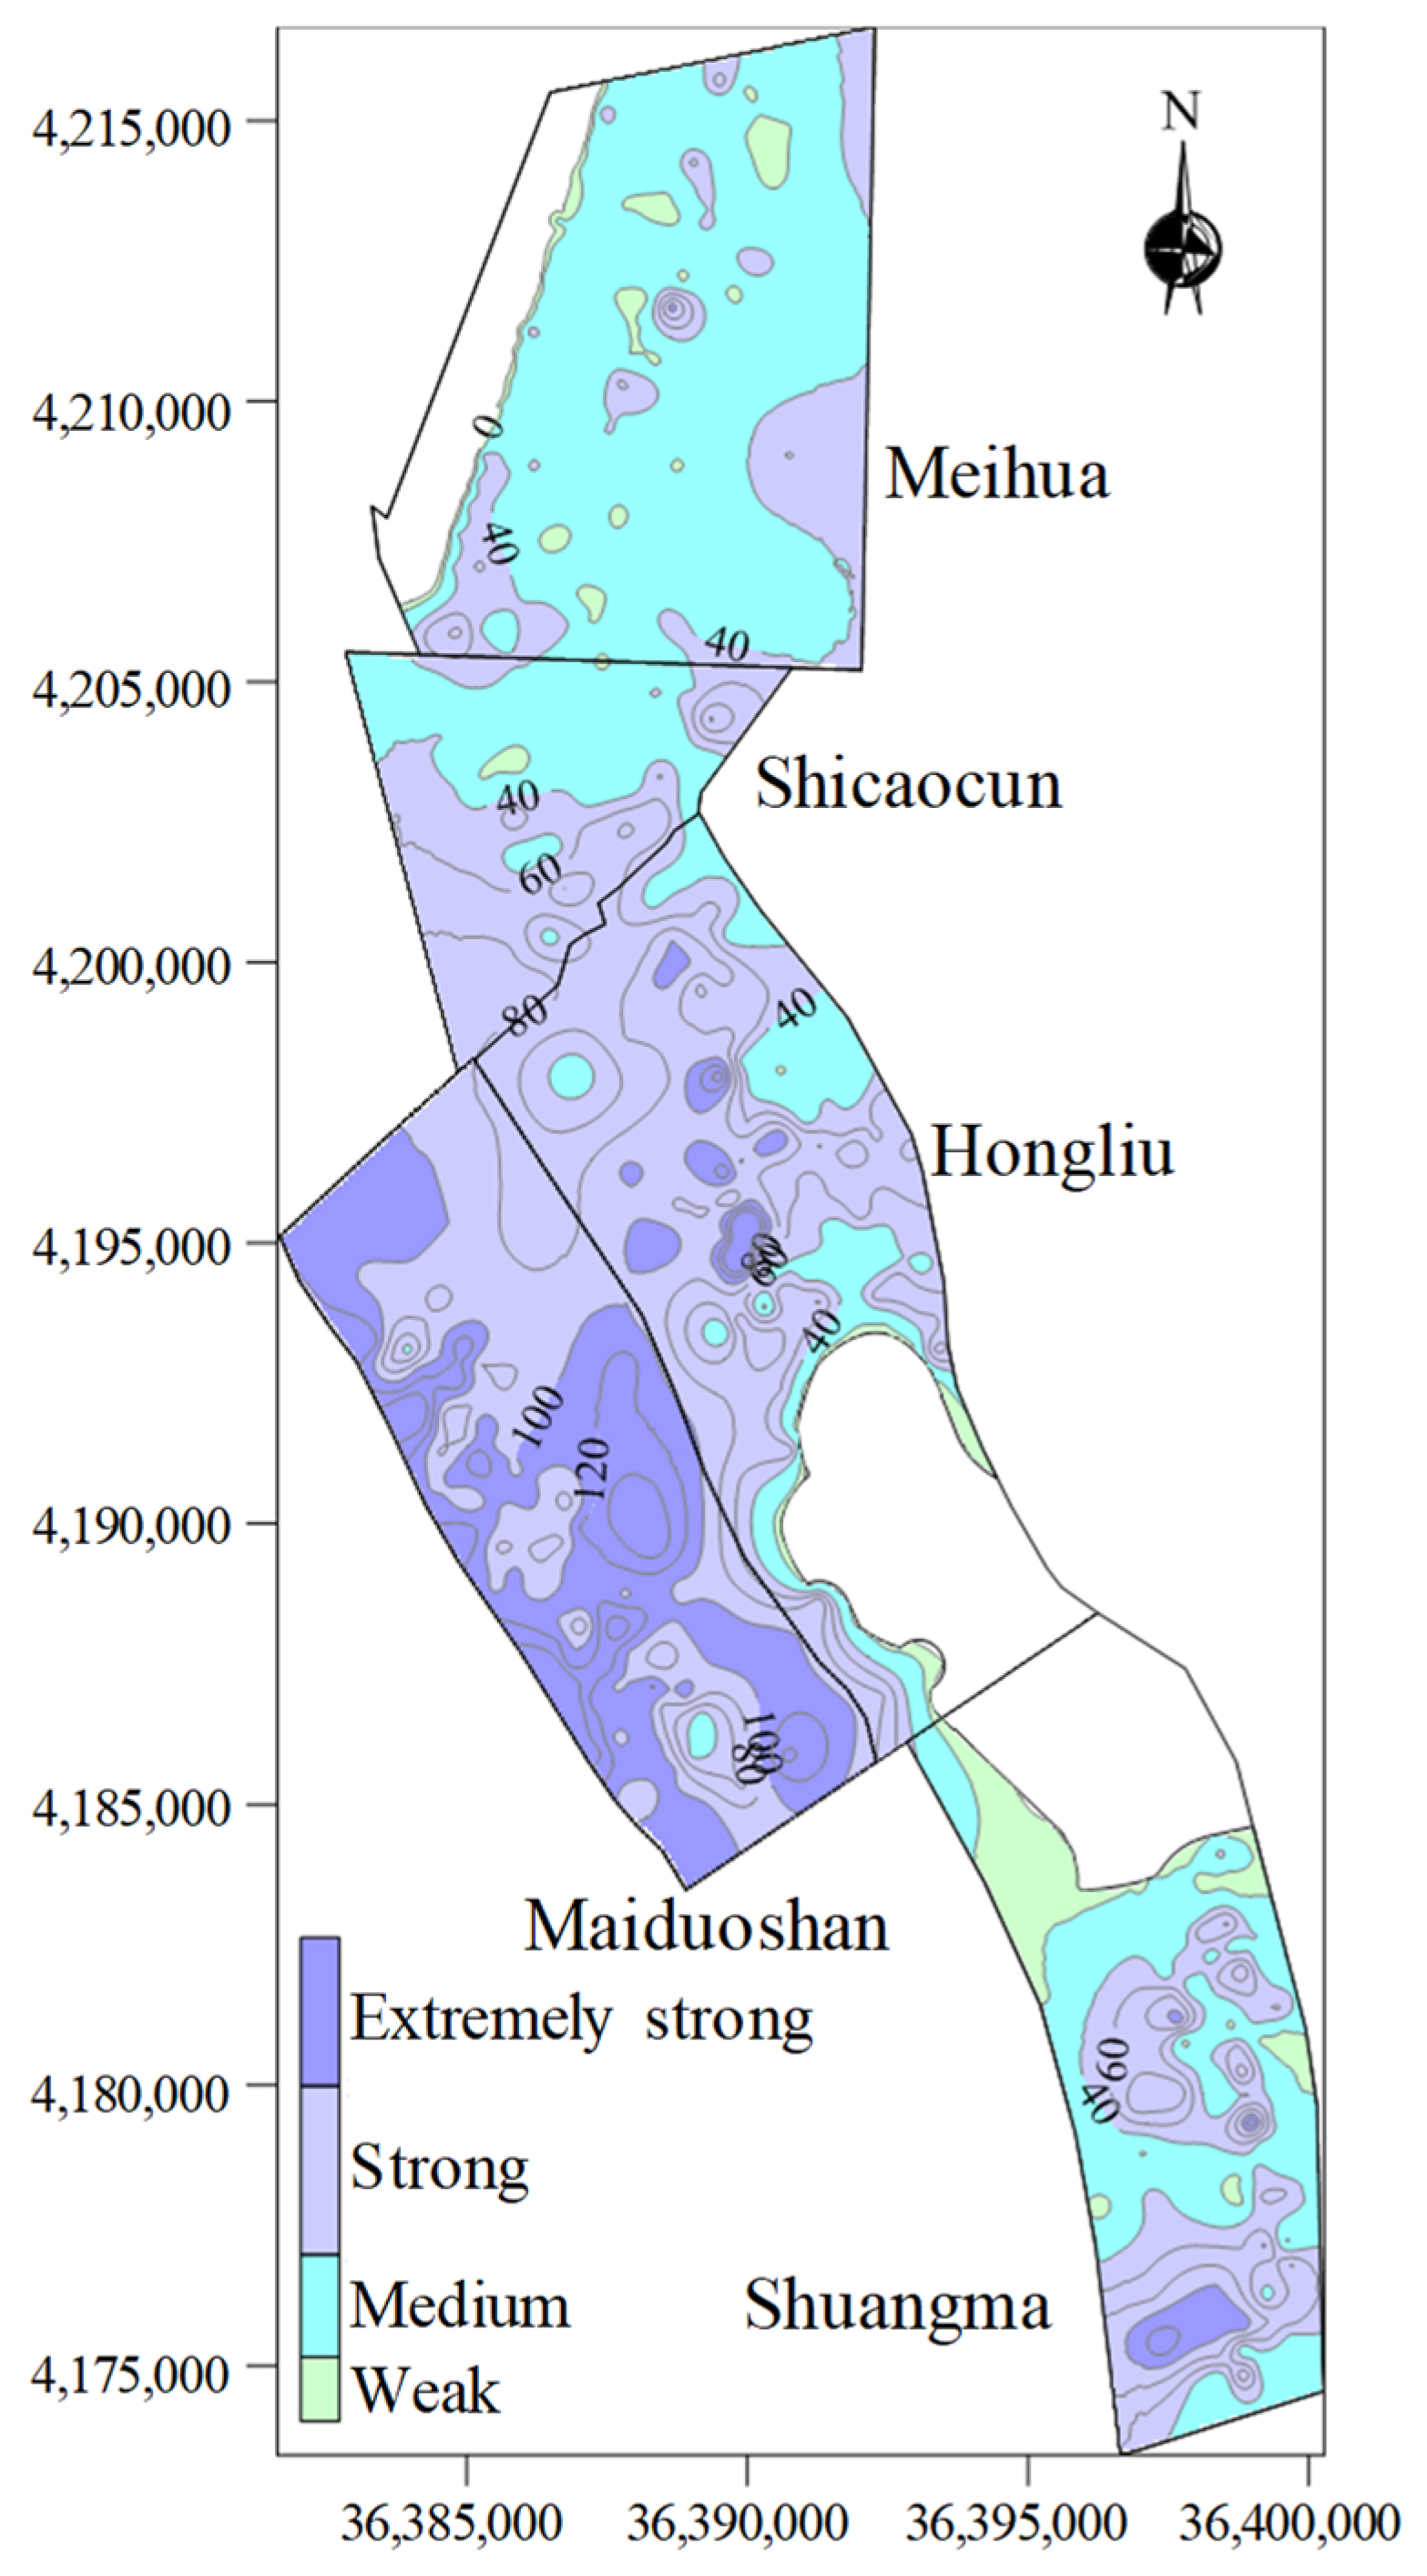
4.3. Water Abundance Analysis

Through the LII, the influence of sandstone particle size, water abundance difference between different media, and lithology combination structure on water abundance can be considered comprehensively. Thus, LII can be used to evaluate the water abundance of the aquifer.
According to statistical data, the corresponding data in each borehole of each mine are substituted into Equation (2), and LII of each borehole in the mine is calculated. As shown in Figure 11, the statistical results of LII values are expressed in a histogram, and the partition thresholds of 10, 40, and 100 are obtained. LII 0–10 is defined as the region with weak water abundance, LII 10–40 is the region with medium water abundance, LII 40–100 is the region with strong water abundance, and LII 100–240 is the region with extremely strong water abundance. Figure 12 shows the LII contour map.
It can be seen from Figure 12 that the south of Maiduoshan, Hongliu, Shicaocun, the southeast and southwest of Meihuajing, and the middle and south of Shuangma are areas with the extremely strong and strong water abundance; the north of Shicaocun, the north of Shuangma, and most of Meihuajing are areas with medium water abundance areas; while the south of Meihuajing, the south of Hongliu, and the north of Shuangma are areas with the weak water abundance. In the areas with strong water abundance, the risk of water inrush is also high. In the areas with weak and medium water abundance, the influence of coal mining on aquifer is weak. The method of drainage borehole can be used to ensure the safety of production. In areas with extremely strong and strong water abundance, the mining method should be changed. For example, the development height of water-conducting fracture zone can be reduced by limited-thickness mining and backfilling to realize water conservation mining and safety coal mining [25,26]. Considering the area ratios of the water abundance classes in one mine, the water abundance of one mine can be determined by water abundance classes that cover the most area of one mine. Thus, Maduoshan mine can be classified as a mine of extremely strong and strong water abundance. Similarly, Hongliu can be classified as a mine of strong water abundance, Shicaocun and Shuangma as mines of strong and medium water abundance, and Meihua as a mine of medium water abundance.

5. Engineering Practice

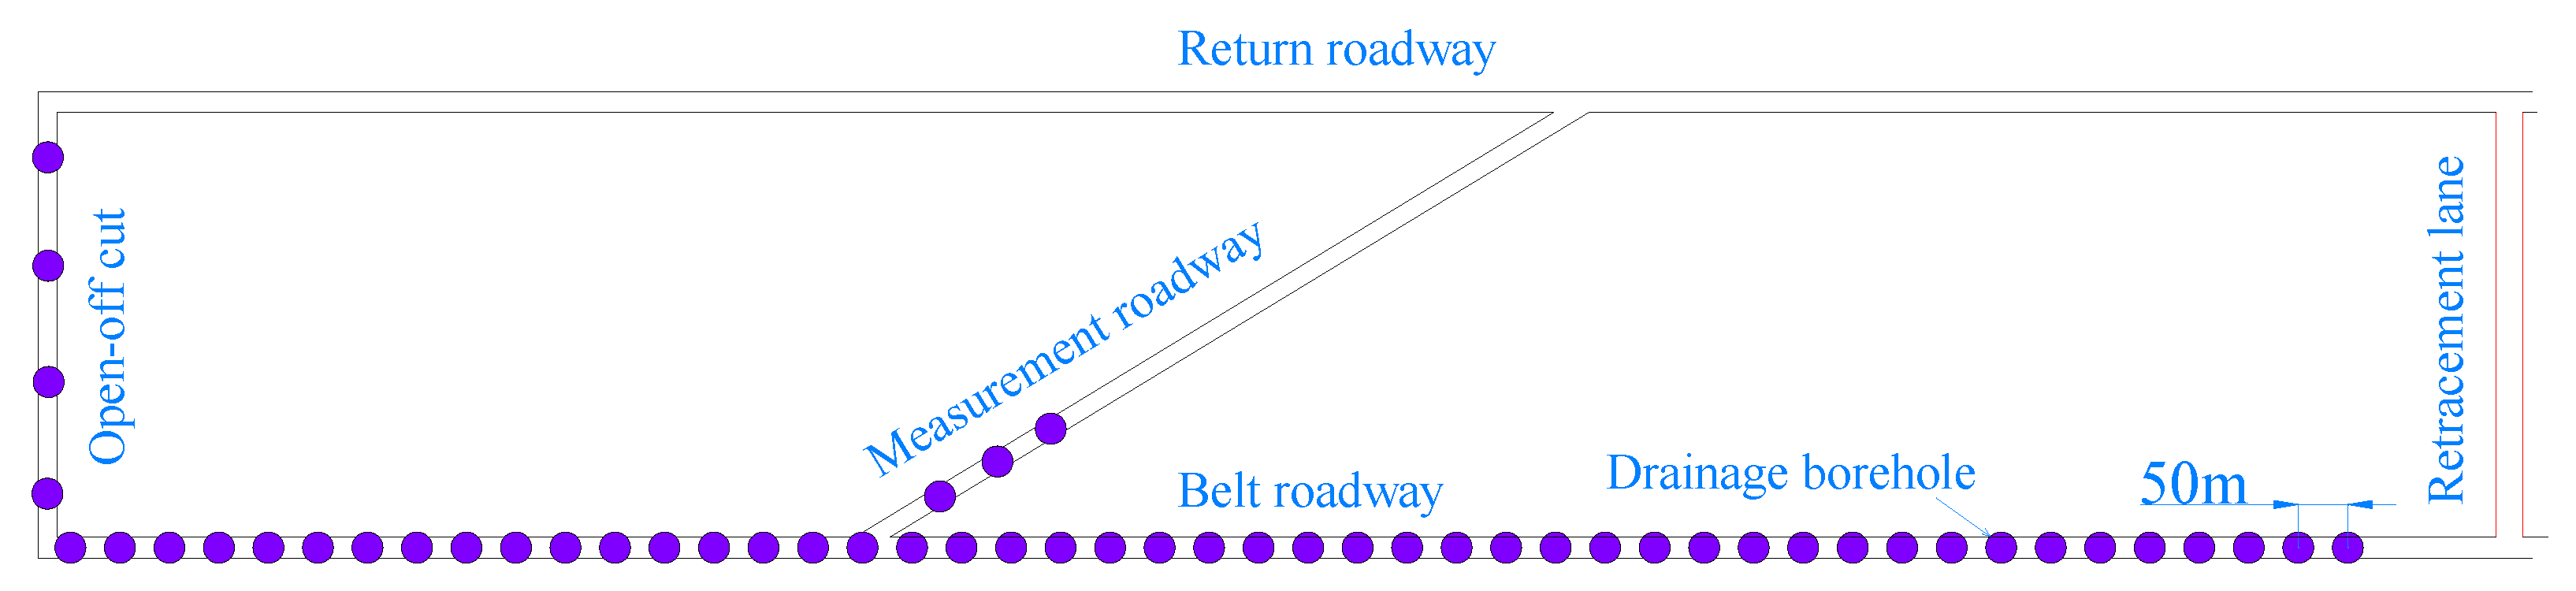
5.1. Arrangement of Drainage Borehole

Working face 112208 is located in the south end of Meihuajing coal mine, with the medium water abundance. The main source of groundwater recharge is atmospheric precipitation, followed by the overflow recharge between aquifers. It is estimated that the water inflow of the working face is small, so the method of roof drainage borehole is selected to control the water inflow of working face 112208. Before advancing the working face, 54 drainage holes were arranged, which were mainly located in the belt roadway, open-off cut, and measurement roadway (Figure 13). The elevation angle of the borehole was 60° and the depth of the borehole was the development height of the water-conducting fracture zone. If the depth of the borehole did not reach the development height of the fracture zone owing to the actual situation on site, it must be ensured that the vertical depth of the borehole in the aquifer III was no less than 10 m (Figure 14).

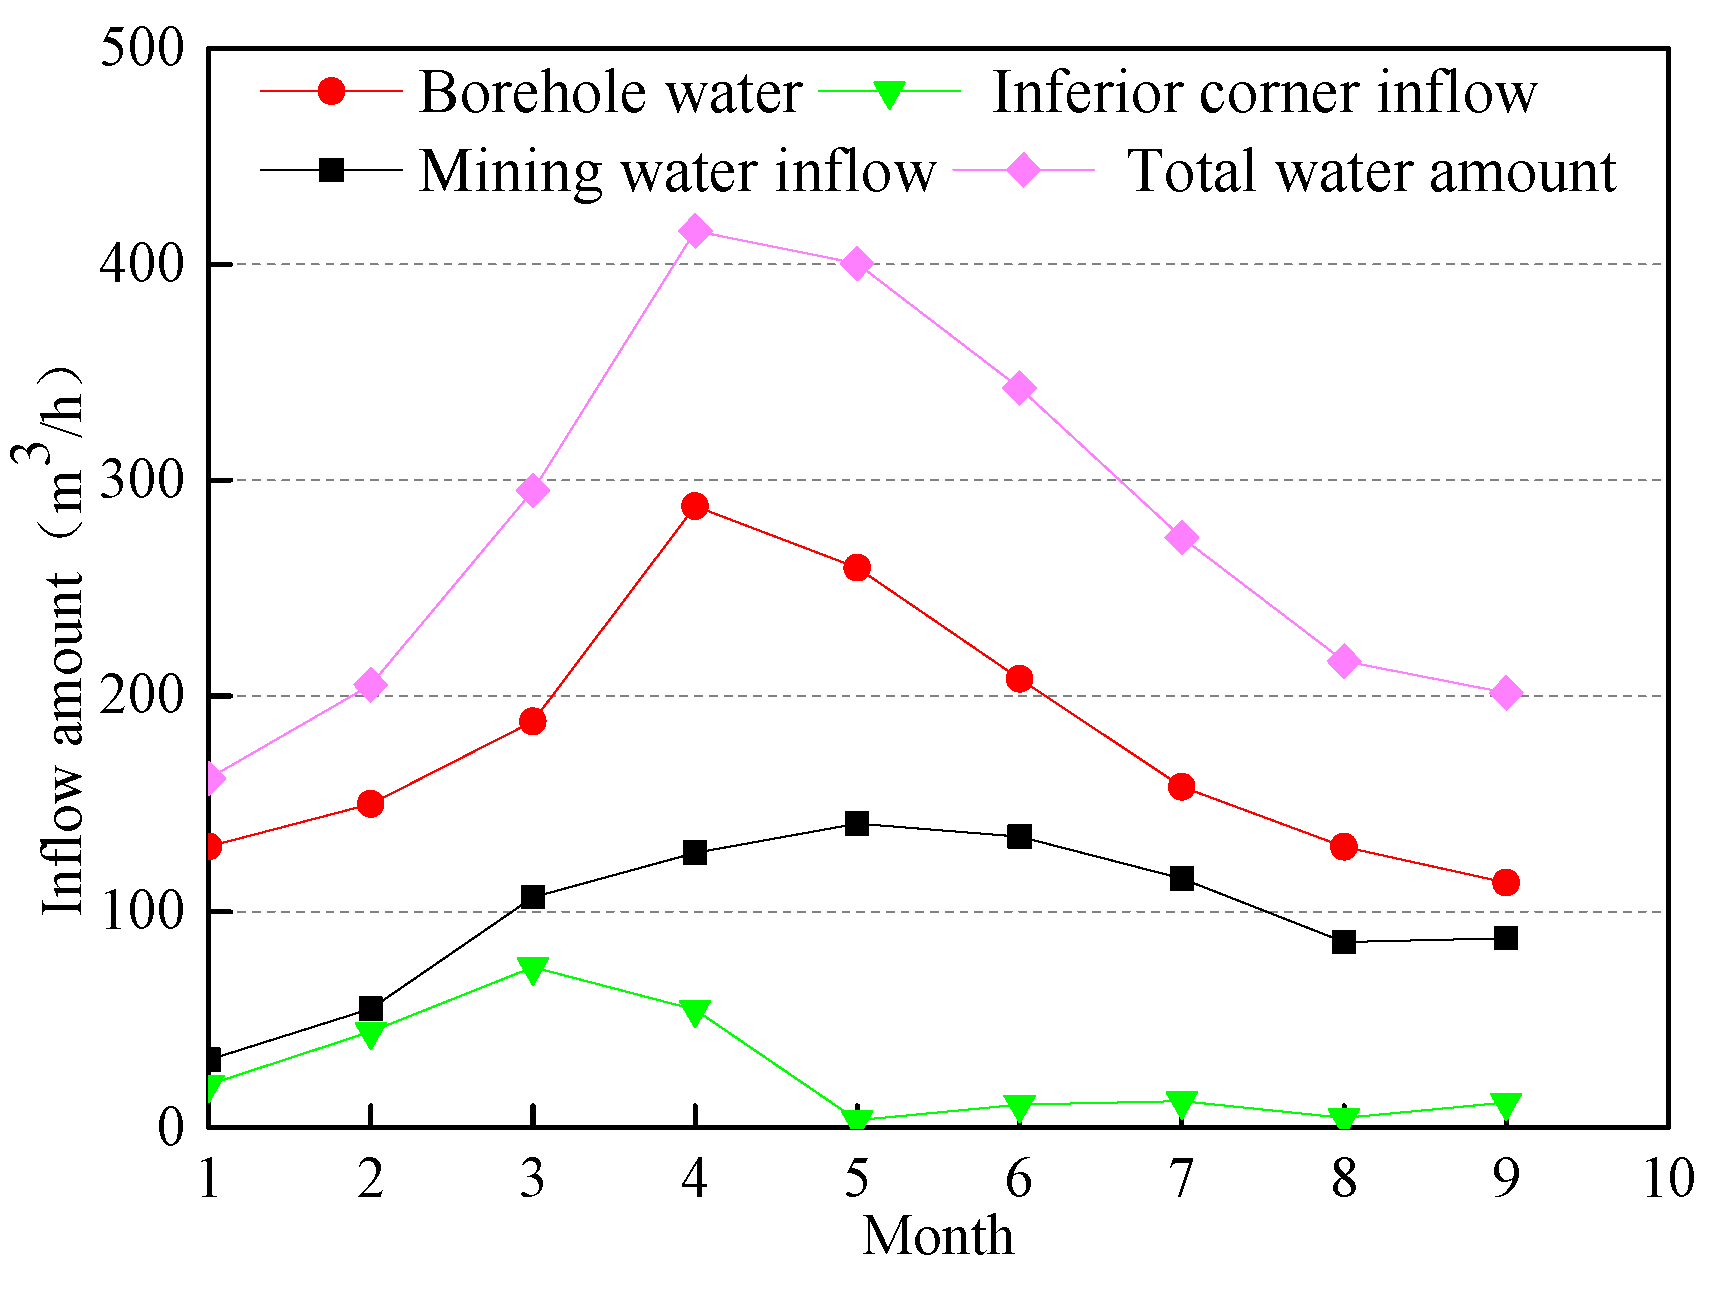
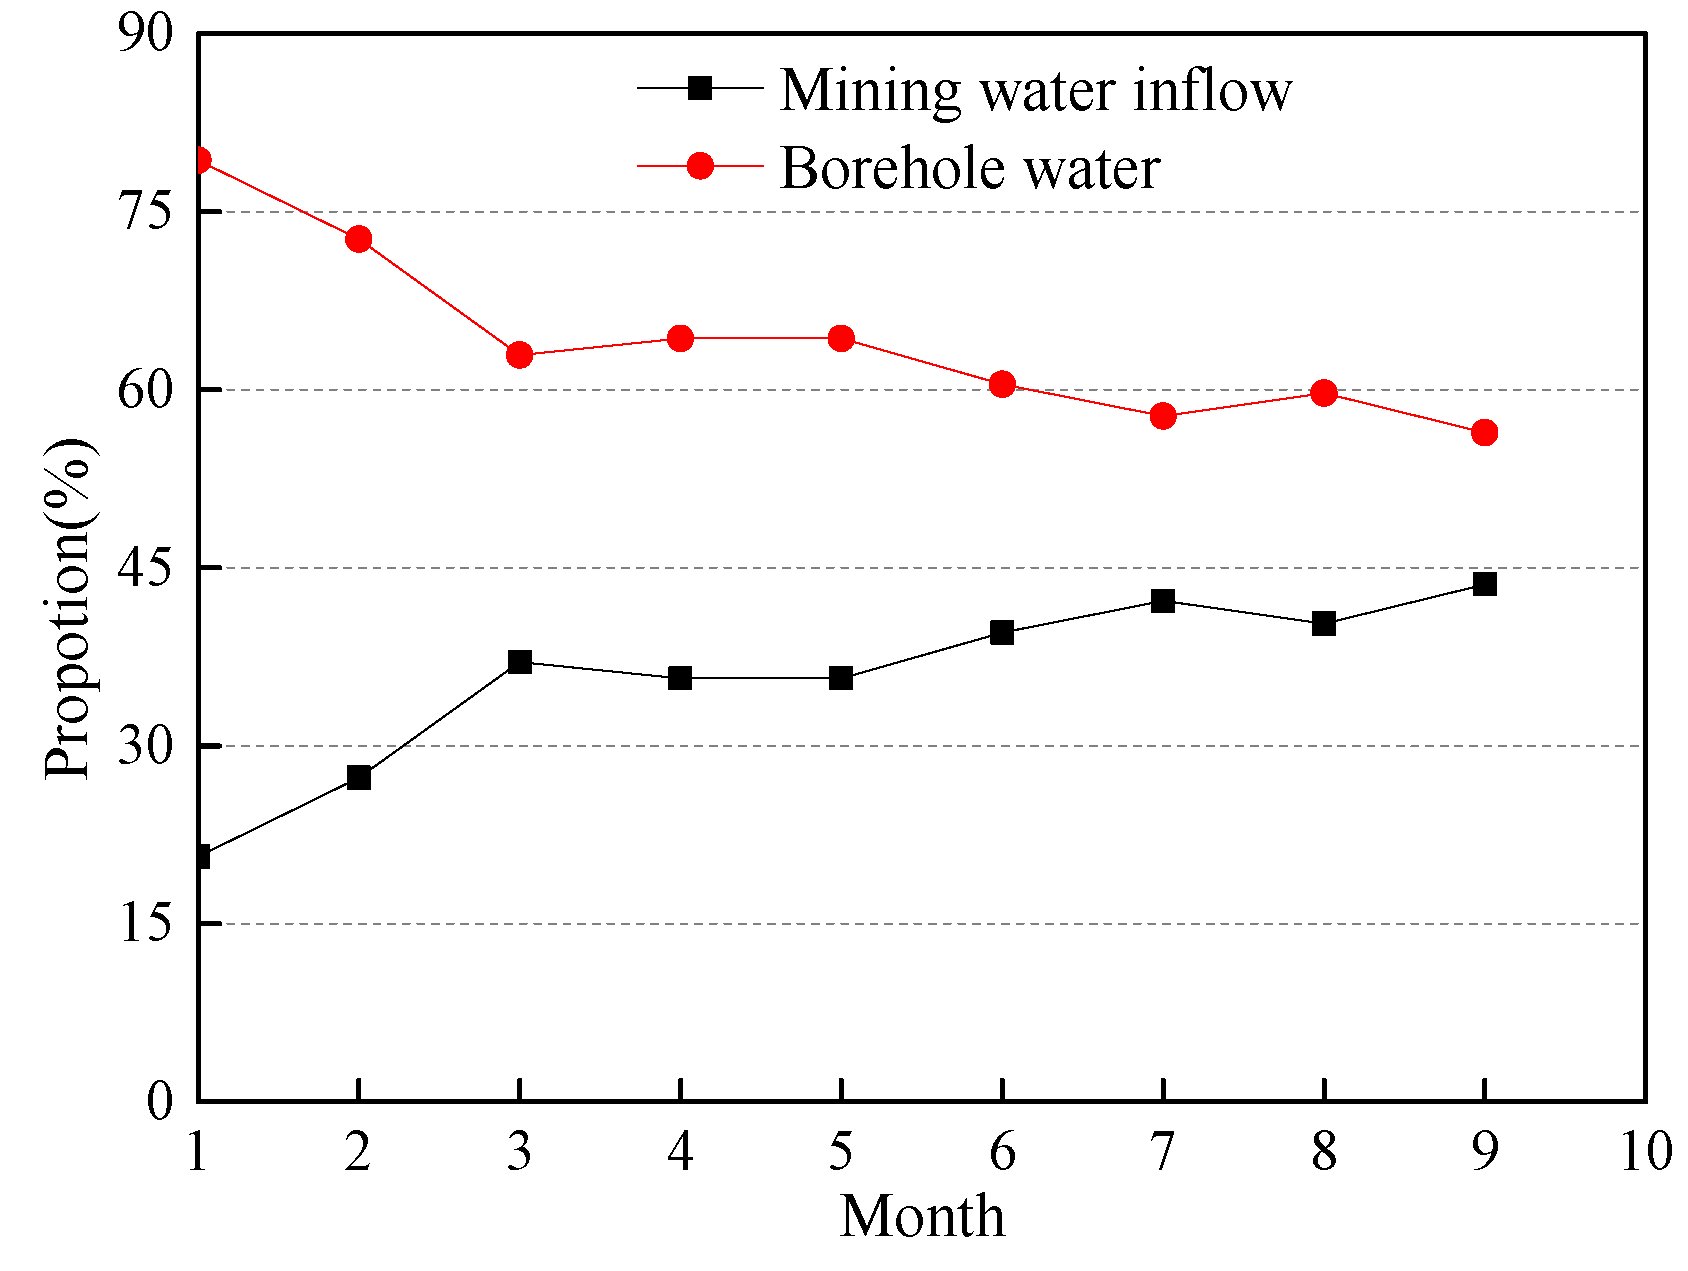
5.2. Pre-Drainage Effect of the Drilling

The total inrush water of a working face is composed of pre-drainage borehole water, mining inrush water, and inferior corner water. According to the water inflow composition of working face 112208, pre-drainage borehole water accounts for a high proportion. Although the total inrush water of the working face increases with the expansion of the roof mining fracture and caving zones, the fluctuation trend of the total inrush water in the working face is still mainly affected by the drainage borehole water. For example, according to the analysis of the changing trend of the monthly average inrush water in the mining process of the working face, the total inrush water of the working face rises and falls synchronously with the pre-drainage borehole water (Figure 15).
According to the source of water inrush in the working face, the pre-drainage borehole water also accounts for a high proportion. As shown in Figure 16, the proportion of the pre-drainage borehole water in the total inrush water of the working face generally decreases during the survey period, while the minimum is still 56.4%. The proportion is up to 80.5% and 73.1% in the two months of the initial mining stage (January and February 2016), indicating that the pre-drainage borehole measures greatly reduce the natural water inflow in the mining process and effectively control the post-mining water disaster.

6. Conclusions

The water abundance of sandstone aquifers in the roof of Zhiluo formation in Meihuajing, Shigoucun, Hongliu, Maiduoshan, and Shuangma mining areas are analyzed, and the following conclusions can be drawn:
  • The the development heights of the roof water-conducting fracture zone are beyond the total thickness of aquifer III and aquiclude III, except in the southern part of Maduoshan mine. Aquifer III in the lower part of Zhiluo formation is mainly the direct water-source aquifer of coal seam #2, while the aquifer II and aquifer I in Zhiluo formation are indirect water-source aquifers.
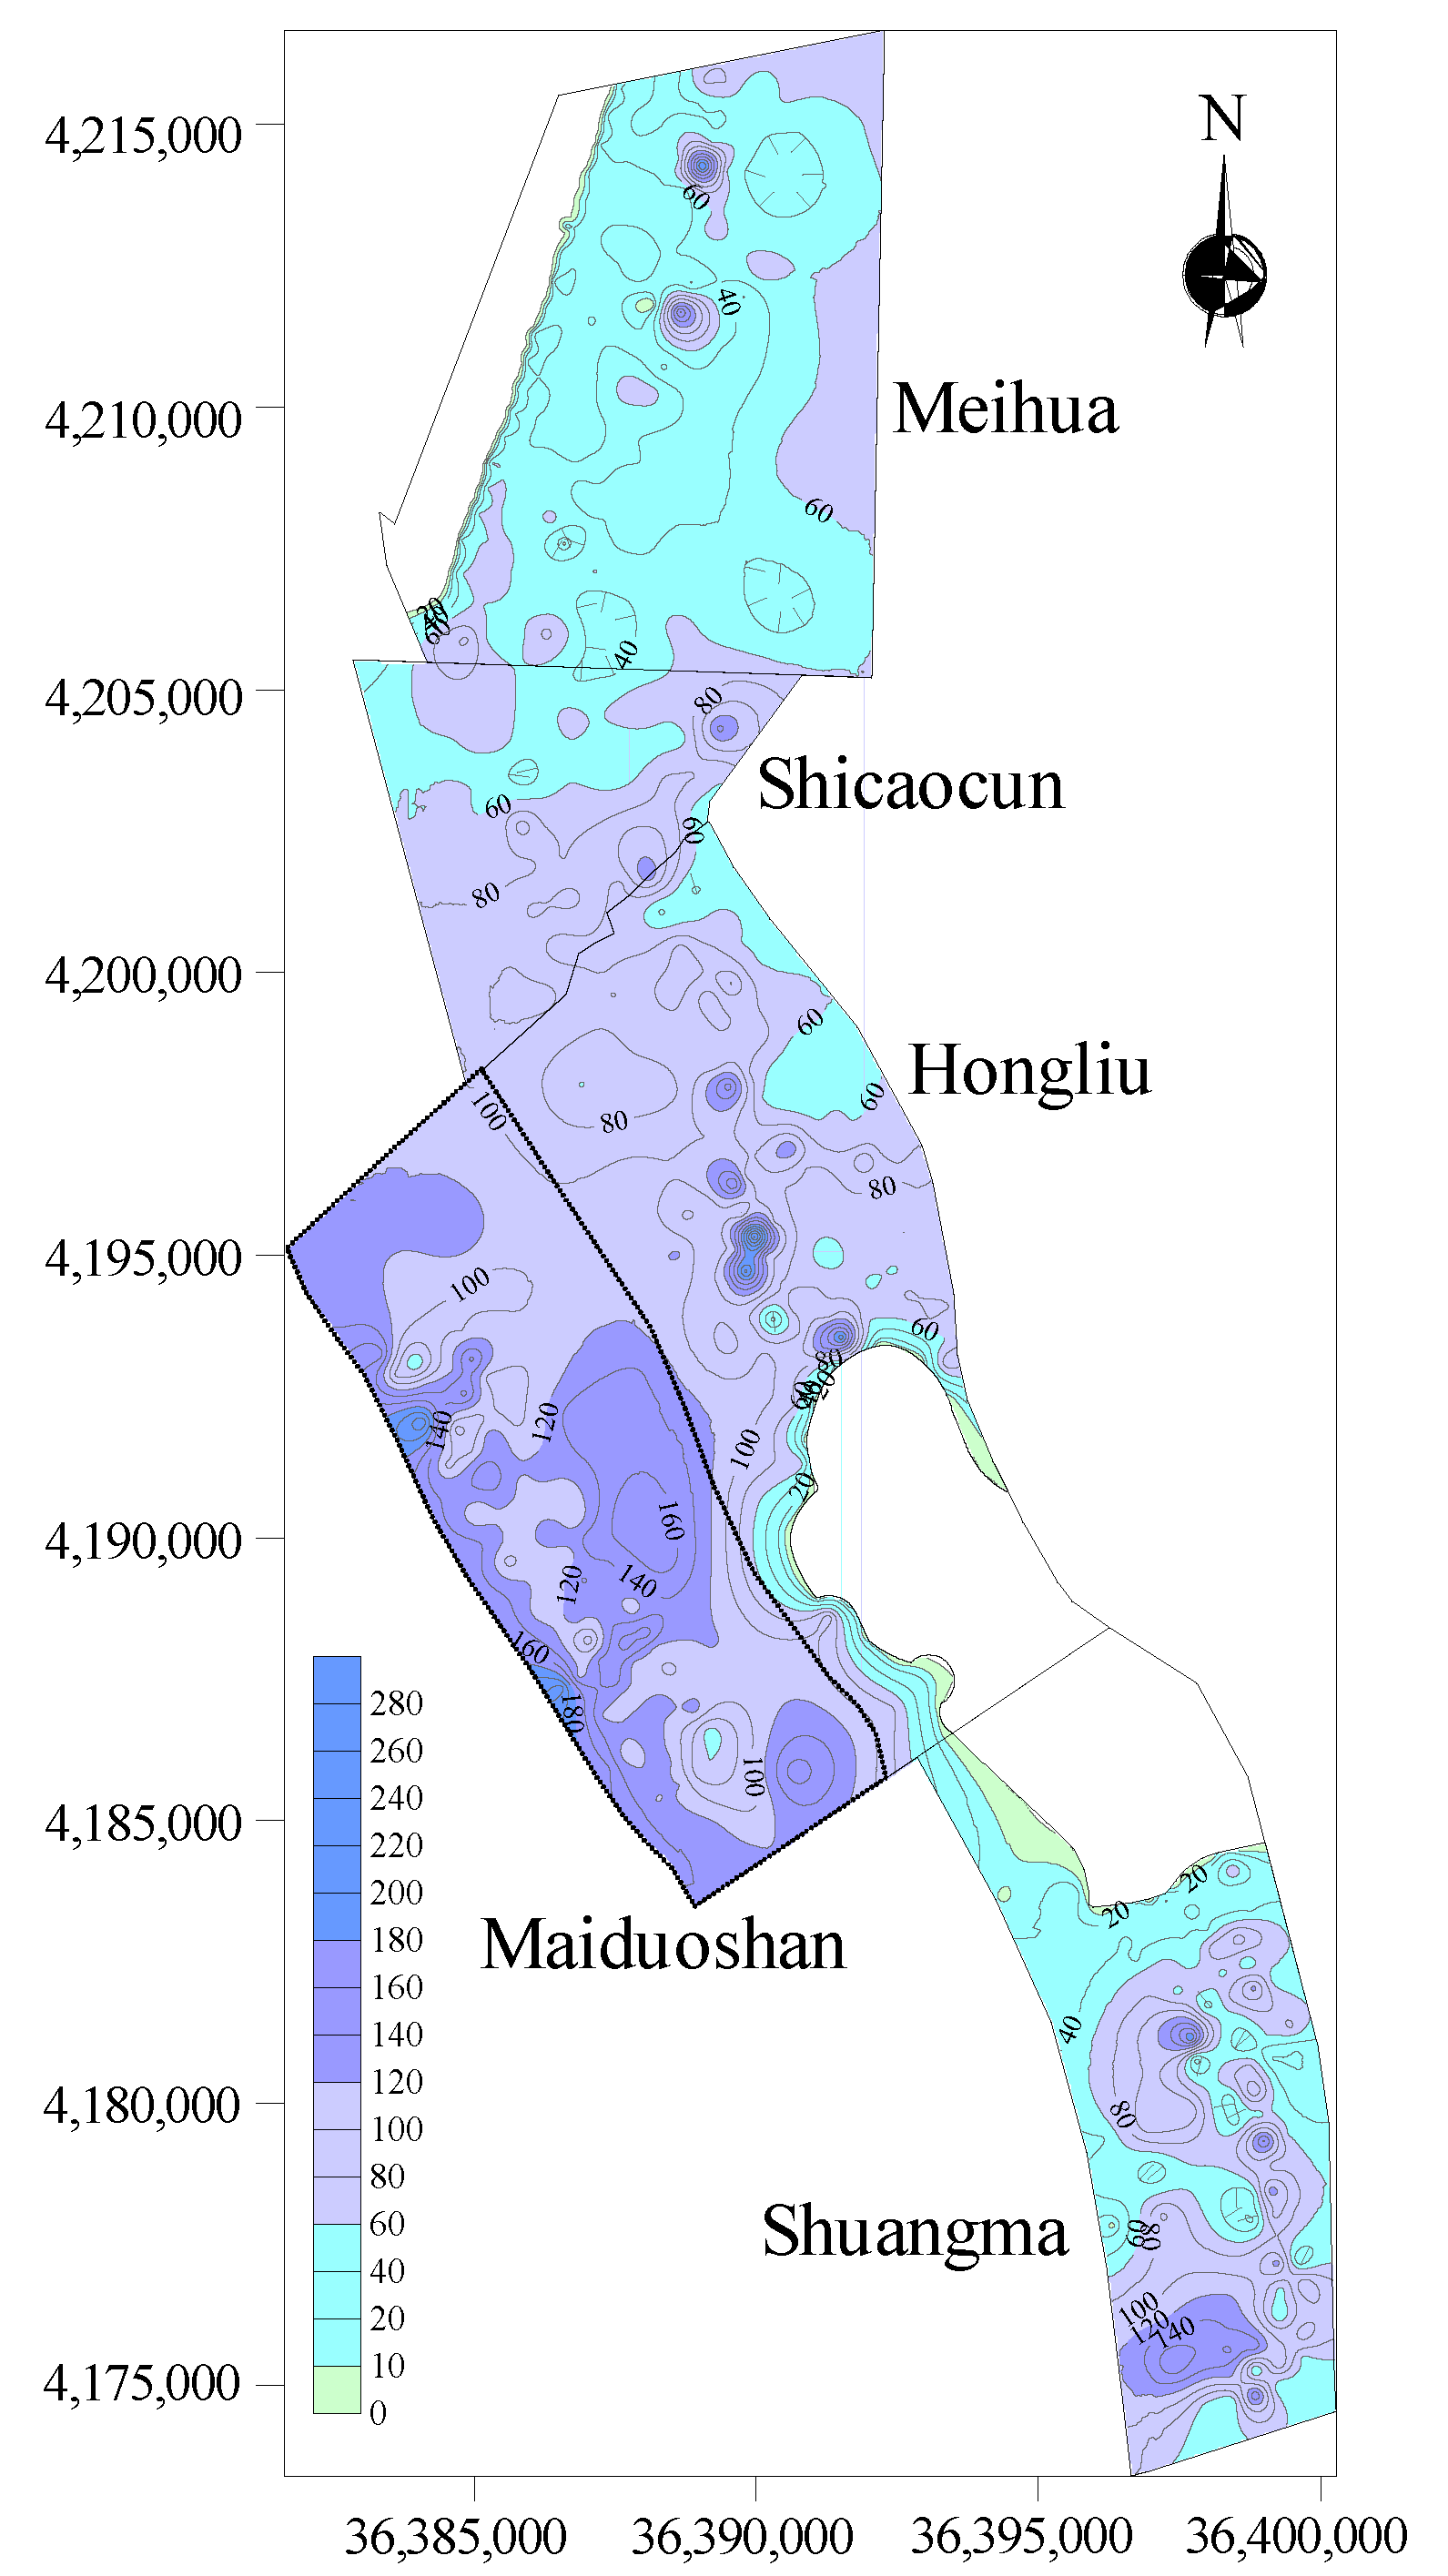
  • According to the partition thresholds of LII, 10, 40, and 100, the water abundance of areas can be classified as four classes; that is, extremely strong water abundance, strong water abundance, medium water abundance, and weak water abundance. The south of Maiduoshan, Hongliu, Shicaocun, the southeast and southwest of Meihuajing, and the middle and south of Shuangma mining areas are areas with extremely strong and strong water abundance; the north of Shicaocun, the north of Shuangma, and most of Meihuajing mining areas are areas with medium water abundance; while the south of Meihuajing, the south of Hongliu, and the north of Shuangma mining areas are areas with weak water abundance. Maduoshan mine can be classified as a mine of extremely strong and strong water abundance, Hongliu as a mine of strong water abundance, Shicaocun and Shuangma as mines of strong and medium water abundance, and Meihua as a mine of medium water abundance.
  • There were 54 drainage holes with an elevation angle of 60° arranged to drain the roof aquifer, most of which were arranged in the belt roadway with a relatively lower altitude. When the borehole depth reaches the development height of the water-conducting fracture zone, the pre-drainage of the roof water before mining can effectively reduce the mining inrush water.

Author Contributions

Resources, W.Z., and K.M.; investigation, W.Z.; writing-original draft, W.L.; Supervision, Y.H.; funding acquisition, Y.H.; Methodology, S.O.; format analysis, J.L., and H.G.; visualization, P.Z. All authors have read and agreed to the published version of the manuscript.

Funding

This research was funded by [the National Natural Science Foundation of China] grant number [51774269], [the National Key R&D Program of China] grant number [2018YFC0604705], and [the Natural Science Foundation of Jiangsu Province, China] grant number [BK20190031].

Conflicts of Interest

All authors have read, and declare no conflict of interest.

References

  1. Li, W.; Wang, Q.; Liu, S.; Wang, S. Grade types of water-preserved coal mining coalmines in ecologically fragile area. J. China Coal Soc. 2019, 44, 718–726. (In Chinese) [Google Scholar]
  2. Gu, D.; Zhang, Y.; Cao, Z. Technical progress of water resource protection and utilization by coal mining in China. Coal Sci. Technol. 2016, 44, 1–7. (In Chinese) [Google Scholar]
  3. Zhao, C.; Jin, D.; Geng, J.; Sun, Q. Numerical Simulation of the Groundwater System for Mining Shallow Buried Coal Seams in the Ecologically Fragile Areas of Western China. Mine Water Environ. 2018, 38, 158–165. [Google Scholar] [CrossRef]
  4. Tahmasebinia, F.; Zhang, C.; Canbulat, I.; Sepasgozar, S.; Saydam, S. A Novel Damage Model for Strata Layers and Coal Mass. Energies 2020, 13, 1928. [Google Scholar] [CrossRef] [Green Version]
  5. Huang, Y.; Zhang, J.; Yin, W.; Sun, Q. Analysis of Overlying Strata Movement and Behaviors in Caving and Solid Backfilling Mixed Coal Mining. Energies 2017, 10, 1057. [Google Scholar] [CrossRef] [Green Version]
  6. Ning, J.; Wang, J.; Tan, Y.; Xu, Q. Mechanical mechanism of overlying strata breaking and development of fractured zone during close-distance coal seam group mining. Int. J. Min. Sci. Technol. 2020, 30, 207–215. [Google Scholar] [CrossRef]
  7. Hou, E.; Che, X.; Feng, J.; Duan, Z.; Gao, L.; Li, J. Abundance of aquifers in Yushenfu coal field and the measures for water-preserved coal mining. J. China Coal Soc. 2019, 44, 812–819. (In Chinese) [Google Scholar]
  8. Ma, L.; Du, X.; Wang, F.; Liang, J. Water-preserved Mining Technology for Shallow Buried Coal Seam in Ecologically-vulnerable Coal field: A case study in the Shendong Coal field of China. Disaster Adv. 2013, 6, 268–278. [Google Scholar]
  9. Bukowski, P. Evaluation of water hazard in hard coal mines in changing conditions of functioning of mining industry in upper silesian coal basin—USCB (POLAND). Arch. Min. Sci. 2015, 60, 445–475. [Google Scholar] [CrossRef] [Green Version]
  10. Zha, H.; Liu, W.; Liu, Q. Physical Simulation of the Water-Conducting Fracture Zone of Weak Roofs in Shallow Seam Mining Based on a Self-Designed Hydromechanical Coupling Experiment System. Geofluids 2020, 2020, 2586349. [Google Scholar] [CrossRef]
  11. Cui, F.; Dong, S.; Lai, X.; Chen, J.; Cao, J.; Shan, P. Study on Rule of Overburden Failure and Rock Burst Hazard under Repeated Mining in Fully Mechanized Top-Coal Caving Face with Hard Roof. Energies 2019, 12, 4780. [Google Scholar] [CrossRef] [Green Version]
  12. Bai, E.; Guo, W.; Zhang, D.; Tan, Y.; Guo, M.; Zhao, G. Using the Magnetotelluric Method for Detecting Aquifer Failure Characteristics under High-Intensity Mining of Thick Coal Seams. Energies 2019, 12, 4397. [Google Scholar] [CrossRef] [Green Version]
  13. Zhang, S.; Shen, B.; Li, Y.; Zhou, S. Modeling Rock Fracture Propagation and Water Inrush Mechanisms in Underground Coal Mine. Geofluids 2019, 2019, 1796965. [Google Scholar] [CrossRef]
  14. Qu, S.; Wang, G.; Shi, Z.; Zhou, P.; Xu, Q.; Zhu, Z. Temporal changes of hydraulic properties of overburden aquifer induced by longwall mining in Ningtiaota coalfield, northwest China. J. Hydrol. 2020, 528, 124525. [Google Scholar] [CrossRef]
  15. Li, M.; Zhang, J.; Zhang, W.; Li, A.; Yin, W. Experimental Investigation of Water-Inrush Risk Based on Permeability Evolution in Coal Mine and Backfill Prevention Discussion. Geofluids 2019, 2019, 3920414. [Google Scholar] [CrossRef]
  16. Ju, J.; Li, Q.; Xu, J.; Wang, X.; Lou, J. Self-healing effect of water-conducting fractures due to water-rock interactions in undermined rock strata and its mechanisms. Bull. Eng. Geol. Environ. 2019, 79, 287–297. [Google Scholar] [CrossRef]
  17. Xu, S.; Zhang, Y.; Shi, H.; Zhang, Z.; Chen, J. Impacts of Aquitard Properties on an Overlying Unconsolidated Aquifer in a Mining Area of the Loess Plateau: Case Study of the Changcun Colliery, Shanxi. Mine Water Environ. 2020, 39, 121–134. [Google Scholar] [CrossRef]
  18. Zhang, H.; Xu, G.; Chen, X.; Mabaire, A.; Zhou, J.; Zhang, Y.; Zhang, G.; Zhu, L. Groundwater Hydrogeochemical Processes and the Connectivity of Multilayer Aquifers in a Coal Mine with Karst Collapse Columns. Mine Water Environ. 2020, 39, 356–368. [Google Scholar] [CrossRef]
  19. Younas, A.; Nisbah, M.; Khattak, J.A.; Javed, T.; Rehman, H.; Farooqi, A. High levels of fluoride contamination in groundwater of the semi-arid alluvial aquifers, Pakistan: Evaluating the recharge sources and geochemical identification via stable isotopes and other major elemental data. Environ. Sci. Pollut. Res. 2019, 26, 35728–35741. [Google Scholar] [CrossRef]
  20. Zhang, J.; Chen, L.; Chen, Y.; Ge, R.; Ma, L.; Zhou, K.; Shi, X. Discrimination of water-inrush source and evolution analysis of hydrochemical environment under mining in Renlou coal mine, Anhui Province, China. Environ. Earth Sci. 2020, 79, 61. [Google Scholar] [CrossRef]
  21. Wu, G.; Bai, H.; Du, B.; Wu, L.; He, S.; Li, H. Study on the failure mechanism of clay layer overlying thin bedrock in coal seam mining. Environ. Earth Sci. 2019, 78, 315. [Google Scholar] [CrossRef]
  22. Liu, Y.; Liu, Q.; Li, W.; Li, T.; He, J. Height of water-conducting fractured zone in coal mining in the soil-rock composite structure overburdens. Environ. Earth Sci. 2019, 78, 242. [Google Scholar] [CrossRef]
  23. Xu, J. Green Mining of Coal Mine; China University of Mining and Technology Press: Xuzhou, China, 2011; pp. 133–134. (In Chinese) [Google Scholar]
  24. Wang, S.; Feng, J.; Hou, E.; Huang, K.; Xue, W.; Duan, H. Microscopic pore structure types of sandstone and its effects on aquifer water abundance in Ningtiaota coal mine. J. China Coal Soc. 2020, 09032020. Available online: http://www.mtxb.com.cn/CN/abstract/abstract24811.shtml (accessed on 5 August 2020). (In Chinese).
  25. Huang, Y.; Li, J.; Song, T.; Kong, G.; Li, M. Analysis on Filling Ratio and Shield Supporting Pressure for Overburden Movement Control in Coal Mining with Compacted Backfilling. Energies 2017, 10, 31. [Google Scholar] [CrossRef] [Green Version]
  26. Yu, Y.; Ma, L.; Zhang, D. Characteristics of Roof Ground Subsidence While Applying a Continuous Excavation Continuous Backfill Method in Longwall Mining. Energies 2020, 13, 95. [Google Scholar] [CrossRef] [Green Version]
Figure 1. Geographical location of the study area.
Energies 13 04095 g001
Figure 2. Main aquifers and aquicludes.
Energies 13 04095 g002
Figure 3. Thickness contour map of aquifers and aquicludes in Zhiluo formation: aquifer I (a), aquifer II (b), aquifer III (c), Aquiclude II (d), Aquiclude III (e).
Energies 13 04095 g003
Figure 4. Division diagram of the “upper three zones” of the roof of the mining coal seam: bending subsidence zone, rock layers bend and subside, but there is no obvious macro fracture caused by mining activities in this zone; fractured zone, the macro fractures caused by mining activities are numerous, and the structure of rock layers has been damaged in this zone; caving zone, the roof layers of a coal seam break up into rock blocks and fall into goaf; water-conducting fracture zone, ground water can flow in fractures caused by mining activities without restriction in this zone.
Energies 13 04095 g004
Figure 5. Strata histogram.
Energies 13 04095 g005
Figure 6. Numerical model.
Energies 13 04095 g006
Figure 7. Development process of fracture zone in the roof and floor of coal seam during mining. (a) Mining distance of 50 m; (b) mining distance of 150 m; (c) mining distance of 200 m; (d) mining distance of 500 m.
Energies 13 04095 g007
Figure 8. Calculation equation of development height of water-conducting fracture zone after correction.
Energies 13 04095 g008
Figure 9. Contour map of the development height of the roof water-conducting fracture zone of the main coal seam in the study area after correction.
Energies 13 04095 g009
Figure 10. Contour map of sandstone thickness within the development range of the water-conducting fracture zone of the main coal seam roof in the study area.
Energies 13 04095 g010
Figure 11. Statistical histogram of roof LII in the study area.
Energies 13 04095 g011
Figure 12. Water abundance zoning map by LII in roof water-conducting fracture zone of the study area.
Energies 13 04095 g012
Figure 13. Layout drainage borehole.
Energies 13 04095 g013
Figure 14. Drilling methods.
Energies 13 04095 g014
Figure 15. The composition of monthly average inrush water of working face 112208.
Energies 13 04095 g015
Figure 16. The variation trend of monthly average pre-drainage borehole water and mining drainage water ratio of working face 112208.
Energies 13 04095 g016
Table 1. Physical and mechanical parameters of rock mass of each formation in the simulation area.
NumberBulk Modulus/MPaShear Modulus/MPaCohesion/MPaInternal Friction Angle/°Tensile Strength/MPaDensity/kg/m3Lithology Description
10177018002.9536.132.22570Siltstone
9228022304.739.712.72440Medium-grained sandstone
8177018002.9536.132.22570Siltstone
7228022304.739.442.82440Medium-grained sandstone
6177018002.9536.132.22570Siltstone
5217022501.9532.811.82380Coarse-grained sandstone
43502603.228.00.81290#2 coal seam
3228022304.739.441.92320Medium-grained sandstone
2177018002.9536.132.22680Siltstone
1275023752.0334.941.82410Coarse-grained sandstone

