Abstract
The decarbonization of energy systems has led to a fundamental change in their topology since generation is shifted to locations with favorable renewable conditions. In planning, this change is reflected by applying optimization models to regions within a country to optimize the distribution of generation units and to evaluate the resulting impact on the grid topology. This paper proposes a globally applicable framework to find a suitable regionalization for energy system models with a data-driven approach. Based on a global, spatially resolved database of demand, generation, and renewable profiles, hierarchical clustering with fine-tuning is performed. This regionalization approach is applied by modeling the resulting regions in an optimization model including a synthesized grid. In an exemplary case study, South Africa’s energy system is examined. The results show that the data-driven regionalization is beneficial compared to the common approach of using political regions. Furthermore, the results of a modeled 80% decarbonization until 2045 demonstrate that the integration of renewable energy sources fundamentally changes the role of regions within South Africa’s energy system. Thereby, the electricity exchange between regions is also impacted, leading to a different grid topology. Using clustered regions improves the understanding and analysis of regional transformations in the decarbonization process.
1. Introduction
Countries around the world are currently facing the challenge of decarbonizing their energy systems. In this context, energy system models provide a possibility to analyze potential future developments and support for decision making. There are various model classes to evaluate energy systems, such as scenario prediction models, models for system operation or design optimization models. To support policy and decision making on the country level, especially for medium- and long-term planning, the class of energy system optimization models is often applied [1]. These models calculate cost-optimal investment and operation pathways of a technology mix to reach specified decarbonization goals.
A challenge which is frequently mentioned for these models is their spatial resolution. This challenge can be described by finding a trade-off between the complexity (number of variables) of the model, resulting in computational effort, and the required detail of modelling, which also depends on the data availability. Especially in decarbonized future energy systems, which are characterized by a high share of renewable generation, a spatially detailed model might be necessary as, e.g., the technological potentials and generation patterns strongly differ within a country [2]. These differences are not reflected if the data are aggregated for an entire country. Therefore, multi-regional models provide a possibility to improve the allocation of technologies within a country by differentiating their technical potential by location [3]. Furthermore, infrastructural aspects, such as the electrical grid, can only be considered in spatially resolved multi-region country models [1].
One approach to integrate a high spatial resolution into a county-level model would be to consider each smallest administrative area on municipal level, such as cities or councils, as an individual model region. Such a high resolution would computationally not be feasible and complicate the evaluation of results [4]. As an example, Germany is resolved in 4680 municipalities in our applied dataset of administrative areas which would all need to be modeled in separate regions [5]. When increasing the region size and lowering the complexity, larger administrative areas (e.g., districts, states, or provinces) could be an option. Taking large administrative areas simplifies the modelling process since the required data are often provided on these levels. As an example, the country South Africa can be modelled by dividing it into its nine states [6]. However, these larger regions might not be adequate to analyze the energy systems: a large state might have zones with completely different characteristics while in contrast, two smaller different states might have very similar energy systems. To account for these structures, this paper presents an approach to identify regions grouped by their energy system characteristics as an input for an energy system model based on a data-driven clustering algorithm. These regions must be spatially contiguous to include inter-region infrastructure such as the electrical grid. Spatial contiguity requires that only areas, which are directly next to each other can be summarized in a cluster. As a second requirement, the developed framework needs to be globally applicable to enable the analysis of decarbonization for every country in the world on a spatial level. The approach is focused on the electricity sector as an important factor for decarbonization [7].
Concerning the challenge of integrating spatial data in multi-region energy system models, different approaches are already available. As a model-based approach, a decomposition method is presented to reduce computing times of studies with a high spatial resolution [8]. Therein the challenge of a global database and data-based evaluations are not considered. By contrast in [9], the data basis is focused by generating a global spatial database and integrating it in an optimization model. However, this approach is only focused on defining the data basis but does not use data-driven aggregation steps to classify regions. Focusing on optimization models, additionally, there are already publications which cluster regions within a country driven by data: in [10], regions on the smallest administrative level of Germany are classified in ten different clusters. However, the clustered regions are not spatially connected. Thereby, infrastructure connecting regions cannot be considered. In a second approach, which is the closest to the one presented underneath, a spatially contiguous clustering of regions in Europe is presented [3]. In this case, time series are not considered, and the clustering is applied to a raster which separates the data completely from any administrative level. Last, there are spatial clustering approaches which directly focus on grid-related data [11,12,13]. Therein, the identification of transmission bottlenecks is decisive for the clustering. Regarding the application in energy system models, Cao [11] indicates how clustering can speed up the calculation of energy system models and proofs the necessity to find such clustering methodologies.
The new framework presented here combines the following two ideas: it aims to generate spatially connected regions as an input for an energy system model but still uses the smallest administrative level. This approach considers the electrical infrastructure between regions, but also includes point data of electricity demand and generation as well as time series and is still able to use data on a very detailed administrative level. The desired spatially contiguous regions are generated data-driven by a clustering algorithm. The overall goal of using this regionalization approach is to define regions based on the energy system characteristics which can be modeled in a multi-region energy system model for every country worldwide with a limited computational complexity. In such a model, the spatial impacts of decarbonizing the energy system by the integration of renewable energy sources can be analyzed. Next to the advantage of an efficient model setup, the tailored regions support the analysis of model results since they already represent characteristics which are important for the development within a decarbonization process. By applying the developed framework to an exemplary use case, this study aims at (1) showing the advantage of clustered regions in comparison to political regions and (2) proving the advantage of these regions in an energy system model by comparing their initial characteristics with the regional developments in a decarbonized energy system.
This approach can help modelers to generate regions independent from boundaries on the state or province level. Moreover, it can help policymakers to analyze regional differences within a country, and technology providers to identify market potentials in different areas of a country. In the following sections, the developed methodologies are presented and applied to the use case of South Africa’s energy system. For this use case, the energy system model is used to evaluate how the topology of the electrical grid changes in a decarbonized energy system. Lastly, the results are discussed, the approach and its performance are concluded, and subsequent research topics are described.
2. Methods
In general, the framework consists of four major steps which are described in Figure 1: (1) generating a global spatial database, (2) the clustering algorithm as the main part, (3) the infrastructure synthesis, and (4) the energy system model. The first three steps ensure that tailored regions are prepared for the application in an energy system optimization model for each country globally based on the respective spatial energy system characteristics. Applying these regions in step four completes the framework. The following sub-sections contain a detailed description of each step.
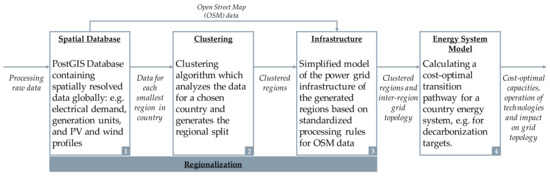
Figure 1.
Overview developed framework.
2.1. Spatial Database
The spatial database consists of various data categories that are either directly available or must be derived through various processing steps from spatial raw data. With a focus on the application in the energy system model, three major data categories are required to describe the energy system: electricity demand, electricity generation technologies, and renewable profiles. Therefore, these three categories are used for the clustering and must be included in the database.
- Since there is no spatial layer of global electricity demand available, this database is built up in a joint project with “Forschungsstelle für Energiewirtschaft e.V.” [14]. In general, the demand data are separated into two categories: private household demand (PHH) and commercial, trade, public services, and industry (CTSI) demand. The household demand is calculated by intersecting the overall household demand of a country [15] with the global human settlement layer which describes the distribution of population globally [16]. To ensure a consistency of population data and provide a flexible scale up for future data, the distribution of population is scaled for every country by global population data [17]. The CTSI demand is calculated by using industrial, commercial, and retail areas stated in OpenStreetMap (OSM) to execute the spatial disaggregation [18].
- Concerning the distribution of generation technologies, a publicly available database is used [19]. This database contains precise data for conventional power plants with an accuracy of 80–100% [20] depending on the technology. For solar and wind generation, the accuracy is lower (wind: 49%, solar 21%) as it is difficult to gather the data for all units in every country [20]. Since the share of these technologies in the current electricity generation mix is still comparably low in most countries, this inaccuracy is acceptable to describe the spatial distribution of generation technologies in the current system. However, the importance of both technologies in future decarbonized energy systems is still considered in the clustering by their profiles, which are represented by the third data category.
- Similar to the demand, hourly time series of normalized wind and photovoltaic generation are determined by processing publicly available raw data. For this purpose, we combine weather data from the MERRA-2 database [21,22,23,24,25] with the technical characteristics of the two technologies [26]. For wind generation, the final profile is determined by using the best turbine type for each region based on the region’s full load hours weighted by the current distribution of wind turbines from OSM data [18]. The photovoltaic profiles, which are calculated for all possible orientations (compass direction in 22.5° steps) and module angles (0°–45°), are finally included by using the best of all possible combinations of direction and angle leading to the highest full load hours. All profiles are generated based on the weather year 2012, adjusted to a non-leap year by neglecting February 29.
The smallest administrative regions, which are used to gather the spatial data as an input for the clustering algorithm, are based on the highest resolution of regions for each country available in [5]. Additionally, the spatial database contains a data dump of OSM data which is not only used to locate wind and PV generation units but also to gather existing electrical lines within a country. The exact application of this dataset is described in Section 2.3.
2.2. Clustering
Applying a clustering algorithm on this database is the major step of the developed framework. In this context, the following sub-chapters include firstly the selection and implementation of an appropriate algorithm and secondly its validation by benchmarking the results.
2.2.1. Clustering Algorithm
The regionalization algorithm uses the smallest administrative areas in a chosen country. Since the clustering algorithm needs a consistent data input, a pre-processing is applied including the following steps:
- Regions on the smallest administrative level consisting of two or more parts which are not spatially contiguous are split to guarantee spatially contiguous clusters.
- The islands of a country must be handled since naturally they are not connected to the other regions of a country. This is especially important for countries characterized by multiple big islands such as Indonesia, Japan, or New Zealand or countries with islands located far away from the “mainland” energy system such as France or Portugal:
- ○
- Those islands with an area less than a defined percentage (default 1%) of the total country’s area are merged to the closest region if the distance is less than 50 km.
- ○
- Further distanced islands as well as those without any demand or generation capacities are dropped since they are considered to have low importance for the country’s energy system.
Using the thereby generated set of smallest regions, the data are aggregated for each category. However, regions of bigger size tend to accumulate more data. Therefore, the demand and generation data are normalized by the area of the respective region. Furthermore, all categories are normalized in their respective category since they have different physical units [27]. This normalization ensures the possibility to consider different types of data in the clustering. Especially the renewable profiles of wind and photovoltaics require a weighted normalization since the hourly data set contains much more entries as, e.g., the generation capacities of power plants. Figure 2 visualizes the hierarchy of the weighting process.
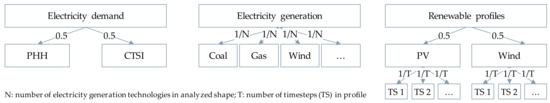
Figure 2.
Weighting of data categories for clustering algorithm using equal weighting.
In a first level, the three major data categories (electricity demand, electricity generation, and renewable profiles) are weighted equally. The subsequent data in each of the three categories, e.g., PHH demand and CTSI demand in the category of electricity demand, are then normalized to an interval of [0, 1]. Lastly, the sub-categories are weighted by the number of sub-categories in the data category. For demand data, both sub-categories are weighted 0.5 while the generation technologies are weighted by N, the number of available technologies in the country. The time series of PV and wind are first weighted 0.5 and then divided by T, the number of timesteps in the profiles. In a non-leap year T adds up to 8760 timesteps (TS). In contrast to this equal weighting within one category, the user of this method can also select a weighting based on current data. In this case, the generation technologies and demand types are not weighted equally but according to their share in the total installed generation capacity or the total electricity demand. We use an equal weighting for the presented evaluations since the computed variance of the clusters is 2% lower than using a weighting based on current data.
For the clustering algorithm itself, hierarchical clustering is chosen as it is very efficient to include a contiguity constraint and provides flexibility regarding the number of clusters. Other methods such as K-means, max-p, and DBSCAN [28,29] were also analyzed but not found to be applicable here. Reasons for this decision are difficulties to include spatial contiguity (K-means), computational complexity (max-p), dependency on user inputs or thresholds (max-p, DBSCAN), and issues with high dimensional data (DBSCAN). Specifically, Ward’s method, which uses the Euclidean distance to merge clusters, is implemented due to its superior performance including a contiguity constraint [30]. The general procedure of the hierarchical clustering includes the following steps [29]: (1) assign one cluster to each smallest region, (2) combine those two regions that are most similar and spatially contiguous, and (3) repeat step 2 until there is only one cluster left.
The output of the algorithm is a hierarchy indicating which regions are merged into clusters for each potential number of clusters. After the hierarchy is calculated, the elbow method [31] is used to identify the optimal number of clusters since this clustering validity indicator focuses on the inter-cluster distance which is important to find similar and spatially contiguous clusters. As a default, the point with the longest distance to a balancing line is considered to be optimal. Alternatively, a user-defined number can also be selected. Based on the chosen number of clusters, a post-processing algorithm, called “fine-tuning”, is performed [32]. This post-processing is applied due to the drawback of the hierarchical clustering of not reassigning regions to other clusters once the cluster is built even if another solution performs better. The algorithm checks whether a shift of a region into another spatially contiguous cluster improves the distance metric, i.e., the score of the elbow criterion. However, the number of clusters is kept constant during the shifting process. Therefore, a region can only be shifted to another cluster if the spatial contiguity of the former cluster is not violated by the change.
Since the original processing only shifts one single region at once, it is not able to shift any region that connects two other regions in the same cluster. To extend the range of considered regions for a shift, the methodology in [32] is further enhanced by checking if regions exist that are only connected to one other region in the cluster. Similar to the original fine-tuning algorithm, these regions are assessed if shifting them together with other spatially contiguous regions into another cluster improves the overall performance. This second algorithm is applied after each cycle of the original fine-tuning. Figure 3 provides an overview of the overall post-processing algorithm including the further developed improvement after the sixth post-processing step. In contrast to Ward’s method for the hierarchical clustering, the fine-tuning uses a different distance metric by not only calculating the Euclidean distance: as a first step, the Manhattan distance is calculated for each data category A, their sub-categories a, each cluster c, and each member of the cluster x by
which are then used to calculate the Euclidean distance:
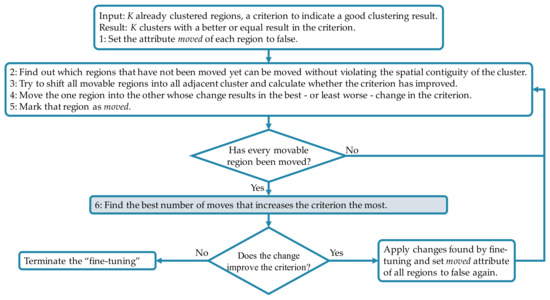
Figure 3.
Process fine-tuning algorithm and its extension by shifting multiple regions.
This combined metric better includes the time series in the clustering results as the Manhattan distance performs better on high dimensional data [33] while the Euclidean distance still emphasizes outliers in the dataset [34].
2.2.2. Validation of Clustering
The results of the clustering algorithm are validated in a benchmarking approach. Therefore, the clustered regions are compared to a regionalization by administrative areas on the highest level according to [5], e.g., state level. Firstly, values of the three categories, electricity demand, electricity generation technologies, and renewable time series, are determined for each region/state. In the next step, the distance of each smallest region within a state to the overall state value is calculated and summed up for all states. For the distance calculation, the different distance metrics are applied: the Euclidean distance from the Ward’s method, the Manhattan distance, and the combination of both as applied in the fine-tuning algorithm. The final distance metrics are then compared for three cases: the optimal number of clustered regions determined by the clustering algorithm and the elbow method, the administrative regions on a state level, and clustered regions which are equal to the number of regions on a state level. Results of this benchmarking process are presented in the regionalization Section 3.1.
2.3. Infrastructure
In the third step, the generated clusters are then processed to derive information about the inter-region infrastructure. For this analysis, OSM data [18] are evaluated based on the clustered regions and a post-processing step for incomplete data is executed. OSM data has already been proven as a source to generate grid models independent from data provided by grid operators [35]. In our analysis we focus on the electrical grid. The grid is especially interesting regarding the application in an energy system model to analyze the impact of changing generation patterns by an increasing share of renewable generation sources which are typically built in more distributed locations than conventional power plants. To synthesize the electrical grid out of globally available data, firstly power lines are filtered by their respective OSM tags line and cable. In a second level, the tags voltage, frequency, cables, and name are further evaluated to gather the grid characteristics for the filtered lines. Incomplete lines for all these tags are dropped in a first step. Furthermore, the mentioned categories can be used to derive rules if single tags are missing. Examples for these rules are setting missing voltage to the most frequent voltage occurring, rounding the number of cables to a multiple of three to represent a full AC power circuit or further rules to align the number of entries for all categories. Overall, the transmission grid is most important for the analysis of spatial generation patterns and their required grid topology. Additionally, data of distribution grids are often incomplete or difficult to access and they do not represent interconnections between different regions or states. Consequently, only transmission lines with a voltage level of 100 kV or higher are considered.
All lines resulting from the described filters are then allocated to the clustered regions they connect. Depending on the voltage levels, their transmission capacities are calculated based on standard values [36,37]. For each link between two regions, the transmission capacity is then finally synthesized by summing up the transmission capacity for each power circuit on each voltage level multiplied by 70% which represents a security margin for system security in the applied capacity-based method [38].
2.4. Energy System Model
Both the clustered regions and their inter-region infrastructure capacities are then used to automatically generate an energy system model of the selected country. In general, the model of a country is set up according to the methodology and assumptions described in [39]. To build up a multi-regional model, the country is split to the regions identified as optimal by the clustering algorithm. We distribute the spatial data of the electricity demand and existing installed capacities to the clustered regions by the normalized distribution to the regions multiplied with the total demand or the capacity of each technology in the country. The time series are allocated to the respective technologies wind and PV respecting the time scale of an hourly resolution and the spatial scale of the regions. Furthermore, electricity can be exchanged between regions based on the synthesized grid. This grid can be further expanded in future scenarios to account for the structural changes in decarbonized energy systems.
The applied modelling tool for the calculation of a cost-optimal decarbonization pathway is called the Energy System Development Plan (ESDP). This model is classified in the mentioned class of energy system optimization models and is able to consider different regions as well as their energy exchange [40]. As an objective function, the total costs, including capital and operational expenditures (CAPEX and OPEX), are minimized. These costs include the expansion of new generation and flexibility-providing technologies. The constraints of the optimization problem formulation ensure that decarbonization goals are fulfilled, the generation and demand of electricity within the clustered regions are hourly matched, and the operation and expansion of the grid are included. To reflect characteristics of the grid, the output Pout at the end of a power line in relation to the input Pin, the length L, and the losses per km l is modeled as follows:
the length of a line is determined by the distance between the centers of two neighboring regions and the losses are taken for each country from [41]. It is calculated in both directions. Even though this representation of the grid in the optimization model is simplified by only considering grid exchange capacities neglecting the physical power flow, it is suitable for the objective of our research: the expansion of the grid is optimized simultaneously with the expansion and regionalization of new generation technologies in a future energy scenario. Thereby, general trends in the expansion and reinforcements of grid topologies can be analyzed and cost-effective solutions can be found [42]. As a second advantage, the optimization problem is kept linear which reduces the computational complexity of the model [43].
Pout = Pin (1 − L × l),
The costs of the electrical transmission grid are directly considered in the CAPEX and OPEX calculation as an input for the central objective function [40]. Thereby, the grid is optimized on the same level as generation or storage technologies. The cost assumptions for the grid are based on [44].
3. Results
The described framework is applied to South Africa as an exemplary country. Analyzing the described database, South Africa’s energy system is currently strongly dominated by fossil fuels. However, the country has good potentials for renewable generation from both technologies, wind and photovoltaic. For this reason, it is an interesting use case to analyze the current regional characteristics of the energy system in the regional clustering approach. To show the advantages of the developed regionalization approach, the generated regions are then used to calculate a cost-optimized decarbonization pathway in an energy system model. Results for both steps are presented in the following two sub-sections.
3.1. Regionalization of South Africa
Following the description of the regionalization process, the first step is evaluating the spatial database for the modeled country South Africa. Therefore, the described data categories are collected on the level of the smallest administrative area. This leads to 326 regions as input for the clustering [5]. The regional distributions of the parameters in these regions are visualized in Figure 4.
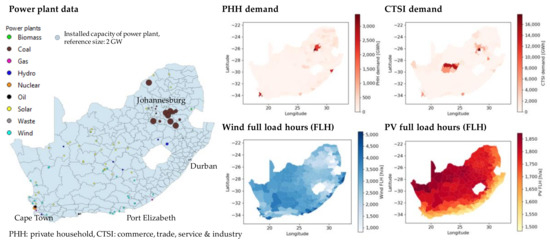
Figure 4.
Spatial data basis for power plant, demand and renewable data in South Africa.
The power plant data indicates a concentration of large coal power plants in the North-East of the country close to the city of Johannesburg. Analyzing the distribution of renewable generation technologies, photovoltaic generation is mostly distributed in the center of the country while wind generation units are built close to the coastline in the West and South. These fit the analysis of the renewable profiles indicated by the respective full load hours: the highest full load hours of wind are along the coastline and for PV the full load hours decrease from North to South. Lastly, the demand data indicates the distribution of settlements in cities or industrial areas. The household demand is high in the agglomeration of Johannesburg, around Cape Town and in a few cities along the coastline, such as Durban or Port Elizabeth. The distribution of the CTSI demand is very similar except for some rural areas showing a high demand which arises, e.g., from mining activities.
Clustering the 326 smallest regions of South Africa, the developed algorithm determines an optimal number of twelve clusters by the elbow criterion. These twelve clusters and their evaluation in the applied categories are displayed in Figure 5.
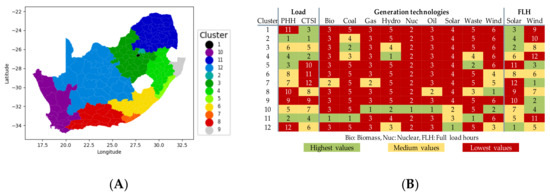
Figure 5.
Clustering results: (A) Geographical distribution of the resulting twelve clusters; (B) Analysis of clusters rating the twelve clustered regions for each data category from the highest value, e.g., highest demand, generation capacities or full load hours (FLH) (number 1 in the figure) to the lowest value (highest number in the figure).
Cluster 2, the cluster including Johannesburg, is the region with the highest demand for both categories, PHH and CTSI demand. Further regions with a high demand are Cluster 4 and 11 which are both industrial areas. Cluster 12 has the lowest household demand but still some CTSI demand as shown in Figure 4. Cape Town, the second biggest city, is a part of Cluster 10 which lowers the demand to a medium value. Nevertheless, this cluster shows the highest value of gas, nuclear and oil power plants. The coal power plants are all in the North-Eastern area around Johannesburg. Evaluating the third parameter, the full load hours, the clusters represent the distribution along the coast (for wind) and North-South (for PV). Cluster 12 and 3 have the highest number of PV full load hours while Cluster 7 and 9 show the most promising wind potential.
For validation purpose, we perform a benchmarking of these clustering results to the nine official states of South Africa including the results of the developed algorithm for nine clustered regions. Figure 6A visualizes the results of this comparison exemplarily for the combined distance metric of Euclidean and Manhattan distance as this metric is finally used in the fine-tuning process.
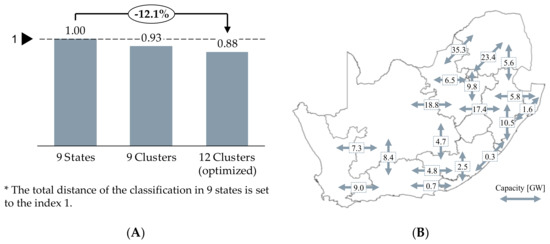
Figure 6.
(A) Validation of clustering by benchmarking with combined distance metric to official states and nine Clusters; (B) resulting net transfer capacities from the grid synthetization process for the twelve clusters.
The comparison proves, that in both cases, for nine as well as twelve clusters, the algorithm performs better than the classification in official states. The improvements amount to 7% for the nine clusters and 12% for the optimized and selected number of twelve clusters. These results confirm the applicability of the methodology leading to a better regionalization for the three clustered dimensions compared to the classification based on administrative states.
As a last step of the regionalization, the twelve described regions are considered to synthesize the net transfer capacities of the electrical grid by evaluating OSM data. The resulting capacities, depicted in Figure 6B, are validated in two ways: firstly, regions which have high installed capacities of the dominating generation technology coal power plants show high transmission capacities towards load centers at the coastlines. Examples for such regions are Cluster 2, 3, 4, and 11. Secondly, the data quality can be verified by comparing the constructed grid using OSM data to the real grid structure in South Africa [45]. In general, most lines are included and the capacities represent the overall grid structure which is characterized by a strong connection from North-East to South-West and several outflows to cities along the coast. The comparison only identifies few outliers of missing lines or wrong voltage levels. Summarizing the results, the clusters, calculated by the developed regionalization algorithm, represent a suitable regionalization to analyze a regionalized decarbonization pathway of South Africa by including the synthesized grid from OSM data.
3.2. A Regionalized Decarbonization Pathway for South Africa
Based on a multi-region model of the twelve presented clusters, we model the decarbonization pathway of South Africa in three different planning horizons: 2015, 2030, and 2045. The final decarbonization goal for the year 2045 is the reduction of 80% CO2 emissions compared to the base year 2015. The basis 2015 is considered since it provides an opportunity to validate the data and the model. The year can be used as a verified starting point to analyze the development of the energy system. In between, 2030 represents an intermediate year in the decarbonization process of South Africa’s energy system and 2045 the target year of our model. Using 2045 as the target year provides the opportunity to even increase the goals to a 100% decarbonized electricity system until 2050.
The results for modeling 2015 represent the basic setup of the South African energy system and are similar to the real generation in 2015. Coal is by far the dominating technology and nuclear is the only other technology with a considerable share in the country’s electricity production [46]. The regional distribution in 2015, as shown in Figure 7, matches the characteristics of the clustered regions described in Figure 5: Clusters 3, 4, and 11 are the dominant regions with coal power plants and the only other region with considerable capacities is Cluster 10 where nuclear and oil power plants are located to generate electricity for Cape Town.
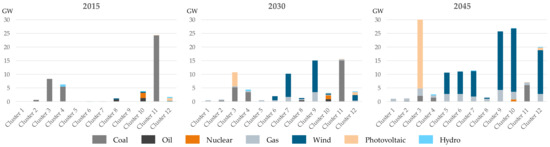
Figure 7.
Optimized power generation capacity installations for the three modeled years in each clustered region.
The distribution of the generation capacities in the other two modeled years shows the shift of technologies and their spatial distribution in decarbonized energy systems. The year 2030 is the transition step, in which the previously described regions still show some installations of conventional generation technologies, but first wind installations take place in Cluster 7 and 9. These two clusters are characterized by the highest full load hours of wind generation. Additionally, first photovoltaic units are installed in Cluster 3, which has only the second-best solar potentials but is closer to the load center of Johannesburg which leads to reduced electricity transport losses. Additionally, coal power plant capacities are ramped down and therefore the region is already well connected to the grid.
In 2045, the transition from a centralized to a decentralized system further continues: most coal power plants are shut down. Wind generation capacities are distributed to the most suitable regions while PV installations are concentrated in Cluster 3 which already had first installations in 2030. Even though Cluster 12 has the best solar potential, the solar expansion is in 2045 again mostly focused on Cluster 3. Next to its proximity to Johannesburg, Cluster 3 is also preferred since Cluster 12 also has good wind conditions leading to 16 GW of wind capacity installed. The wind capacity in Cluster 7, the region with the best wind potential in the country, does not increase between 2030 and 2045 which shows the impact of the grid on the optimization. Because other regions, such as Cluster 10 or 12, are better connected to the grid, these regions are preferred for building new wind turbines. A similar effect is observed in Cluster 5. Furthermore, the optimization leads to gas power plants being built in every region with a minimum of 860 MW in Cluster 11 and up to 4.2 GW in Cluster 9. With gas being less CO2-intensive than coal, these power plants provide more opportunities for flexibility in a highly decarbonized energy system. Cluster 9 uses this flexibility to back-up the large installations of wind power plants. Cluster 11 shows the lowest value of gas power plant capacities as there are still conventional coal power plants available. The flexibility provided by these power plants is enough so that no significant storage capacity is required in the system and chosen in the optimization.
The final energy mix, presented in Table 1, is an indicator to summarize the described transition to a decarbonized energy system in South Africa: the share of coal generation decreases from more than 90% to 8% in 2045, gas provides important and less CO2-intensive flexibility with a share of 3% in 2030 and 6% in 2045, and wind becomes the dominating technology with a share of 70% in 2045 compared to 11% photovoltaic generation. As already mentioned, the values for 2015 confirm the model parametrization and validate the underlying wind and PV time series. Only the shares of coal and nuclear power vary by 1% compared to the statistics in [46], while the generation of wind and photovoltaic units is calculated correctly. The overall costs of the calculated pathway amount to 175 bn € which is equal to average costs of 62 €/MWh over the modeled period of 30 years. These costs are in a similar range as a study evaluating a 100% renewable system in South Africa [6].

Table 1.
Energy mix in modeled years.
Finally, we analyze the impact of these described changes on the grid topology in South Africa. As mentioned in the grid synthetization process, the current system has a strong North-East to South-West connection which transports electricity between the two major cities Johannesburg and Cape Town. Based on this topology, the grid flows calculated by the optimization model for the three years are shown in Figure 8.
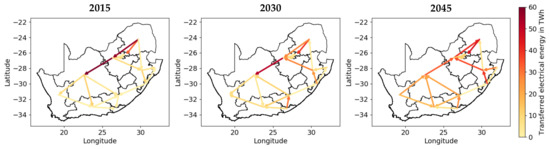
Figure 8.
Development of grid flows in decarbonization process from 2015 until 2045.
In 2015, the electricity transport pattern leads from the coal power plants, concentrated in the North-East region, to the other regions in the country. This pattern does not change fundamentally in the results for 2030, but first variations result from the increased share of renewables: some of the regions at the coast, especially Clusters 5, 7, and 9, changed their role in the energy system from being net consumers to net generators. The electricity, generated by wind farms as shown in Figure 7, is transported to the center of the country where the highest demand is located. In this context, Cluster 5 is used as a transit region since there is a higher grid capacity in the initial grid than in Cluster 9. The inversion of electricity flows is then completed in 2045. In the target year of our evaluation, the high amount of wind installations in the regions along the coastline lead to electricity flows from these regions to the center of the country and especially towards the Johannesburg region.
Overall, the development of grid flows demonstrates the fundamental change of the energy system in South Africa in a decarbonization process. The country changes from a centralized and coal-dominated electricity system to a decentralized system with a high share of wind generation in coastal regions. The shift of almost all directions in the grid topology from 2015 to 2045, shown in Figure 8, visualizes this development. However, this process does not require a lot of grid expansion in the case of South Africa. Only Cluster 7 requires around 3.5 GW newly installed capacities to transport the therein generated electricity to load centers.
4. Discussion and Conclusions
Our proposed approach simplifies setting up regional models of country energy systems by a data-driven approach. These models can then be applied, e.g., to analyze the spatial impact of a decarbonization process in a country. The general idea is applicable to all countries worldwide and exemplarily shown for South Africa, which is currently dominated by coal generation but characterized by good wind and solar potential.
The results of South Africa show the applicability of the developed framework: First, a global database including spatial data for the most important categories of an energy system model is presented. Second, the clustering of the smallest administrative areas in South Africa leads to explainable regions that differ in their demand, generation, and renewable potential characteristics. A benchmarking analysis shows that the developed methodology summarizes the regions better than the classification in states. Third, OSM data can be used to synthesize a simplified electrical grid topology to model the exchange between these regions. The modeling results confirm the classification in clusters by differentiating between regions which are currently important for the system and regions which gain relevance in a future energy system. The grid patterns, resulting from these model results, confirm the hypothesis that the grid topology can change fundamentally.
These observations could be further extended by applying the methodology to various countries. As a first indication, the described validation methodology can be applied to compare the clustering results to the classification of regions on a state level. For countries which currently already have a high share of renewables or good renewable potentials close to load centers, the impact on the grid topology is probably lower than in South Africa. By contrast, other countries might need to build more new transmission lines reacting to these changes. Due to the global database and the automated interfaces to the energy system model, the framework can be transferred to other countries. However, the framework and particularly the step of synthesizing the grid from OSM data, requires a good data quality which might not be given for every country. In this case, additional research might be required.
The reduced computational burden of the optimization problem also provides an opportunity to include more sectors in the energy system model such as the transportation sector or heating and cooling. Thereby, the optimization model can identify cost-optimal decarbonization strategies for the overall energy system. A challenge to proceed in this research topic is collecting spatial data for other sectors on a global level. Furthermore, the spatial data of already existing renewable generation units can be improved by integrating further datasets, e.g., from a recently published approach to harmonize data available in OSM [47]. However, the modeling results are not impacted fundamentally by this error as wind and solar are still considered in the regionalization process by their renewable potential and they are mostly expanded in the process of the decarbonization pathway.
In conclusion, our approach has the potential to improve the understanding of current and future energy systems regarding the spatial dimension: the clustering results illustrate how regions within a country differentiate in terms of their characteristics which are relevant for the energy system. This comparison can also be applied to more regional levels, at the state or continent levels, or any customizable geographic shape. Further to this data evaluation perspective, it provides an opportunity for modelers to easily set up multi-region energy system models, which are tailored to the energy system. The suitability of these regions is proven in our approach by the modeling results of a decarbonization pathway of South Africa.
Author Contributions
Conceptualization, M.K., M.H., H.J.H., and M.M.; methodology, M.K. and C.P.; software, C.P.; validation, M.K. and M.F.; formal analysis, M.K. and C.P.; data curation, M.K. and M.H.; writing—original draft preparation, M.K. and C.P.; writing—review and editing, M.K., C.P., M.F., H.J.H., M.H., M.M., and S.N.; supervision, S.N.; All authors have read and agreed to the published version of the manuscript.
Funding
This research received no external funding.
Acknowledgments
We thank our colleagues from “Forschungsstelle für Energiewirtschaft e.V” (FfE), namely Michael Ebner and Mihai Pribeagu, for the good collaboration to generate the global spatially resolved database.
Conflicts of Interest
The authors declare no conflict of interest.
References
- Lopion, P.; Markewitz, P.; Robinius, M.; Stolten, D. A Review of Current Challenges and Trends in Energy Systems Modeling. Renew. Sustain. Energy Rev. 2018, 96, 156–166. [Google Scholar] [CrossRef]
- Pfenninger, S.; Hawkes, A.; Keirstead, J. Energy Systems Modeling for Twenty-First Century Energy Challenges. Renew. Sustain. Energy Rev. 2014, 33, 74–86. [Google Scholar] [CrossRef]
- Siala, K.; Mahfouz, M.Y. Impact of the Choice of Regions on Energy System Models. Energy Strategy Rev. 2019, 25, 75–85. [Google Scholar] [CrossRef]
- Short, W. Regions in Energy Market Models; NREL/TP-620-40506; National Renewable Energy Laboratory (NREL): Golden, CO, USA, 2007. [CrossRef]
- GADM. GADM Maps and Data. Available online: https://gadm.org/index.html (accessed on 11 July 2019).
- Oyewo, A.S.; Aghahosseini, A.; Ram, M.; Lohrmann, A.; Breyer, C. Pathway towards Achieving 100% Renewable Electricity by 2050 for South Africa. Solar Energy 2019, 191, 549–565. [Google Scholar] [CrossRef]
- IEA. Global CO2 Emissions in 2019; International Energy Agency: Paris, France, 2020.
- Cao, K.-K.; von Krbek, K.; Wetzel, M.; Cebulla, F.; Schreck, S. Classification and Evaluation of Concepts for Improving the Performance of Applied Energy System Optimization Models. Energies 2019, 12, 4656. [Google Scholar] [CrossRef]
- Biberacher, M. Modelling and Optimisation of Future Energy Systems Using Spatial and Temporal Methods. Ph.D. Thesis, University of Augsburg, Augsburg, Germany, 2004. [Google Scholar]
- Weinand, J.M.; McKenna, R.; Fichtner, W. Developing a Municipality Typology for Modelling Decentralised Energy Systems. Util. Policy 2019, 57, 75–96. [Google Scholar] [CrossRef]
- Cao, K.-K.; Metzdorf, J.; Birbalta, S. Incorporating Power Transmission Bottlenecks into Aggregated Energy System Models. Sustainability 2018, 10, 1916. [Google Scholar] [CrossRef]
- Anderski, T. E-HIGHWAY 2050—Modular Development Plan of the Pan-European Transmission System 2050: European Cluster Model of the Pan-European Transmission Grid; Deliverable public funded project; e-Highway 2050 Consortium: La Defense, France, 2015. [Google Scholar]
- Hörsch, J.; Brown, T. The Role of Spatial Scale in Joint Optimisations of Generation and Transmission for European Highly Renewable Scenarios. In Proceedings of the 2017 14th International Conference on the European Energy Market (EEM), Dresden, Germany, 6–9 June 2017; IEEE: Piscataway, NJ, USA, 2017. [Google Scholar]
- FfE—Forschungsstelle für Energiewirtschaft, e.V. Siemens Global Energy Demand-Modellierung des Weltweiten Stromverbrauchs. Available online: https://www.ffe.de/themen-und-methoden/erzeugung-und-markt/911-siemens-global-energy-demand-modellierung-des-weltweiten-stromverbrauchs (accessed on 11 June 2020).
- IEA. Electricity Information 2018; International Energy Agency: Paris, France, 2018.
- European Commission, Joint Research Centre; Columbia University, Center for International Earth Science Information Network. GHS-POP R2015A—GHS Population Grid, Derived from GPW4, Multitemporal (1975, 1990, 2000, 2015); Dataset; European Commission, Joint Research Centre (JRC): Ispra, Italy, 2015. [Google Scholar]
- The World Bank. World Development Indicators. Available online: https://databank.worldbank.org/source/world-development-indicators (accessed on 1 November 2018).
- OpenStreetMap (OSM)—OpenStreetMap and Contributors. OpenStreetMap Foundation: Cambridge, 2004 (edited 2019). Available online: http://www.openstreetmap.org/ (accessed on 7 February 2019).
- World Resources Institute. Global Power Plant Database. Available online: http://datasets.wri.org/dataset/globalpowerplantdatabase (accessed on 1 July 2019).
- Byers, L.; Friedrich, J.; Hennig, R.; Kressig, A.; Li, X.; Mccormick, C.; Valeri, L.M. A Global Database of Power Plants; World Resources Institute: Washington, DC, USA, 2019; p. 18. [Google Scholar]
- MERRA-2 tavg1_2d_slv_Nx: 2d, 1-Hourly, Time-Averaged, Single-Level, Assimilation, Single-Level Diagnostics V5.12.4; Global Modeling and Assimilation Office (GMAO), Goddard Earth Sciences Data and Information Services Center (GES DISC): Greenbelt, MD, USA, 2015.
- MERRA-2 tavg1_2d_lnd_Nx: 2d, 1-Hourly, Time-Averaged, Single-Level, Assimilation, Land Surface Diagnostics V5.12.4; Global Modeling and Assimilation Office (GMAO), Goddard Earth Sciences Data and Information Services Center (GES DISC): Greenbelt, MD, USA, 2015.
- MERRA-2 tavg1_2d_flx_Nx: 2d, 1-Hourly, Time-Averaged, Single-Level, Assimilation, Surface Flux Diagnostics V5.12.4; Global Modeling and Assimilation Office (GMAO), Goddard Earth Sciences Data and Information Services Center (GES DISC): Greenbelt, MD, USA, 2015.
- MERRA-2 tavg1_2d_rad_Nx: 2d, 1-Hourly, Time-Averaged, Single-Level, Assimilation, Radiation Diagnostics V5.12.4; Global Modeling and Assimilation Office (GMAO), Goddard Earth Sciences Data and Information Services Center (GES DISC): Greenbelt, MD, USA, 2015.
- MERRA-2 const_2d_asm_Nx: 2d, constants V5.12.4; Global Modeling and Assimilation Office (GMAO), Goddard Earth Sciences Data and Information Services Center (GES DISC): Greenbelt, MD, USA, 2015.
- Albrecht, P. Development of a Tool for the Analysis of the Global Solar and Wind Energy Potential. Master’s Thesis, Technische Universität München, München, Germany, 2016. [Google Scholar]
- Jain, A.K. Data Clustering: 50 Years beyond K-Means. Pattern Recognit. Lett. 2010, 31, 651–666. [Google Scholar] [CrossRef]
- Duque, J.C.; Anselin, L.; Rey, S.J. The Max-P-Regions Problem. J. Reg. Sci. 2012, 52, 397–419. [Google Scholar] [CrossRef]
- Han, J.; Kamber, M.; Tung, A.K. Spatial Clustering Methods in Data Mining. Geographic Data Mining and Knowledge Discovery. 2001, pp. 188–217. Available online: https://ci.nii.ac.jp/naid/10030364406/ (accessed on 23 March 2020).
- Scikit-Learn. Available online: https://scikit-learn.org/stable/modules/clustering.html#hierarchical-clustering (accessed on 28 December 2019).
- Thorndike, R.L. Who Belongs in the Family? Psychometrika 1953, 18, 267–276. [Google Scholar] [CrossRef]
- Guo, D. Greedy Optimization for Contiguity-Constrained Hierarchical Clustering. In 2009 IEEE International Conference on Data Mining Workshops; IEEE: Miami, FL, USA, 2009; pp. 591–596. [Google Scholar] [CrossRef]
- Aggarwal, C.C.; Hinneburg, A.; Keim, D.A. On the Surprising Behavior of Distance Metrics in High Dimensional Space. In Database Theory—ICDT 2001; Van den Bussche, J., Vianu, V., Goos, G., Hartmanis, J., van Leeuwen, J., Eds.; Lecture Notes in Computer Science Series; Springer: Berlin/Heidelberg, Germany, 2001; Volume 1973, pp. 420–434. [Google Scholar] [CrossRef]
- Boehmke, B.; Greenwell, B.M. Hands-on Machine Learning with R; CRC Press: Boca Raton, FL, USA, 2020. [Google Scholar]
- Heitkoetter, W.; Medjroubi, W.; Vogt, T.; Agert, C. Comparison of Open Source Power Grid Models—Combining a Mathematical, Visual and Electrical Analysis in an Open Source Tool. Energies 2019, 12, 4728. [Google Scholar] [CrossRef]
- Oeding, D.; Oswald, B.R. Elektrische Kraftwerke Und Netze; Springer: Berlin/Heidelberg, Germany, 2016. [Google Scholar]
- Puffer, R. Optimierungspotenziale Bei Freileitungen—Was Ist Machbar? 2012. Available online: https://docplayer.org/33699070-Optimierungspotenziale-bei-freileitungen-was-ist-machbar.html (accessed on 11 June 2020).
- Bundesnetzagentur. Bedarfsermittlung 2017–2030 Bestätigung Netzentwicklungsplan Strom; Bundesnetzagentur: Bonn, Germany, 2017.
- Paredes Pineda, S.N. Development and Evaluation of a Simplified Approach for Modeling Country Energy Systems. Master’s Thesis, Technische Universität München, München, Germany, 2019. [Google Scholar]
- Müller, C.; Hoffrichter, A.; Wyrwoll, L.; Schmitt, C.; Trageser, M.; Kulms, T.; Beulertz, D.; Metzger, M.; Duckheim, M.; Huber, M.; et al. Modeling Framework for Planning and Operation of Multi-Modal Energy Systems in the Case of Germany. Appl. Energy 2019, 250, 1132–1146. [Google Scholar] [CrossRef]
- U.S. Energy Information Administration. International Energy Statistics. Available online: https://www.eia.gov/beta/international/data/browser (accessed on 1 November 2018).
- IRENA. REthinking Energy 2017: Accelerating the Global Energy Transformation; International Renewable Energy Agency (IRENA): Abu Dhabi, UAE, 2017.
- Schaber, K.; Steinke, F.; Hamacher, T. Transmission Grid Extensions for the Integration of Variable Renewable Energies in Europe: Who Benefits Where? Energy Policy 2012, 43, 123–135. [Google Scholar] [CrossRef]
- Bundesnetzagentur. Kostenschaetzungen NEP 2030. Available online: https://www.netzentwicklungsplan.de/de/kostenschaetzungen-zu-kapitel-42-2 (accessed on 3 June 2020).
- GET Invest. Available online: https://www.get-invest.eu/market-information/south-africa/energy-sector/ (accessed on 30 March 2020).
- IEA. Electricity Generation by Source, South Africa 1990–2017. Available online: https://www.iea.org/countries/south-africa (accessed on 3 June 2020).
- Dunnett, S.; Sorichetta, A.; Taylor, G.; Eigenbrod, F. Harmonised Global Datasets of Wind and Solar Farm Locations and Power. Sci. Data 2020, 7, 130. [Google Scholar] [CrossRef] [PubMed]


© 2020 by the authors. Licensee MDPI, Basel, Switzerland. This article is an open access article distributed under the terms and conditions of the Creative Commons Attribution (CC BY) license (http://creativecommons.org/licenses/by/4.0/).