Article

Design and Implementation of an Energy-Management System for a Grid-Connected Residential DC Microgrid

by
Alfredo Padilla-Medina
1,
Francisco Perez-Pinal
1,
Alonso Jimenez-Garibay
2,
Antonio Vazquez-Lopez
3 and
Juan Martinez-Nolasco
2,*
1
Departamento de Ingeniería Electrónica, Tecnológico Nacional de México/IT de Celaya, Celaya 38010, Guanajuato, Mexico
2
Departamento de Ingeniería Mecatrónica, Tecnológico Nacional de México/IT de Celaya, Celaya 38010, Guanajuato, Mexico
3
Departamento de Ingeniería Industria, Tecnológico Nacional de México/IT de Celaya, Celaya 38010, Guanajuato, Mexico
*
Author to whom correspondence should be addressed.
Energies 2020, 13(16), 4074; https://doi.org/10.3390/en13164074
Submission received: 13 May 2020 / Revised: 3 August 2020 / Accepted: 3 August 2020 / Published: 6 August 2020
(This article belongs to the Special Issue Clean Energy Microgrids)

Abstract

:
The design and implementation of an energy-management system (EMS) applied to a residential direct current microgrid (DC-µG) is presented in this work. The proposed residential DC-µG is designed to provide a maximum power of one kilowatt by using two photovoltaic arrays (PAs) of 500 W, a battery bank (BB) of 120 V–115 Ah, a supercapacitor module of 0.230 F and a bidirectional DC–AC converter linked to the AC main grid (MG). The EMS works as a centralized manager and it defines the working operation mode for each section of the DC-µG. The operation modes are based on: (1) the DC-link bus voltage, (2) the generated or demanded power to each section of the DC-µG and (3) the BB’s state of charge. The proposed EMS—during the several working operation modes and at the same time—can obtain the maximum energy from the PAs, reduce the energy consumption from the main grid and keep the DC-link bus voltage inside a range of 190 V ± 5%. The EMS and local controllers are implemented by using LabVIEW and NI myRIO-1900 platforms. Moreover, experimental results during connection and disconnection of each DC-µG sections and different on-the-fly transitions are reported, these results focus on the behavior of the DC bus, which shows the DC bus robustness and stability. The robustness of the DC-µG is demonstrated by maintaining a balance of energy between the sources and loads connected to the DC bus under different scenarios.

1. Introduction

Power consumption increase and the never-ending industrial demand on electrical energy have resulted in a higher requirement of electrical energy generation worldwide and therefore, a depletion of conventional generation resources, such as fossil fuels. On the other hand, renewable energies are still facing issues for massive generation and supply due to its unpredictable nature. These challenges have allowed a development in efficient technologies for energy conversion. An alternative to cope this situation is the use of renewable energy sources; however, its’ massive introduction and sustainable production are still open challenges to be satisfied. One alternative to solve these issues is the distributed generation techniques sourced by renewable energy which require efficient and highly reliable power management schemes in microgrids [1].
Among the investigations carried out on energy-management systems (EMSs) in microgrids (µGs) there are different approaches. In [2] a theoretical reference is presented for the optimization and operation of µGs considering the impact of energy storage, the integration of renewable energy sources and the request for an answer for a case in Hong Kong. In [3] a study of interconnected µGs is presented, focusing on energy commercialization and scheduling strategies considering the local energy consumption (individual µG), but also on the exchange of energy between µGs, demonstrating a reduction in operating cost up to 13%. In [4] an effective EMS applied in integrated building systems and µGs is presented, demonstrating that the proposed system has the ability to preserve energy and reduce consumption costs. This EMS considers aspects such as distributed heat generation and characteristics of electrical generation. The results of this research focus on the behavior of the energy of the elements of the µG, the frequency and the voltage in response to their proposed master-slave control system, heat flow and temperature. All these studies present results using numeric simulation and focus on the analysis of energy levels between µGs and the elements that compose them.
An example, of the configuration of a microgrid is a residential direct current microgrid (DC-µG) using photovoltaic solar panels as a main energy source. A conventional grid-connected DC-µG is constituted by different elements such as: generators, storage energy devices, loads and the interconnexion device linked to the alternating current (AC) main grid (MG). Usually, those elements are connected to the DC-link through power electronic converters (PECs). In this proposal, the efficiency of two optimization strategies of a DC-µG is evaluated: (1) a centralized EMS that manages the energy in the batteries in order to keep the bus voltage stable; (2) optimization of switching frequency of each converter to improve its efficiency. The authors conclude that both independent strategies increase the efficiency of DC-µG [5].
In [6], the authors carry out a scientific review about control strategies, stability analysis and stabilization techniques implemented in a DC-µG, one of their main conclusions is that the local control of the converters is relevant to the integration of a level of control higher than most used in the control techniques that are proportional-integral (PI), proportional-derivative (PD), proportional-integral-derivative (PID) and fuzzy control (FC). Regarding communication between the elements of a DC-µG, the authors conclude that three basic control strategies have been widely reported: (1) Decentralized control: the digital communications links are nulled and the electric lines are used as communication channels. Usually, the DC-link voltage demand is used as feedback; (2) Centralized control: the information is generated by different devices, and it is sent to a unique master. In this master, data are processed and sent it back by using different digital communication links; (3) Distributed control: The digital communication channels are implemented between systems and the coordinated control strategies are locally processed.
Lately, there have been reports of EMS applied in DC-µG with good simulation results, and a brief review following the report. Reference [7] reported an isolated DC-µG with a DC-link of 24 V and connected to different loads (laptop (19 V, 65 W), lighting LED (240 V, 90 W), fan (48 V, 90 W)) by using appropriate PECs and one active filter. The proposed design facilitates standalone powering of a rural household which need less than 250 W provided by a PA. Reference [8] proposed a hierarchical controller based on three operation modes, the controller guaranteed the DC-link bus stability for the different operation modes, only numeric results are reported. Considering three modes of operation under six operational situations in terms of load variations, an analysis of operation times is performed for each of the six operational situations under consideration.
Further DC-µG configurations are the ones reported in [9,10]. In these proposals, a supercapacitor bank is connected to the DC-link bus by using a bidirectional converter. Additionally, a virtual resistor and capacitor is used as an impedance control loop, between the DC-link and converter. The reported numeric results in MATLAB, showed a good dynamic response, which was more precise compared with previous topologies. However, it lacked practical or at least hardware in the loop (HIL) validation. On the other hand, a decentralized power management for an isolated DC-µG was reported in [11]. In this investigation, numeric results were obtained by using SIMULINK the results showed an adaptive I/V characteristic as a decentralized control strategy of a hybrid DC-µG whose structure contains a PA and battery energy storage system and wind turbine generator that can keep the DC-link bus stable even when the energy demand exceeds the maximum power generation. Following this trend, a different isolated DC-µG with six operation modes was controlled by using an energy balance method [12]. In this study, an interesting scheme to control the on-the-fly photovoltaic transitions between modes was reported, which reduced the DC-link bus oscillations. Restrictions of this scheme were the use of only linear loads and a maximum bus variation of 6%.
Another branch of EMS is the development and application of intelligent algorithms. For instance, reference [13] proposed an isolated residential DC-µG controlled by a fuzzy logic EMS. In this work, only SIMULINK numeric results were achieved and the FC is evaluated under two scenarios of a DC-µG consisting of PAs, wind turbine, battery bank (BB), fuel cell and diesel generator supplying a typical residential load, the EMS is controlled by a low complexity FC with only 25 fuzzy rules that combine two input variables, the state of battery charge and the power difference between generated power from renewables and load demand ΔP represent the power difference between generated power from renewables and load power during day hours. The authors consider their proposal as an economic dispatch problem. A further centralized fuzzy logic proposal was reported in [14]. In this study, an accurate DC-link voltage and current regulation was achieved for a DC-µG. As a result, authors claimed a cost reduction compared with centralized controllers. Unfortunately, only resistive loads and numeric results were stated. In [15], a low voltage (200 V) grid-connected DC-µG with PA and storage unit was reported. In this proposal, a neuronal controller was implemented and behavior in the DC-link was given. Once again, HIL or practical results were missed.
On the other hand, investigations that present experimental tests, [16] proposes a flexible control mechanism to change the operation mode of photovoltaic systems in a DC-µG, although experimental results were presented, the stability of the DC-link bus was not presented. Study [17] present a multi-condition strategy based on energy management for an isolated DC-µG consisting of a PA, a fuel cell and a BB. This proposal distributes the energy and keeps the DC-link bus voltage stable in different operating conditions that depend on the state of charge (S°C) of the batteries, the loads and the power of the PA. To verify the operation of the proposed administration system, an experimental prototype was implemented considering that the results obtained were good.
In [18] the authors proposed a centralized control technique for EMS in an experimental prototype of a DC-µG with a 380 V bus, this µG is interconnected to the MG through a PEC, which is in charge of EMS, regulating the DC-link bus. LabVIEW software is used to monitor the power of the DC-µG. Case studies are presented considering irradiation changes, resistive load, S°C and power limits. In the quest to improve energy management in a DC-µG with a BB, [19] proposed the use of a fuzzy controller to improve the life cycle of a BB, stabilizing the DC-link bus in a range of 380 V ± 20 V; this system uses LabVIEW software to implement the EMS. LabVIEW is an alternative in EMS design, this is because it has boards for monitoring and control. [20] used the PCI-MIO16-E-4 board to control a three-phase converter which is used to control an induction motor connected in a DC-µG with a 600 V bus, the experimental tests presented used resistive loads. In [21] the authors proposed a power control approach to provide energy management and stabilization of a hybrid DC-µG for transportation applications, the control system was implemented on dSPACE real-time boards. The simulation results shown the effectiveness of the control system to manage the power flows between the supercapacitor, the rectifier and the load; furthermore, the authors found that the experimental results are consistent with the simulations. In [22] a fault-tolerant supervisory controller (FTSC) is proposed, and its effectiveness is evaluated using a hybrid AC/DC µG simulated in MATLAB considering the effects of maximum power derived from possible failures in solar and wind systems, the proposed FTSC considers a procedure to determine the maximum power available under fault conditions and increases the tolerance of the supervisory controller. These faults in solar and wind systems represent an unknown dynamic that can be modeled using fuzzy controllers. Consequently, in [23] a control strategy for a hybrid renewable energy sources (HRES) system is proposed using FC systems that contain adaptive rules to obtain better performance from an HRES system evaluated under different load conditions and failures in renewable energy sources.
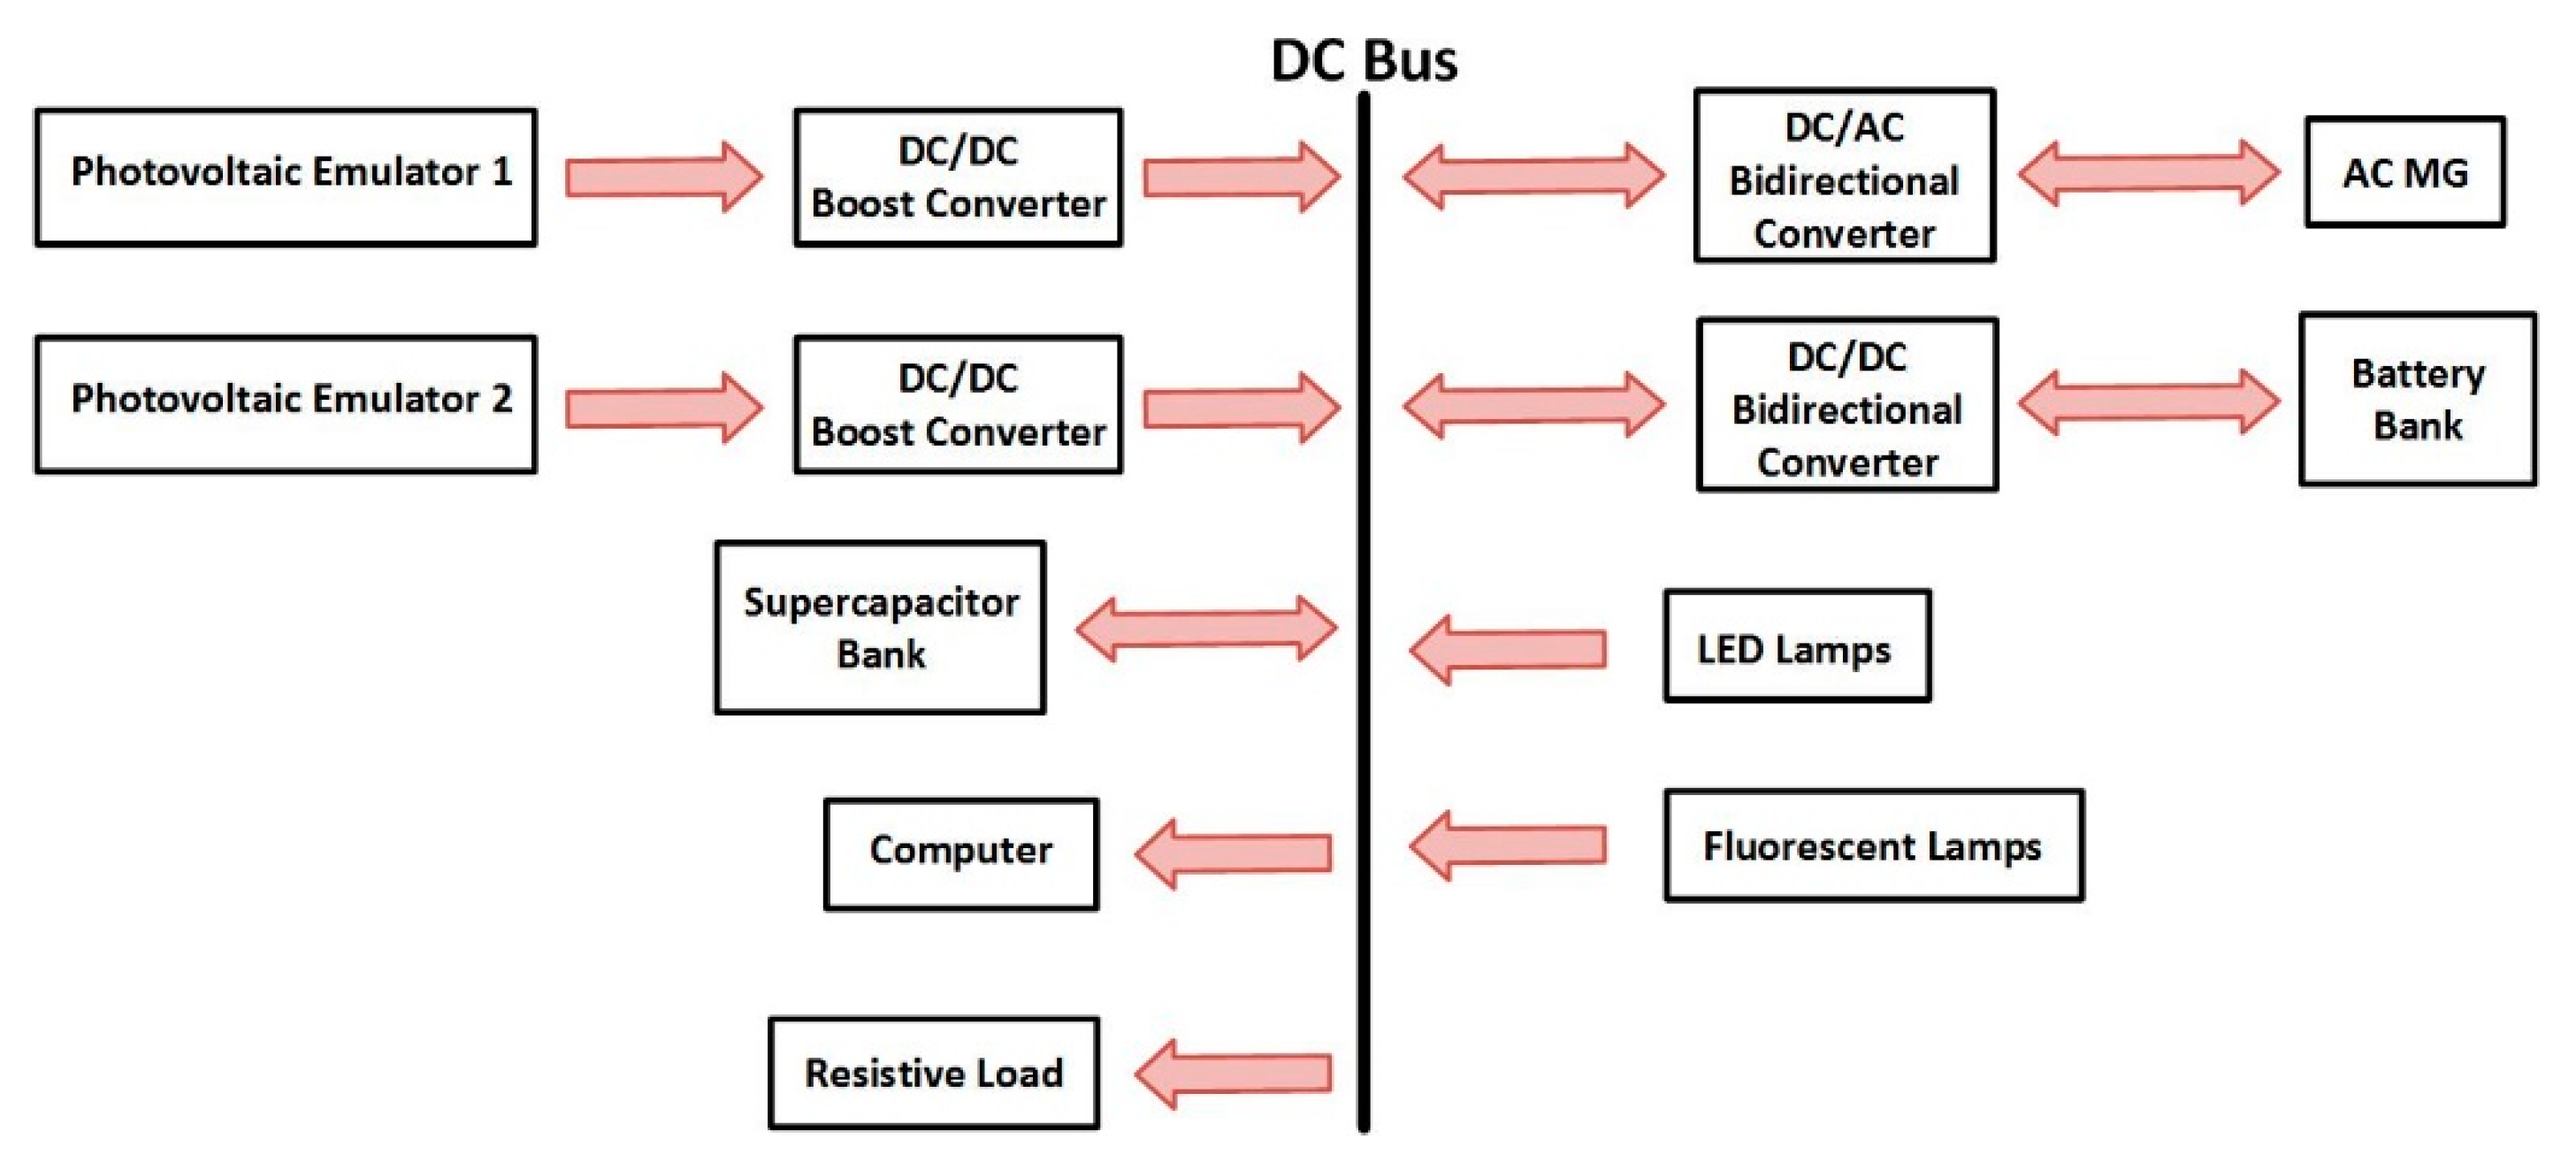
The previously described state of the art shows that several architectures implemented in hardware have been reported with satisfactory results. However, in author’s opinion, some of them are oversimplified and other considers ideal conditions, which are not satisfied in real-life situations. Therefore, this study proposes a methodology for the design and implementation of a EMS that has a global administrator, which defines the operation mode each PEC’s controllers inside the DC-µG. Both controllers use National Instruments technology; indeed, the embedded EMS was used in an experimental DC-µG prototype that has two PAs, a BB and a bidirectional DC–AC converter to interconnect it. Experimental tests on DC-µG’s behavior with the EMS were performed using electronic loads such as computer equipment, LED lamps and fluorescent lamps focusing on the behavior of the DC-link bus when connecting and disconnecting sources and loads which generate changes in the operating modes of each of the local controllers in charge of manipulating the PECs that make up the DC-µG.
The obtained results show stability in the DC-link bus due to the generated disturbances and to changes in the operating modes of the DC-µG components, advantages of this proposed system compared with reported literature is listed to follow. First, results obtained show that it is not necessary to include electrical components to the network for the connection and disconnection of energy sources and real loads. Second, the DC-µG state machine that controls the global manager considers six operating scenarios to stability of the DC bus, taking advantage of the maximum power of the PAs, balancing the energy generated and demanded by the elements that make up the DC -µG, and take care of the charging and discharging processes of the battery bank, thus increasing their useful life. Third, results presented focus on the behavior of the DC bus when connecting and disconnecting electronic sources and loads used daily, which shows robustness and stability, presenting transitory response times between 4 and 20 s with variations in voltage on the bus less than 5%. Finally, using the LabVIEW virtual instrumentation software (2015, National Instruments, USA) and the NI myRIO-1900 for the implementation of the global administrator and local controllers has virtues such as the generation of a user-friendly interface, which allows monitoring relevant variables of the DC- µG and modify parameters of the controllers in real time. Additionally, it has flexibility for the quick reconfiguration of the generated controllers, which enables the generation of more complex systems in a short time, adapting embedded systems to new experiments.
This work is organized as follows: In Section 2, the structure of the DC-µG used to evaluate the EMS under different scenarios is described. In Section 3, the control and management system (CMS) is described which establishes the mode of operation for each element of the DC-µG in order to extract the maximum energy from the PVEs. In Section 4, the results obtained are described to verify the behavior of the CMS embedded with the experimental prototype of the DC-μG, each of the PVEs was configured with the following parameters: Vmpp = 120 V, Voc = 130 V, Impp = 2 A and Isc = 3 A. Section 5, finally, presents a brief summary and conclusions of the obtained results.

2. DC Microgrid Structure

The DC-µG was designed to deal with a maximum power of 1 kW, with a DC-link bus of 190 V. The energy direction between sources and loads is shown with blue color lines Figure 1 and the experimental prototype is shown in Figure 2. The left part of Figure 1 shows two PAs emulated with two Agilent E4360A which were connected to a pair of 600 W DC–DC boost converters this section as the main energy source. On the other hand, in the right section of Figure 2, a bidirectional DC–AC converter allows to flow energy, in both directions, between the DC-µG to the MG. Additionally, a BB of 115 Ah and 120 V is connected to the DC-link bus by using a bidirectional buck–boost converter. Finally, a supercapacitor bank of 0.230 F is directly linked to the DC-link bus, without converter, this bank allows to support the DC-link voltage during connection or disconnection of any µG section.
The selection of the DC-µG bus voltage level is due to the operating characteristics of the loads connected to the bus, these are conventional electrical loads designed for connection to the AC MG with a universal input voltage range of 100–264 VAC according to manufacturer specifications, the objective of using these loads is to demonstrate that these types of nonlinear loads do not require any type of electrical modification to be connected to the voltage bus of the proposed DC-µG. With these considerations, the PECs in charge of transferring energy between the different elements of the DC-µG were designed. It is important to mention that the reported research studies operate with DC buses in operating ranges between 190 V to 210 V [24,25].

2.1. DC–DC Boost Converter

As mentioned before, the main DC-µG sources, PAs, are two photovoltaic emulators (PVEs), those are connected to a pair of classical boost converters, Figure 3. The boosts converters were designed with a step-up relation of VµG⁄VPVE = 1.5 (VµG DC bus voltage, VPVE PVE voltage) and continuous conduction mode. These specifications allow to achieve 190 V in the maximum power point (MPP) and buy using [26], with a frequency of 40 kHz, the following data were obtained, L = 107 µH, C = 440 µF. It is necessary to mention that, in order to use of PVEs was required to provide the following parameters: voltage in the maximum power point (Vmpp), open-circuit voltage (Voc), current in the maximum power point (Impp) and short-circuit current (Isc). Additionally, those parameters rely on the µG’s experimental tests.

2.2. Bidirectional DC–AC Converter

Figure 4 shows the designed bidirectional buck–boost converter. During the rectifier operation from MG to the DC-link, this converter provides energy to the DC loads, to the BB or both. On the other hand, during the inverter operation, it provides energy from the DC-link to the MG.
This converter requires a capacitor Cbus, to stabilize the DC-link voltage. The minimum capacitance is given by:
C bus = ( 4 P out ) ( t 1 ) V 2 µ G , min = 308   µ F ,
where Pout represents the output power, VµG,min the minimum DC bus voltage required to transfer energy to the MG and t1 the time interval given as
t 1 = 1 4 f grid = 4.16   ms ,
where fgrid is the grid frequency, with a value of 60 Hz. On the AC side, an LCL filter is connected to the midpoints of inverter legs and is used to interface the DC-link to the MG. To design the LCL was followed the Official Mexican Norm (NOM) and the Mexican Electricity Commission (CFE), those are based on IEC 61727:2004. The filtering inductance is obtained as
L f = ( V µ G V grid , pk ) D n · Δ I f · f sw = ( 190 170 ) × ( 0.8 ) ( 3 ) × ( 0.1 ) × ( 25000 ) = 2.13   mH ,
where n represents the number of levels of the inverter (+VµG, −VµG and 0), D the duty cycle, fsw the commutation frequency and ΔIf the ripple current. The criteria considered for the design of the filtering inductance is that ΔIf should be 10% of the nominal value of If. The Cf capacitance was designed to allow the maximum reactive power exchange. In this operation point the value were:
X C f V grid , max 2 P reactive = 54   ,
C f 1 ω · X C f = 49   μ F ,
The filter resonance frequency, fres, was given as
f res = 1 2 π L f + L g ( L f ) ( L g ) ( C f ) ,
where fres should be 0.5 times the commutation frequency and 10 times the fundamental frequency of the MG, to avoid any problems related with the resonance state of the LCL filter. This criterion is met by assigning values of 1 mH and 1 µF to Lg and Cf, respectively, and considering a 2% of the value obtained for Cf [27]. As a result, a fres of 6.1 kHz was obtained.

2.3. Bidirectional DC–DC Converter

A traditional buck–boost DC–DC converter was used, and it is shown in Figure 5. In this kind of converter, the energy direction is controlled by firing S1 and S2. In the step-down operation, DC-link to BB, S1 is switching and S2 is open. During the step-up operation, BB to DC-link, S1 is open and S2 is switching. The BB was made by connecting ten deep-cycle batteries CALE-SOLAR (CL-31 T/S-190 M) in series, each one with a voltage of 12 V and 115 Ah. Additionally, a passive equalization method was employed to guarantee the voltage balance between cells [28]. Table 1 shows the parameters to design the bidirectional DC–DC converter; Table 2 shows the determined parameters.

2.4. Load Description

To evaluate the system under different scenarios, linear and nonlinear loads were used. A resistive load of 600 Ω was utilized as a linear load. On the contrary, three different nonlinear loads were used. The first one was a set of seven LED lamps of 23 W each one; the second was a group of four Louver light system with three fluorescent lamps of 28 W T5 each one (those included an electronic ballast); finally, a laptop with a maximum power of 300 W was employed.

3. Control and Management System

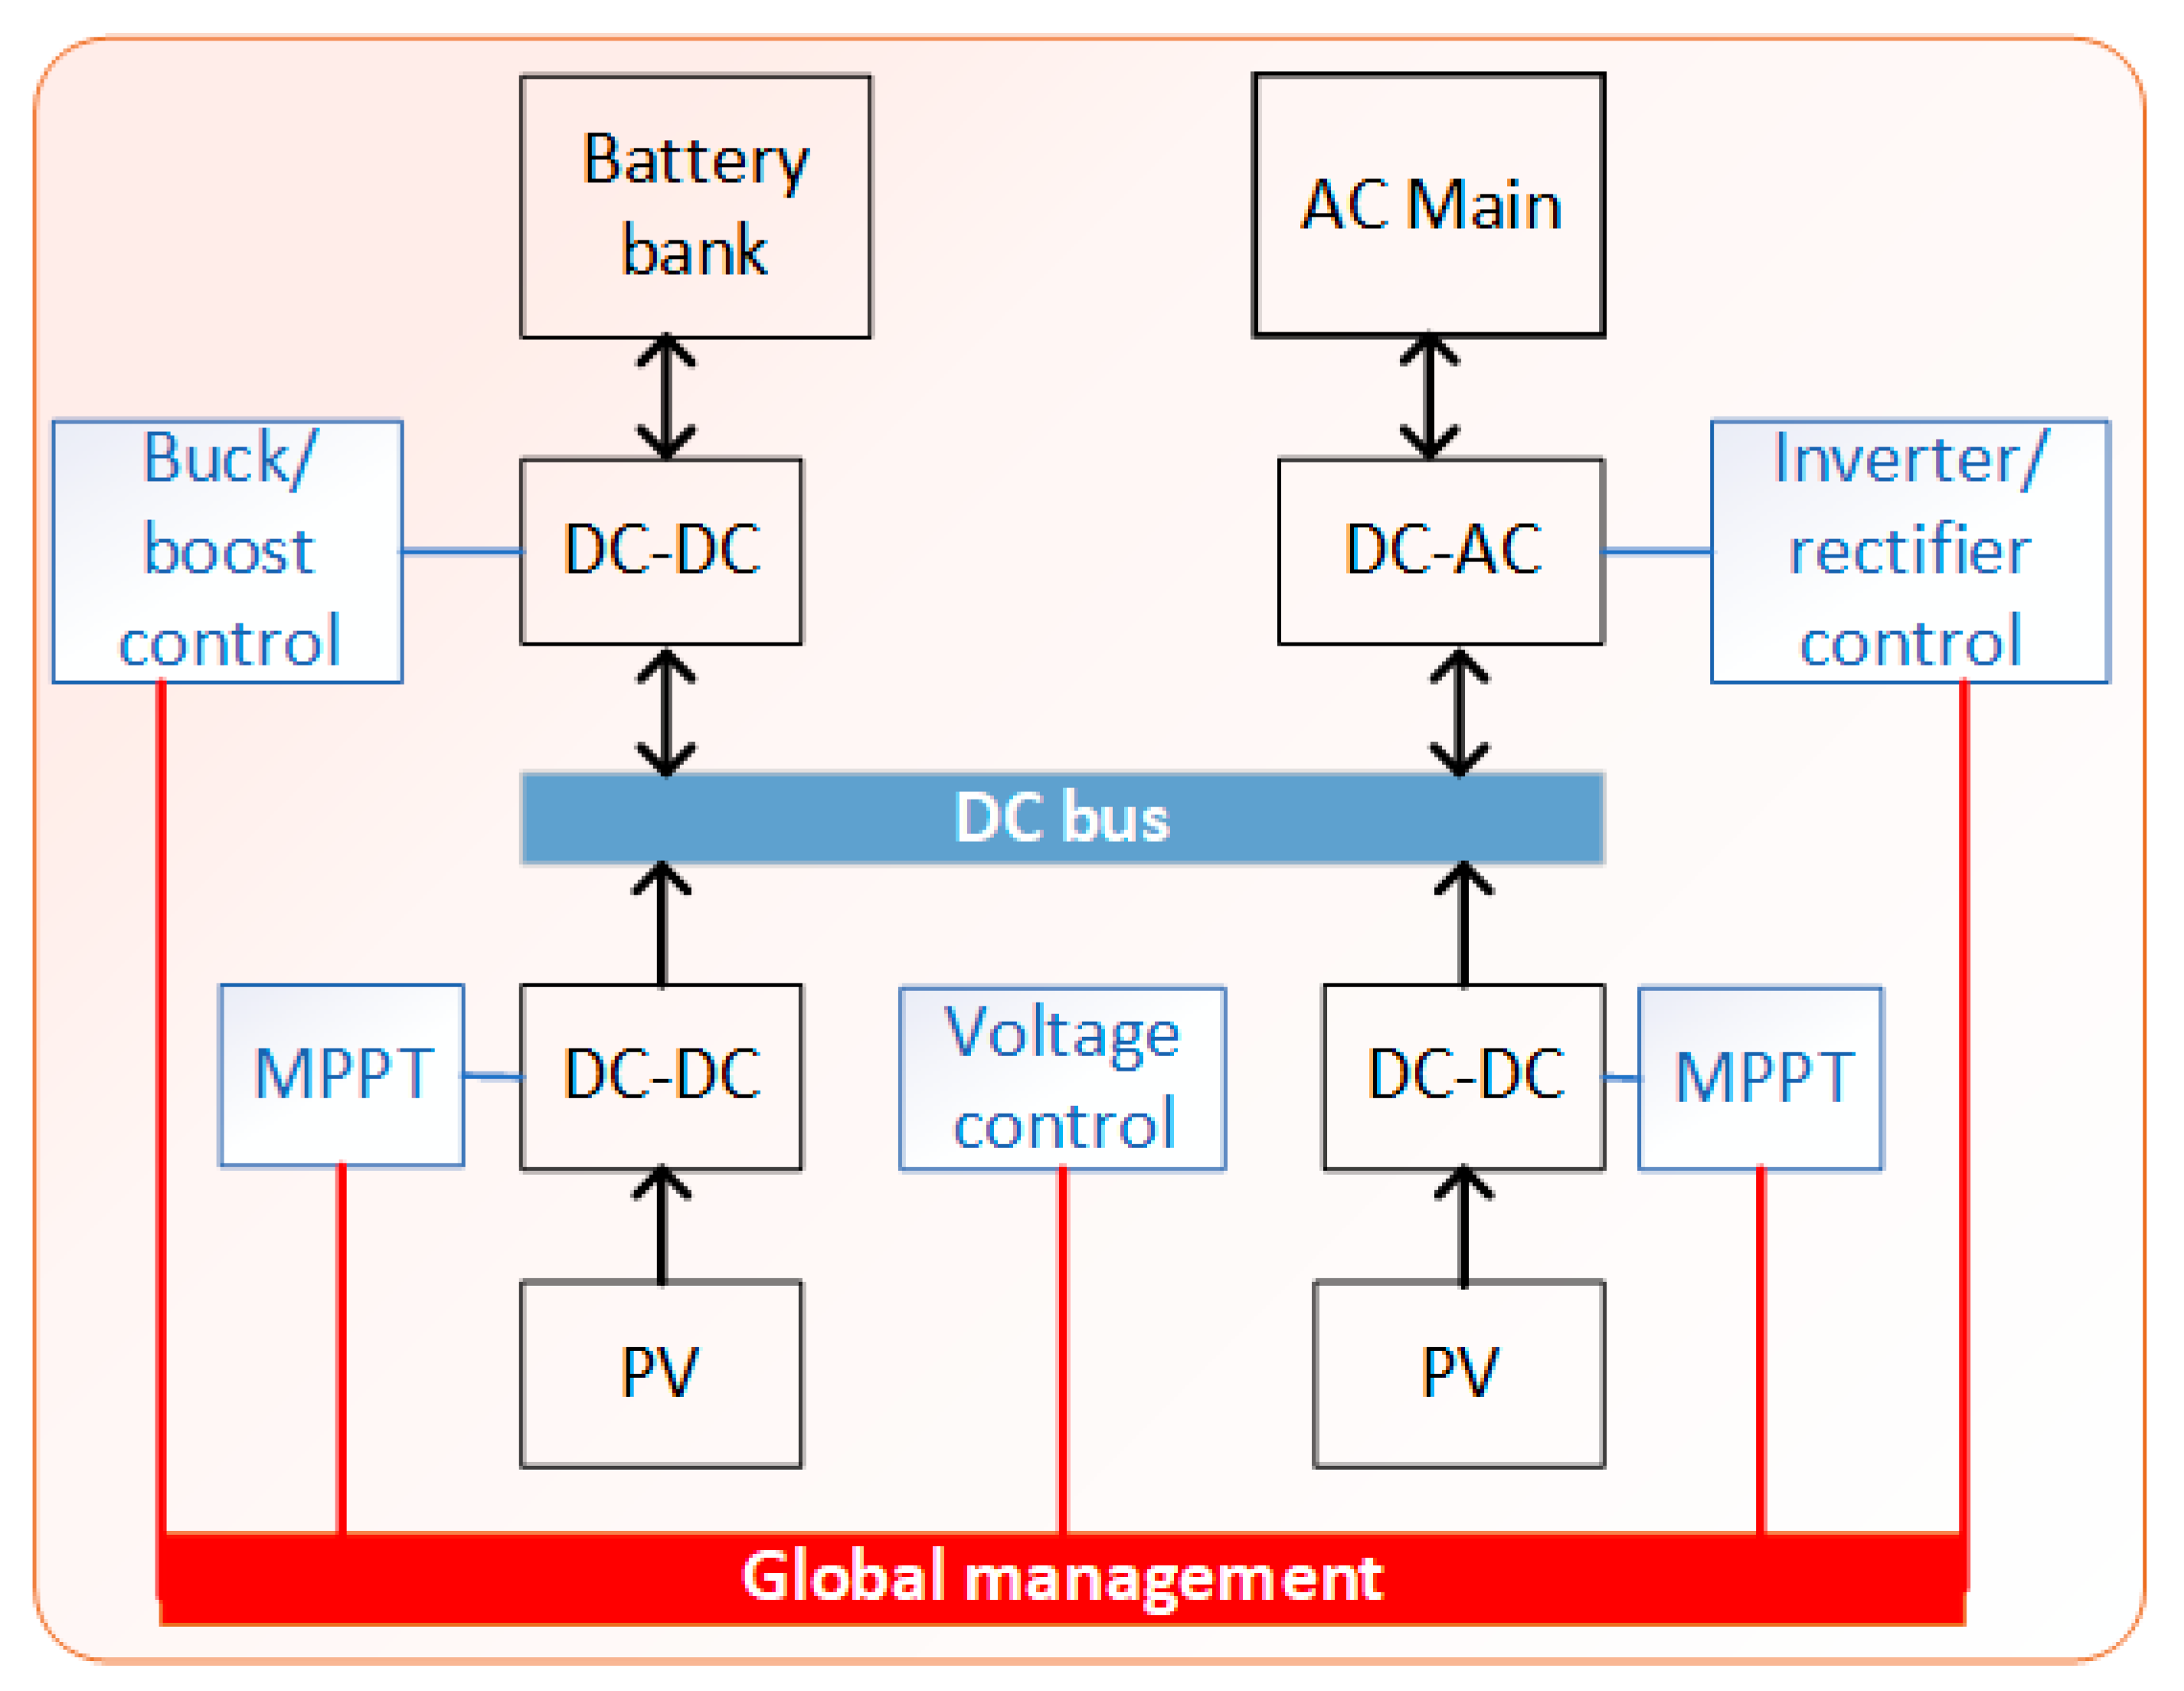
The proposed CMS consist of a general administrator and independent controllers, which operates different µG’s systems. The general block system of the µG is shown in Figure 6. The black color represents the µG’s systems and the blue color the different local controllers. Additionally, the global controller is shown in red color. More details about the different working modes and operation of the DC-µG are given in the following sections.

3.1. Global Management Controller

The global management controller (GMC) operates with the following six hierarchical scenarios: (1) to maintain the DC-link bus voltage in an operation range of 190 V ± 5%, (2) to consume the maximum energy from the PVE (to reduce the energy coming from the MG), (3) in the case of low load energy consumption and over generated energy from the PVE, the remained energy is stored in the BB, (4) in the case of full charge of the BB or BB discharge, the generated energy is send to the MG, (5) in the case that the load’s consumption is bigger than the generated energy from the PVE, the energy difference will be provided by the MG and (6) energy from BB will be used only when the MG is not available or in the case that the generated energy from the PVE and the MG are not enough to cope the demanded load energy.
These scenarios were considered for the design of the GMC in order to keep the DC bus stable, if the bus destabilizes or goes out of the established range, the connected loads could be damaged. On the other hand, it is of utmost importance to make the most of the renewable energy source that MG has. In addition, to defining the energy exchange between the BB and the MG loads, the cost of electrical energy was considered. It is more expensive to transfer energy to the BB than to the MG. Reason why, if there is a surplus of photovoltaic energy, this energy will be stored in the BB and not in the MG. Otherwise, if the loads connected to the DC bus demand more energy than that generated by the PVEs, the missing energy will be taken from the MG and not from the BB. Finally, for the BB charging and discharging process, it is considered that the processes must be completed to take care of the BB’s useful life.
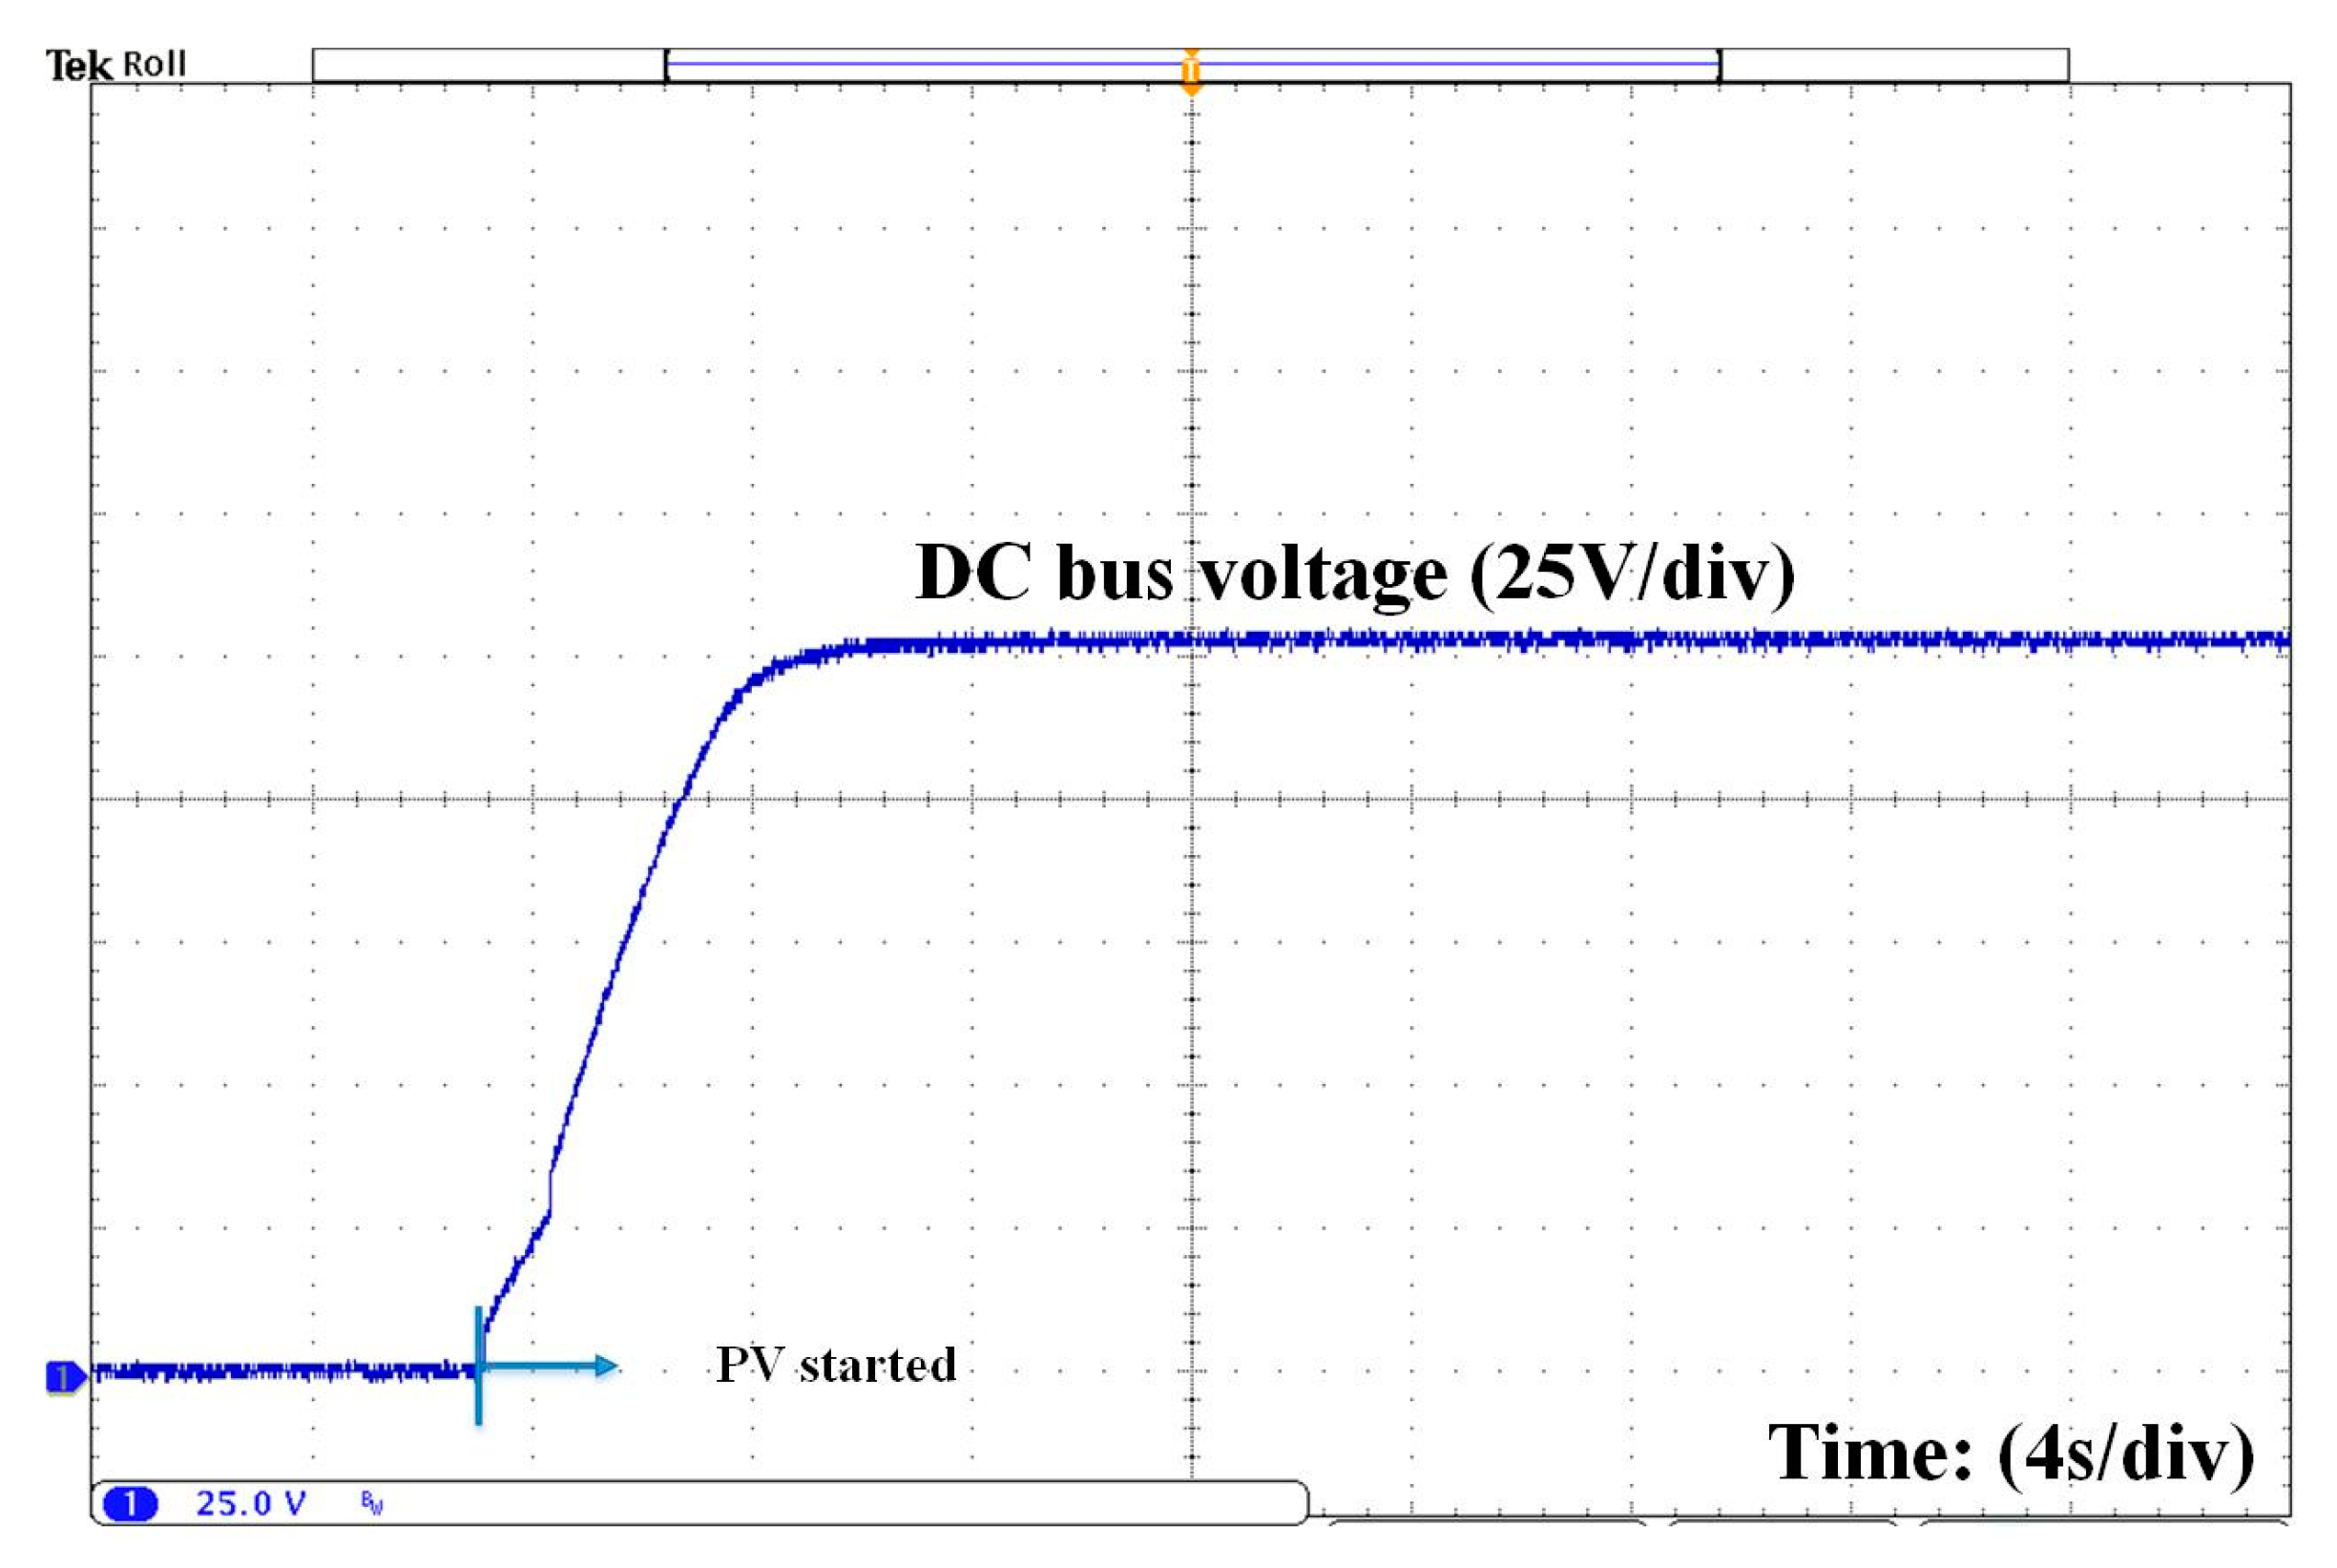
It can be noticed that the GMC works as a function of the DC-link bus voltage and the working operation mode of each µG section. During the startup, the PVEs are turned on and those work in the voltage control (VC) mode, in this period, the BB and the MG are turned off. Once the system reaches the steady state, the different loads are connected.
If the demanded load energy is greater than the generated by the PVEs, the DC-link voltage will decrease, in this situation if the voltage reaches a minimum of 183 V (2 V before the critical value of 180.5 V), the GMC changes the PVEs controller to a maximum power point tracking (MPPT), and it obtains the energy difference from the DC–AC rectifier. As a result, the DC-link voltage is stabilized and the load energy demand is handled. This operation mode is also used if the energy generated by the PVEs is not enough to supply the energy demanded by the loads connected to the bus. However, this operation mode can be changed if the BB is chosen to cope the energy difference or during lack of solar or MG energy.
On the other hand, if the µG is in steady state, with the PVEs working in VC mode, and the demanded power by loads in less than 80% of the DC-link maximum capacity, the GMC monitors the S°C of the BB and the MG with the main aim to change the PVE’s operation mode to MPPT and send energy to the BB or the MG. In other words, the energy sent to the BB or the MG is the difference energy generated from the PVEs and the one demanded by loads.
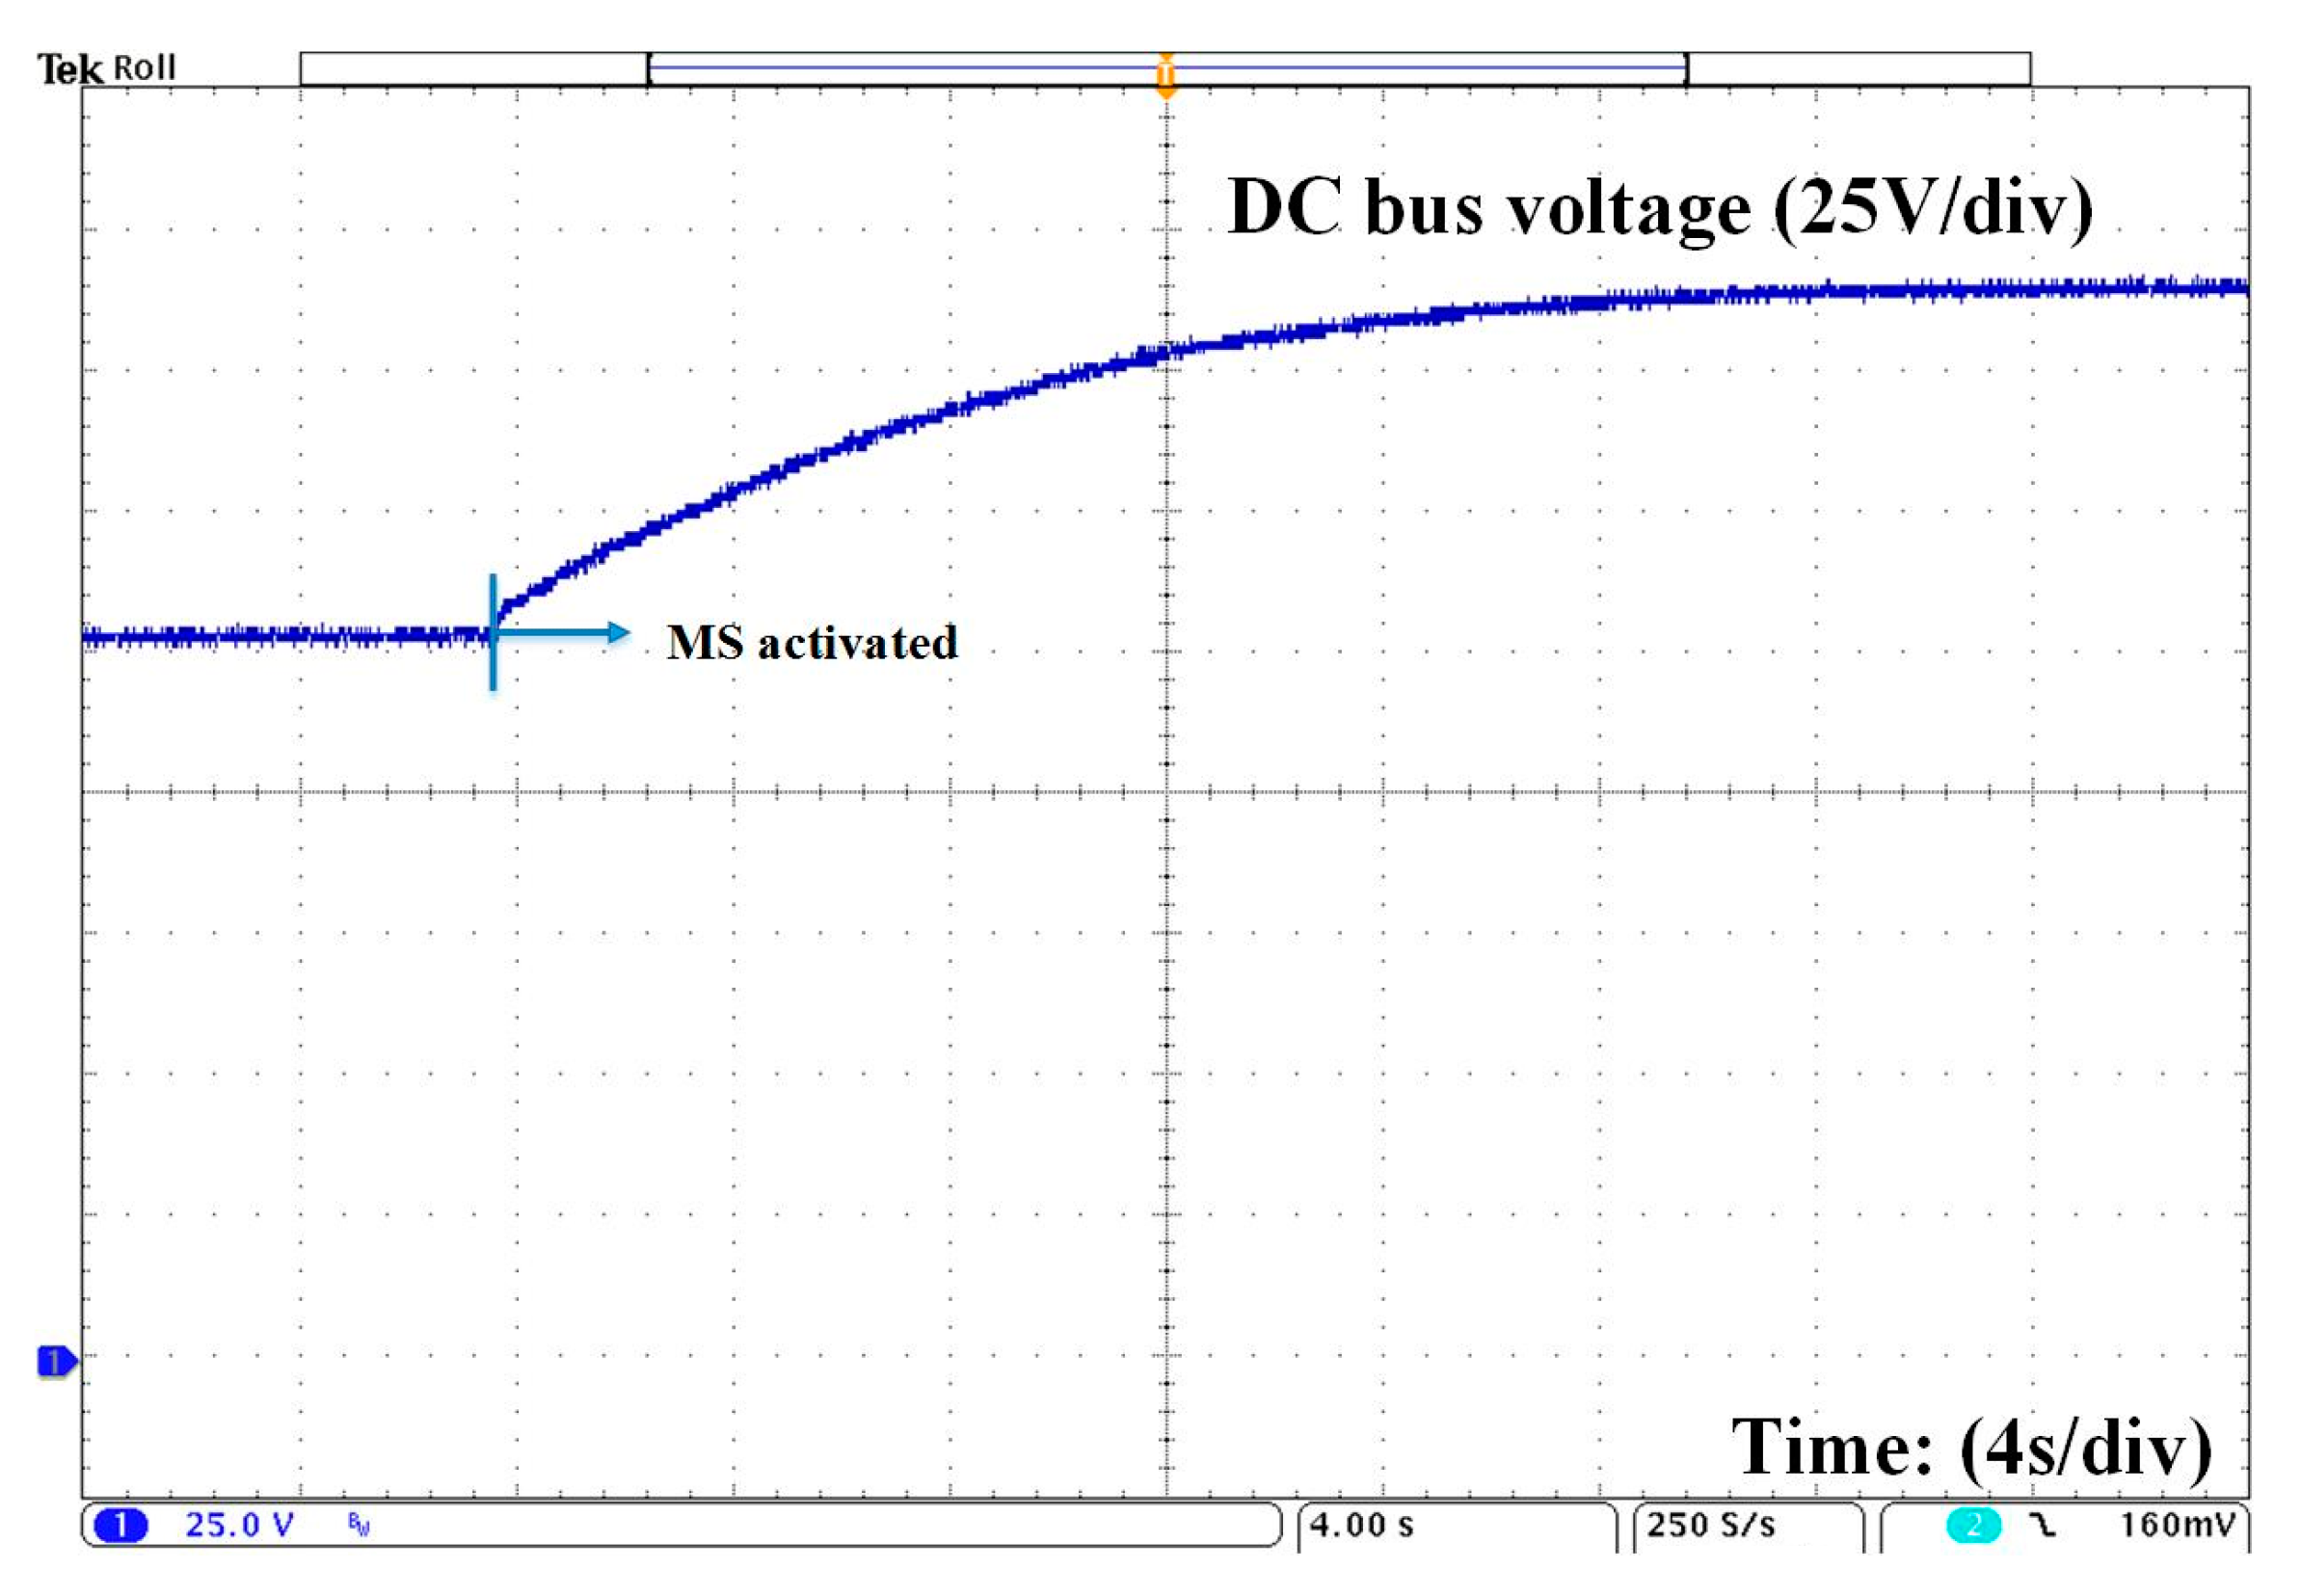
If the BB is depleted or in charging mode, with a light load and the PVE energy is not available, the energy to charge the BB is obtained from the bidirectional DC–DC converter. On the contrary, if the BB is charged, with a light load and the PVE energy is available, the energy is sent to the MG by using the bidirectional DC–DC converter. 
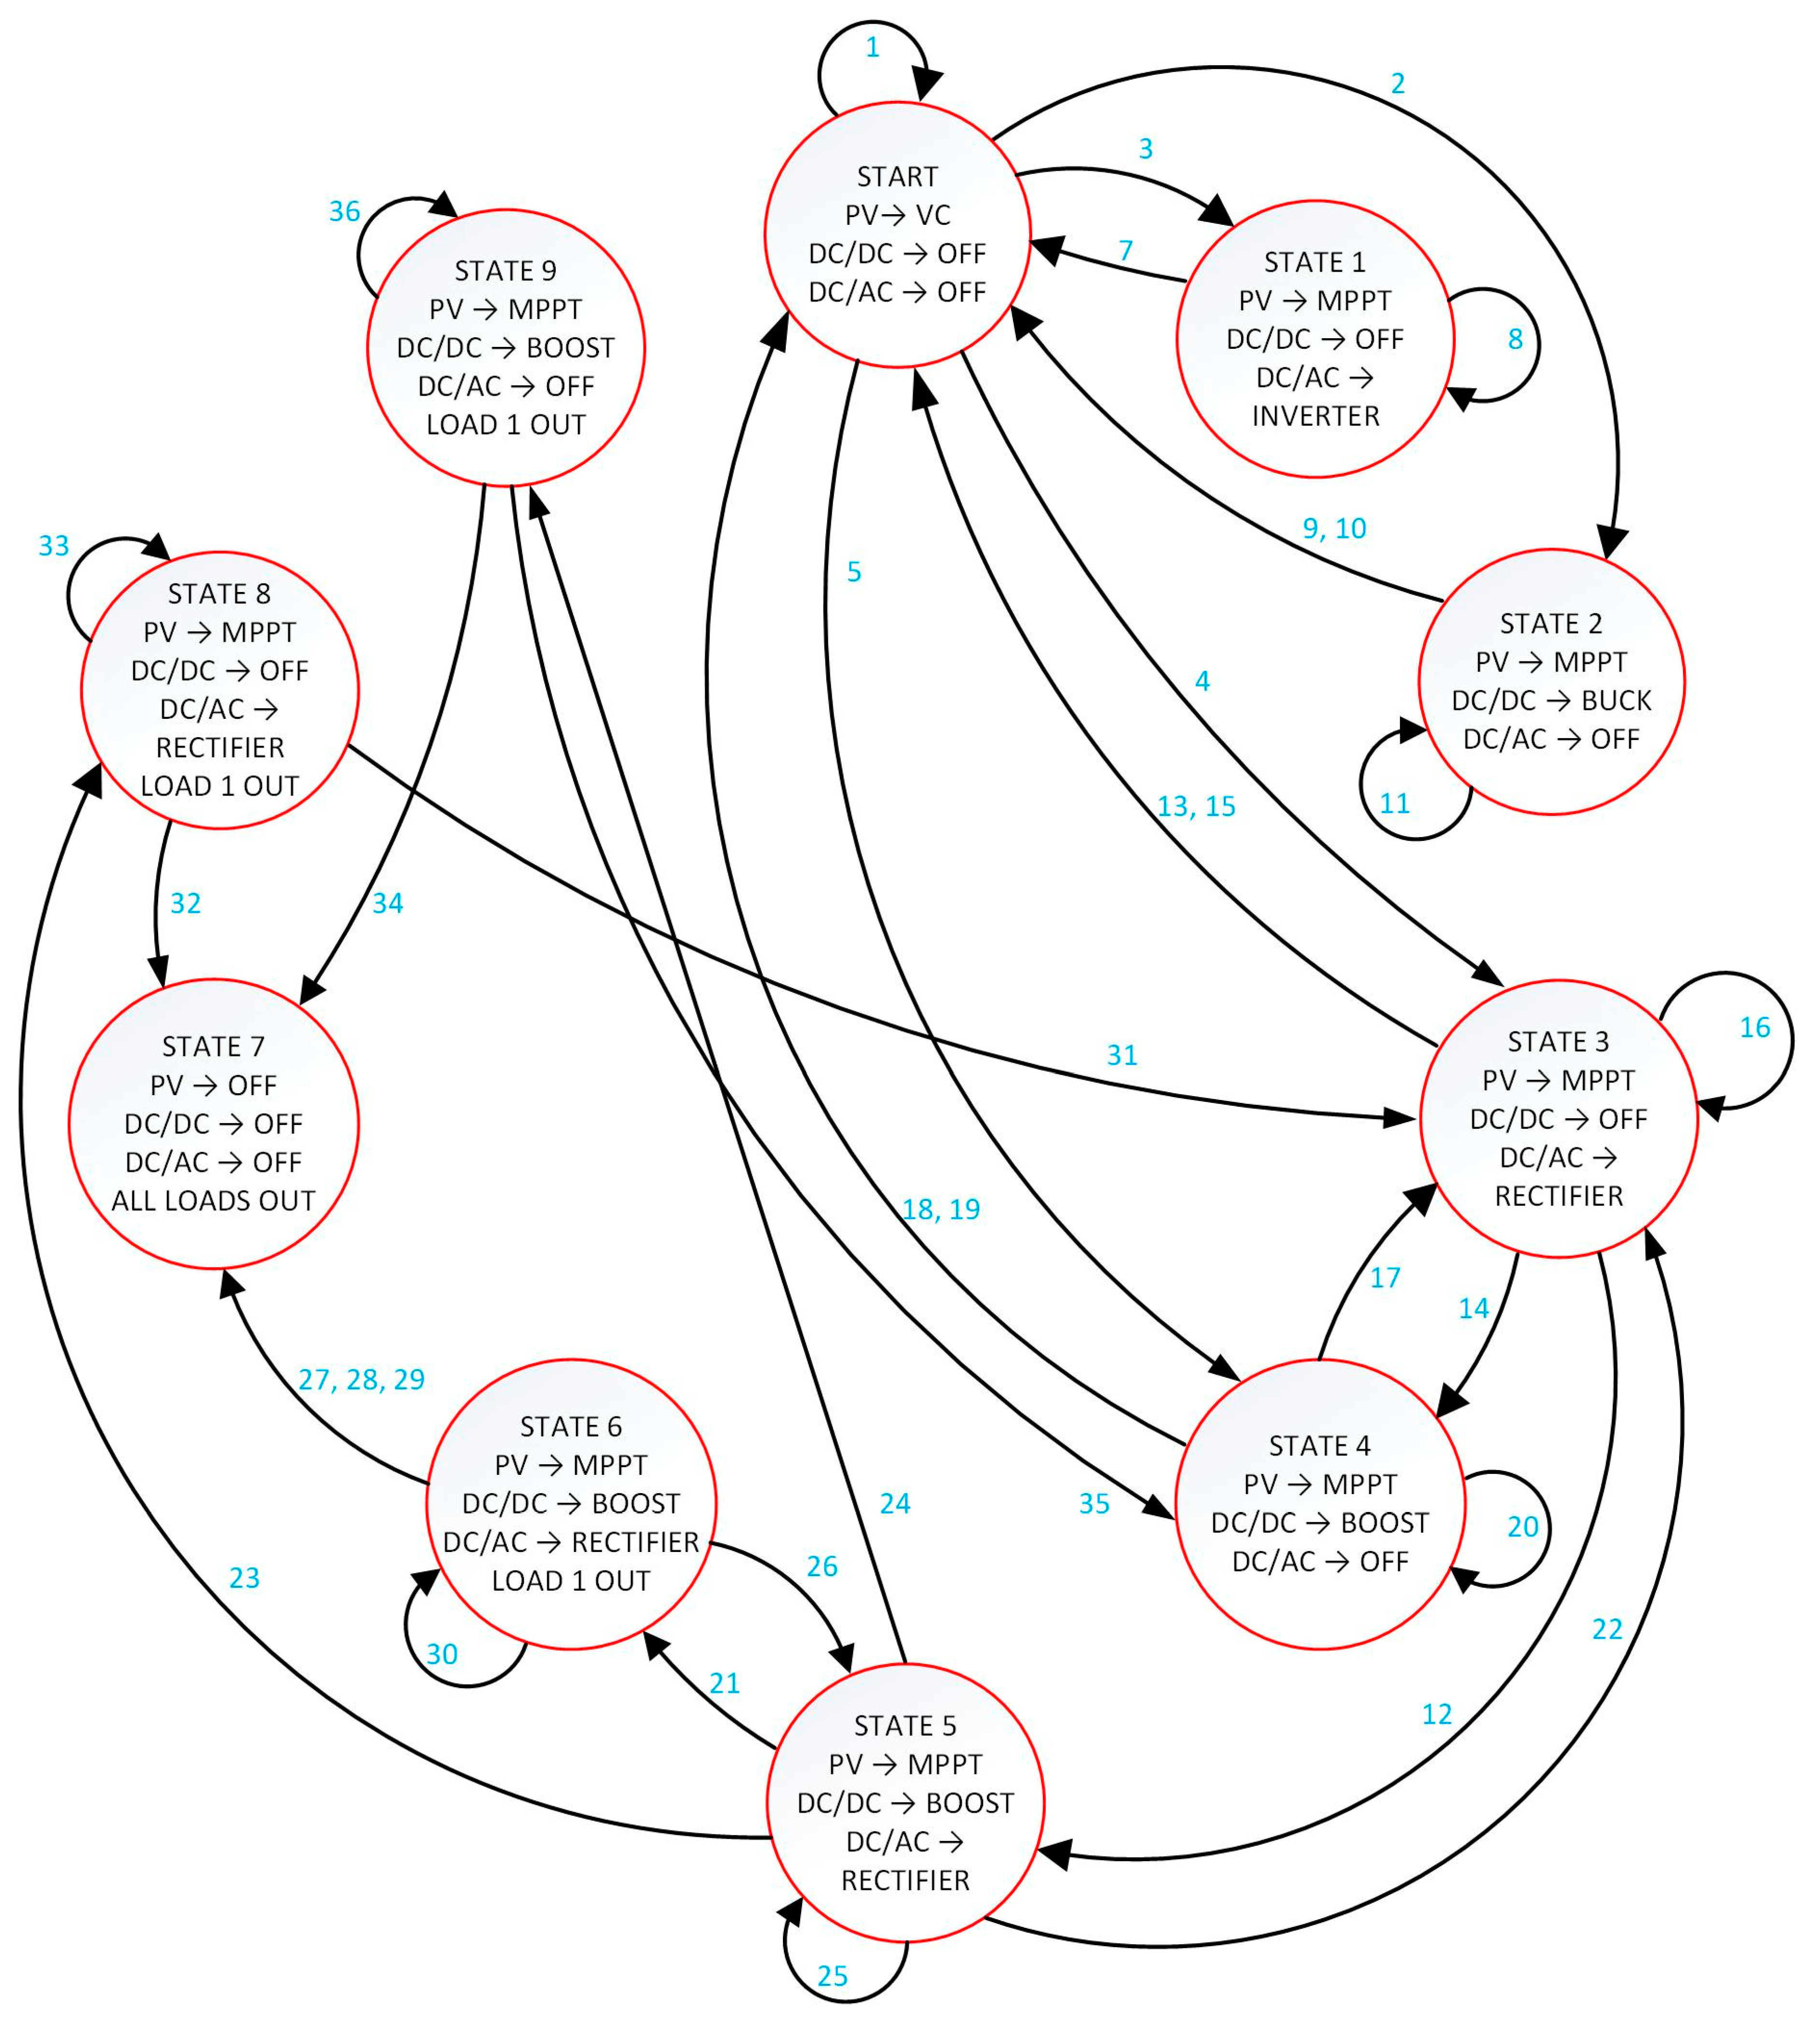
Figure 7 shows the state machine diagram used in the GMC and Table 3, Table 4, Table 5, Table 6 and Table 7 show the transitions defined between states. 
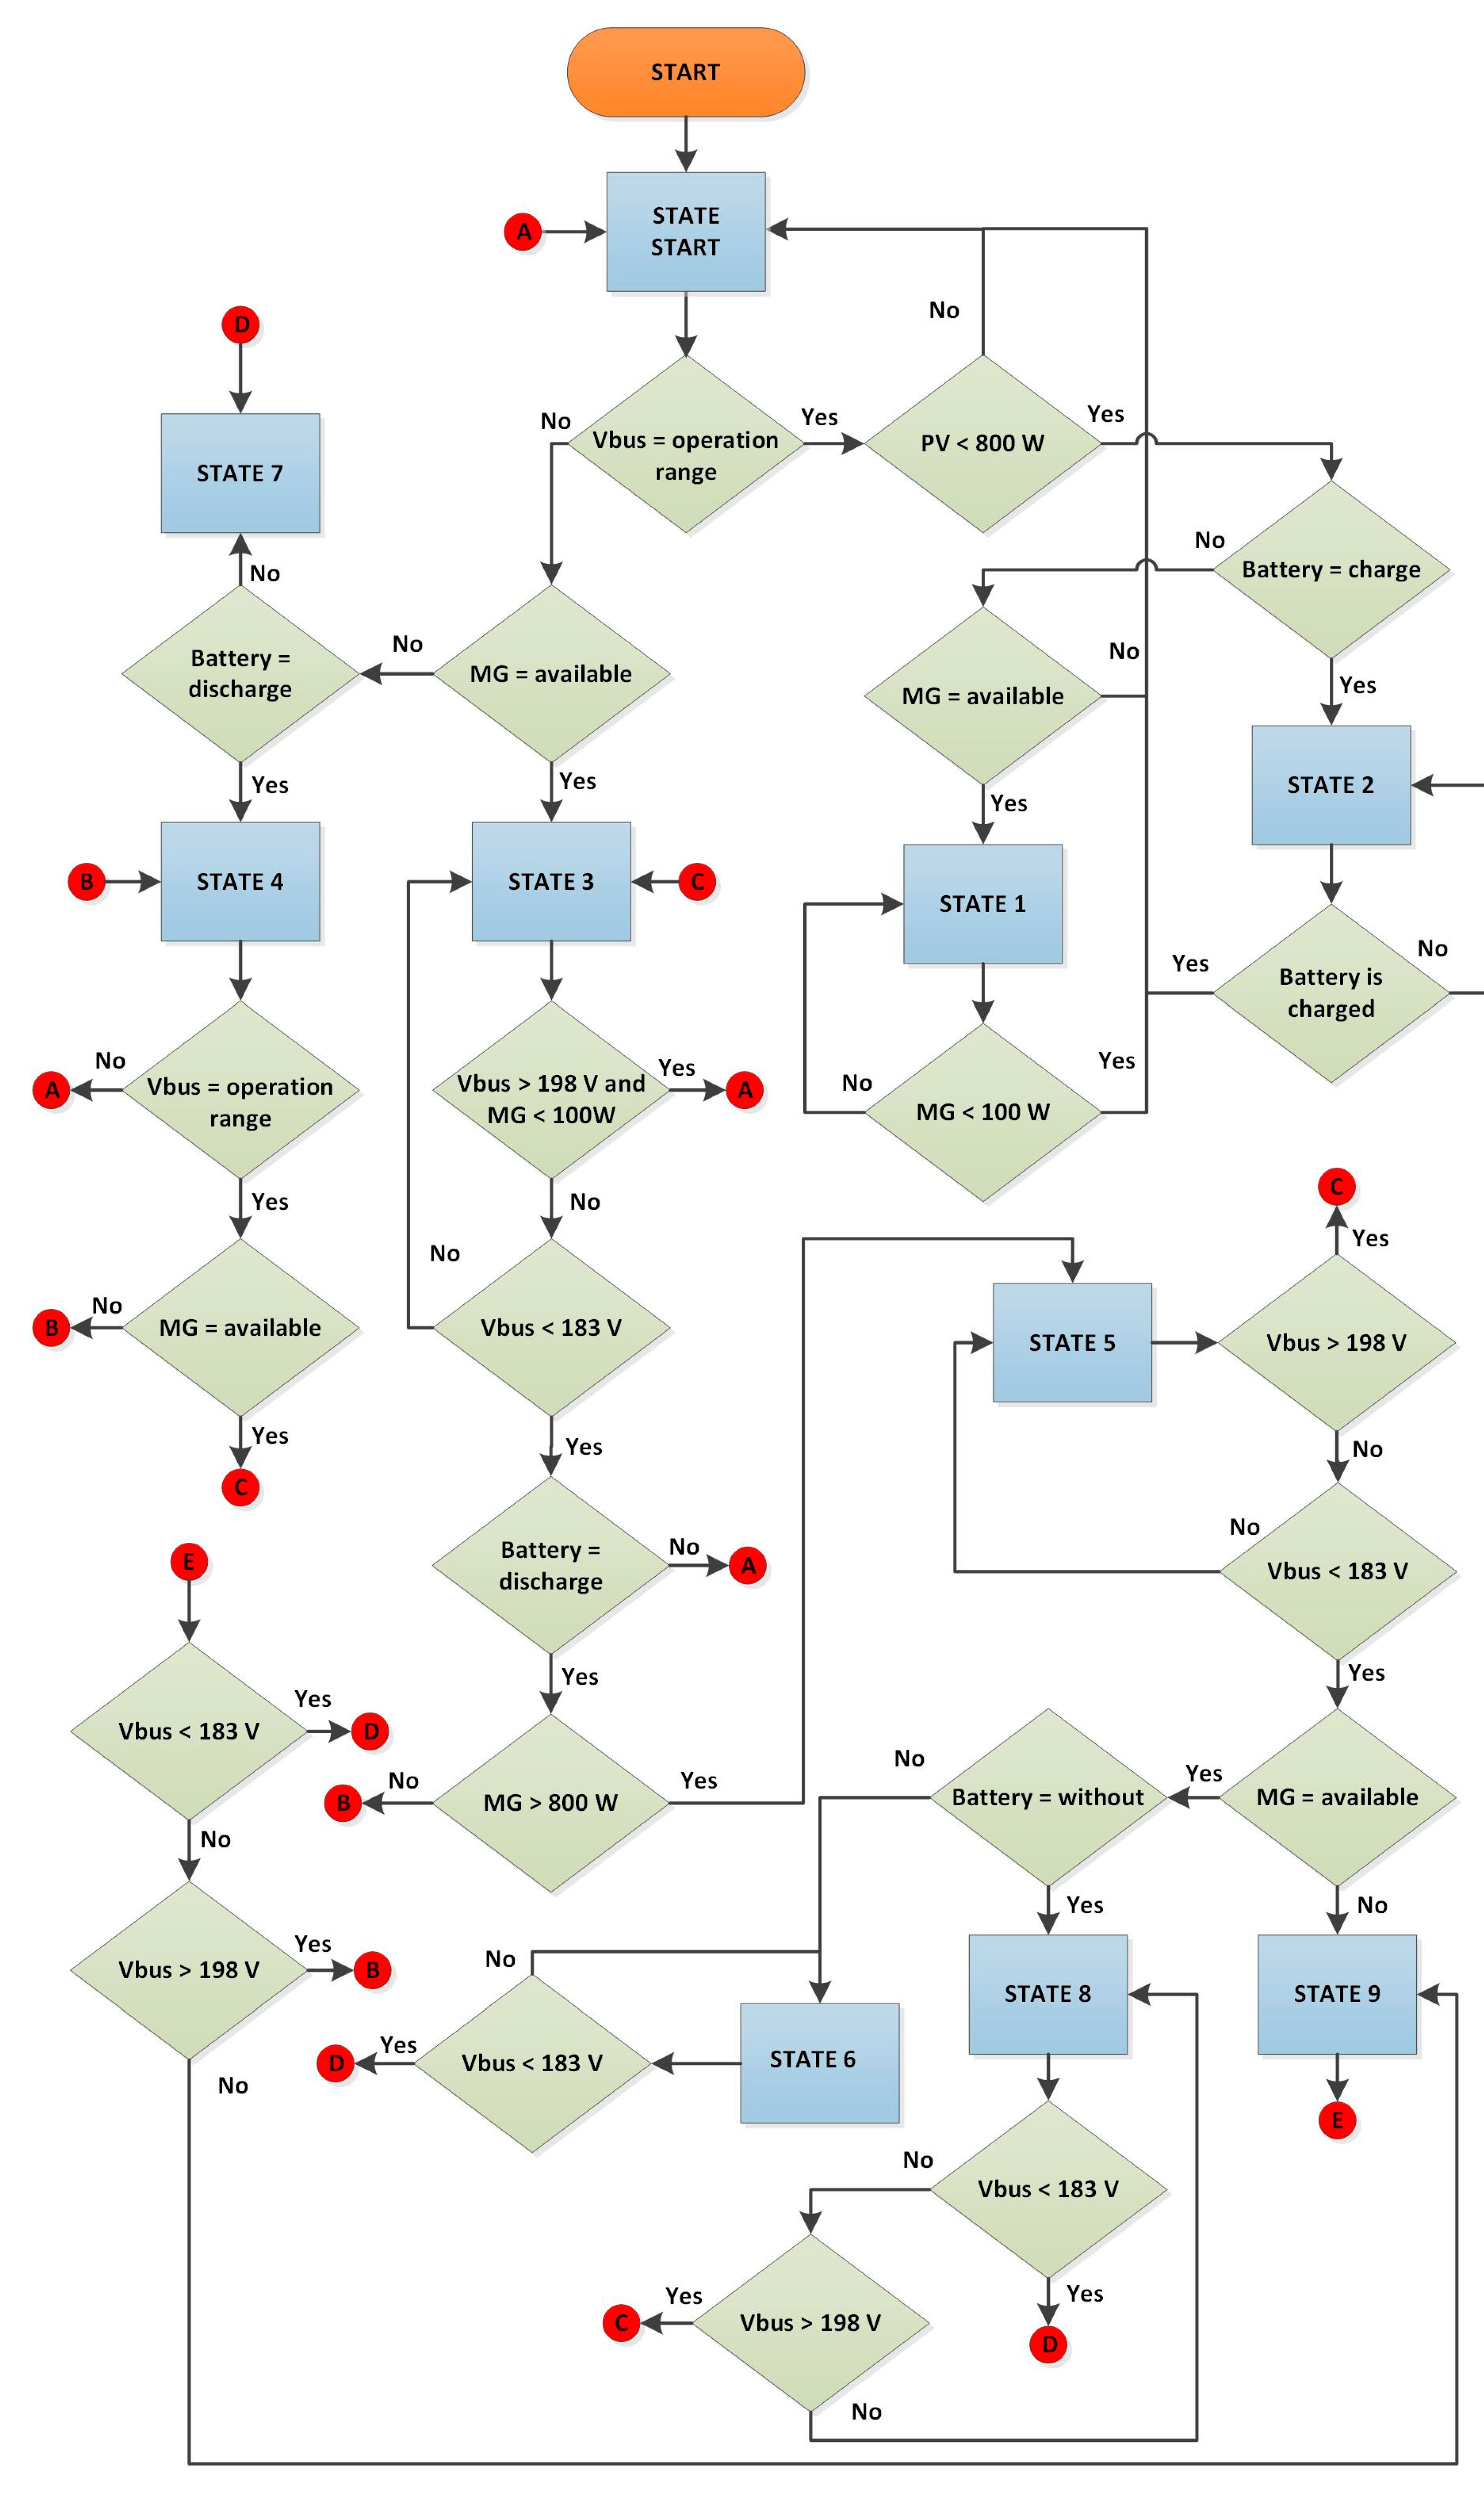
Figure 8 presents the flow diagram of the behavior of the GMC. This diagram illustrates the priorities of the GMC. These priorities are based on the six hierarchical scenarios described at the beginning of this section. The priority of the GMC algorithm is to keep the DC bus voltage level within the established range, to extract the maximum power from the PVEs, if the energy demanded by the loads is greater than that generated by the PVEs, the missing energy is taken from the MG, if the MG is not available the energy is drawn from the BB. In the event that the energy demanded by the loads is less than that generated by the PVEs, the excess energy will be transferred to the BB, if the BB is charged or in the process of discharge, this energy will be transferred to the MG.
The state machine diagram used in µG has ten states, which are listed to follow: START, STATE 1, STATE 2, STATE 3, STATE 4, STATE 5, STATE 6, STATE 7, STATE 8 and STATE 9. For the overall states, there are defined three main systems: the PVE (PV), the BB DC–DC converter (DC–DC) and the bidirectional converter connected to the MG (DC–AC). For instance, if the GMC is in the START mode, the PV works in voltage control mode (VC), the DC–DC is turned off (OFF) and the DC–AC is also turned off (OFF). Another example is STATE 6, the PV works in the MPPT, the DC–DC as BOOST and the DC–AC as RECTIFIER.
Table 3, Table 4, Table 5, Table 6 and Table 7 show the states transition tables; these have a section of entries that define the conditions for changing from the current state to the next. These inputs are the following signals that were monitored in the µG: the bus voltage level (Vbus), the power generated by the PVE (PV Power), the condition of the MG (MG) and the condition of the BB (Battery). Tables have an output section that defines the operation mode of the PECs and the condition of the local loads connected to the DC bus, these operation modes are the same as those defined in the state machine of Figure 7. For example, when the current state is START, if condition 1 is met, the next state will be START. In this condition Vbus must be greater than 185 V and less than 195 V, the PV Power must be greater than 800 W, here the MG and Battery status are not considered. In condition 12, Vbus must be less than 183 V, the PV Power must be greater than 800 W, just like the power extracted from the MG (MG), in addition Battery must be in the discharge process.

3.2. Local Controllers

The GMC defines the operation mode of each of the local controllers. While these are responsible for generating the control signals that are used in each of the PECs that make up the µG. The following describes the embedded control systems designed to keep the system stable.
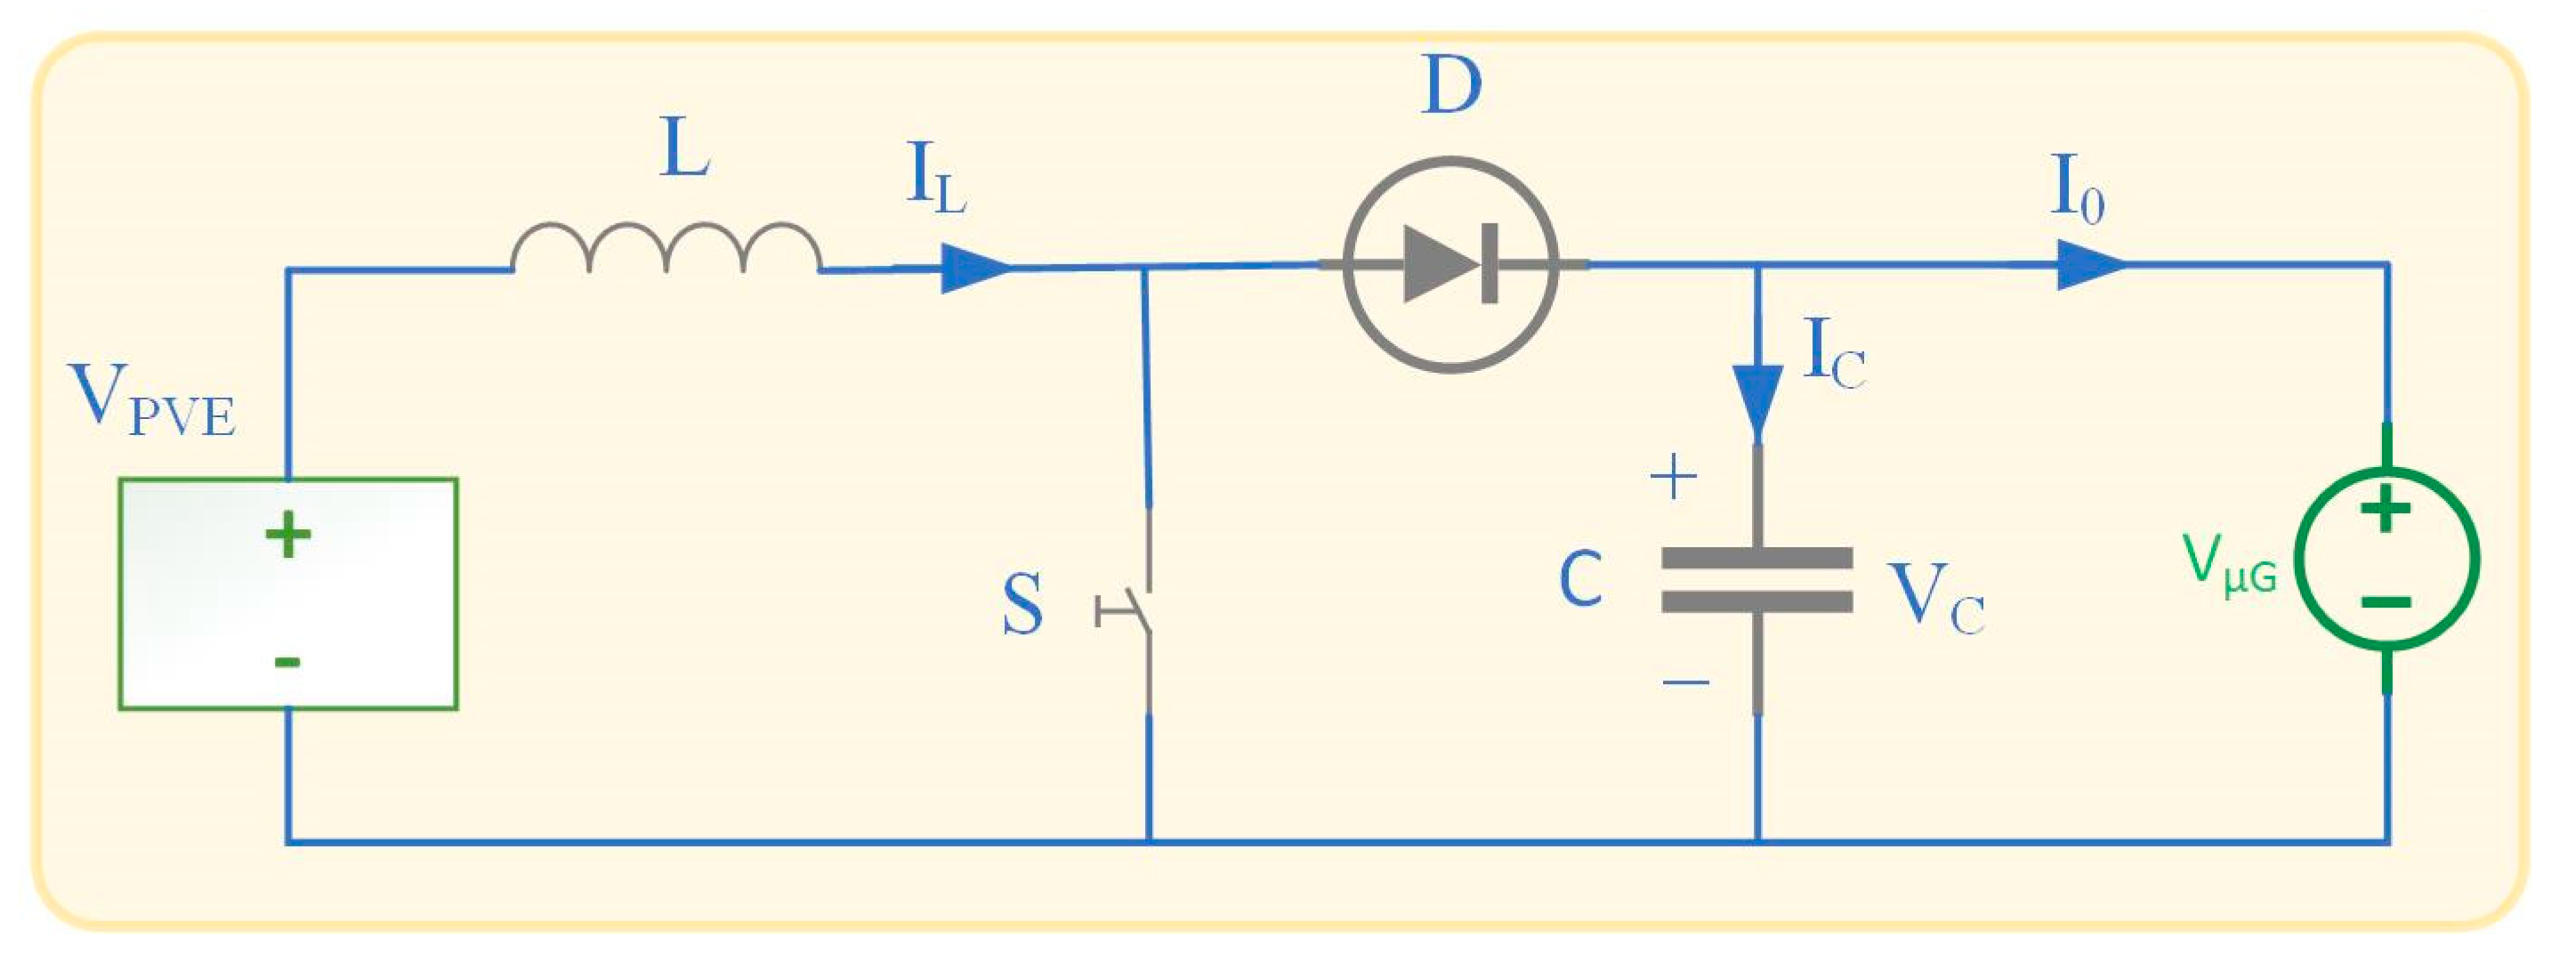
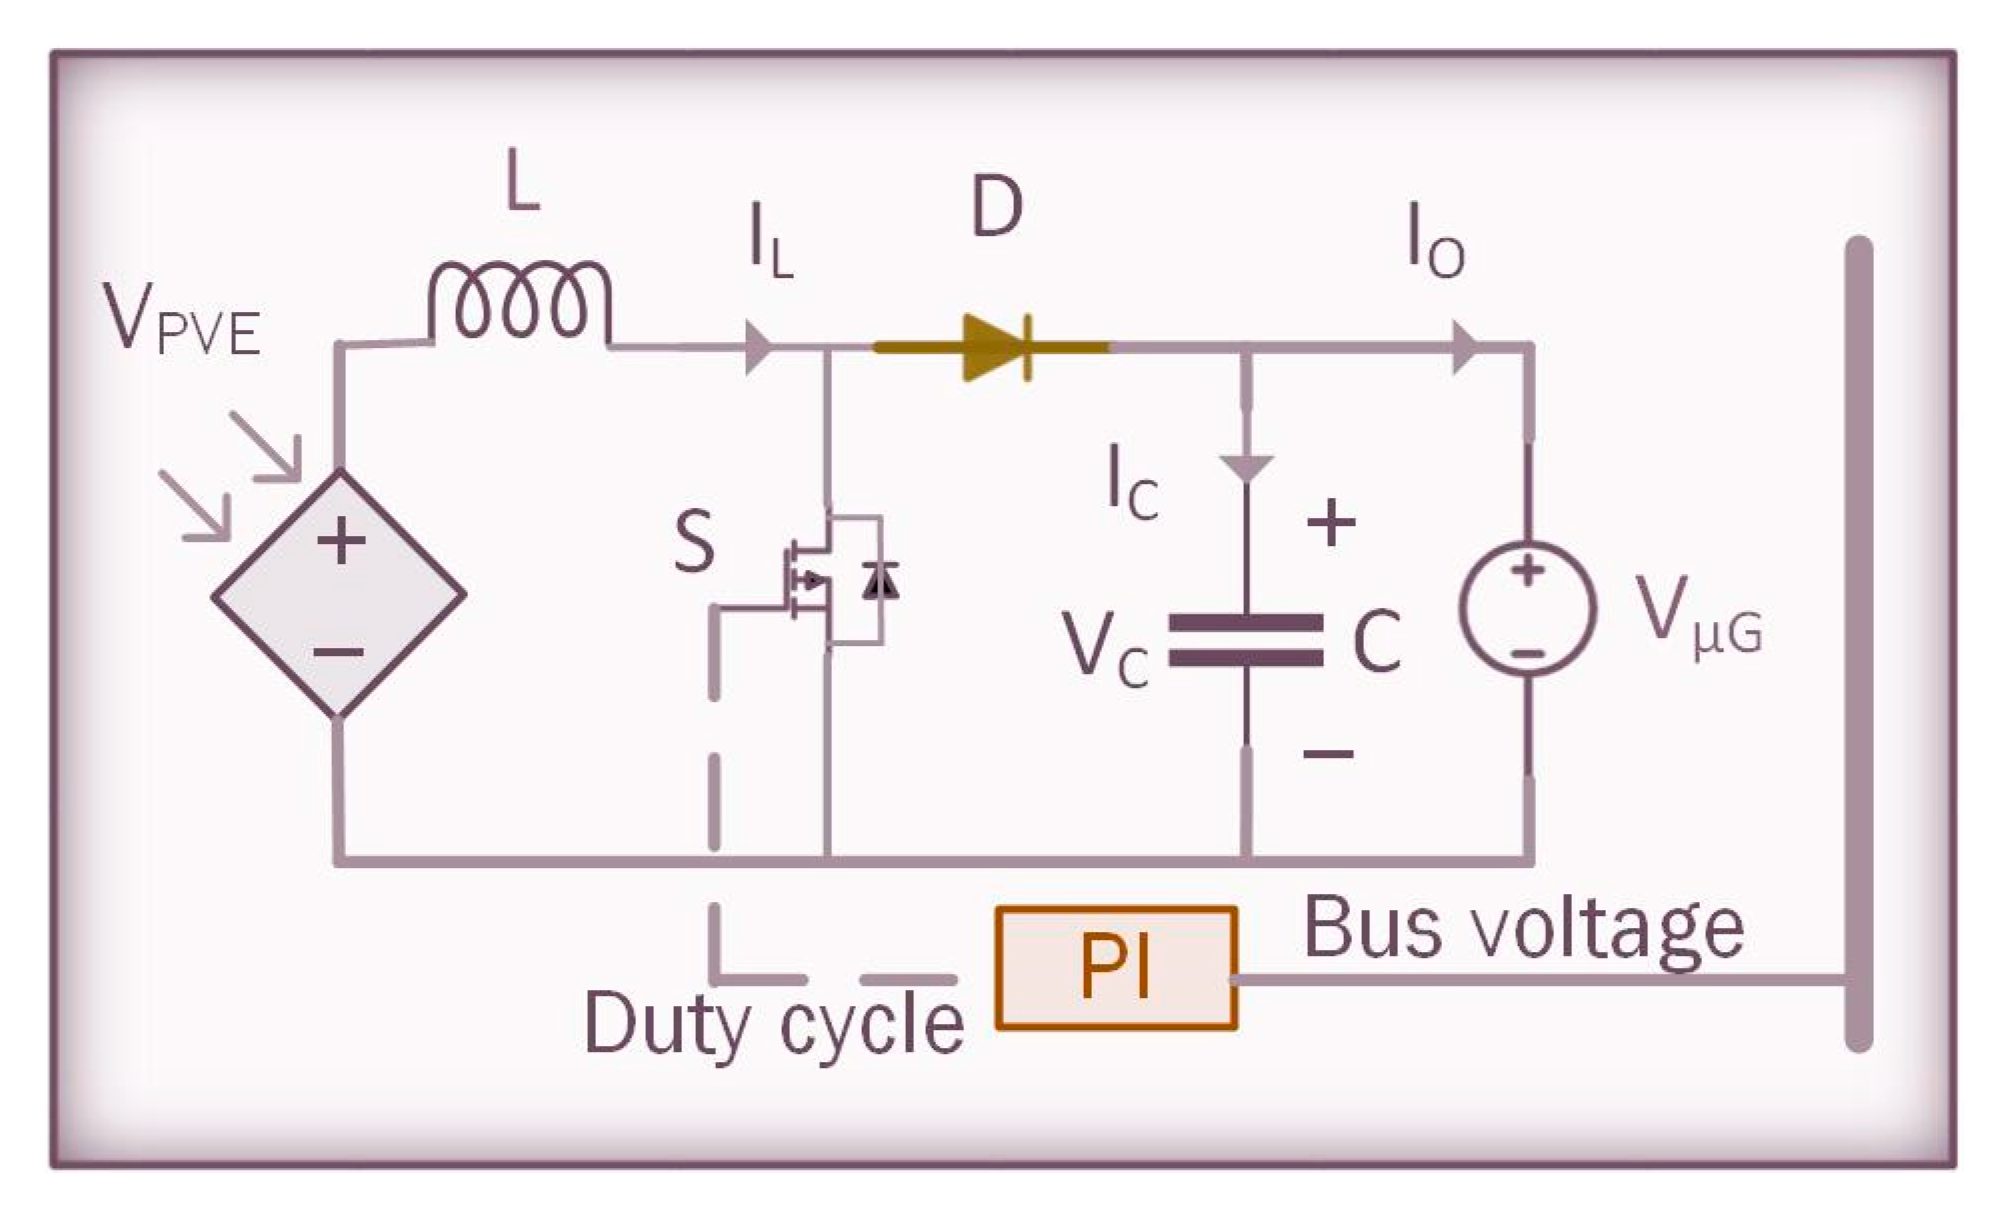
The DC–DC boost converters connected to the PVEs have two operation modes: (1) the VC mode, and (2) the MPPT mode. In VC mode, a classic PI controller is responsible for maintaining the output voltage of the DC–DC converter (DC bus voltage) at a level of 190 V. This control mode only works when the BB and MG do not supply or extract power to the DC bus. Figure 9 illustrates the converter diagram with the PI controller; this controller monitors the converter output voltage level (VμG) by performing corrective actions to eliminate the effects generated by system disturbances (connection and disconnection of loads to the bus of DC).
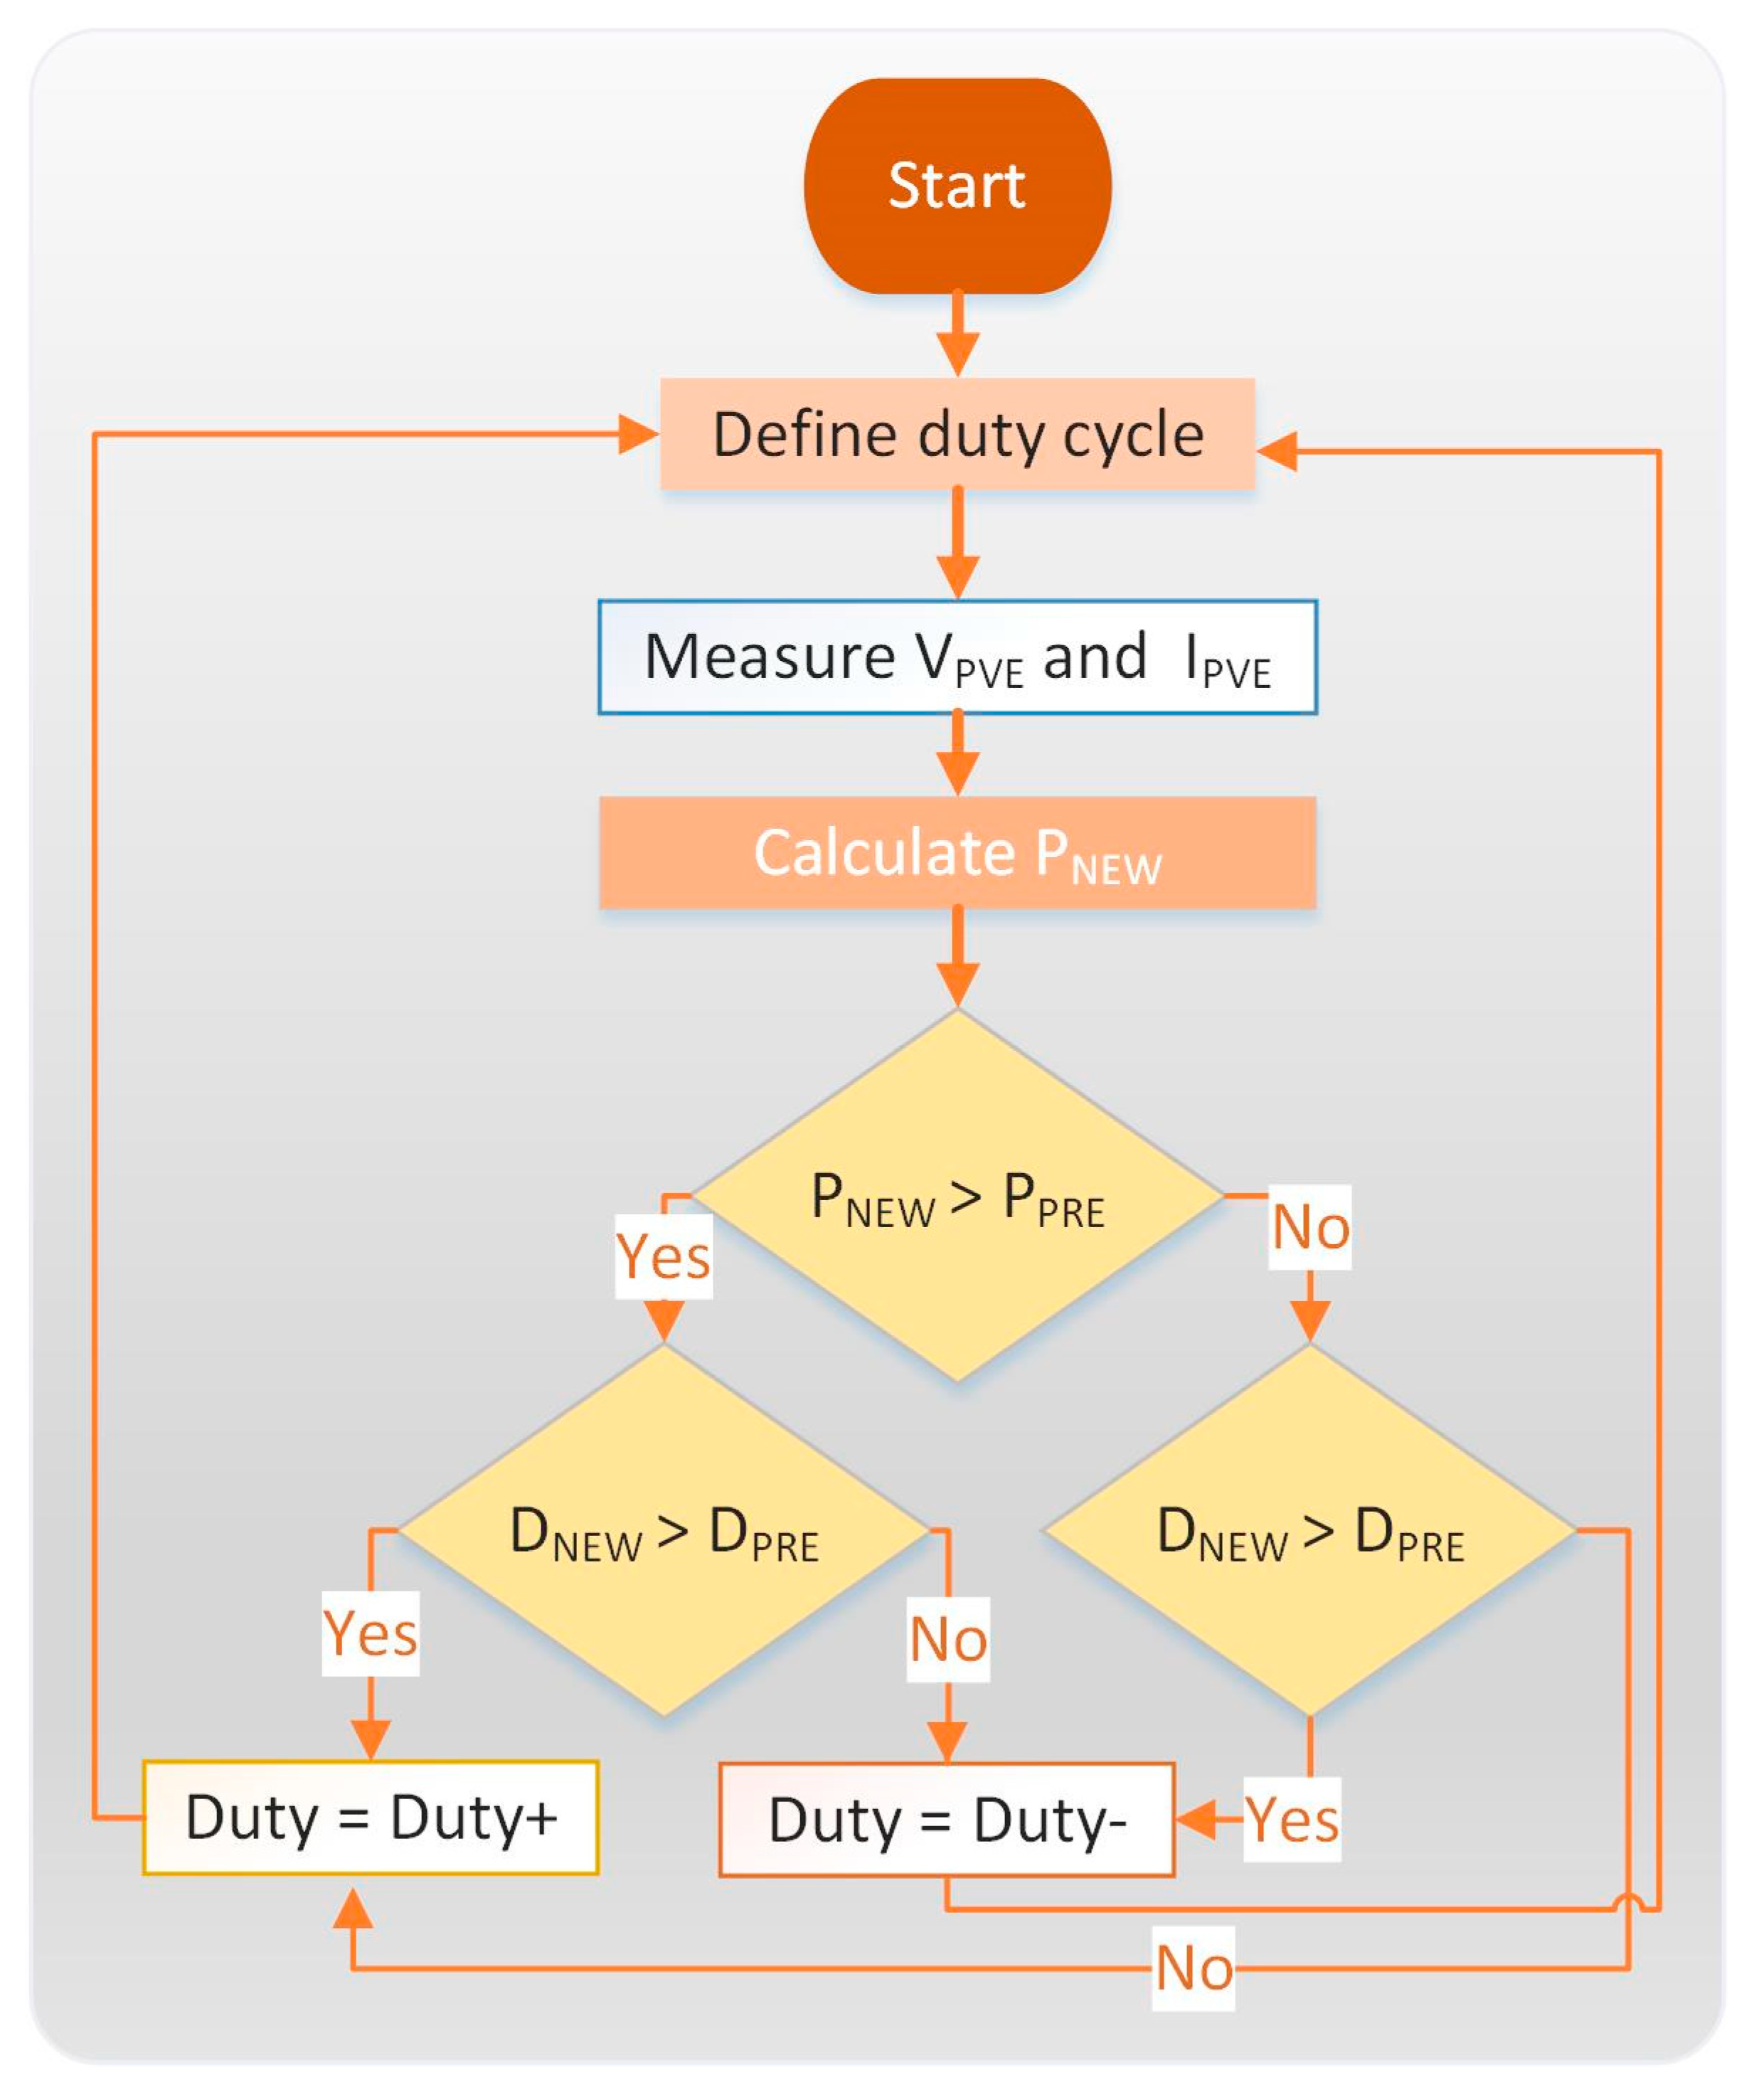
The operating point on the characteristics of the PVE module primarily depends on the impedance matching of the PVE module regarding the connected load. A DC–DC converter between the PVE module and the DC bus acts as an interface to operate at MPP by changing the duty cycle of the converter generated by the MPPT controller. In the MPPT operation mode, the boost converters extract the maximum power of the PVEs using the perturb and observe (P&O) control algorithm illustrated in Figure 10. The conventional P&O MPPT algorithm is developed based on the slope (dP/dV) variation on the P–V characteristics of the PVE module [29]. In this algorithm, an initial value of the duty cycle is first defined, then the voltage and current of the PVE (VPVE and IPVE) are measured to calculate its supplied power, once the value of the current power (PNEW) is known, it is compared with the power obtained in the past iteration (PPRE), the current value of the duty cycle (DNEW) is also compared and is compared with the previous value of the same (DPRE), based on these comparisons an increase is defined (Duty +) or a decrease (Duty-) in the duty cycle; with this new value of the duty cycle the process is repeated, always seeking to increase the value of the power supplied by the PVE. 
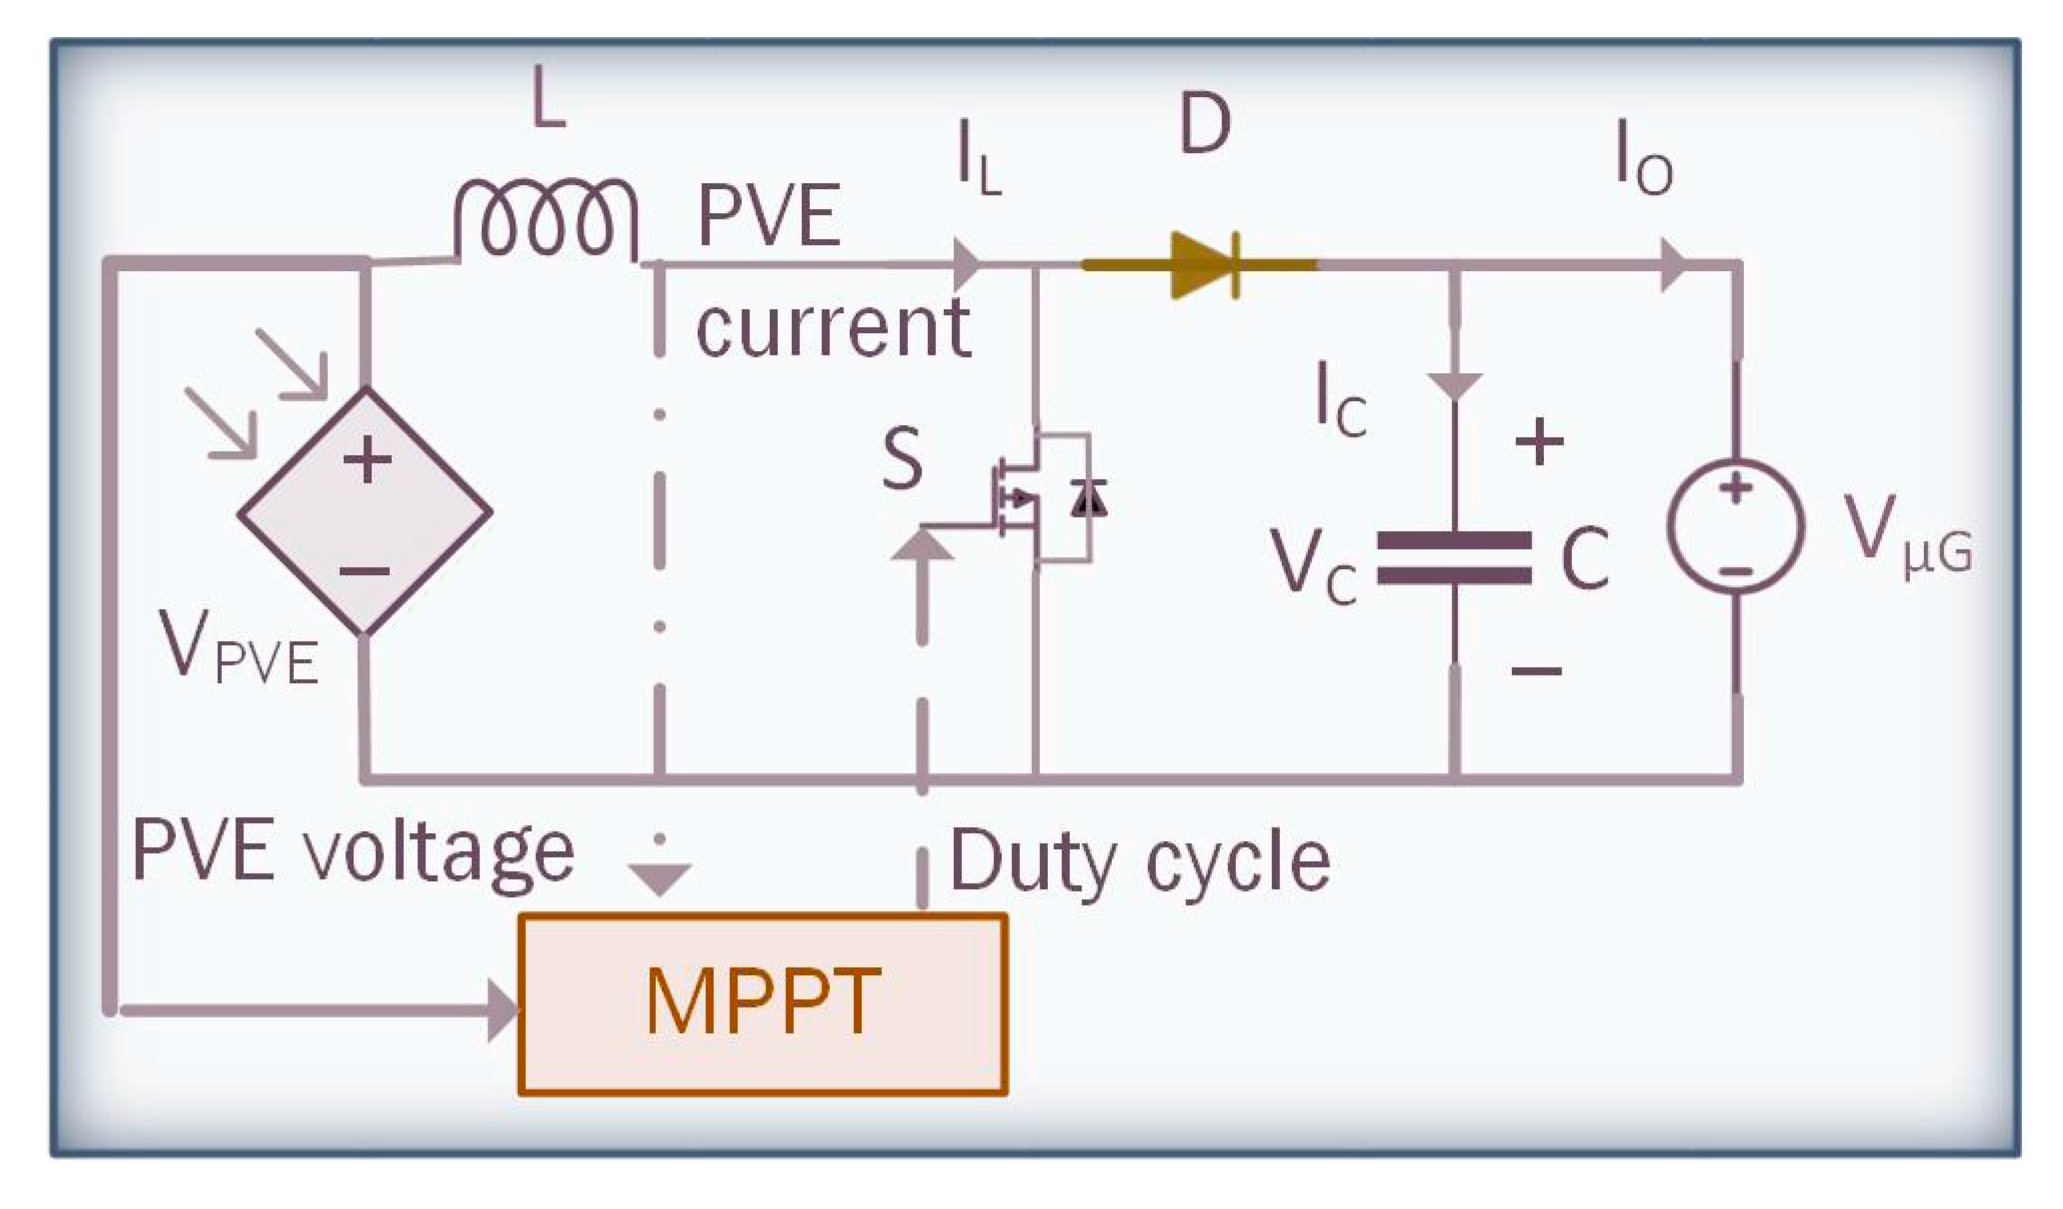
Figure 11 shows the diagram of the converter with the MPPT controller. The controller modifies the duty cycle of the power switch and monitors the changes in the voltage and current of the PVEs, always looking for an increase in the power extracted from the PVEs.
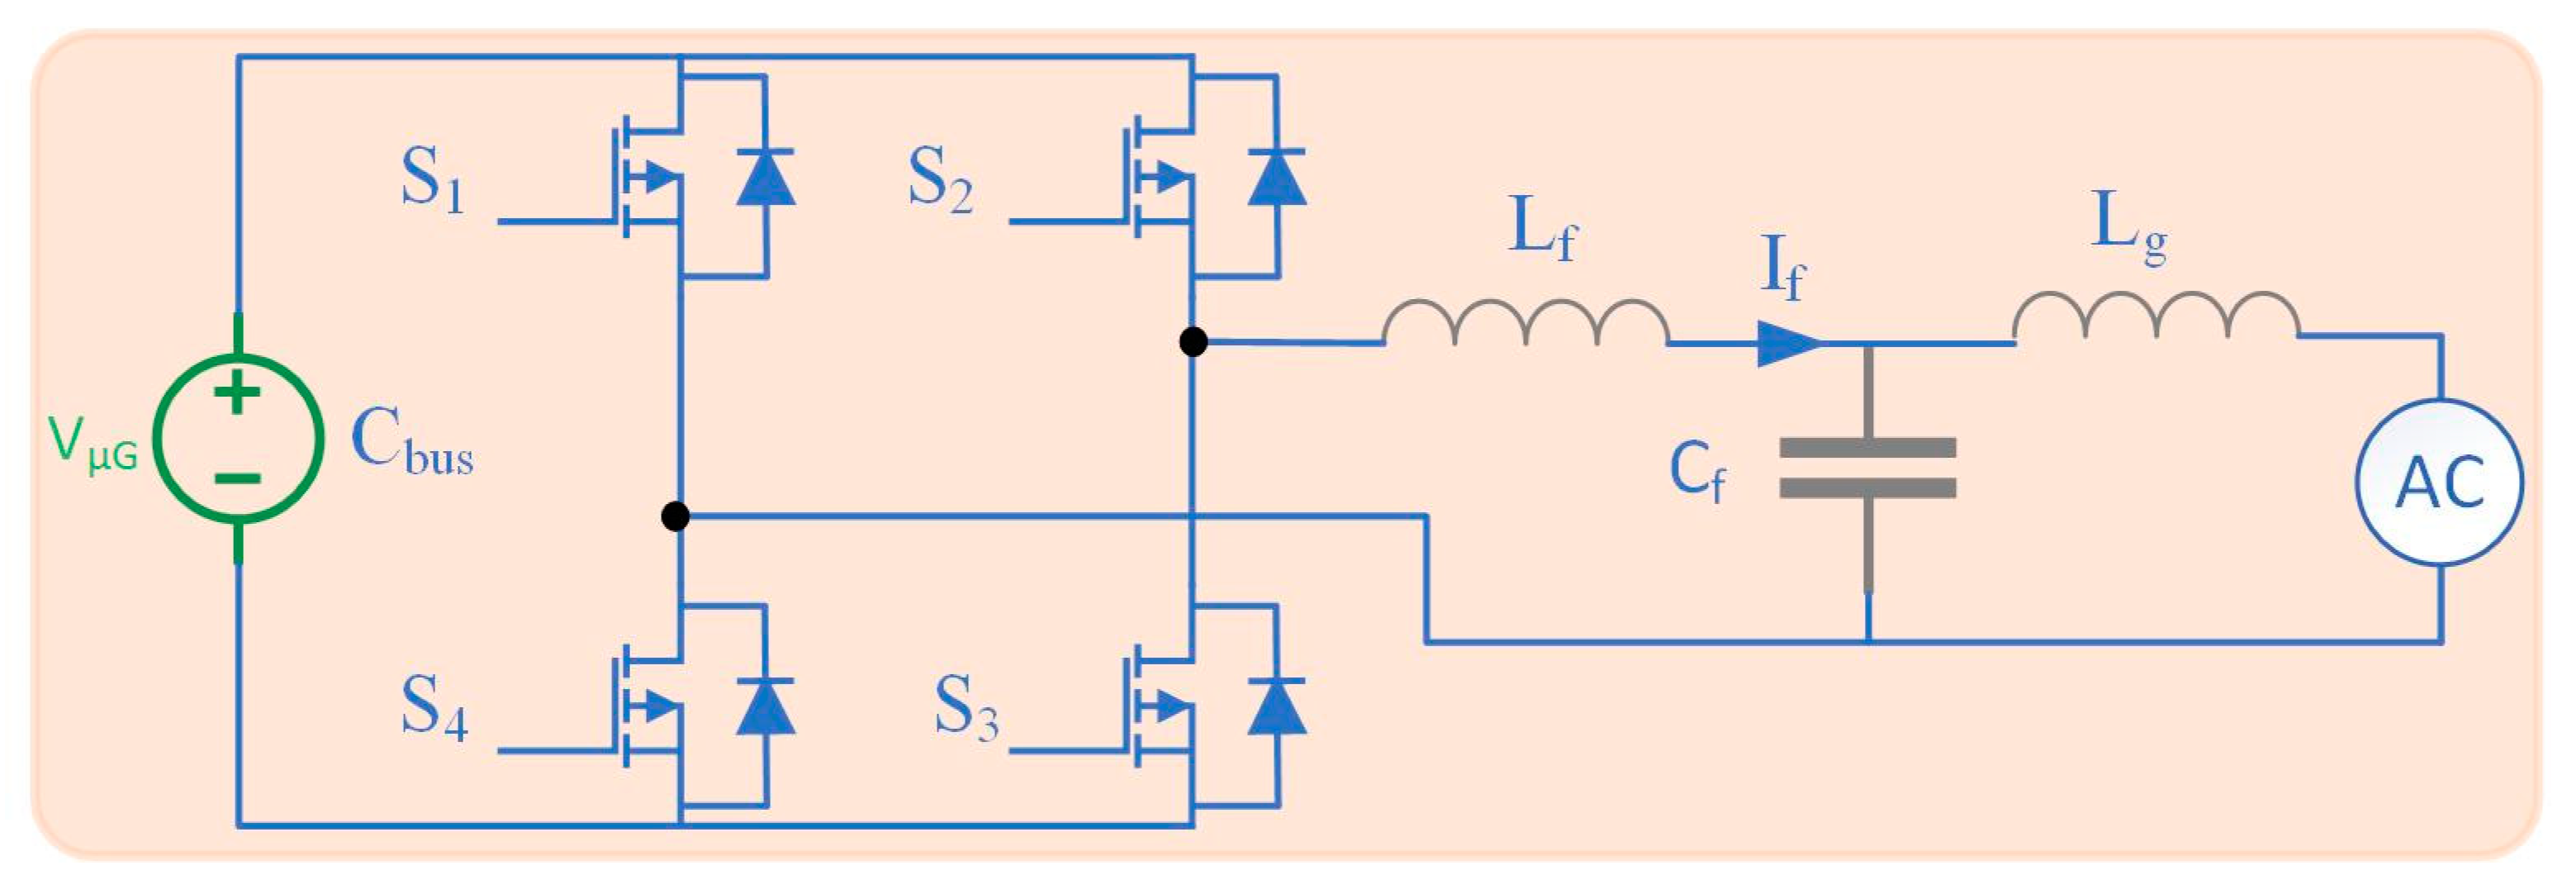
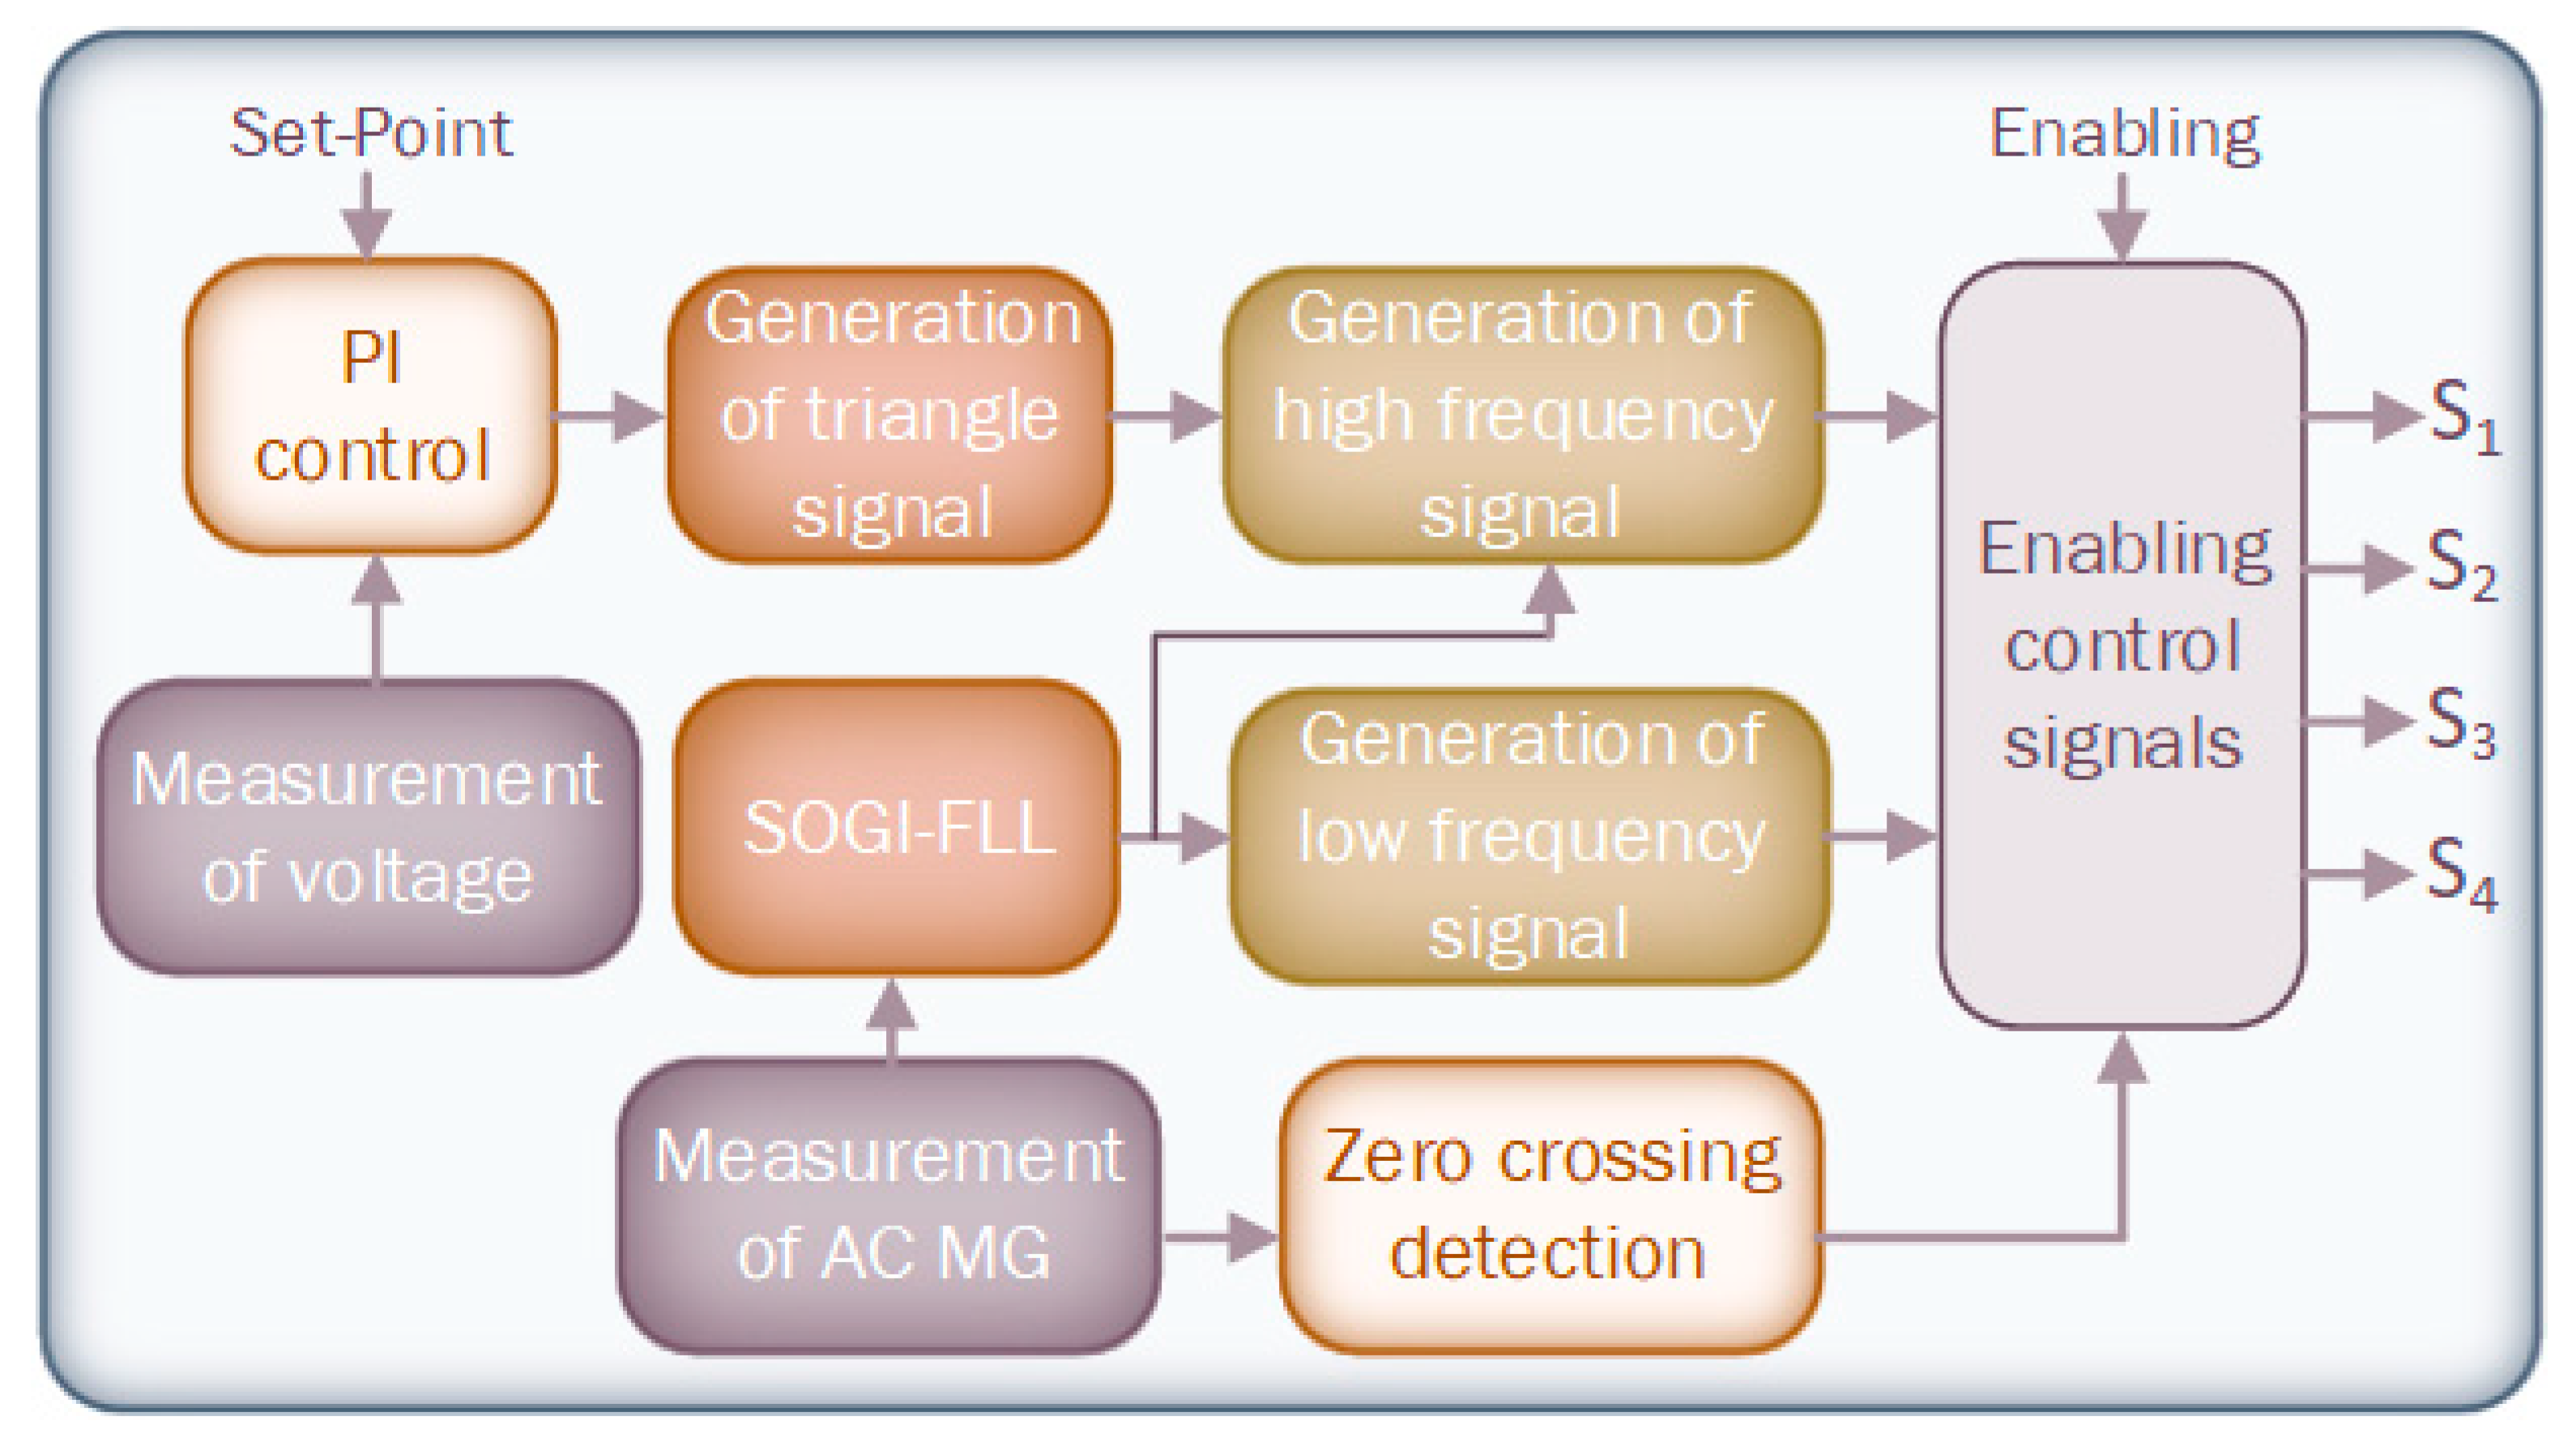
The bidirectional DC–AC converter used to interconnect the DC-µG with the MG can operate as a rectifier (transferring energy from the MG to the loads connected to the DC bus) or as an inverter (transferring energy from the DC bus to the MG). The block diagram of the control system implemented for the converter when operating as an inverter is presented in Figure 12. This controller has a PI control action in charge of defining the amplitude of the high frequency triangular signal based on the voltage level of the DC bus, thereby modifying the amount of energy that is transferred to the MG. If the DC bus suffers a voltage drop, a reduction in the amplitude of the triangular signal is generated causing a decrease in the energy transferred to the MG and thus causing an increase in the bus voltage level. In case the bus suffers a voltage overcharge, the amplitude of the triangular signal is increased generating a surge in the energy that is transferred to the MG, thereby lessening the voltage level of the DC bus.
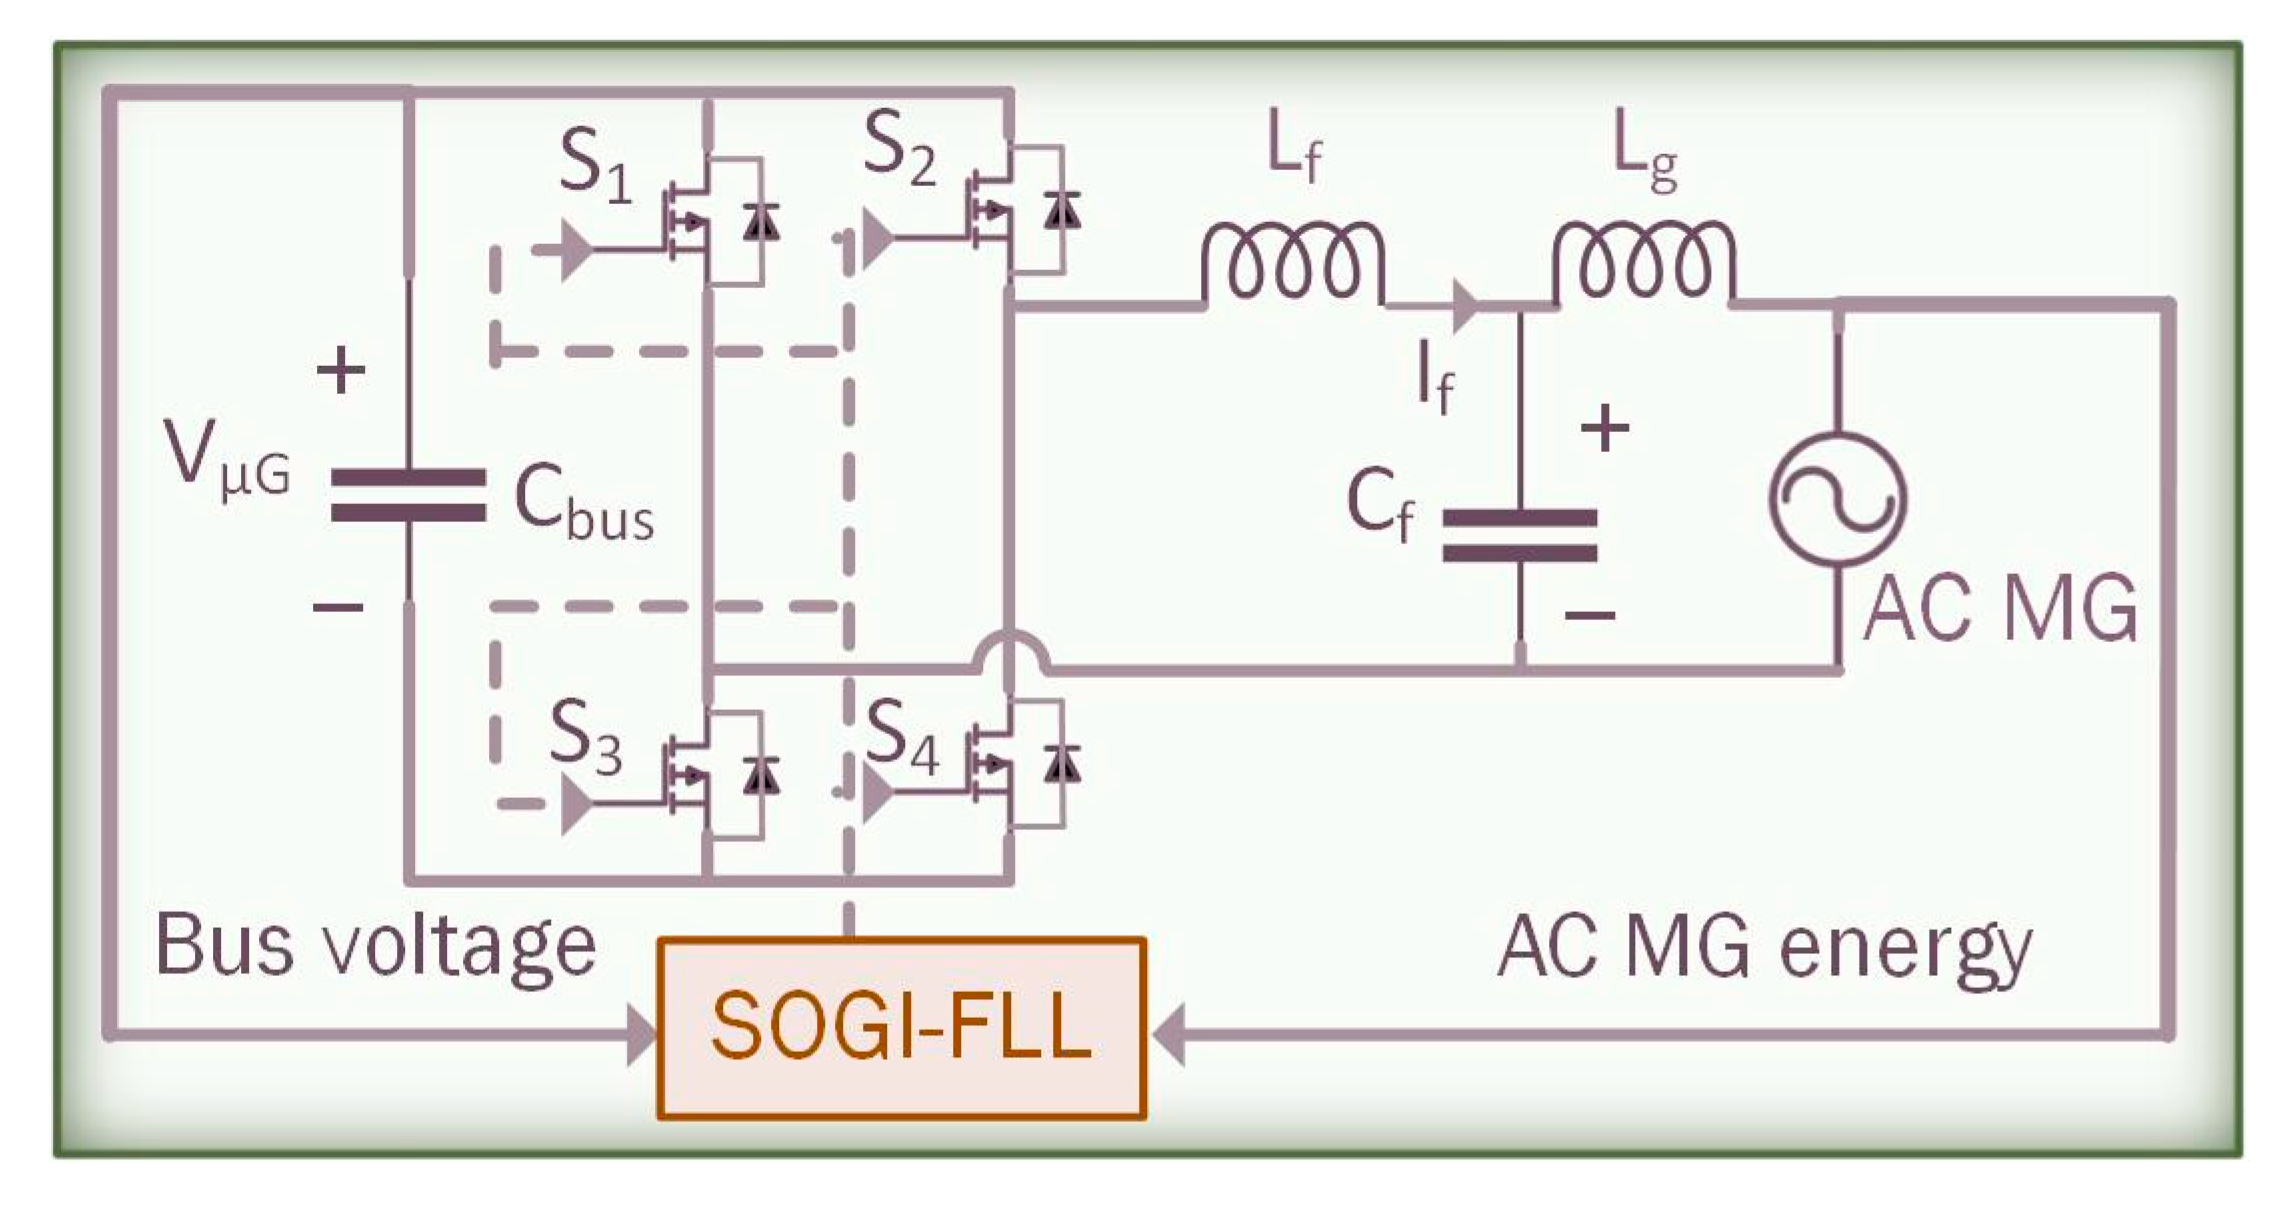
The converter diagram with the controller is shown in Figure 13. The synchronization between the signal generated by the inverter and the MG is performed by the zero crossing detection modules and the second-order generalized integrators with frequency-locked loop (SOGI-FLL) algorithm, this when determined by the GMC. The control signals of the four switches of the complete bridge inverter are generated by comparing the output signal of the SOGI-FLL block with the triangular signal of 25 kHz frequency.
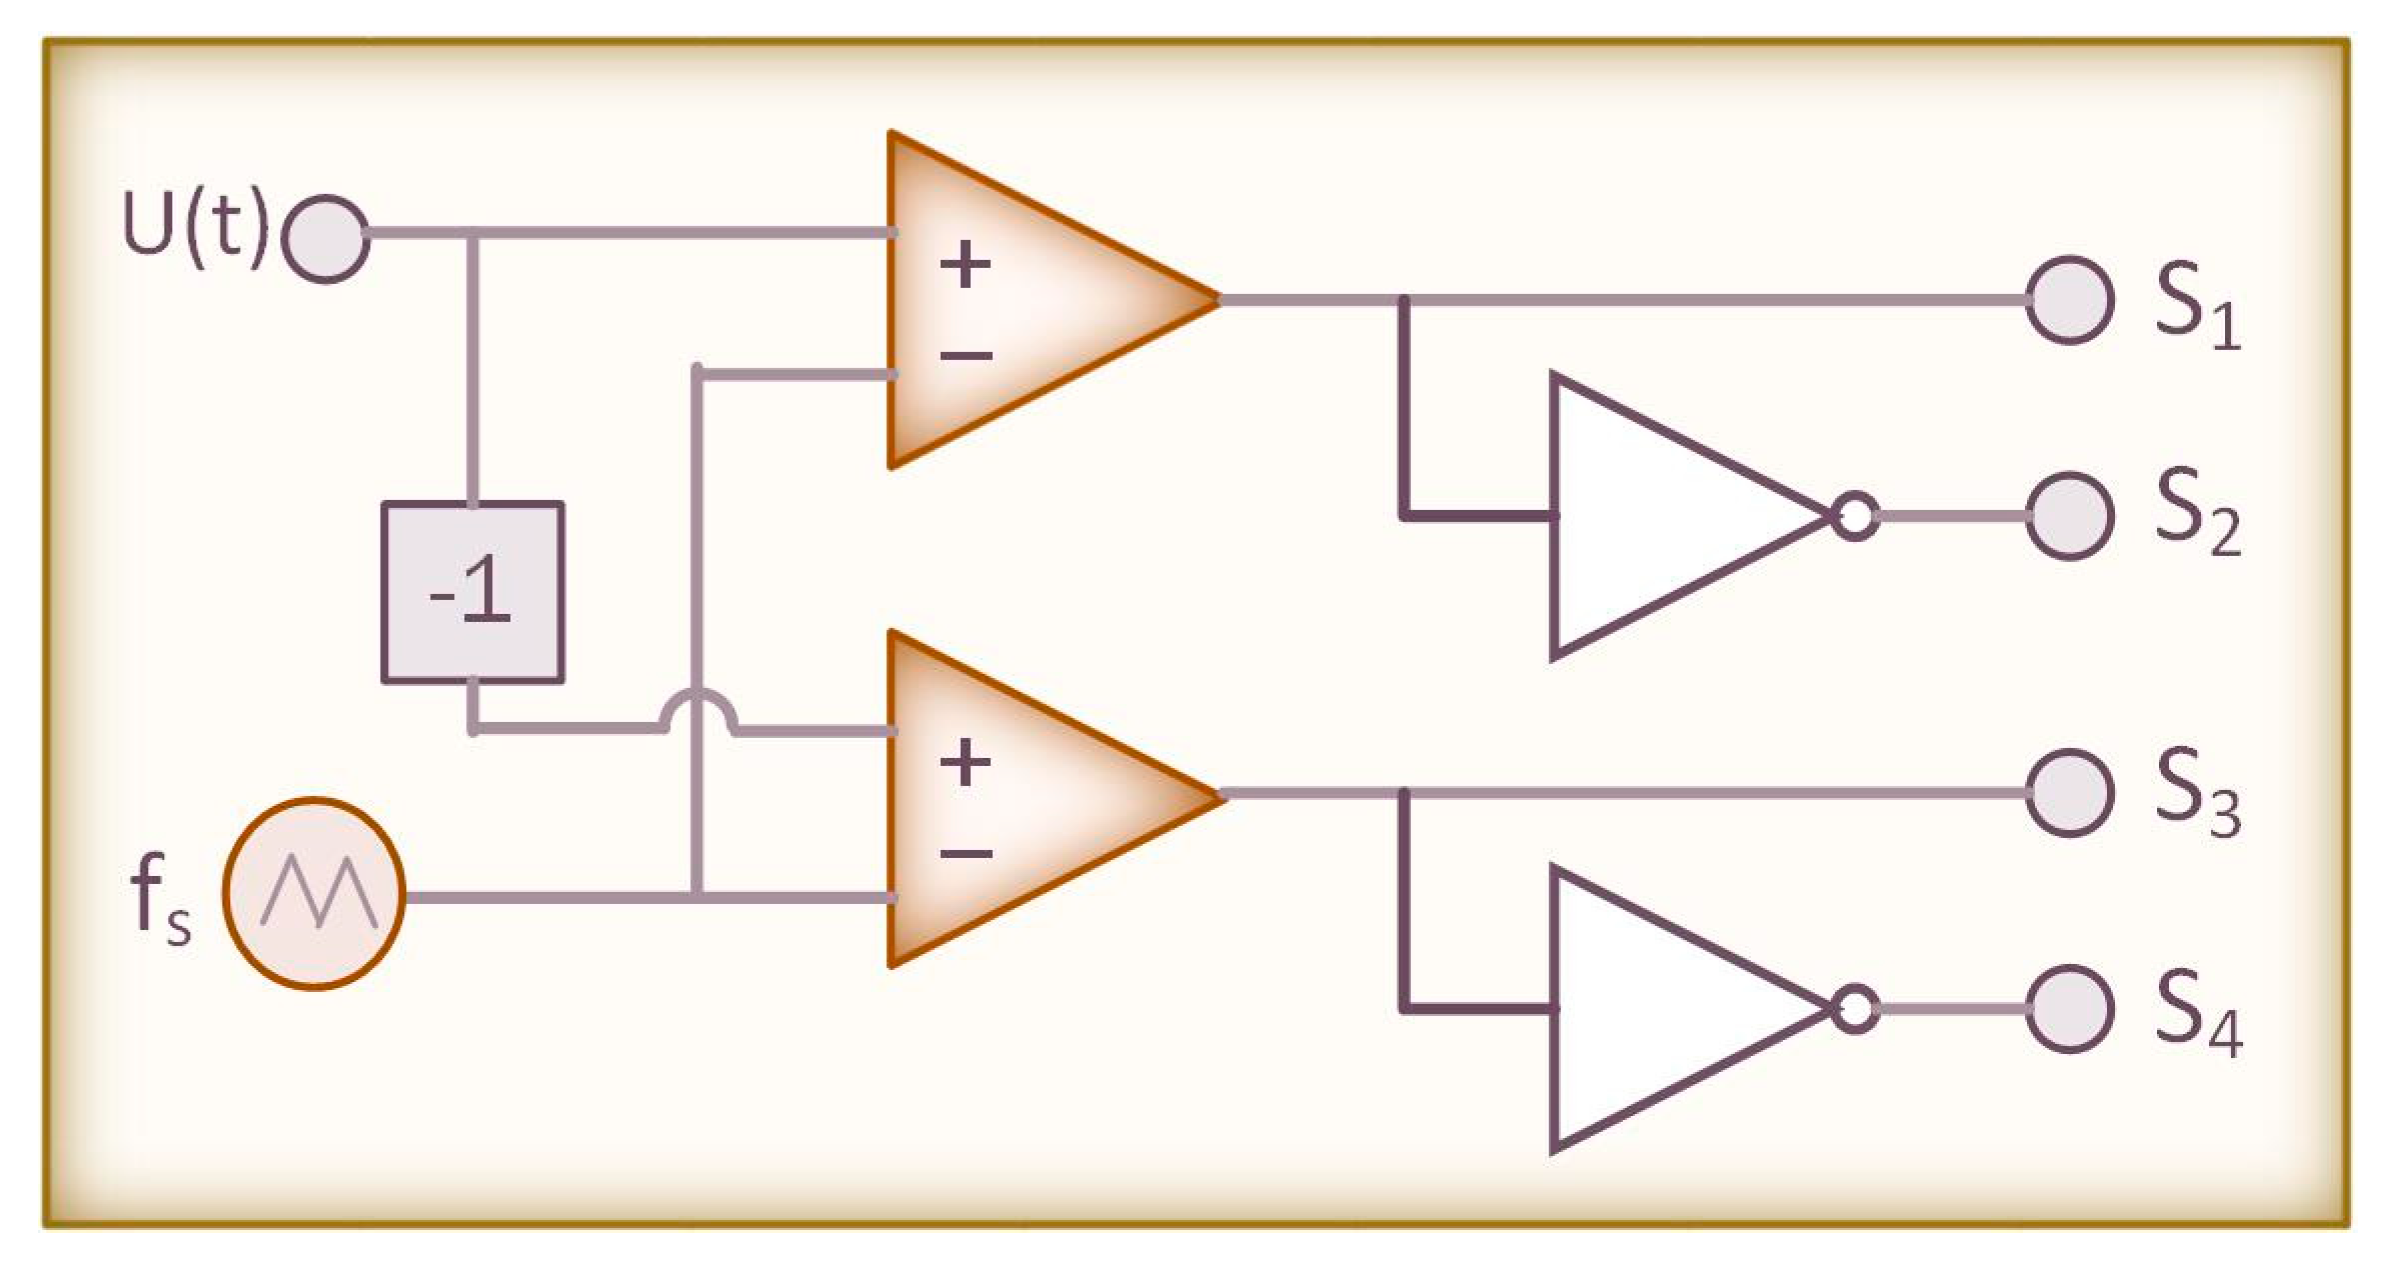
When the DC–AC bidirectional converter works as a rectifier, the control system is carried out with a classic PI controller, which is responsible for stabilizing the bus voltage level at 190 V by increasing or decreasing the amplitude of the high frequency triangular signal fs which is compared with the low frequency sine wave signal u(t) as illustrated in Figure 14.
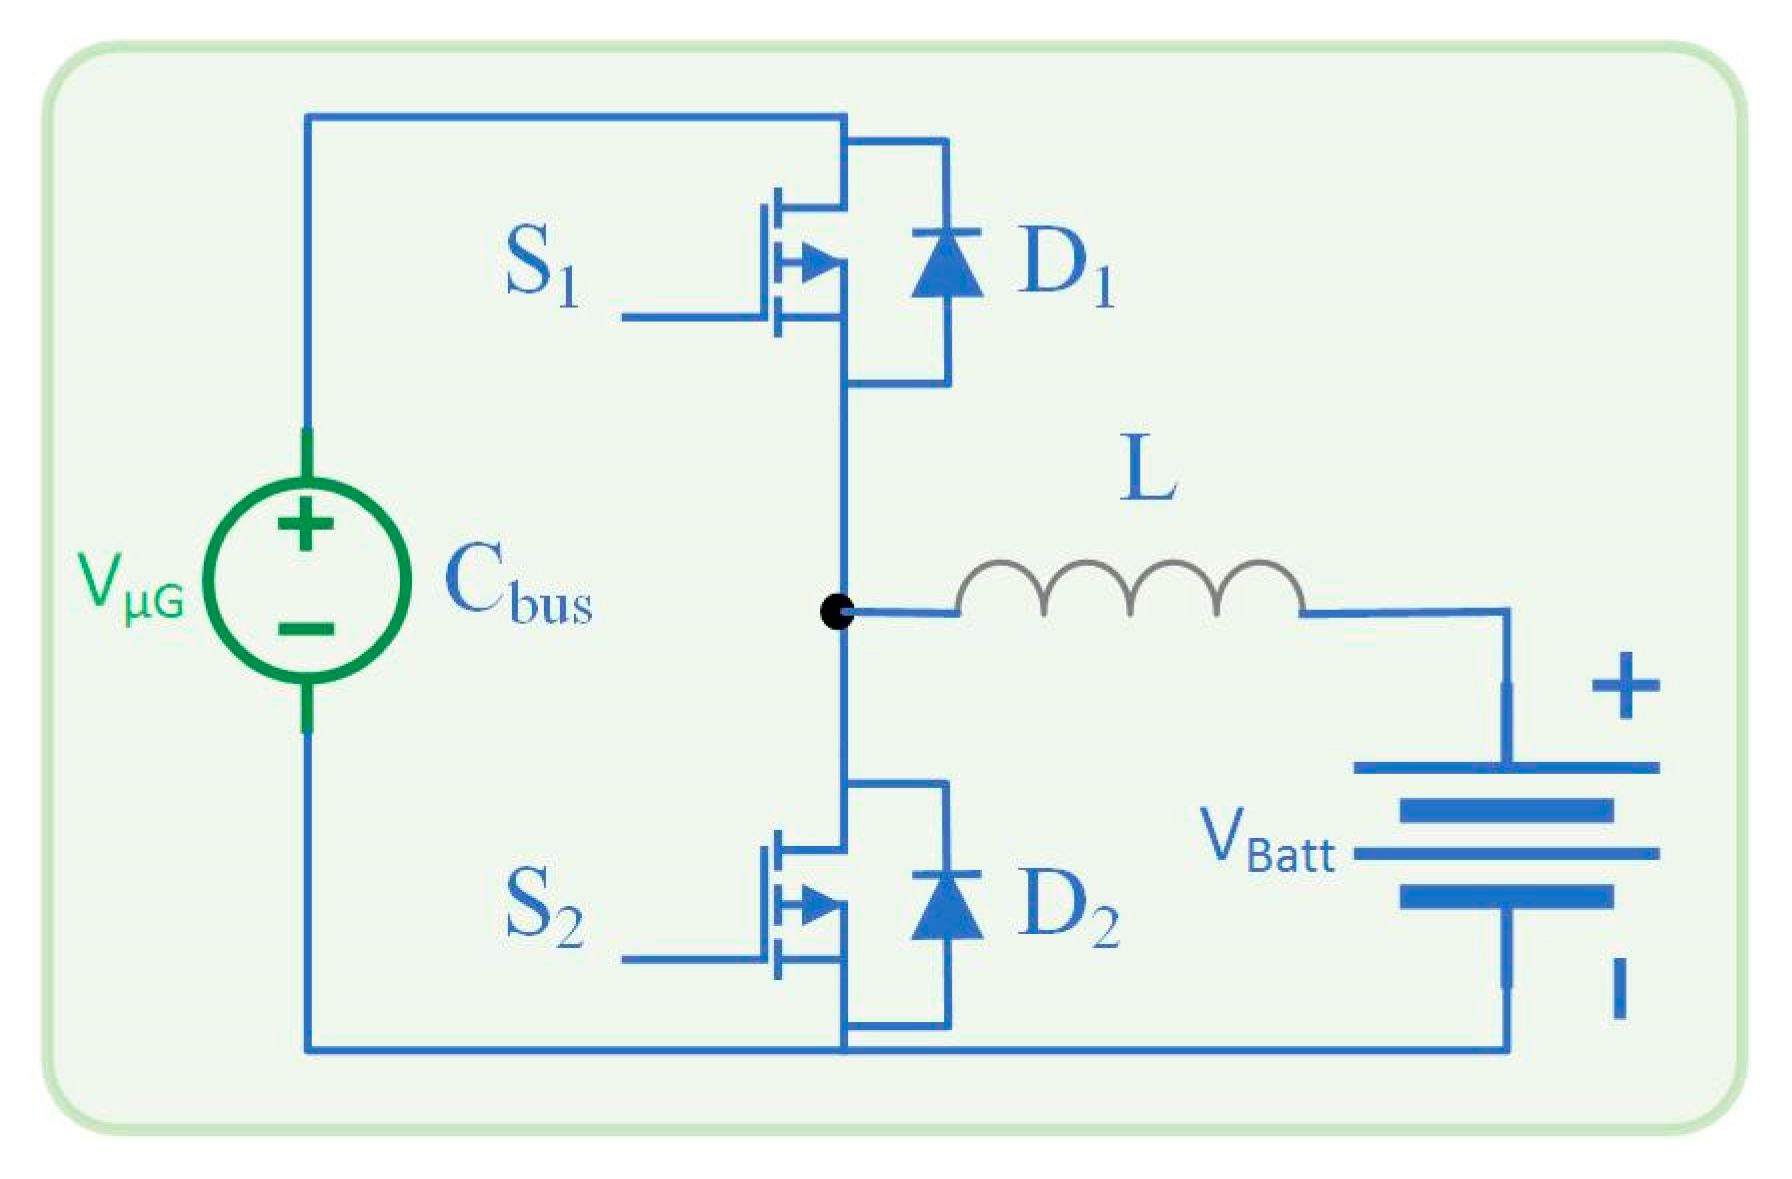
The bidirectional DC–DC converter used to interconnect the DC bus with the BB is controlled by a PI controller similar to that used for VC in the PVE converter (Figure 9). This control system has three modes of operation defined by the GMC based on the status of the PVEs, the MG, the electronic loads connected to the DC bus and the electrical charge status of the BB.
(1)
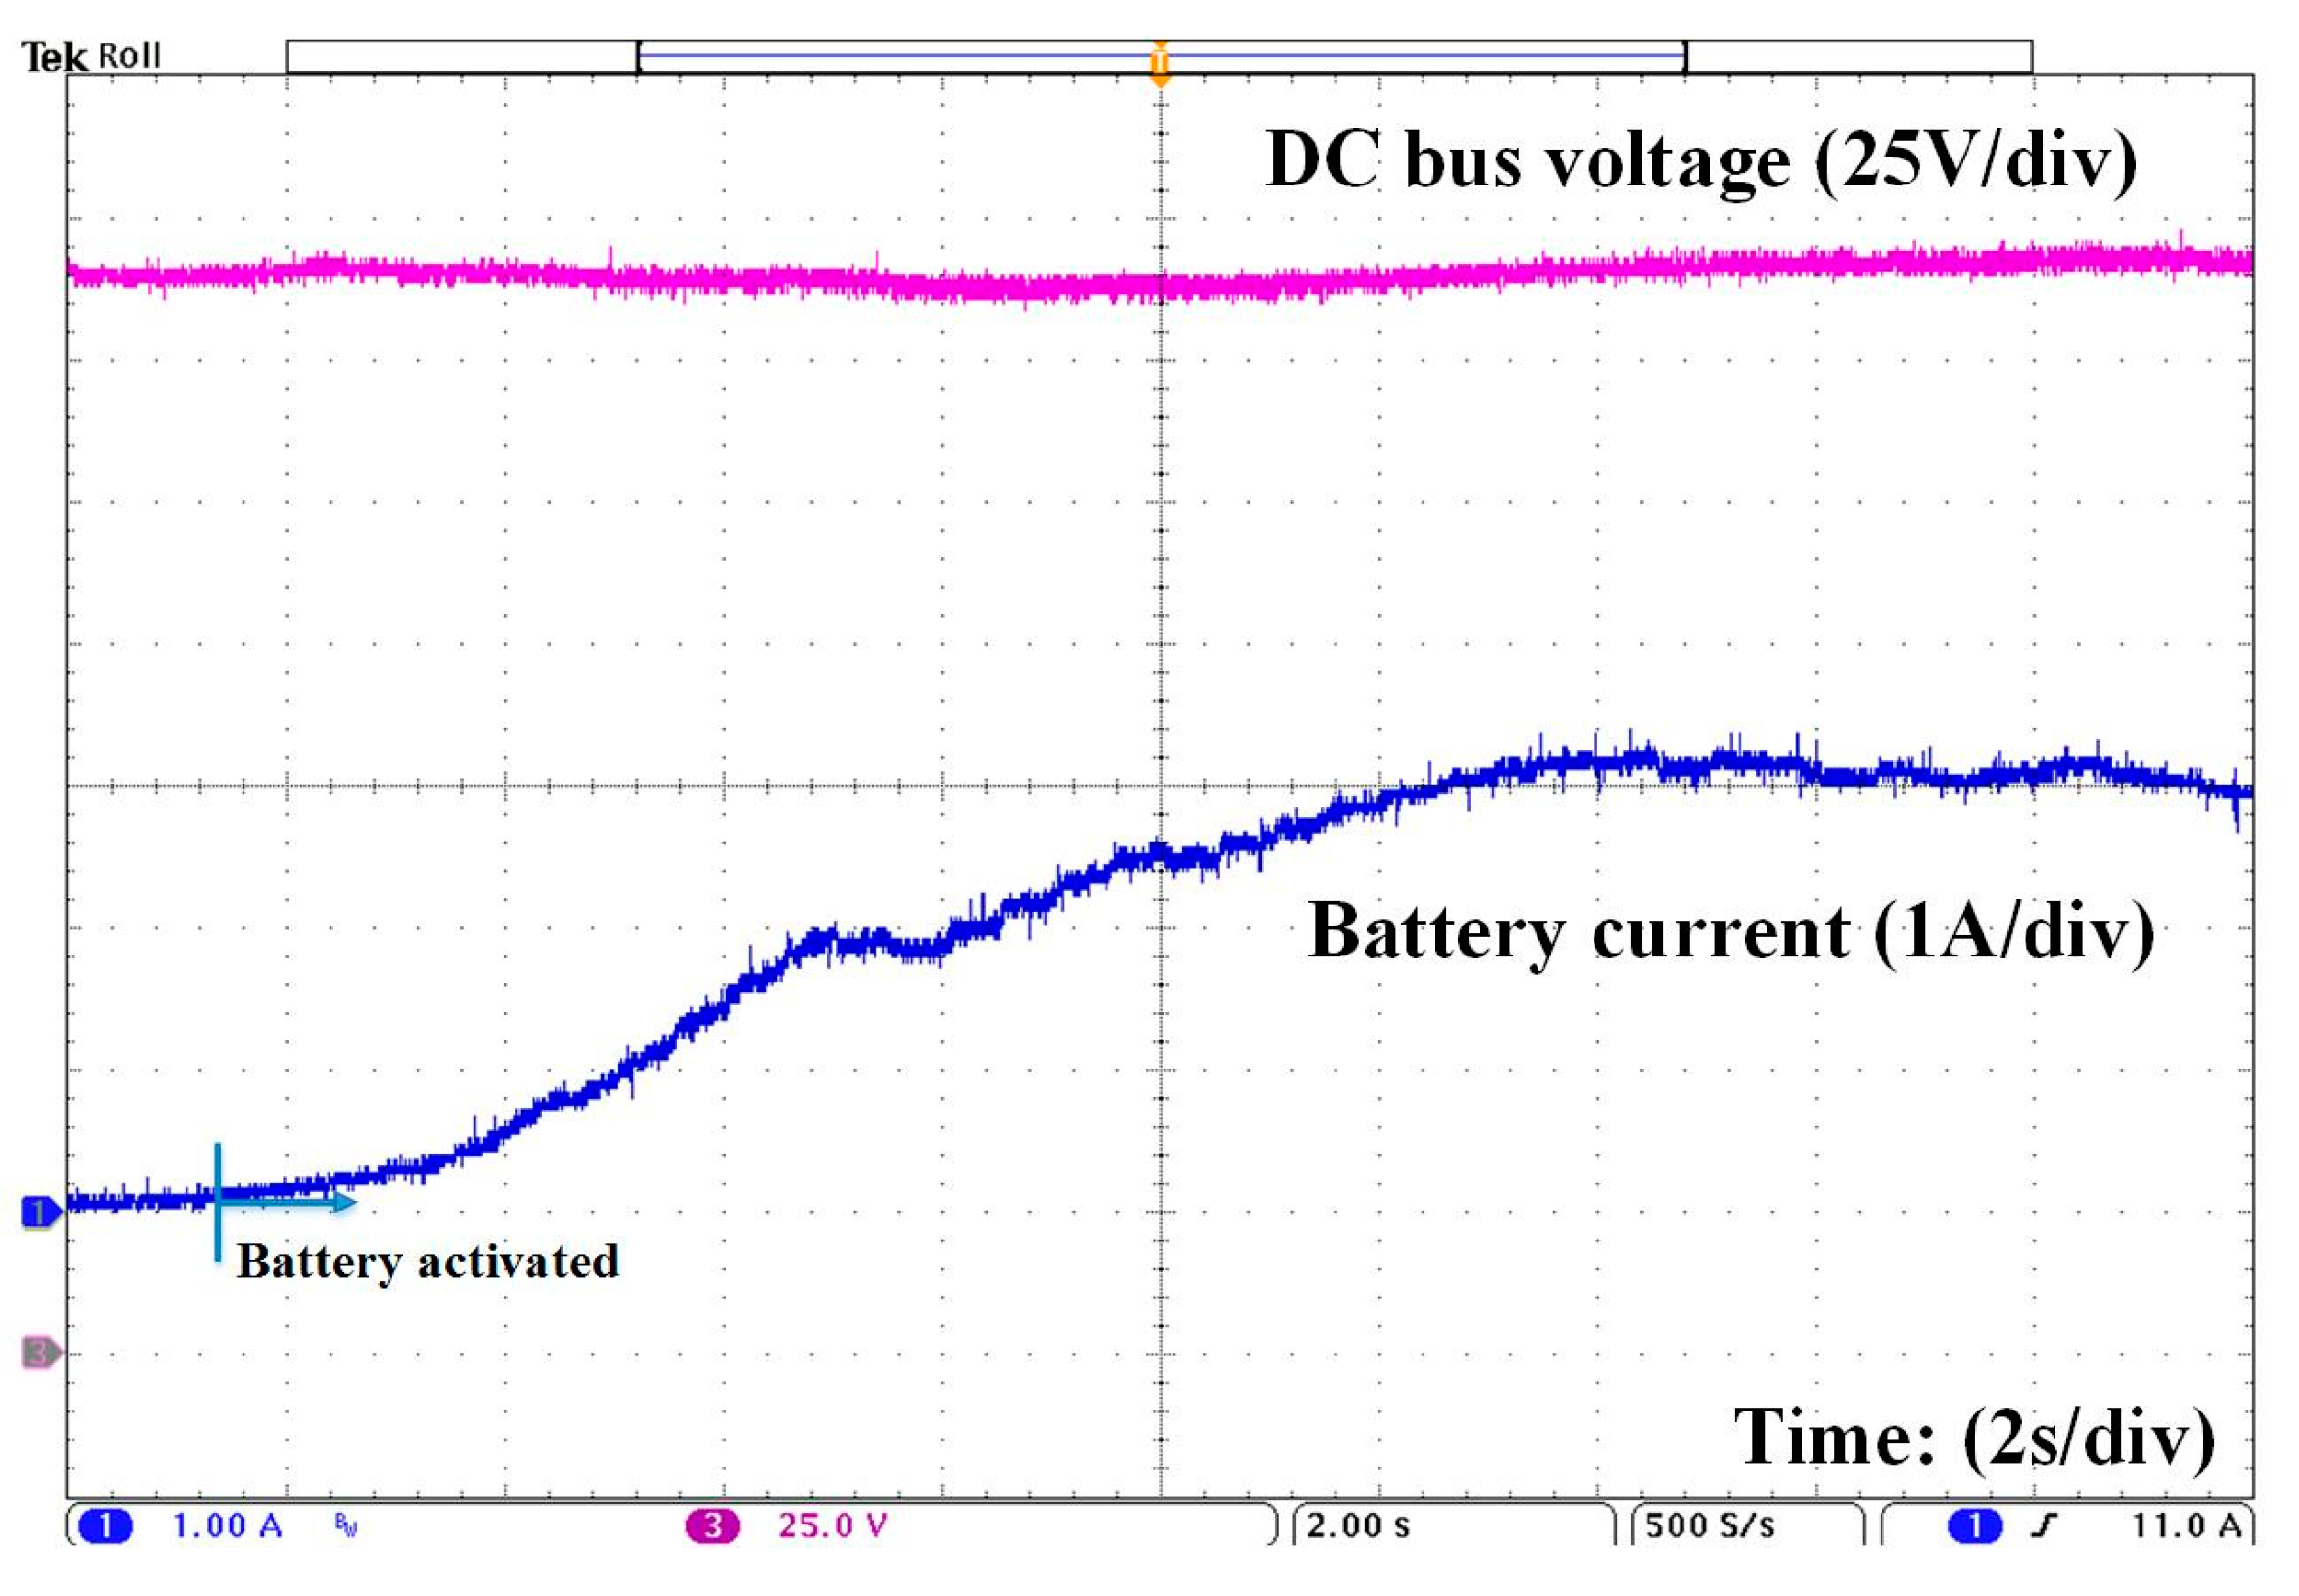
Battery charging: The PVEs work with the algorithm for the MPPT and the bidirectional DC–DC converter as a buck transferring power to the BB, while the MG is disabled. The controller operates based on the voltage level of the DC bus. If the voltage level increases, the energy transferred to the BB increases; otherwise, if the voltage level decreases, the energy transferred to the BB decreases;
(2)
Battery charging: The PVEs work with the MPPT algorithm, the bidirectional DC–AC converter operates as a rectifier by transferring power from the MG to the loads connected to the DC bus. In this operation mode, it is possible to transfer power from the MG to the BB, the bidirectional DC–DC converter works as a buck. For the control of the energy that is transferred to the BB, the controller operates with the electric current that is transferred to the BB. This electric current is defined by the power demanded from the DC–AC converter before transferring power to the BB, caring not to exceed the maximum capacity of the DC–AC converter designed to work at 1 kW;
(3)
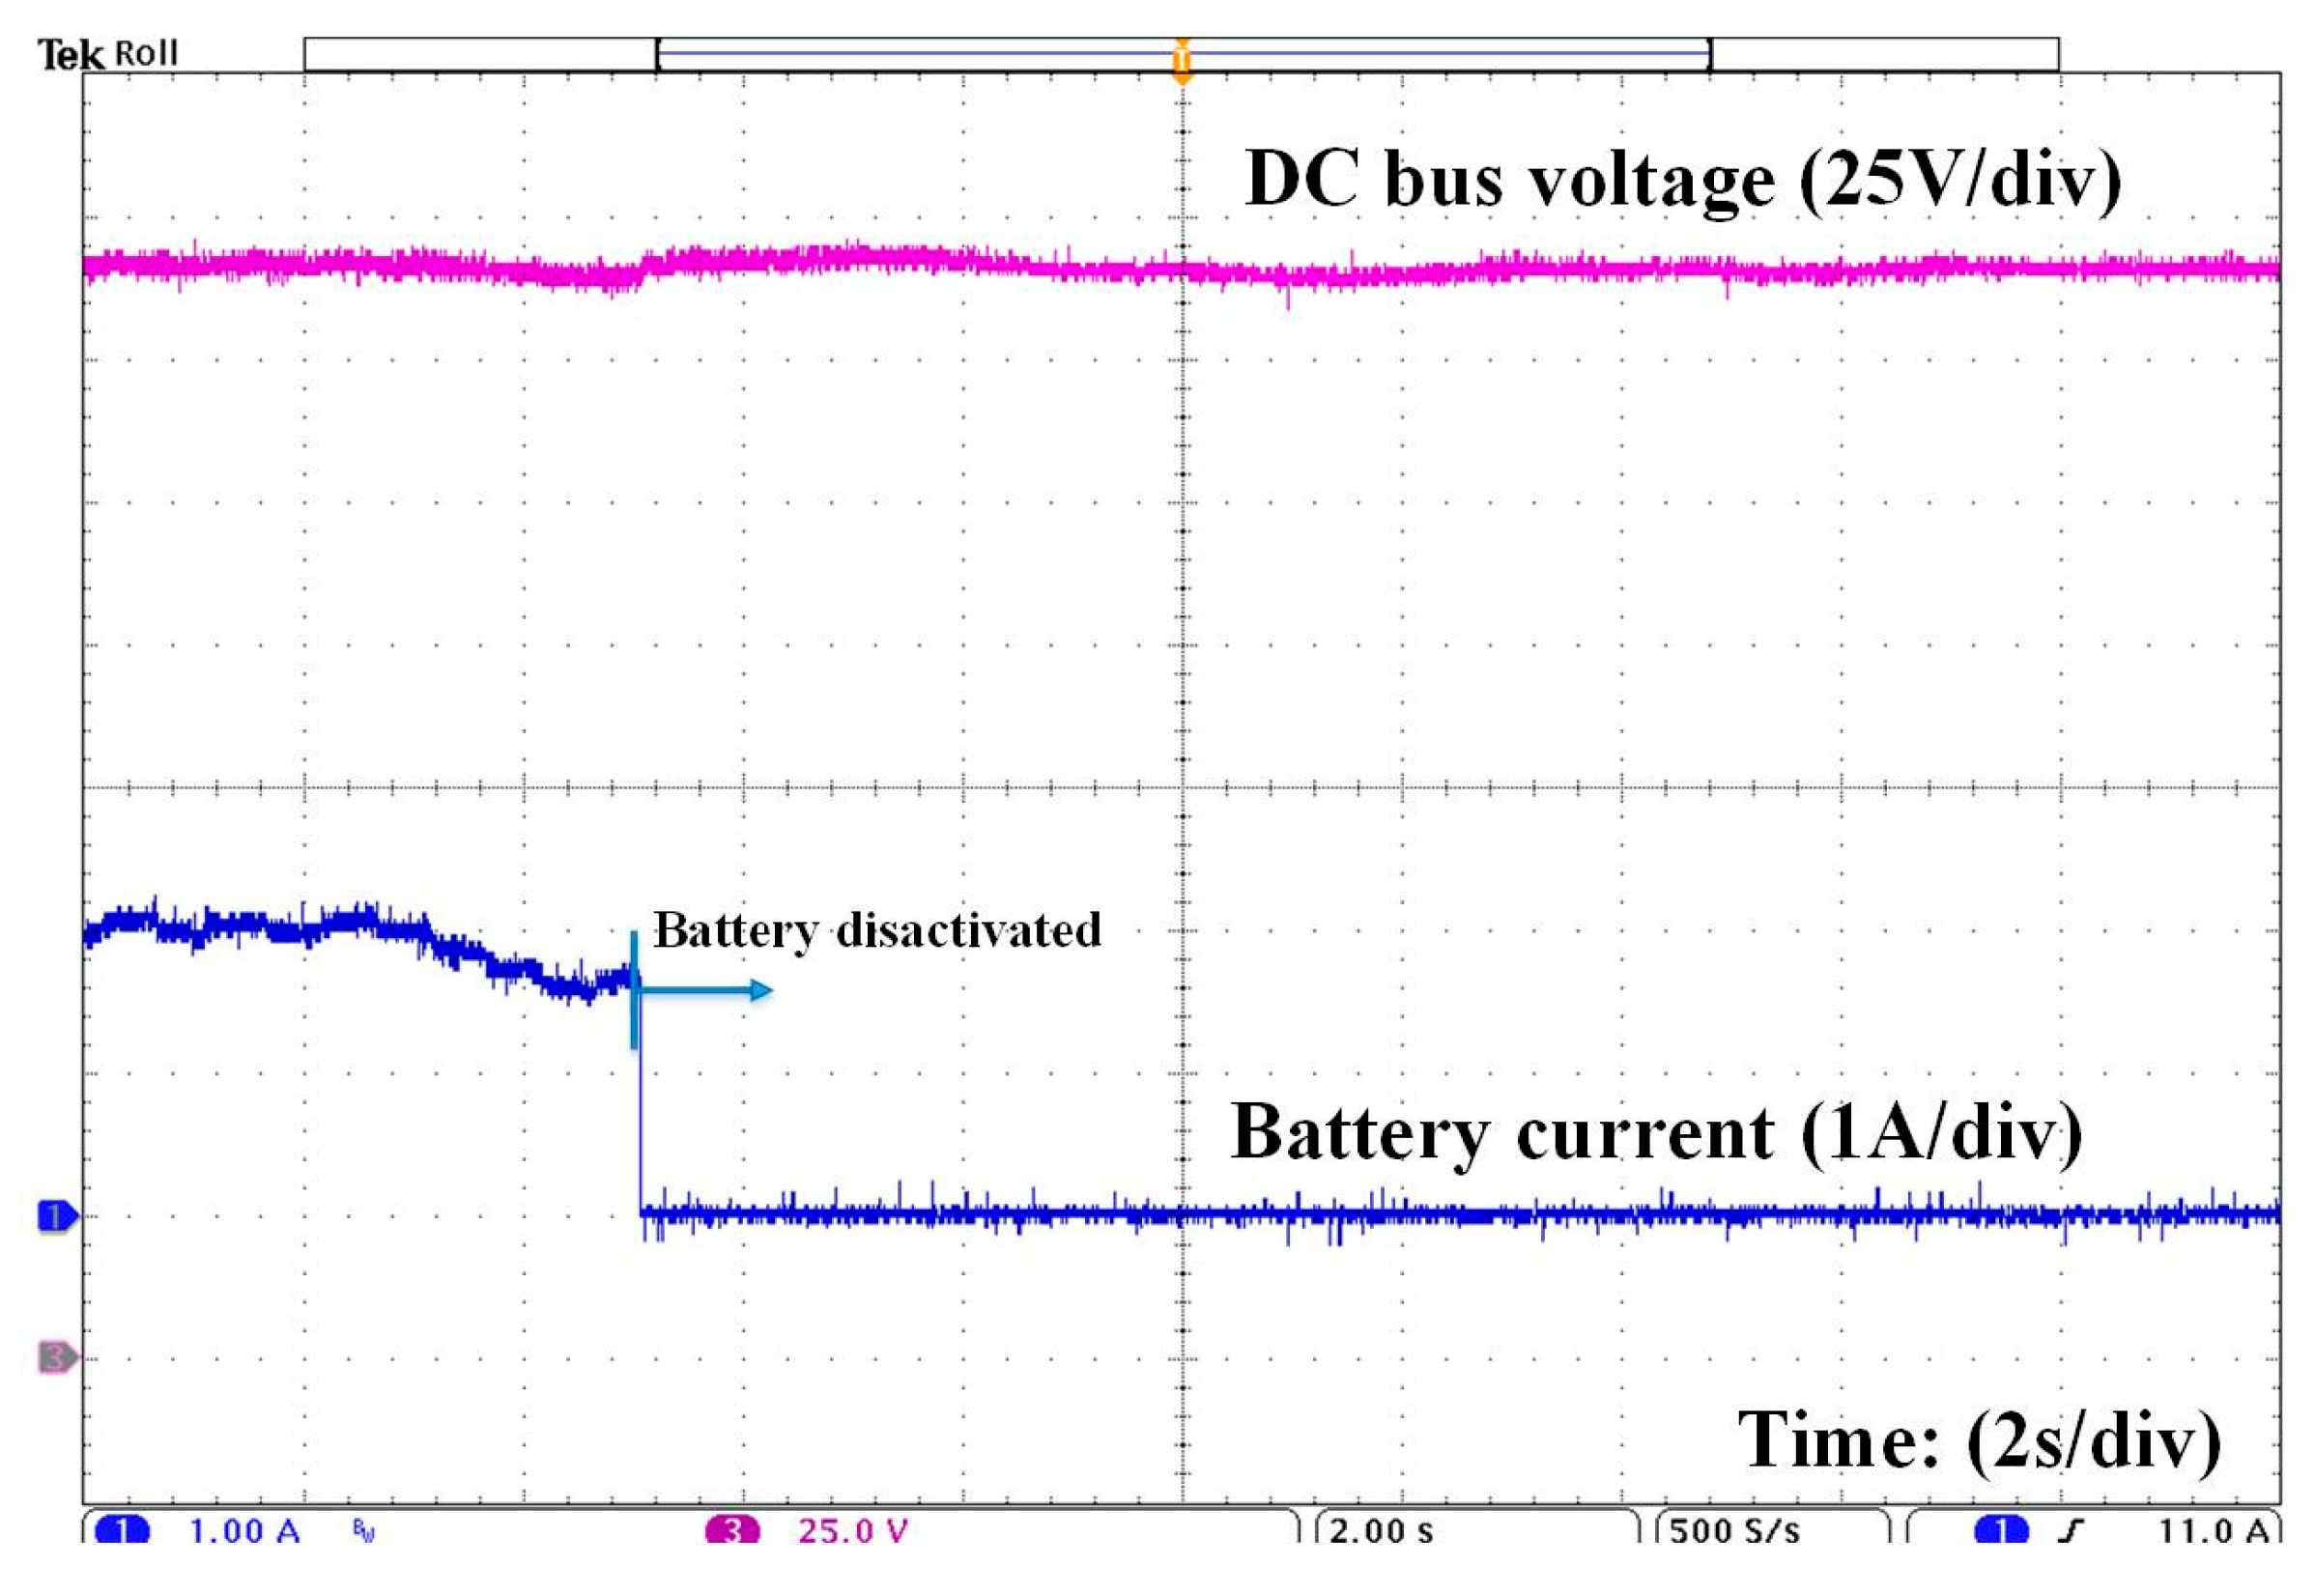
Battery discharge: The PVEs work with the algorithm for the MPPT, the bidirectional DC–DC converter functions as a boost transferring power from the BB to the loads connected to the bus, while the MG is disabled. The controller operates based on the voltage level of the DC bus. If the voltage level decreases, the energy transferred from the BB to the DC bus increases; otherwise, if the voltage level increases, the energy transferred decreases.
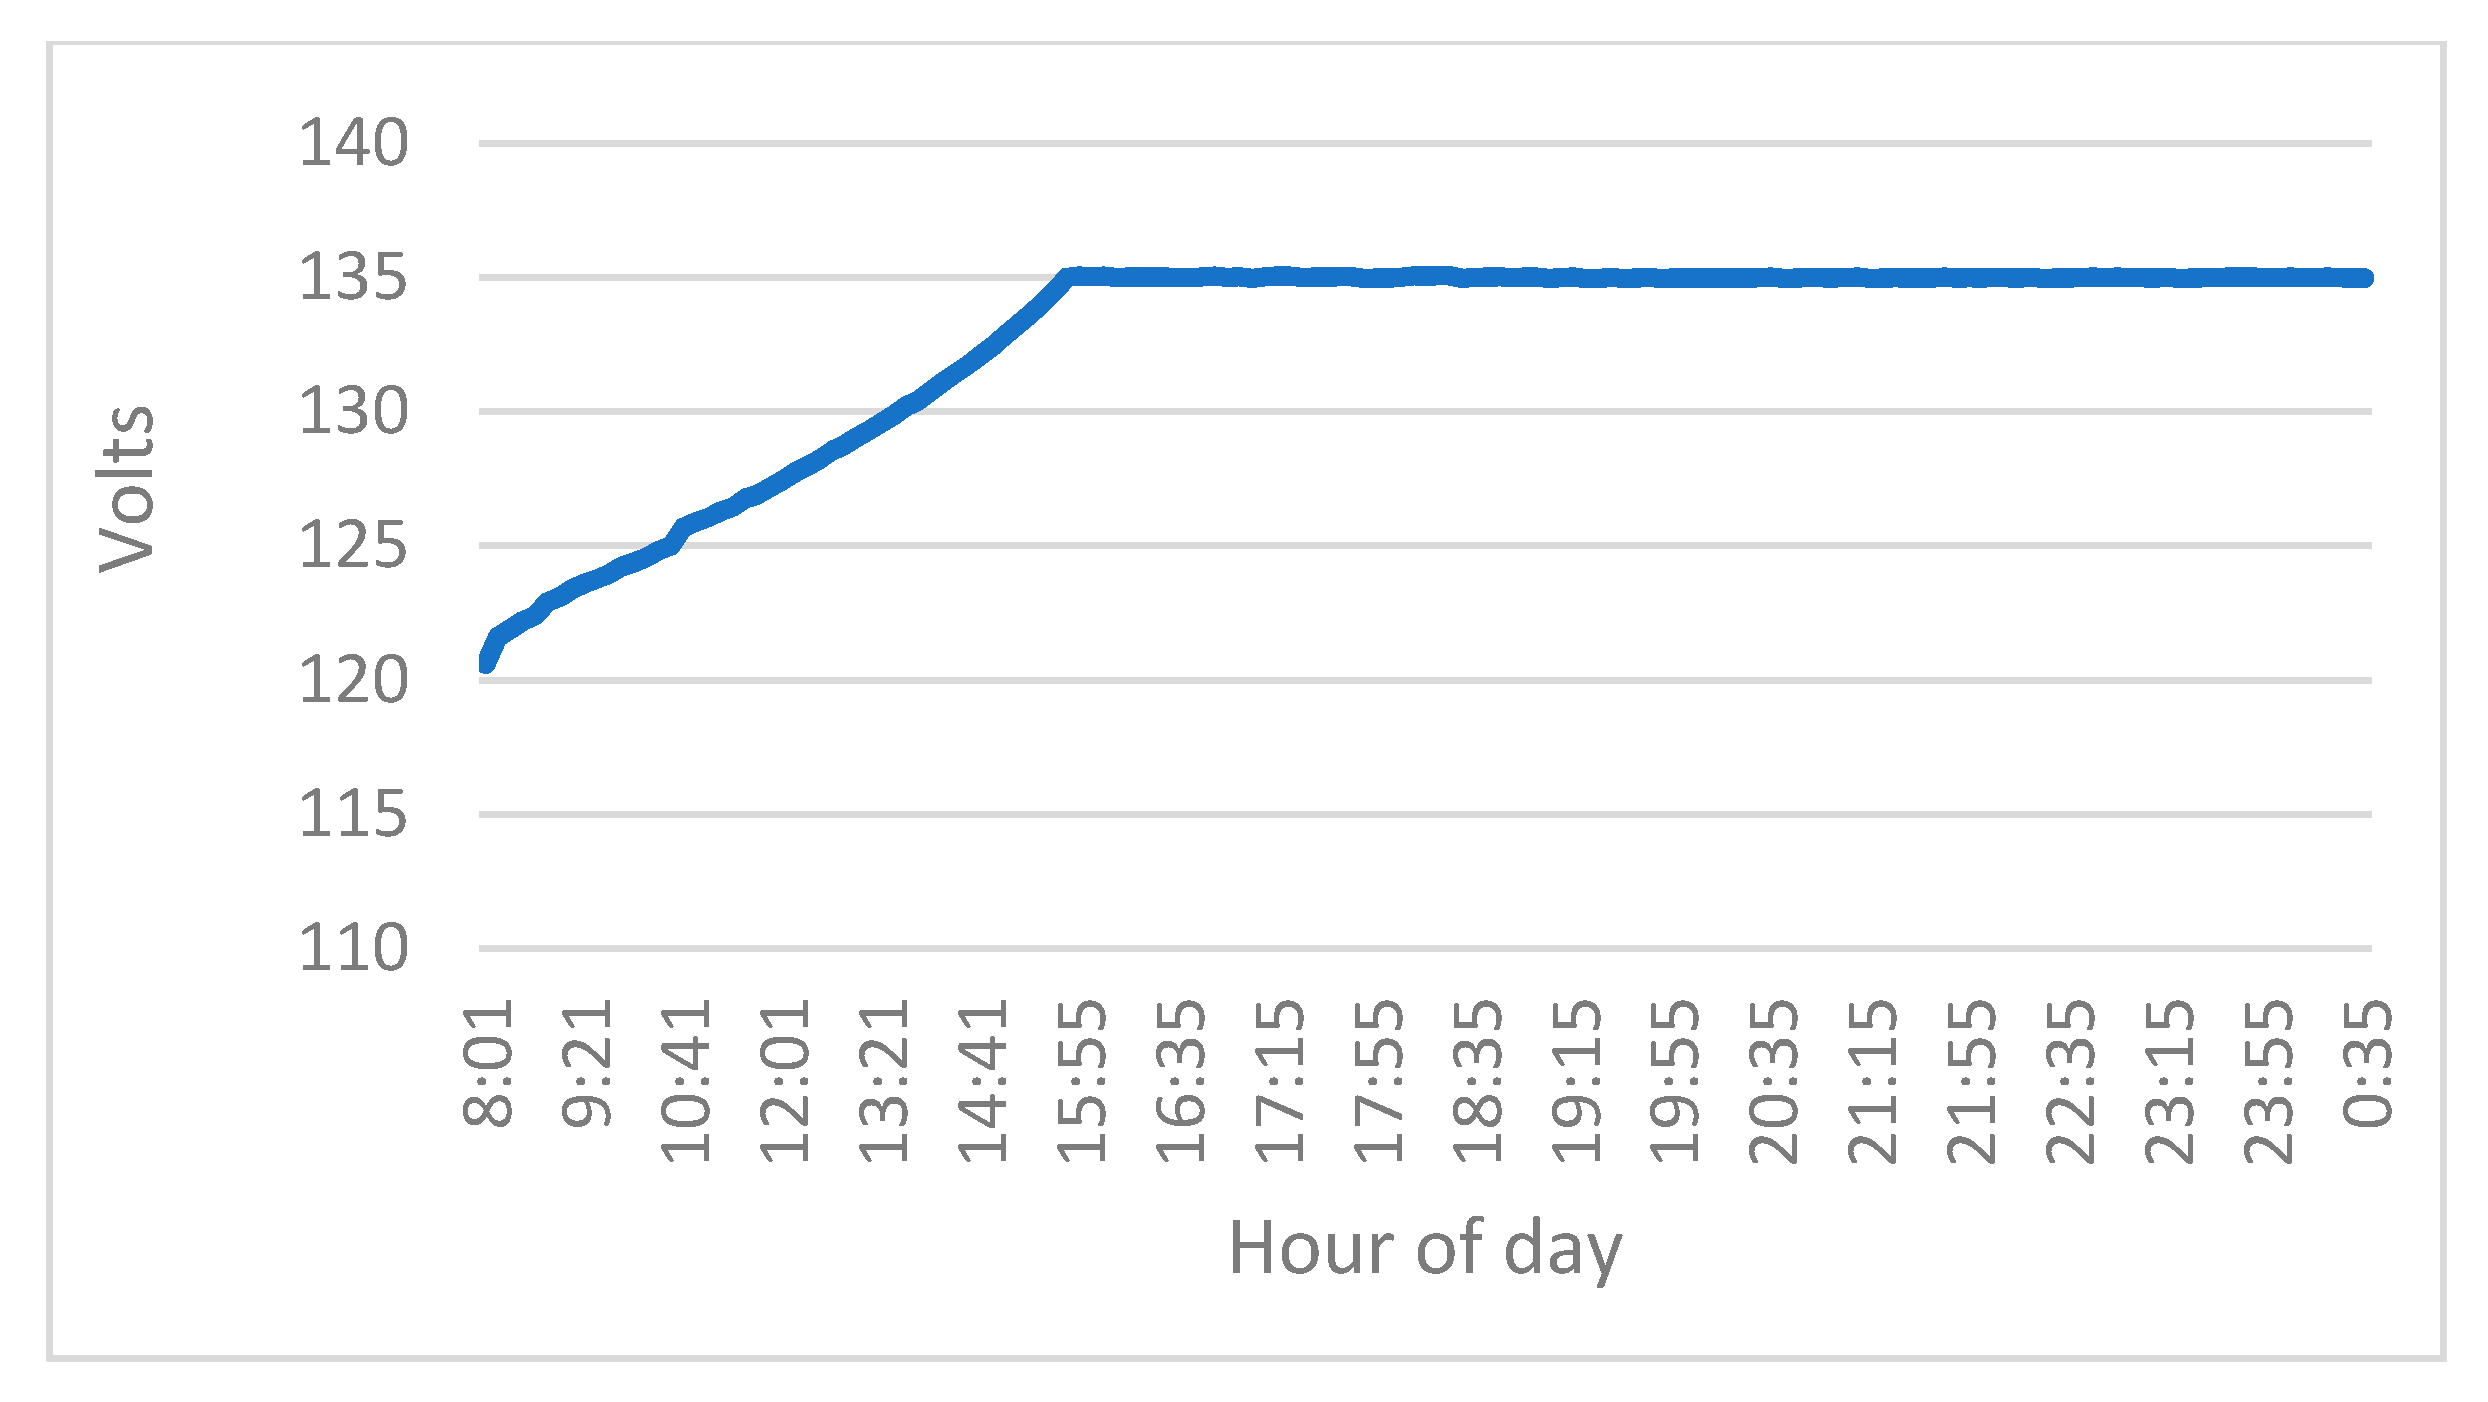
The previously described cases were defined based on the following BB operating criteria: (1) the BB charging and discharging process must always be completed, (2) the constant current charging process ends until the BB takes a value of maximum voltage of 135 V (if the energy generated is not enough to transfer energy to the BB at constant current the available energy is transferred to the BB), (3) the constant voltage charging process ends when the current that is injected into the BB is less than 0.5 A and (4) the discharge process ends when the battery voltage is 100 V. It is important to mention that the bidirectional power converter used in the BB has a maximum capacity of 1 kW, for this reason, the maximum current that can be extracted or transferred to the bank is 10 A.

4. Experimental Results

To verify the behavior of the CMS embedded with the experimental prototype of the DC-μG, each of the PVEs was configured with the following parameters: Vmpp = 120 V, Voc = 130 V, Impp = 2 A and Isc = 3 A. During the experimental tests, this configuration was used, although the PVEs can operate under uncertainties, it was not the objective of this investigation.

4.1. PVEs’ Ignition

Before activating the CMS, the PVEs are switched on, the DC bus has a resistive load of 116 W and the 0.23 F supercapacitor bank, the DC–DC and DC–AC bidirectional converters are disabled and the DC–DC boost converter behaves like a short circuit by directly connecting the PVEs with the resistive load and the supercapacitor bank. Figure 15 shows the response of the DC bus during the activating of the PVEs. The DC bus takes 6.4 s to reach a voltage of 131 V, this is due to the time it takes for the supercapacitor bank to absorb the PVEs energy.

4.2. PVEs in Voltage Control Mode, MG and BB Disabled

Once the DC bus stabilizes, the CMS is activated and the first operating condition is START, the MG and the BB remain disabled, while the PVEs converters work in VC mode. Figure 16 shows the response of the DC bus when activating the CMS, the VC needs 20 s to stabilize at the desired voltage level (190 V).
When the CMC works in the START condition, the system is able to keep the DC bus stable in case of load changes, the PVEs are responsible for supplying the energy demanded by the loads while the DC–DC boost converters operate in mode VC. Figure 17 shows the behavior when connecting a 115 W LED-type electronic lighting load, while Figure 18 shows the behavior when disconnecting the load. When the load is connected or disconnected, a drop and an overshoot of 1.5 V (0.78%) is generated regarding the established voltage level of 190 V, the response has a transition time of 10 s.
A 300 W fluorescent luminaire was used in the experimental tests, Figure 19 illustrates the behavior of the DC bus when connecting the load, while Figure 20 shows the behavior when disconnecting it. When the load is connected, the bus has a voltage drop of 1.5 V (0.78%), while the load is disconnected there is an excess of 4.25 V (2.2%), both responses with a stabilization time of 4 s.
To verify the behavior of the GMS in the limit of the START state a fluorescent load of 400 W was used. When connecting this load, the energy generated by the PVEs is equal to the energy demanded by the loads, in Figure 21 and Figure 22 the bus behavior, when connecting and disconnecting the load, is presented. When the load is connected, the bus has a voltage drop of 3 V (1.57%) when disconnecting, it has an overshoot of 7.5 V (3.94%), in both cases there is a stabilization time of 10 s.

4.3. DC–AC Converter Working as Rectifier, PVE’s and BB Disabled

When PVEs are not available to generate power, the GMC has the priority of transferring power from the MG to the DC bus while keeping the BB disabled. The GMC enables the DC–AC converter to work as a rectifier with the control system illustrated in Figure 14. Figure 23 shows the behavior of the bus when enabling the converter, at this moment the supercapacitor bank absorbs energy from the MG and stabilizes at a voltage level of 144 V in a time of 12 s. Next, the GMC activates the rectifier controller by stabilizing the bus at the desired voltage level of 190 V (See Figure 24). The DC bus has a stabilization time of 12 s.
For this case, the same loads were used as in the previous case, presenting the behavior of the DC bus before the connection (Con) and disconnection (Discon) of these loads, in Figure 25 and Figure 26 a 115 W LED luminaire is used, in Figure 27 and Figure 28 a fluorescent luminaire (FL) of 300 W, finally in Figure 29 and Figure 30 a FL of 400 W. Table 8 shows the voltage drops (D), the overshoots (O) and the stabilization times before these disturbances. This table presents the behavior of the DC bus under the following conditions: (1) MG supplying power to the loads, (2) PVEs supplying power to the loads, (3) MG supplying power to the loads and the BB and (4) PVEs supplying power to the loads and the BB.

4.4. Disabled PVEs, MG Supplying Energy to the Loads and the BB

When the MG is supplying power to the loads connected to the DC bus and the power is less than 1 kW, the remaining energy is transferred to the BB (PBB = 1 kW–PLOADS). The control of the energy that is transferred to the BB is determined by the current that is injected into the BB (the setpoint of this power is determined from the PBB), in this operation mode the bidirectional DC–DC converter works as a buck.
Figure 31 shows the behavior of the DC bus and the power that is injected into the BB when activating the DC–DC bidirectional converter as a buck. When activating the energy transfer to the BB, the DC bus has a voltage drop of 1.65 V (0.86%), while the power injected into the BB takes the desired level of 3 A, this transition has a stabilization time of 10 s. When energy is being transferred to the BB and it is charged at 80%, the power injected into the BB is canceled. Figure 32 shows the behavior of the current and the DC bus at the time of changing the operating mode. At the time of the transition, the DC bus has a 2.5 V (1.31%) overshoot with a stabilization time of 4 s.

4.5. PVEs Supplying Energy to the Loads and to BB and Disabled MG

Another way to transfer energy to the BB is to use excess energy from the PVEs. In this state, the energy transferred to the BB is determined by PBB = PPVEs − PLOADS. If the control of the DC–DC converters of the PVEs is in VC mode and the extracted power is less than 80% of the maximum power, the GMC modifies its operating state, changing the VC mode to the MPPT mode in the converters of the PVEs and activating the control for the bidirectional DC–DC converter of the BB in buck mode.
Figure 33 illustrates the behavior of the DC bus and the current (power) that is injected into the BB. When changing state, the bus suffers a voltage drop of 8.75 V (4.6%) with a stabilization time of 6 s, while the current takes its maximum value in 3 s. The current has constant variations because the control algorithm for the MPPT is responsible for disturbing the energy generated by the PVEs, which affects the injected current to the BB and the DC bus. Figure 34 shows the behavior of the same signals when the BB stops transferring energy.
To recognize the dynamic response of the BB in the charging process, the bidirectional converter was used in buck mode, this converter takes the electrical energy generated by the PVEs and transfers it to the BB. When the BB is fully discharged, the constant current charge is carried out maintaining a current (power) level of 8.8 A (because the maximum capacity of the bidirectional DC–DC converter is 1 kW), as the time passes the BB voltage tends to increase up to a voltage level of 135 V, at this moment the control changes to constant voltage mode, decreasing the current that is transferred to the BB. The BB is considered to be fully charged when the current supplied is 500 mA. Figure 35 illustrates the behavior of the BB voltage while charging in constant power mode and voltage, the charge in constant power mode has a duration of 8 h, while the charge in constant voltage mode was 8.5 h. The behavior of the current in both modes is illustrated in Figure 36.

4.6. BB Supplying Energy to the Loads, Disabled PVEs and MG

After conducting experimental tests of the BB’s charge, obtaining energy from the MG and the PVEs, the behavior of the BB’s charging and discharging process is presented. For these tests, a load was connected to the DC bus that requires a constant power of 1 kW (maximum power of the µG), while the bidirectional converter works in boost mode keeping the voltage of the DC bus at 190 V. The behavior of the BB voltage with an initial voltage of 121.2 V is shown in Figure 37; as time passes, the BB voltage decreases and this generates an increase in the current delivered by the BB (See Figure 38), this due to a constant power of 1 kW being demanded for the load connected to the bus. Figure 38 presents the behavior of the BB current at the discharge. The discharge was carried out until the BB voltage dropped to a level of 100 V, so as not to damage the BB following the specifications given by the manufacturer. Under these conditions, the DC–DC converter was able to maintain the voltage level of the DC bus at a level of 190 V while supplying power at a 1 kW load for approximately 10 h until the BB was discharged.

4.7. PVEs Supplying Power to the Loads and the MG, Disabled BB

In this test, the interconnection of the DC-µG with the MG is generated. In this condition the PVEs operate with the control algorithm for the MPPT and the DC–AC converter is enabled as an inverter transferring energy from the PVEs to the MG. In this way, the remaining energy between the energy generated by the PVEs and the energy consumed by the loads connected to the DC bus (PMG = PPVEs − PLOADS) is transferred to the MG. During the interconnection with the MG the voltage level of the DC bus suffers a drop of 2.2% with a duration of the transitory response of 6 s. Figure 39 shows the AC output voltage–current oscillogram of the inverter interconnected with the MG supplying 320 W. This image illustrates the AC voltage and power signals when performing the energy transfer; In addition, the instantaneous power being supplied to the AC MG and the power factor are displayed.

5. Conclusions

This study shows the design and implementation of a management and control system applied to an experimental prototype of a DC-µG for a maximum power of 1 kW with a DC bus with a voltage level 190 V, which can operate isolated or interconnected with the MG. The proposed DC-µG is made up of two photovoltaic systems, a complete bridge inverter, a BB and electronic loads (LED-type, fluorescent and computer equipment). For the administration and control of energy in the DC-µG, an EMS was implemented on the NI myRIO-1900 platform using the LabVIEW virtual programming software for the design of the EMS.
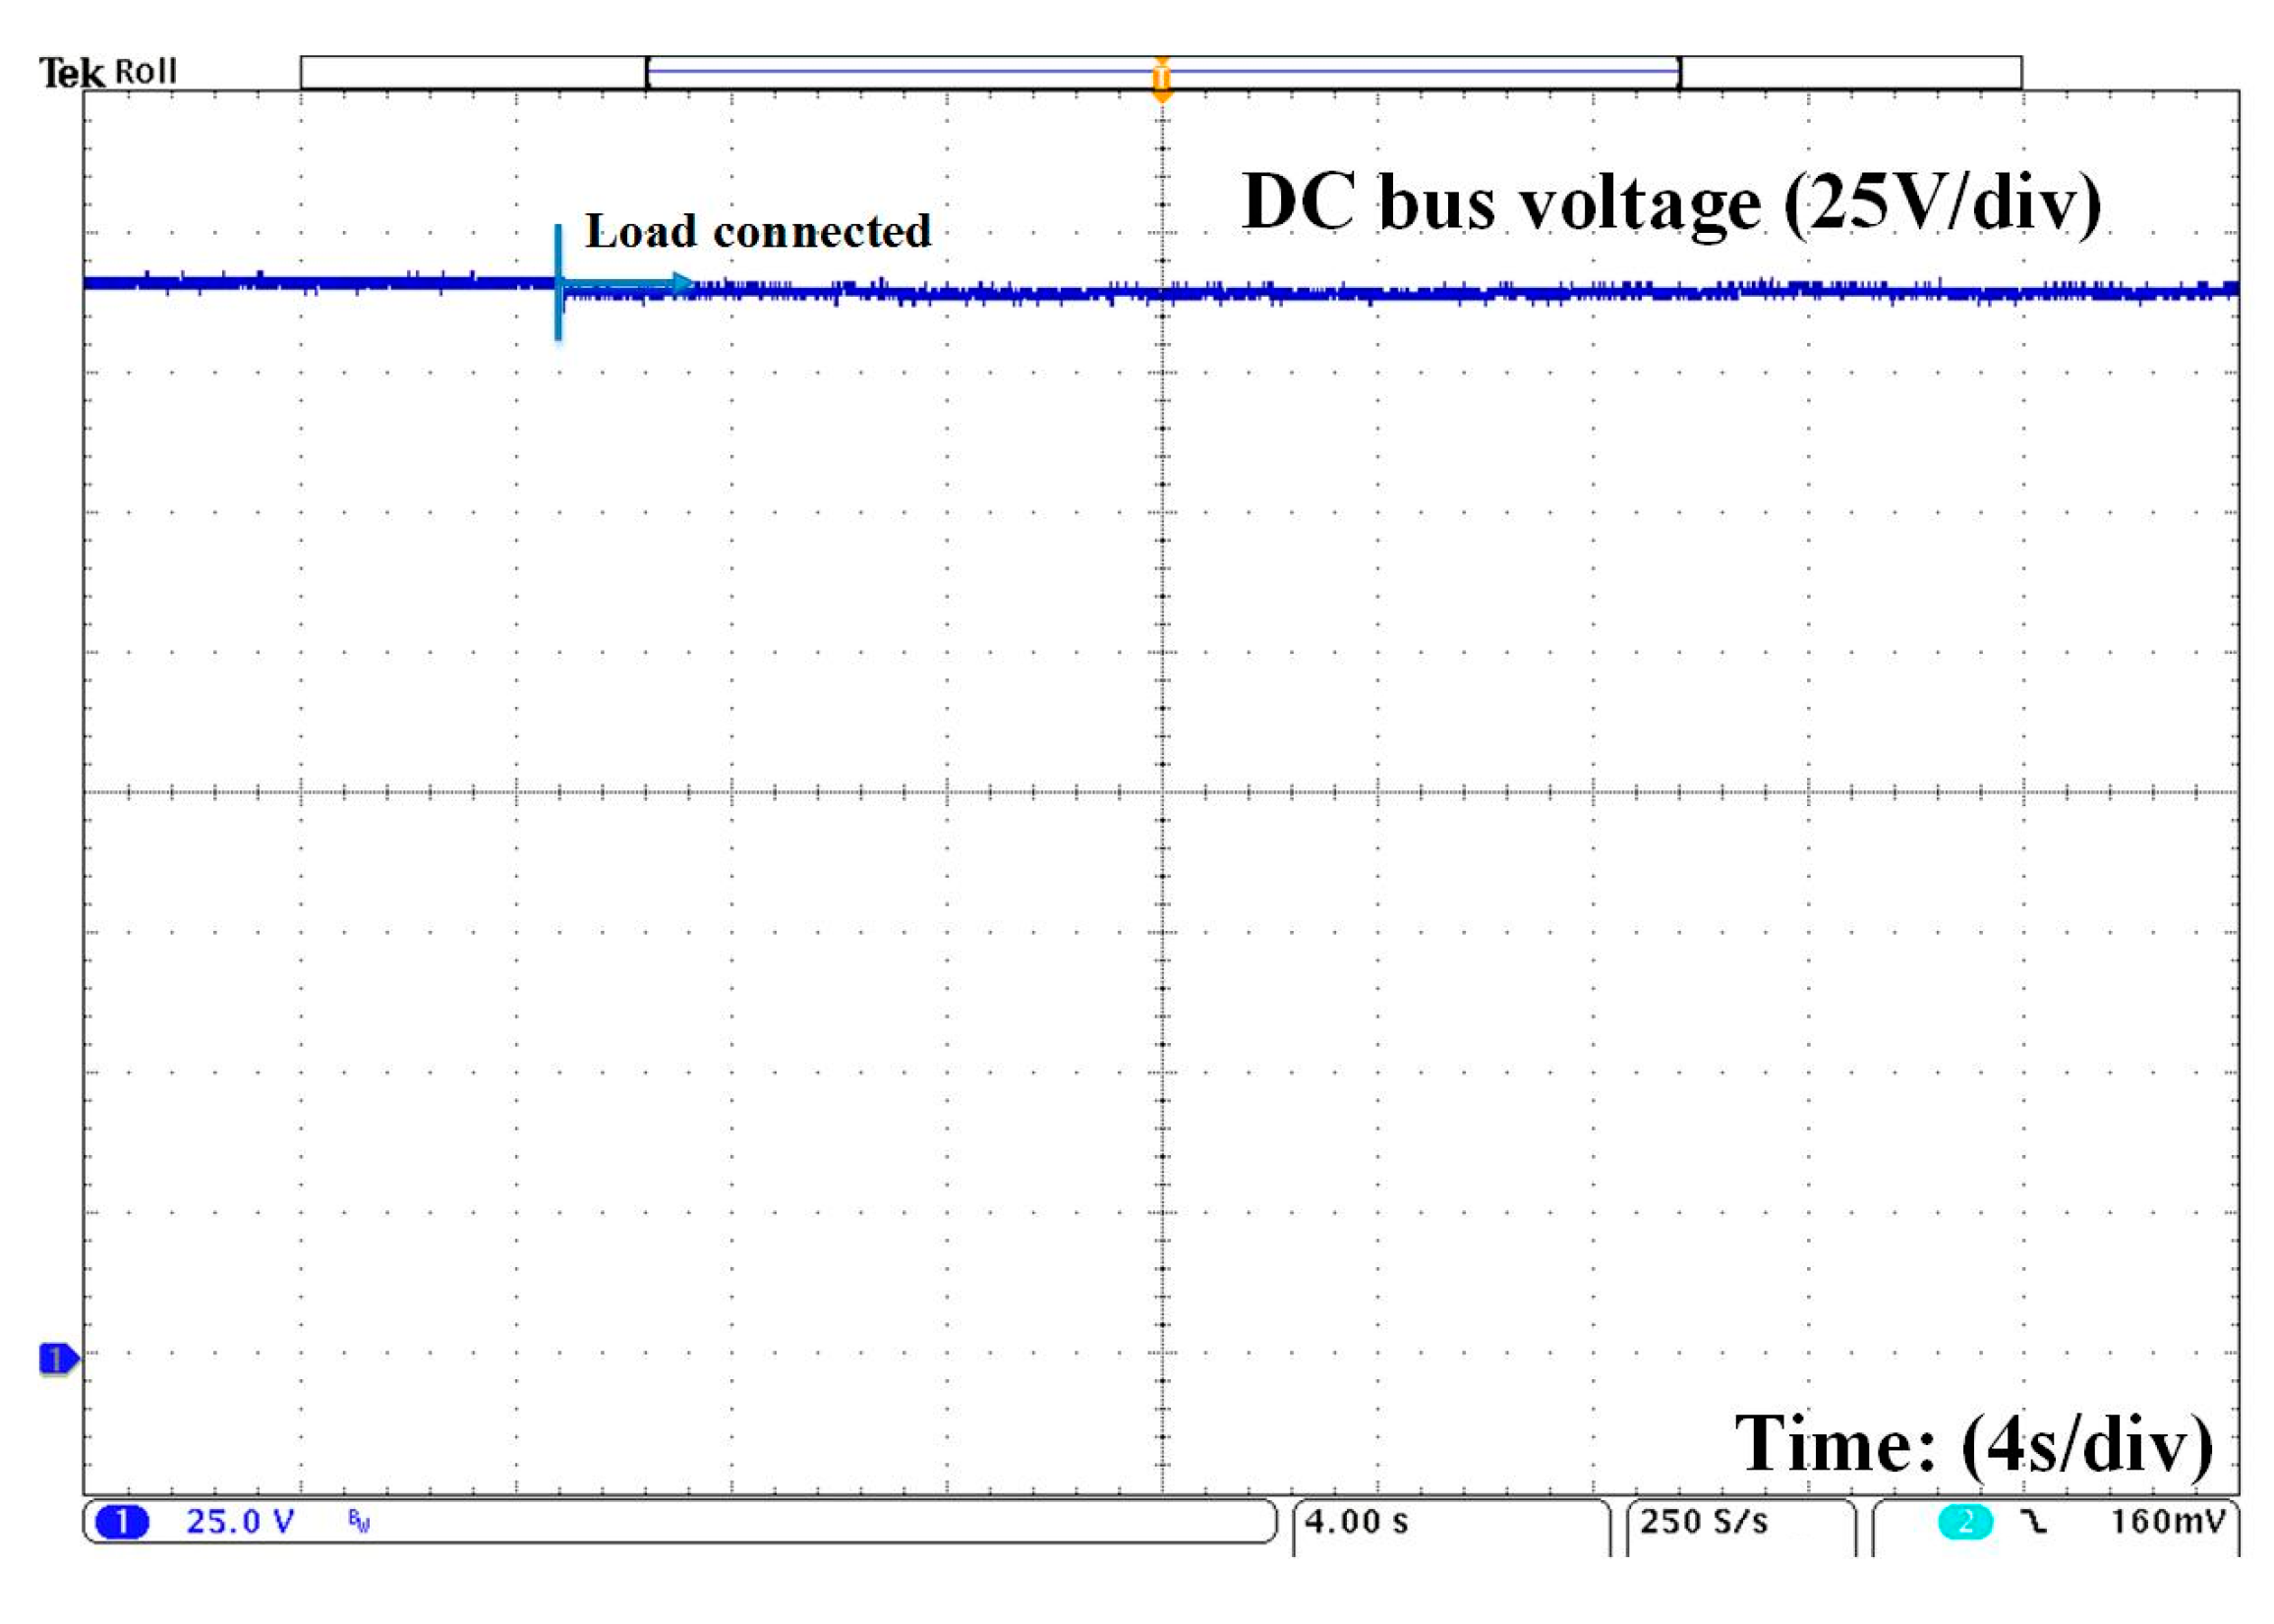
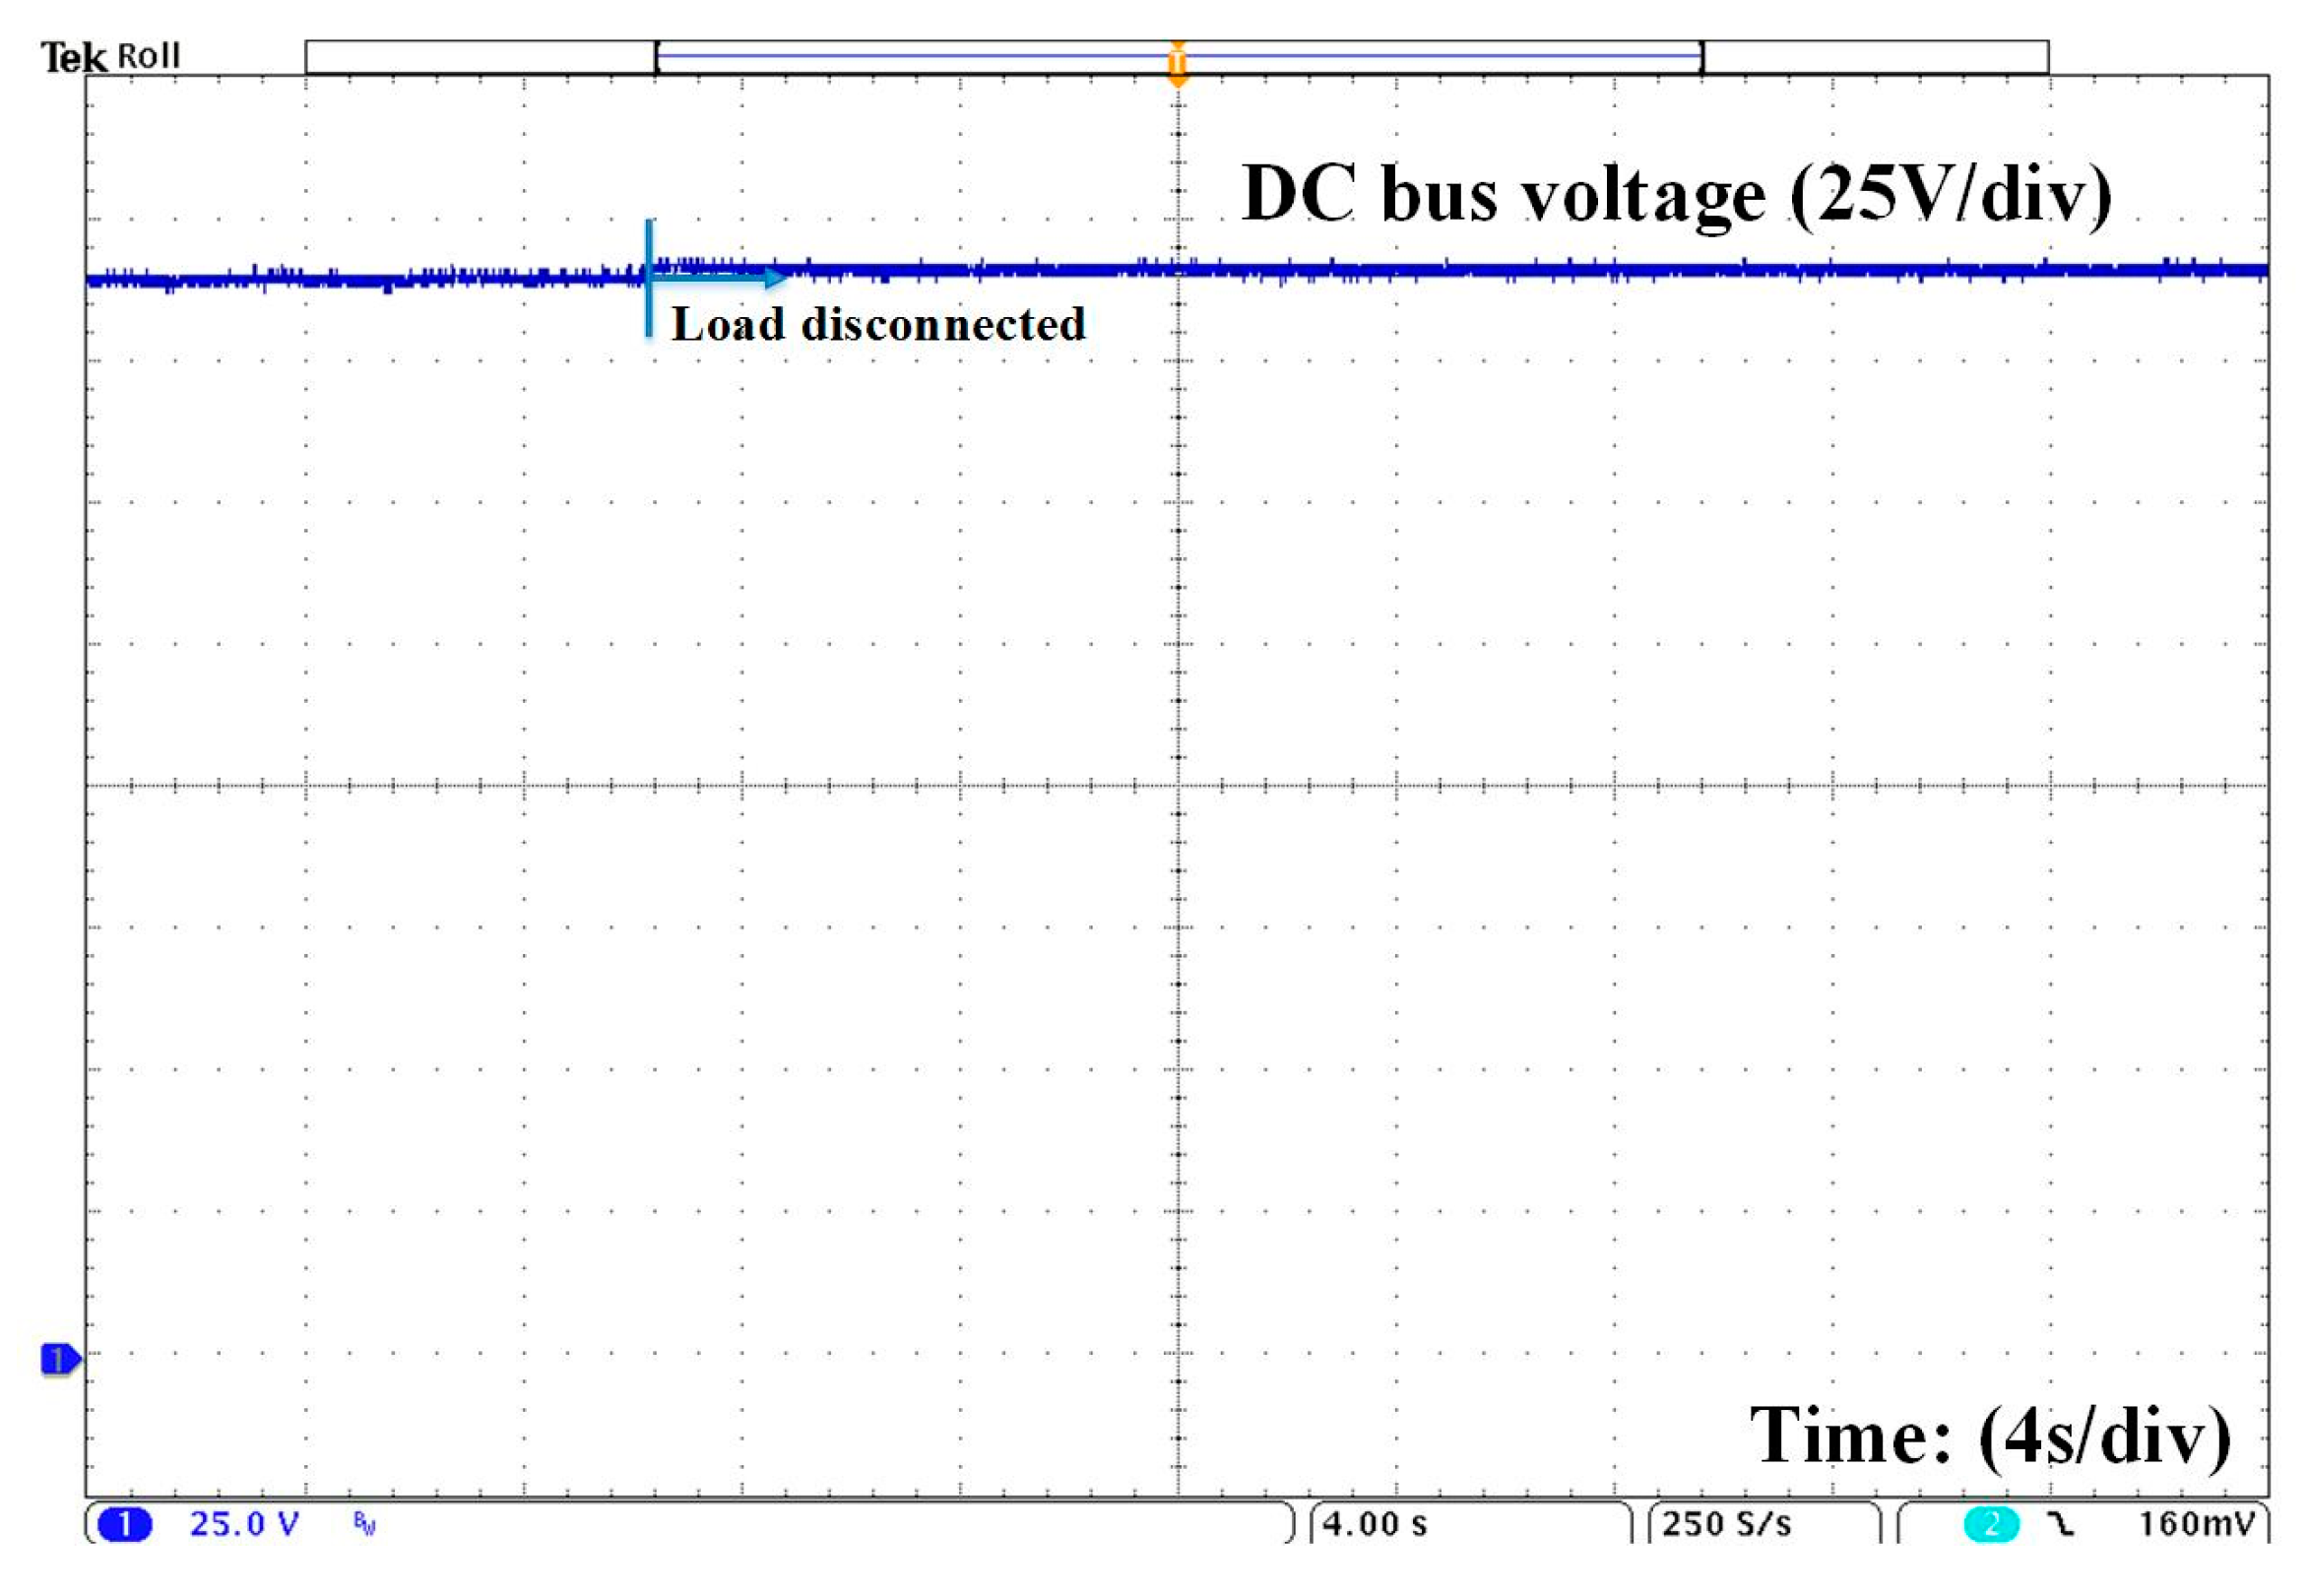
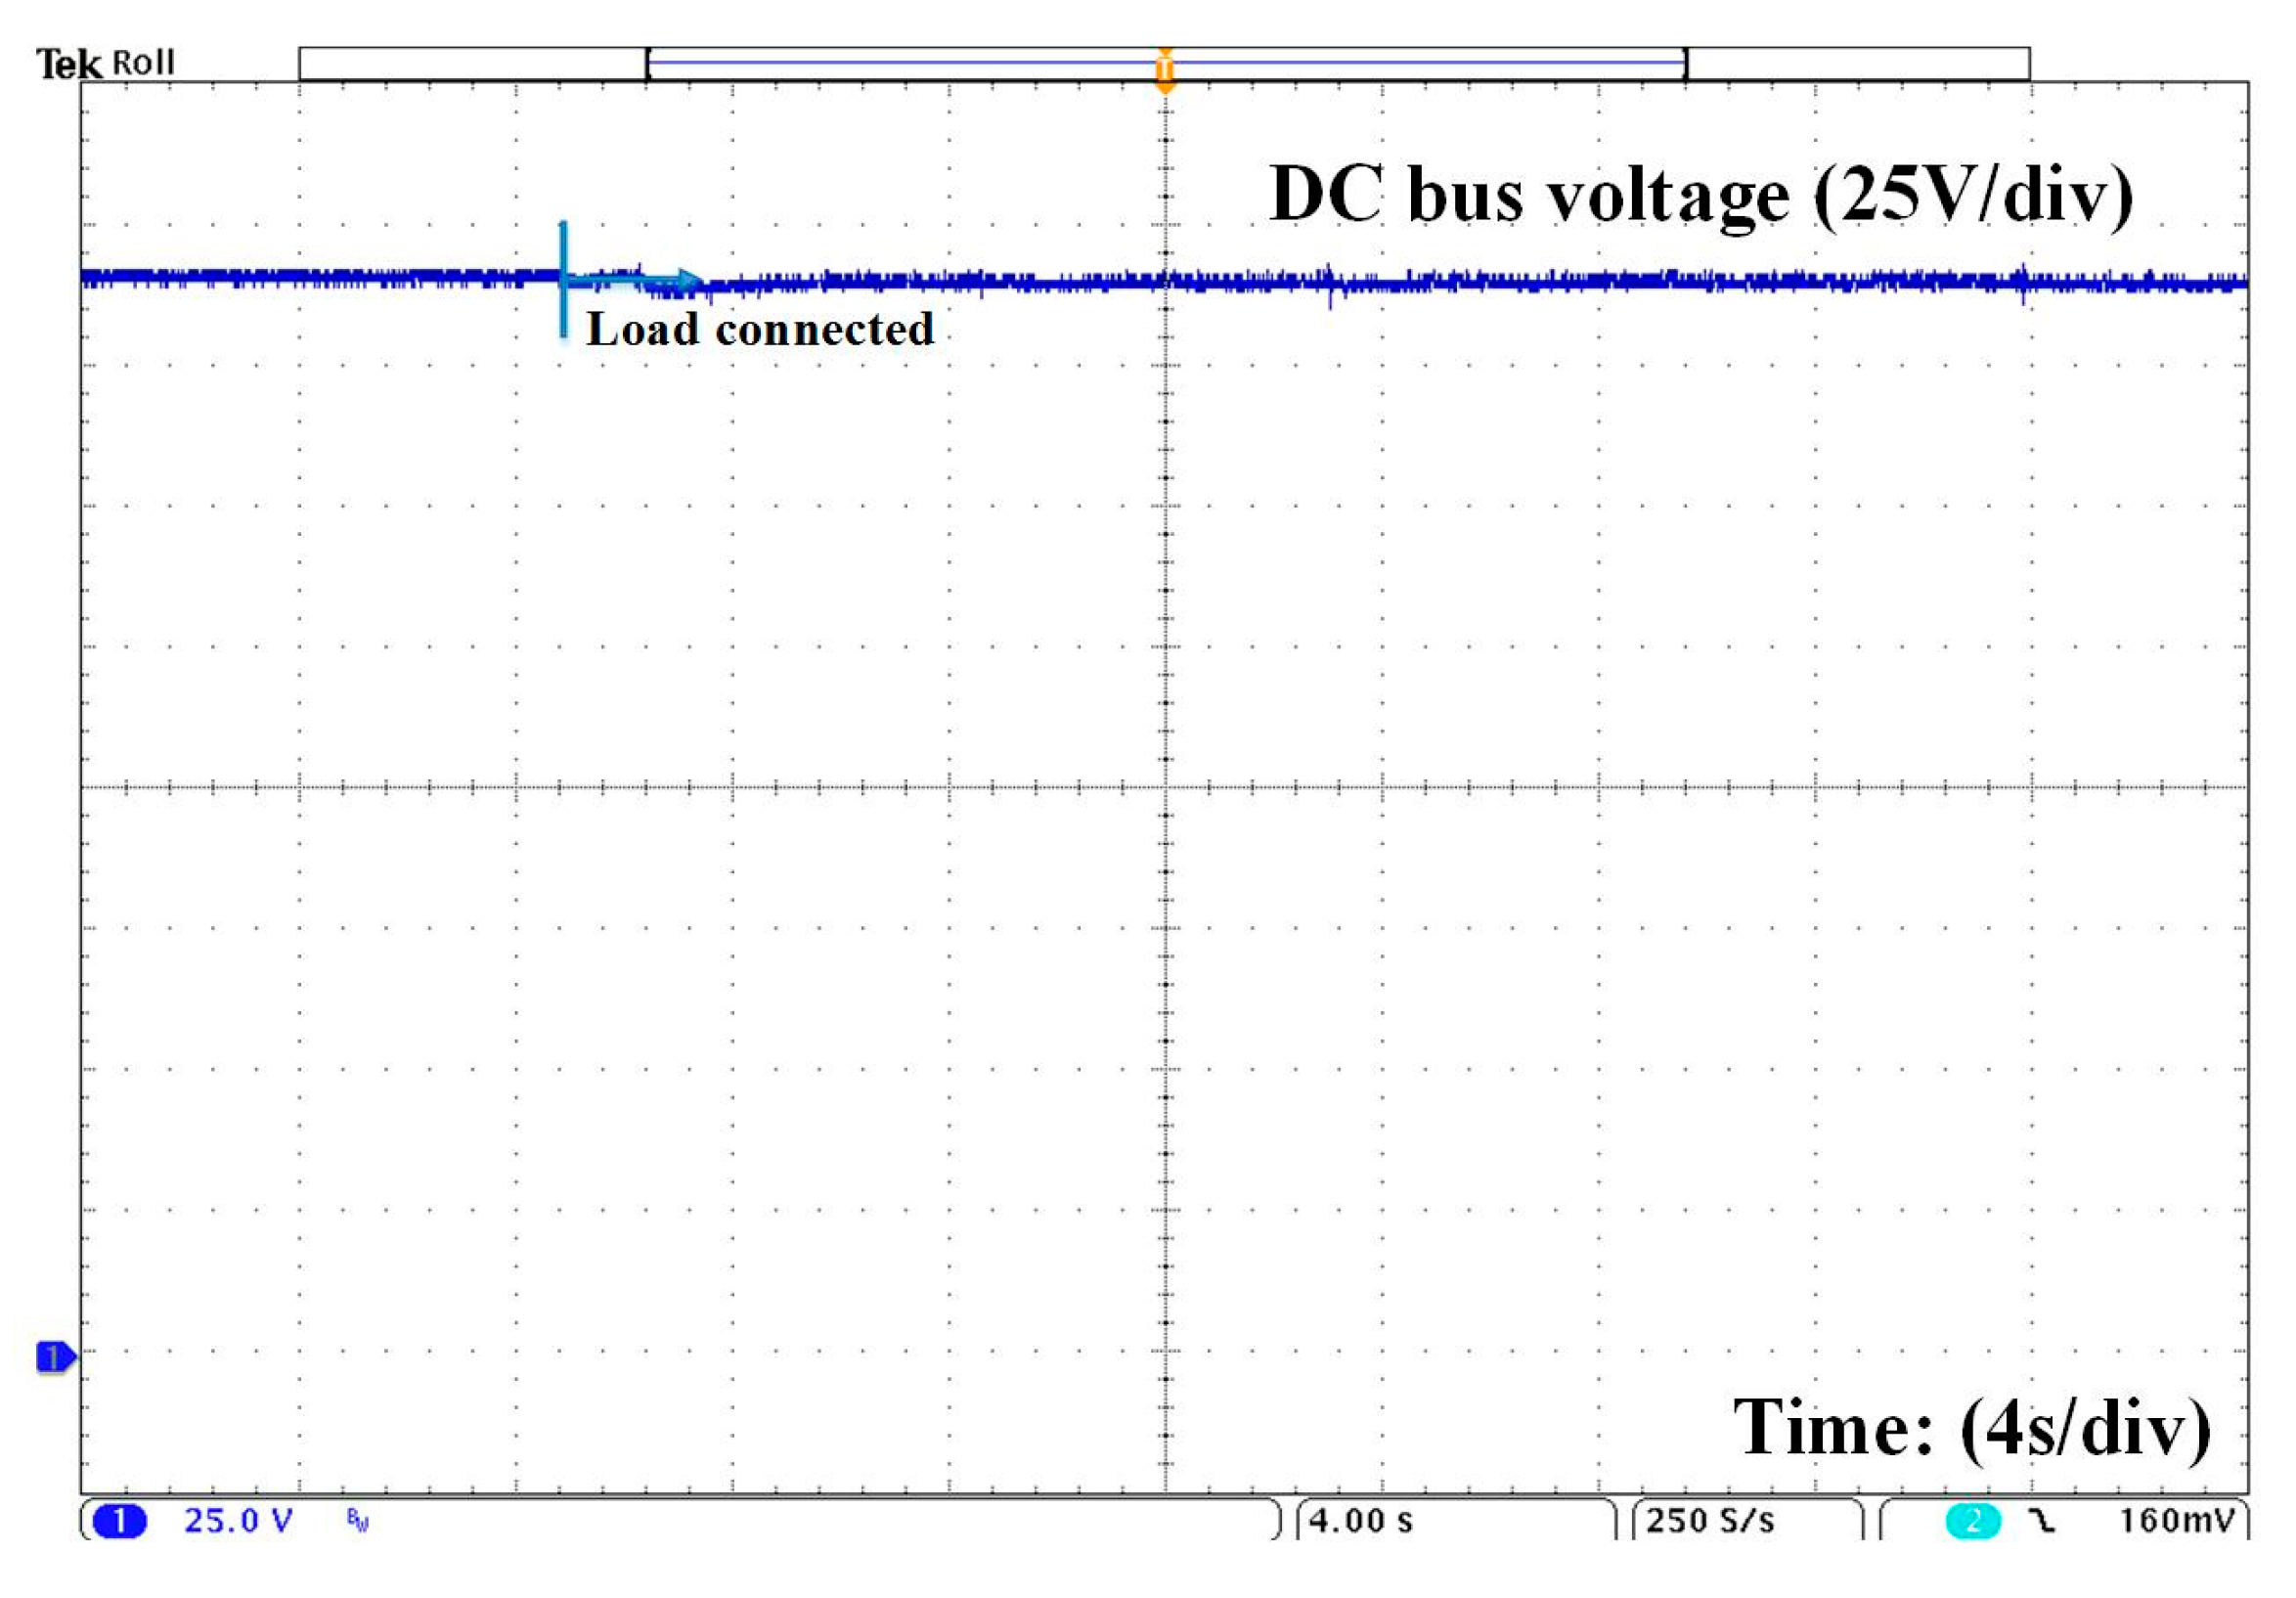
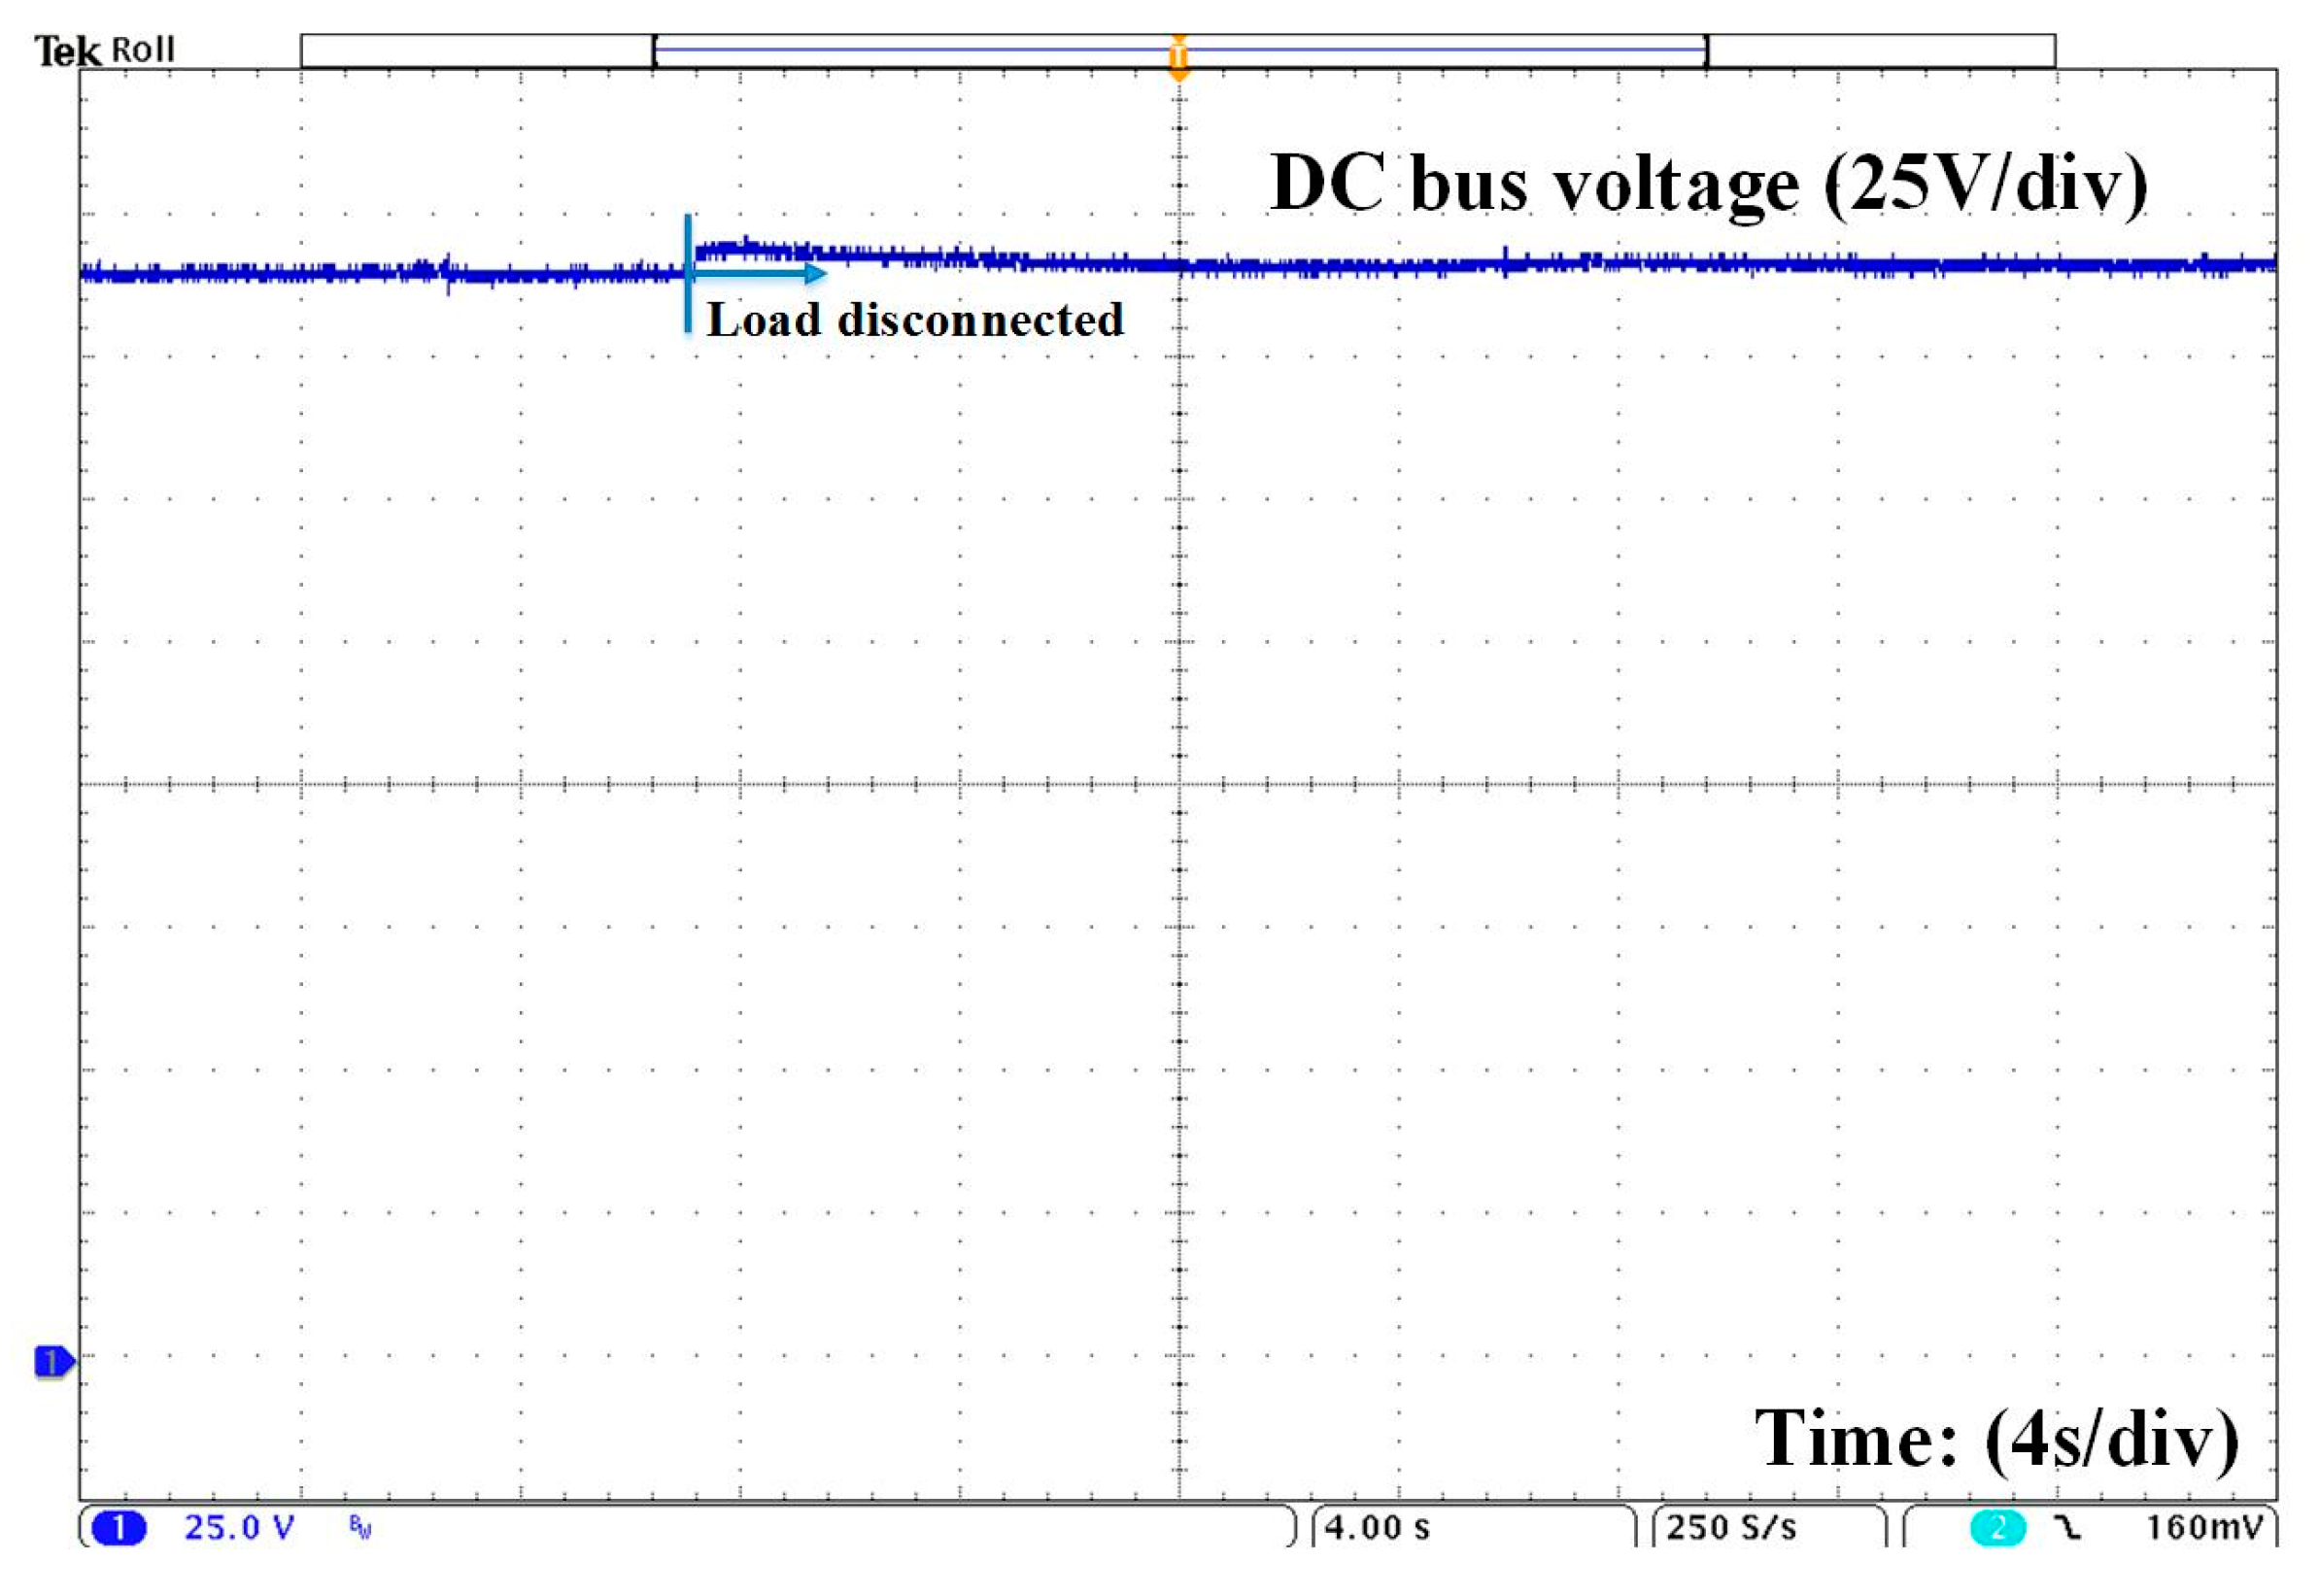
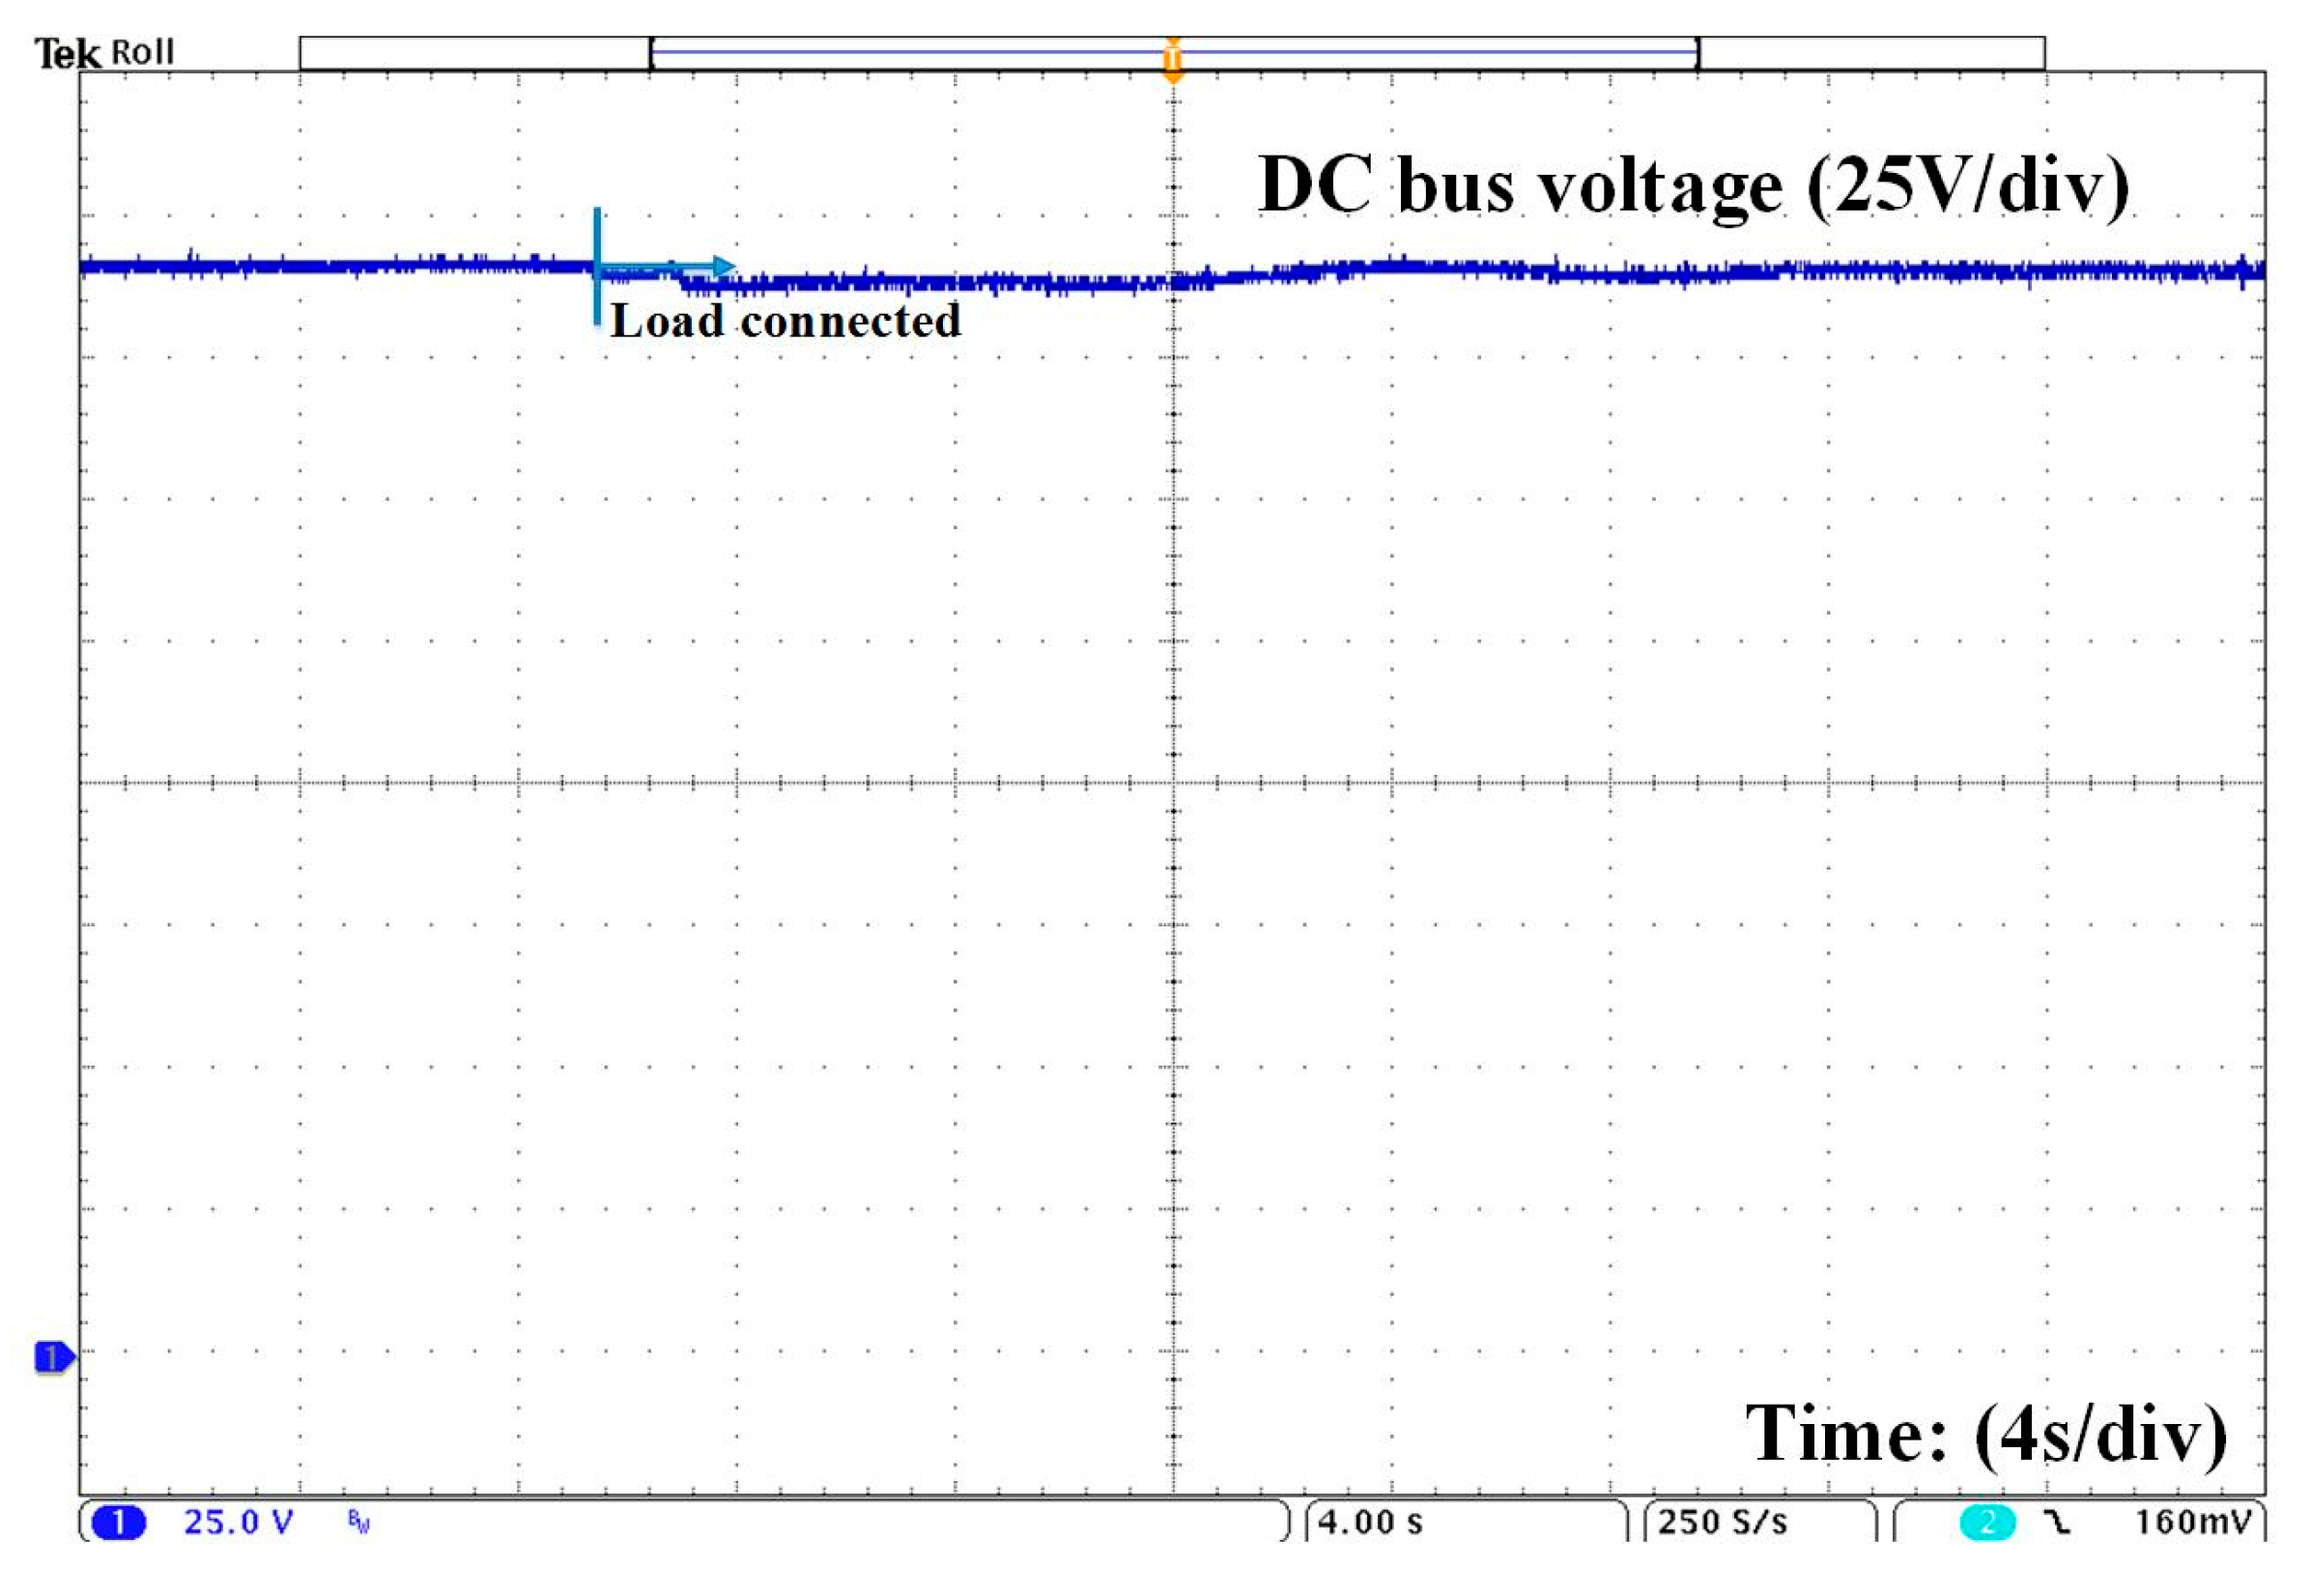
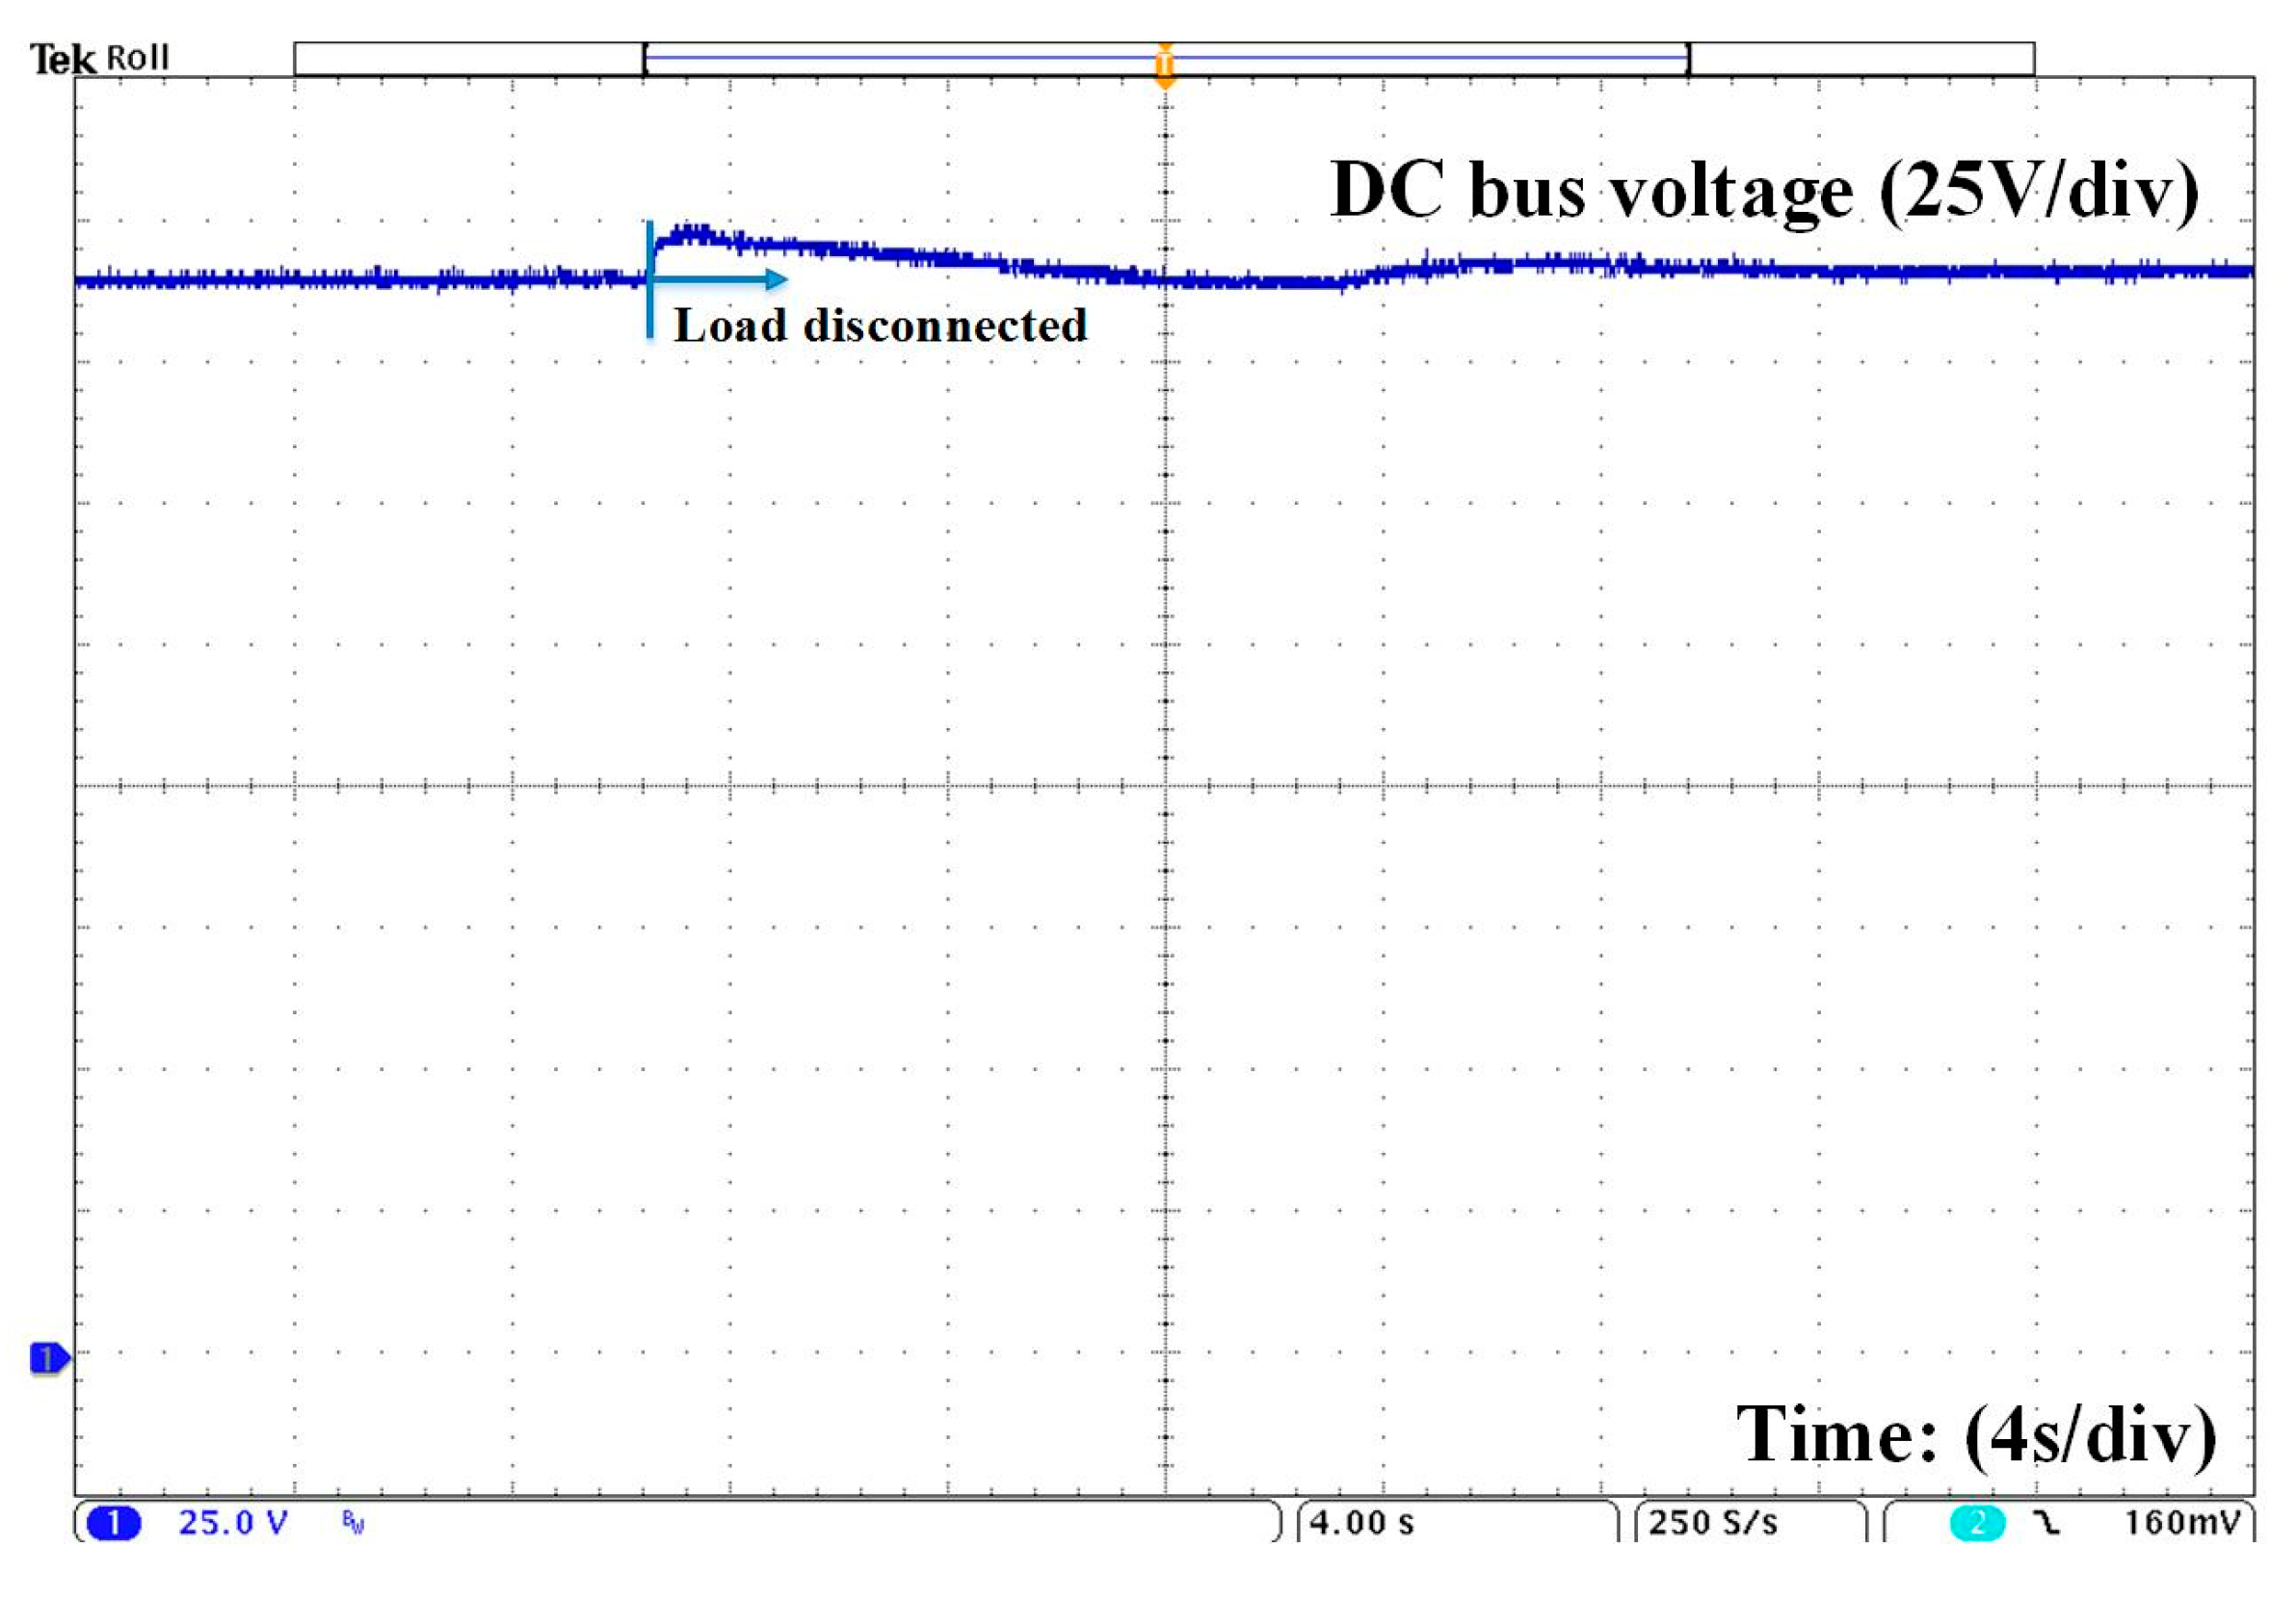
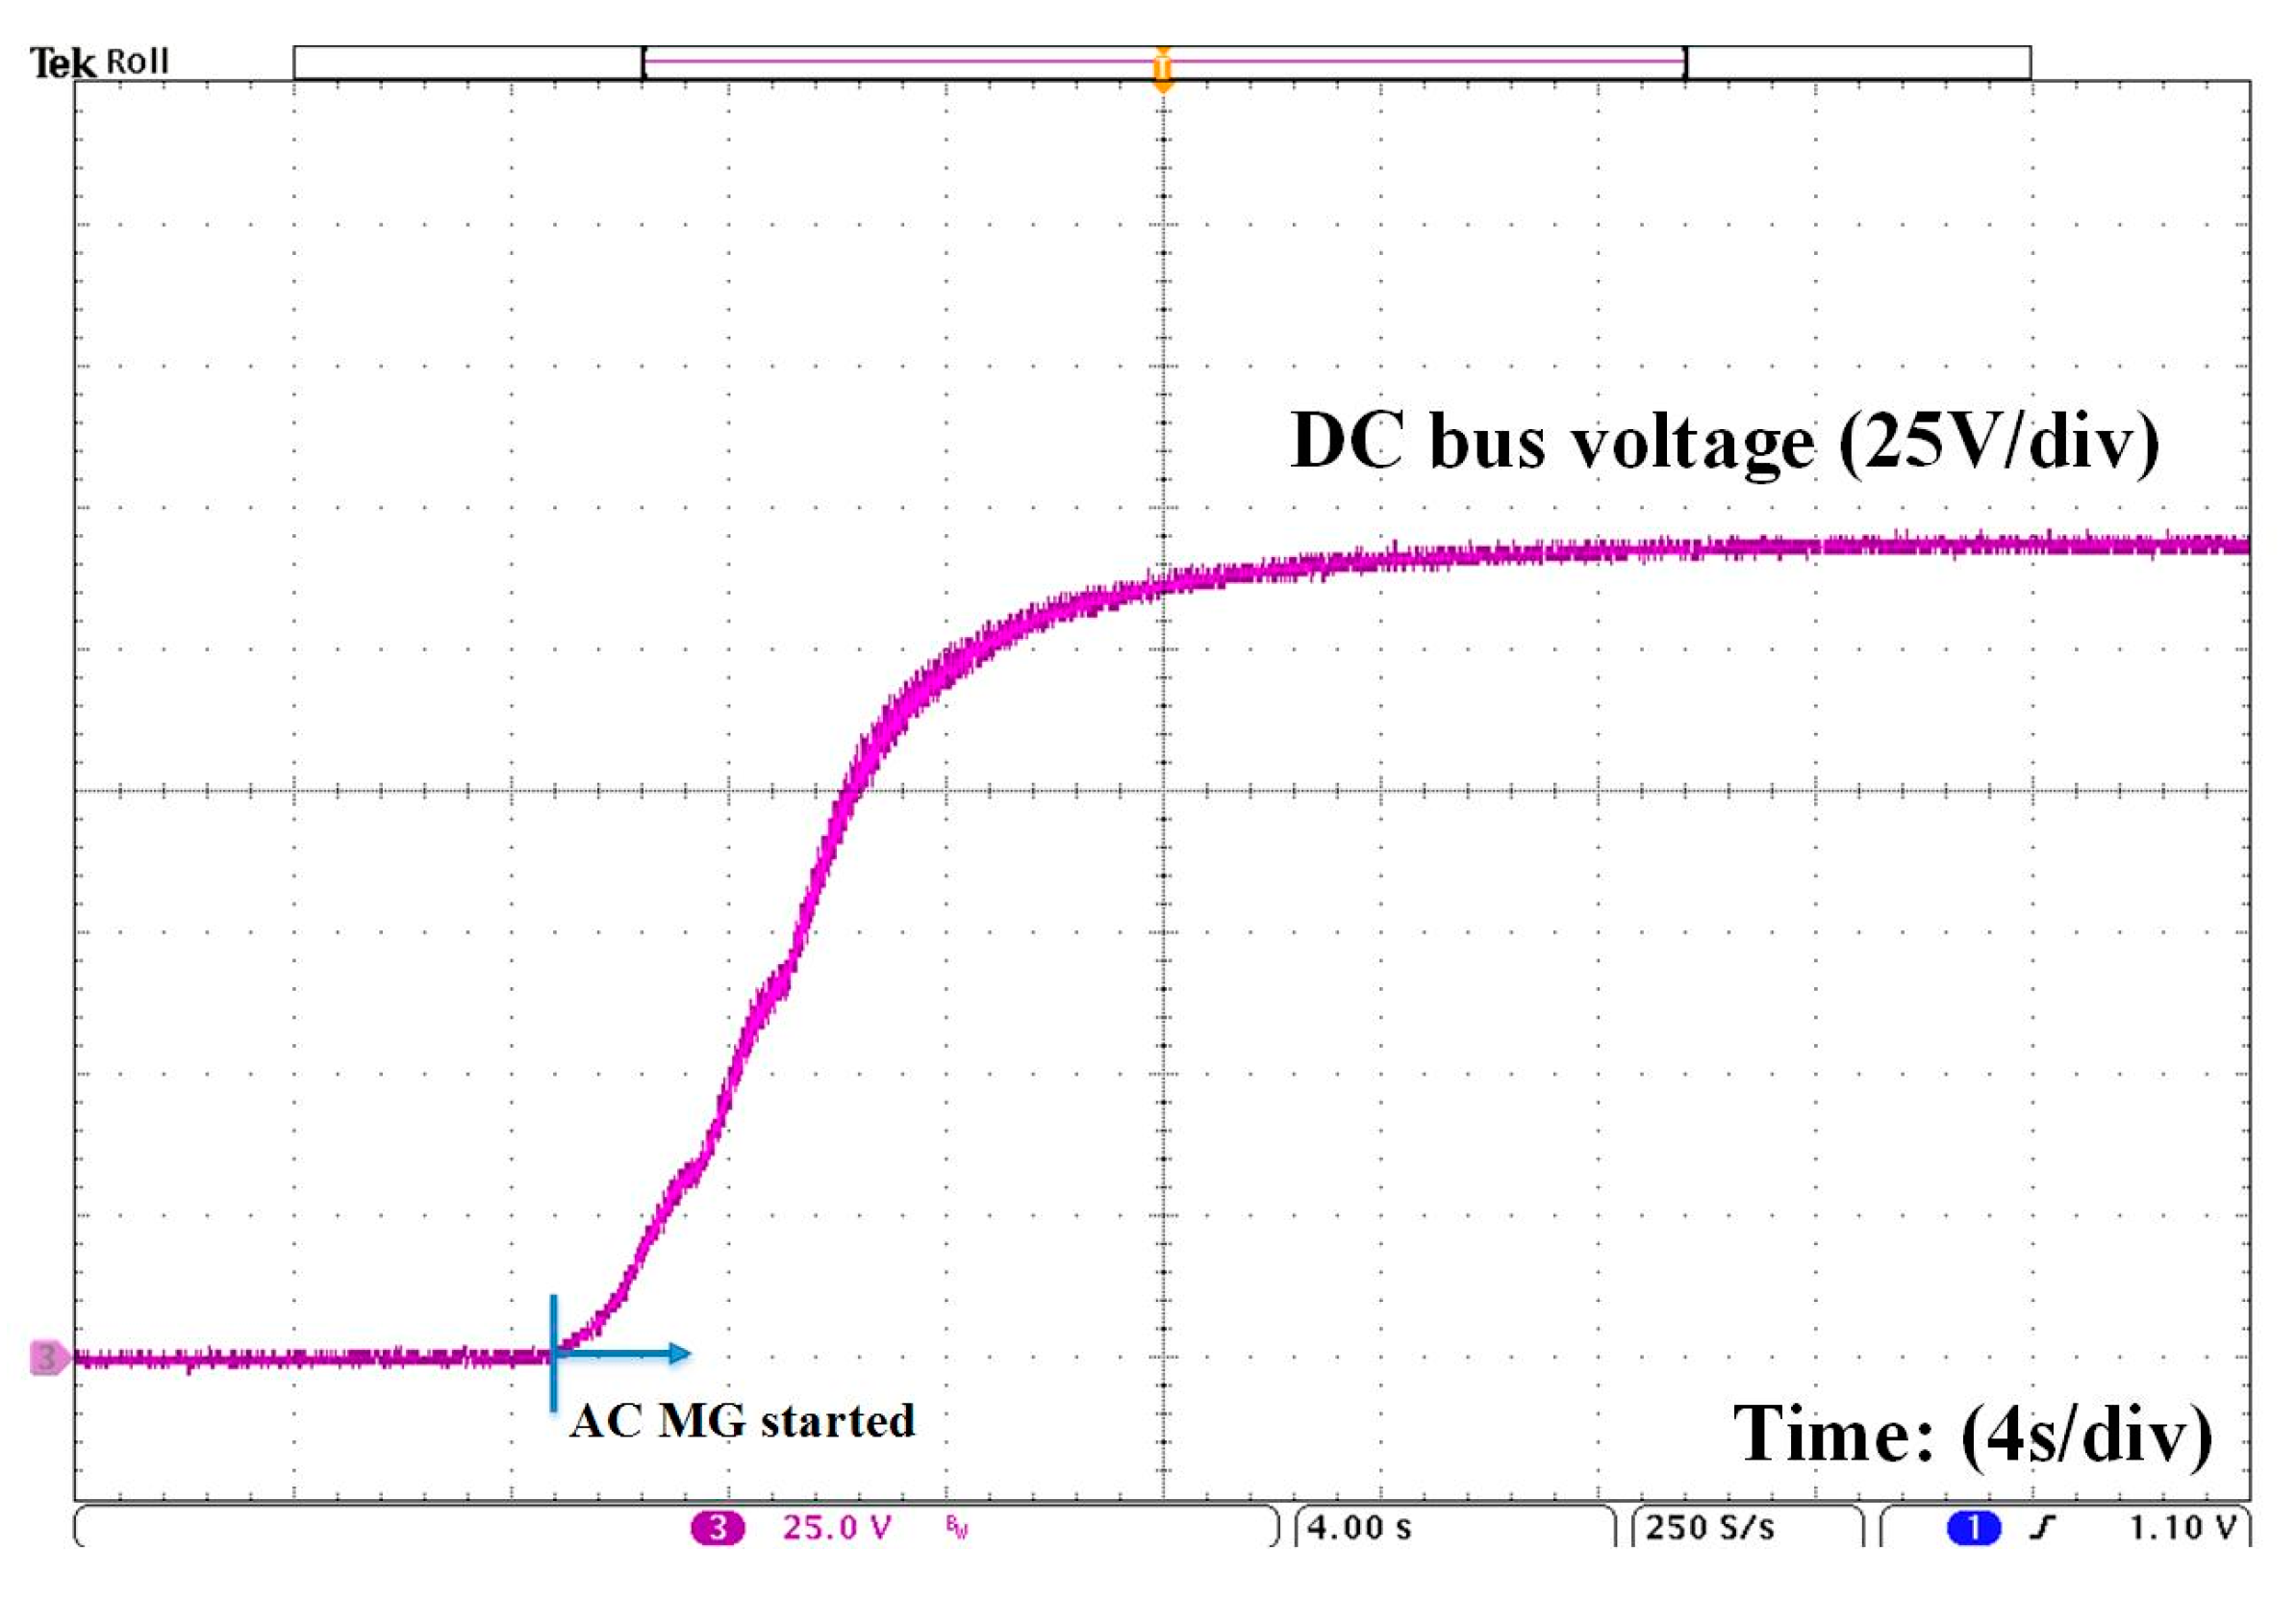
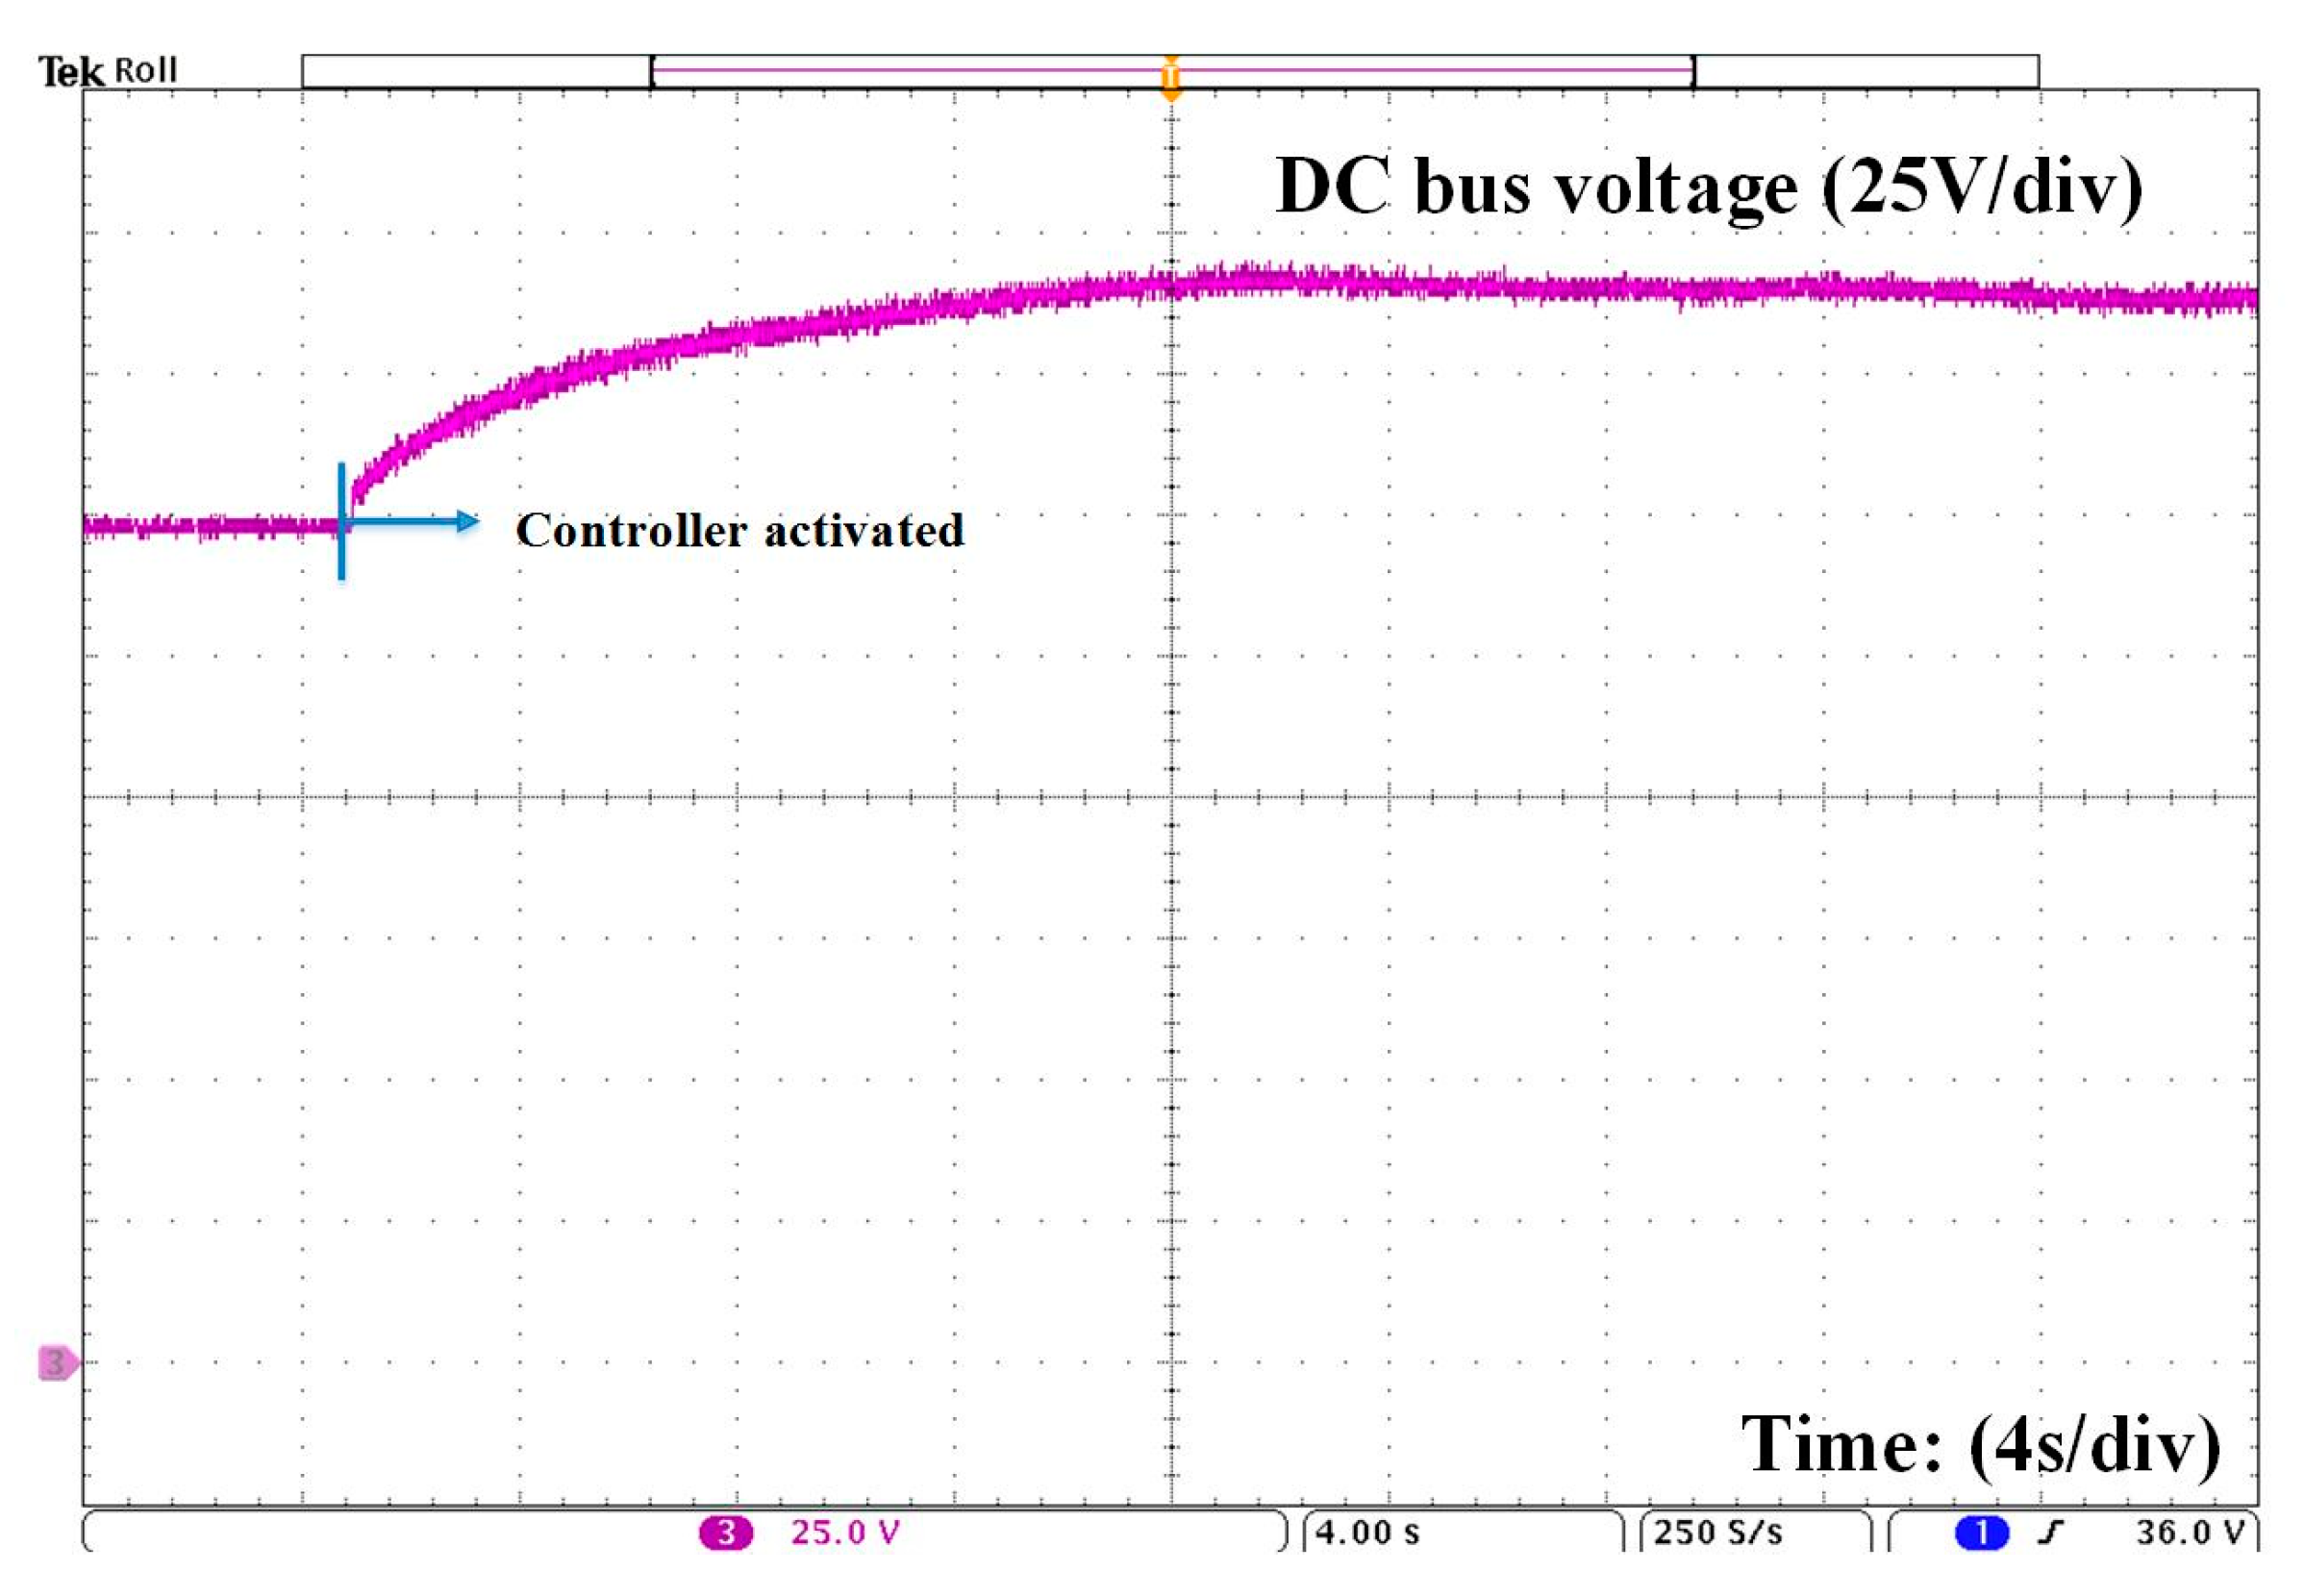
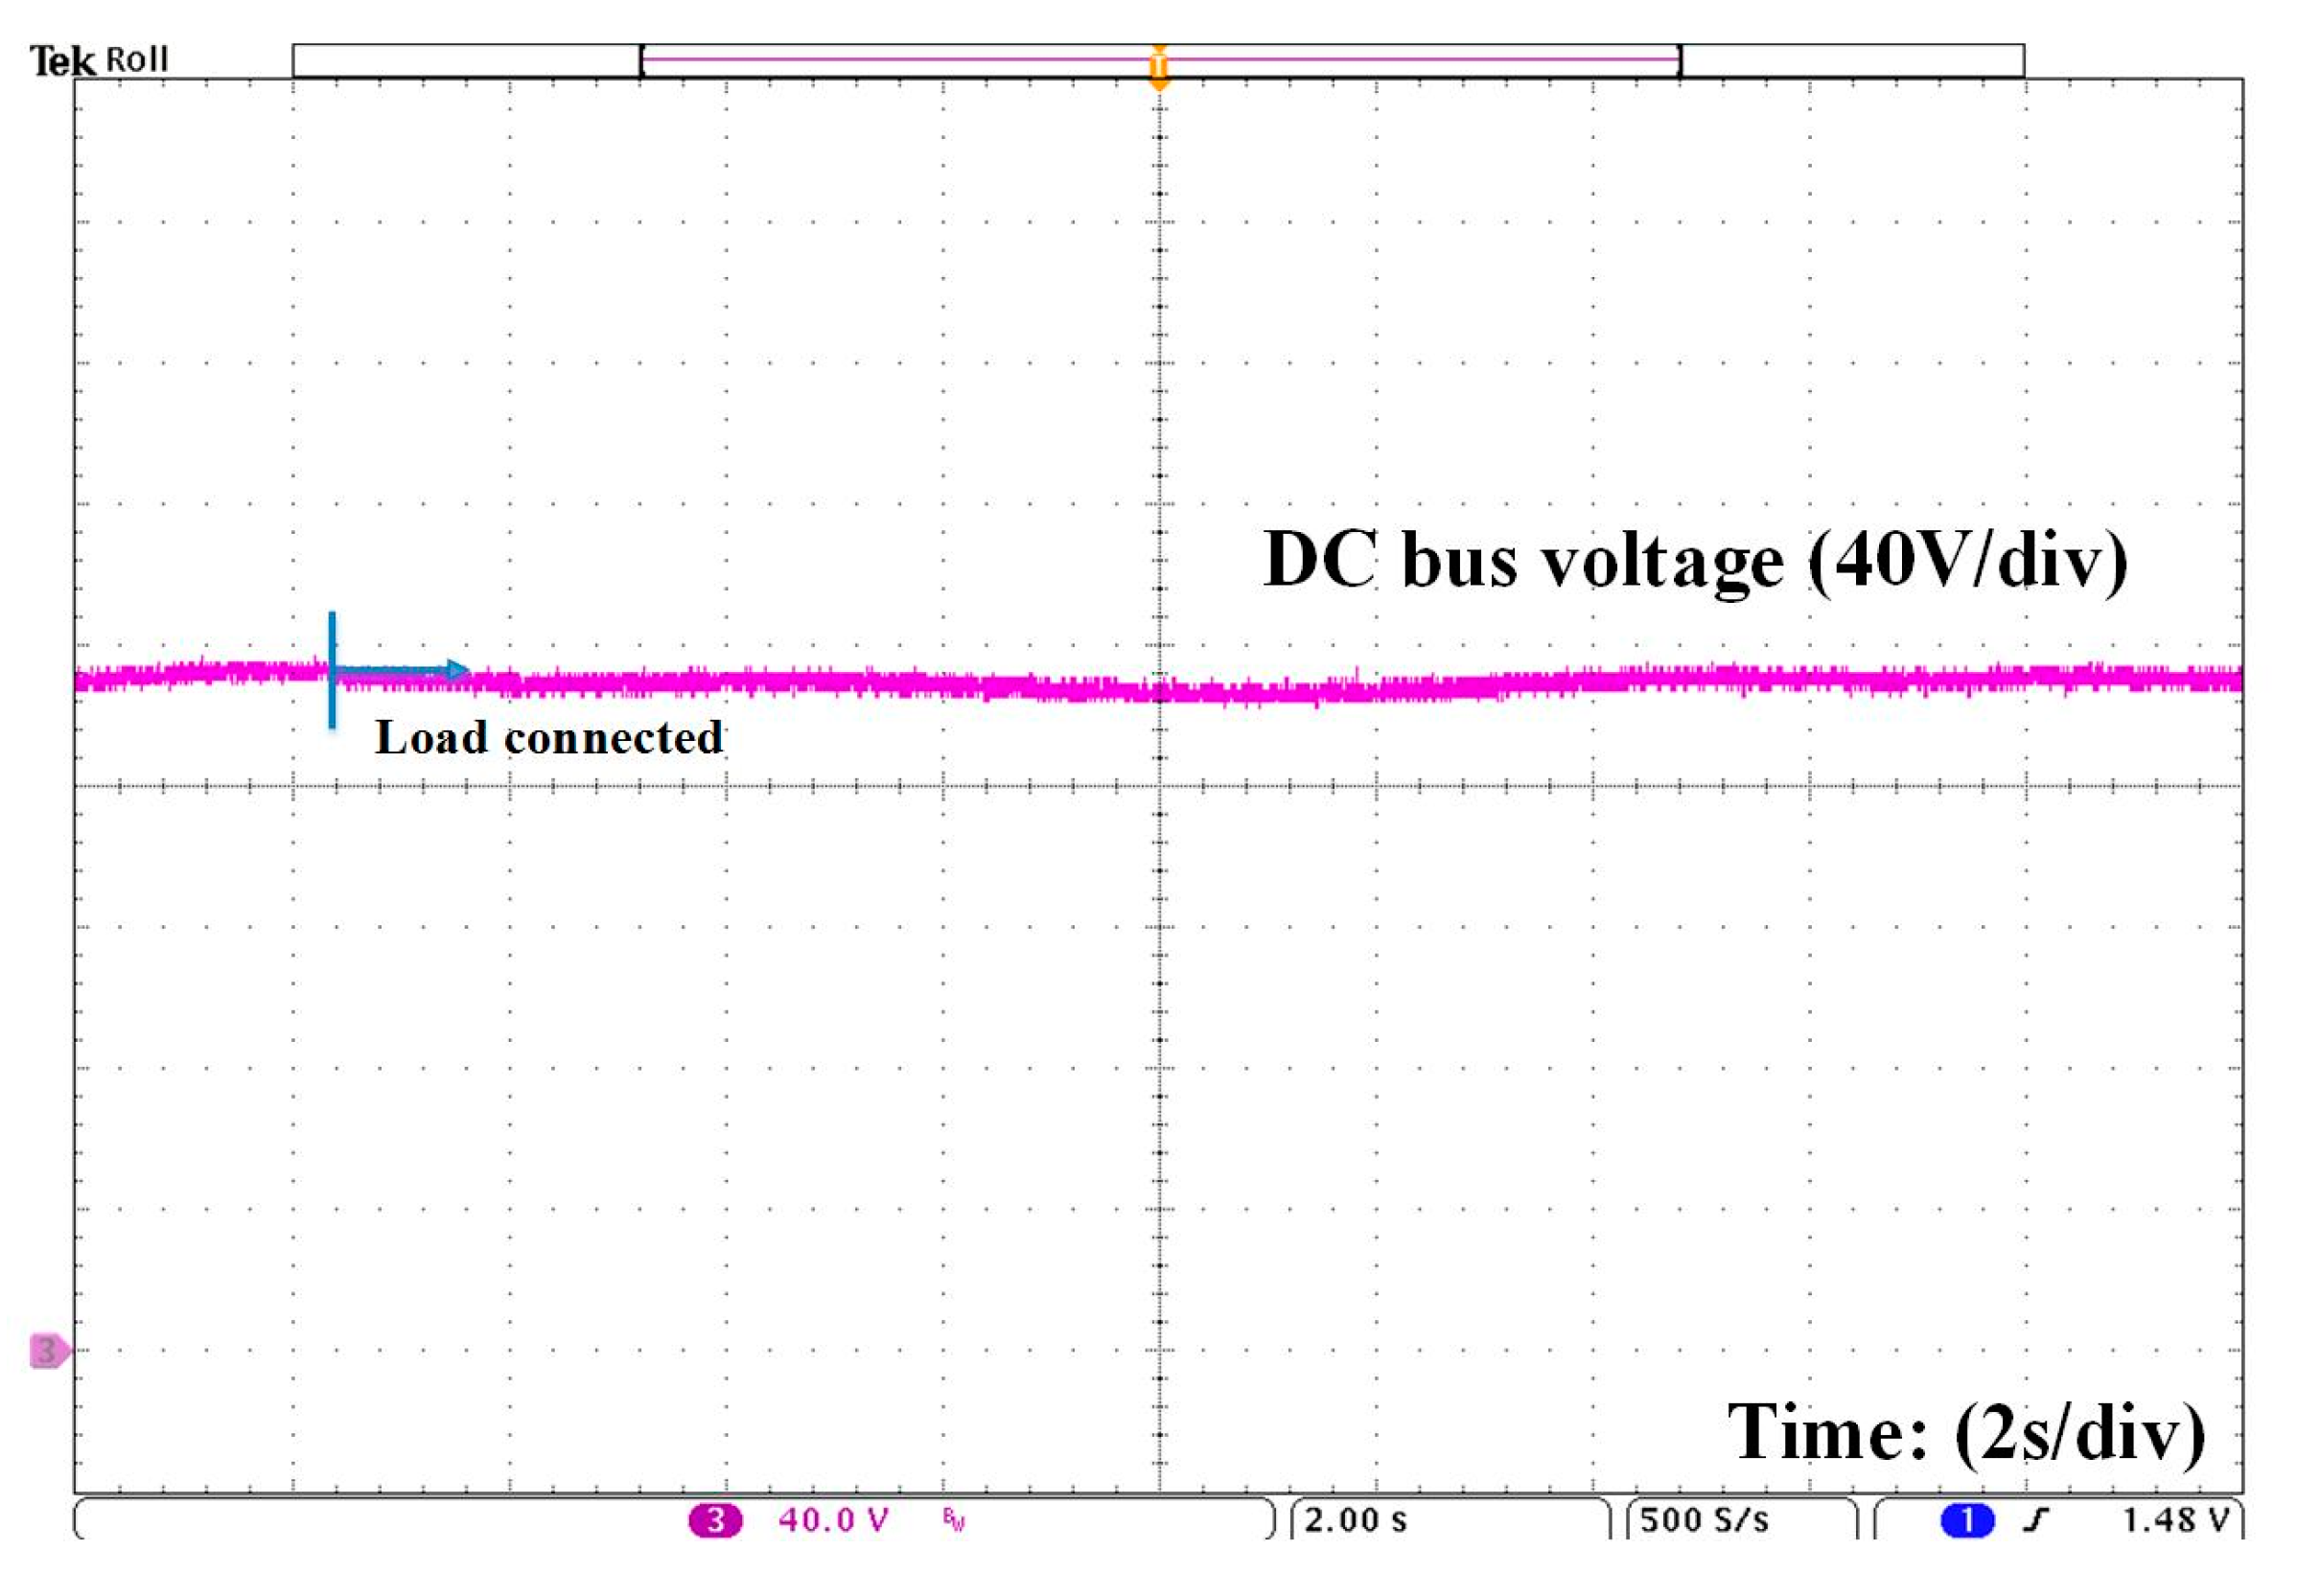
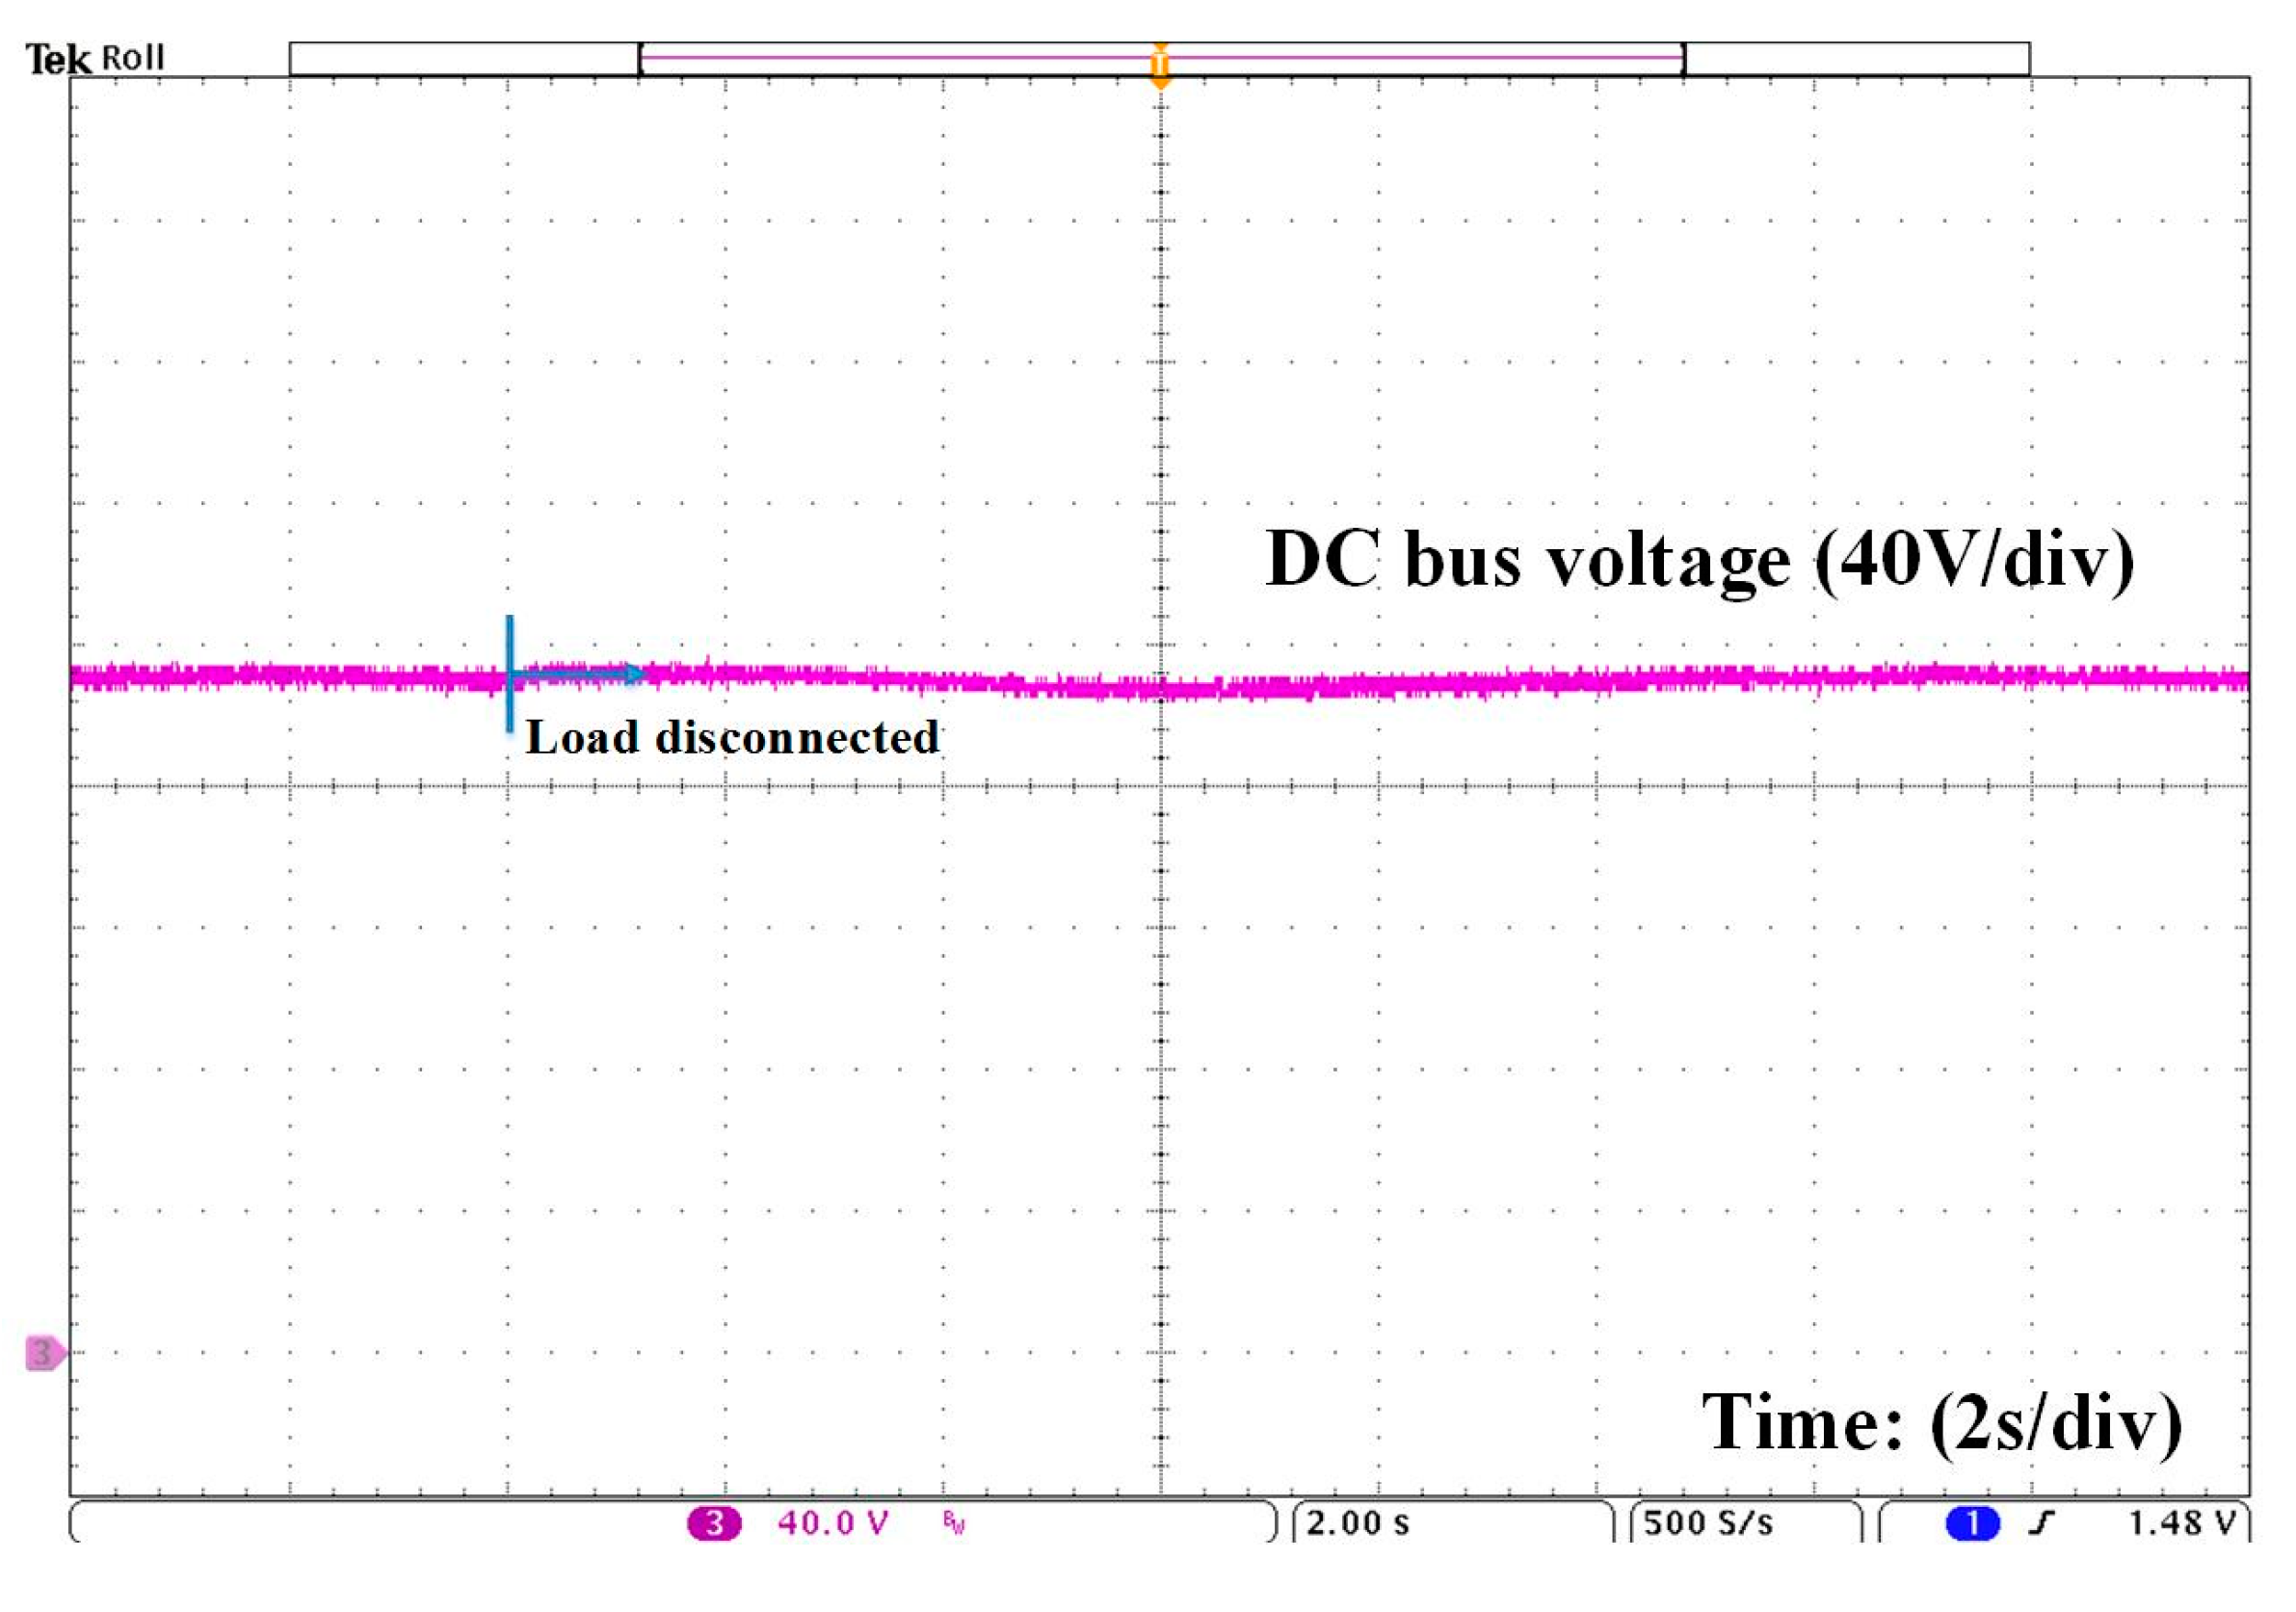
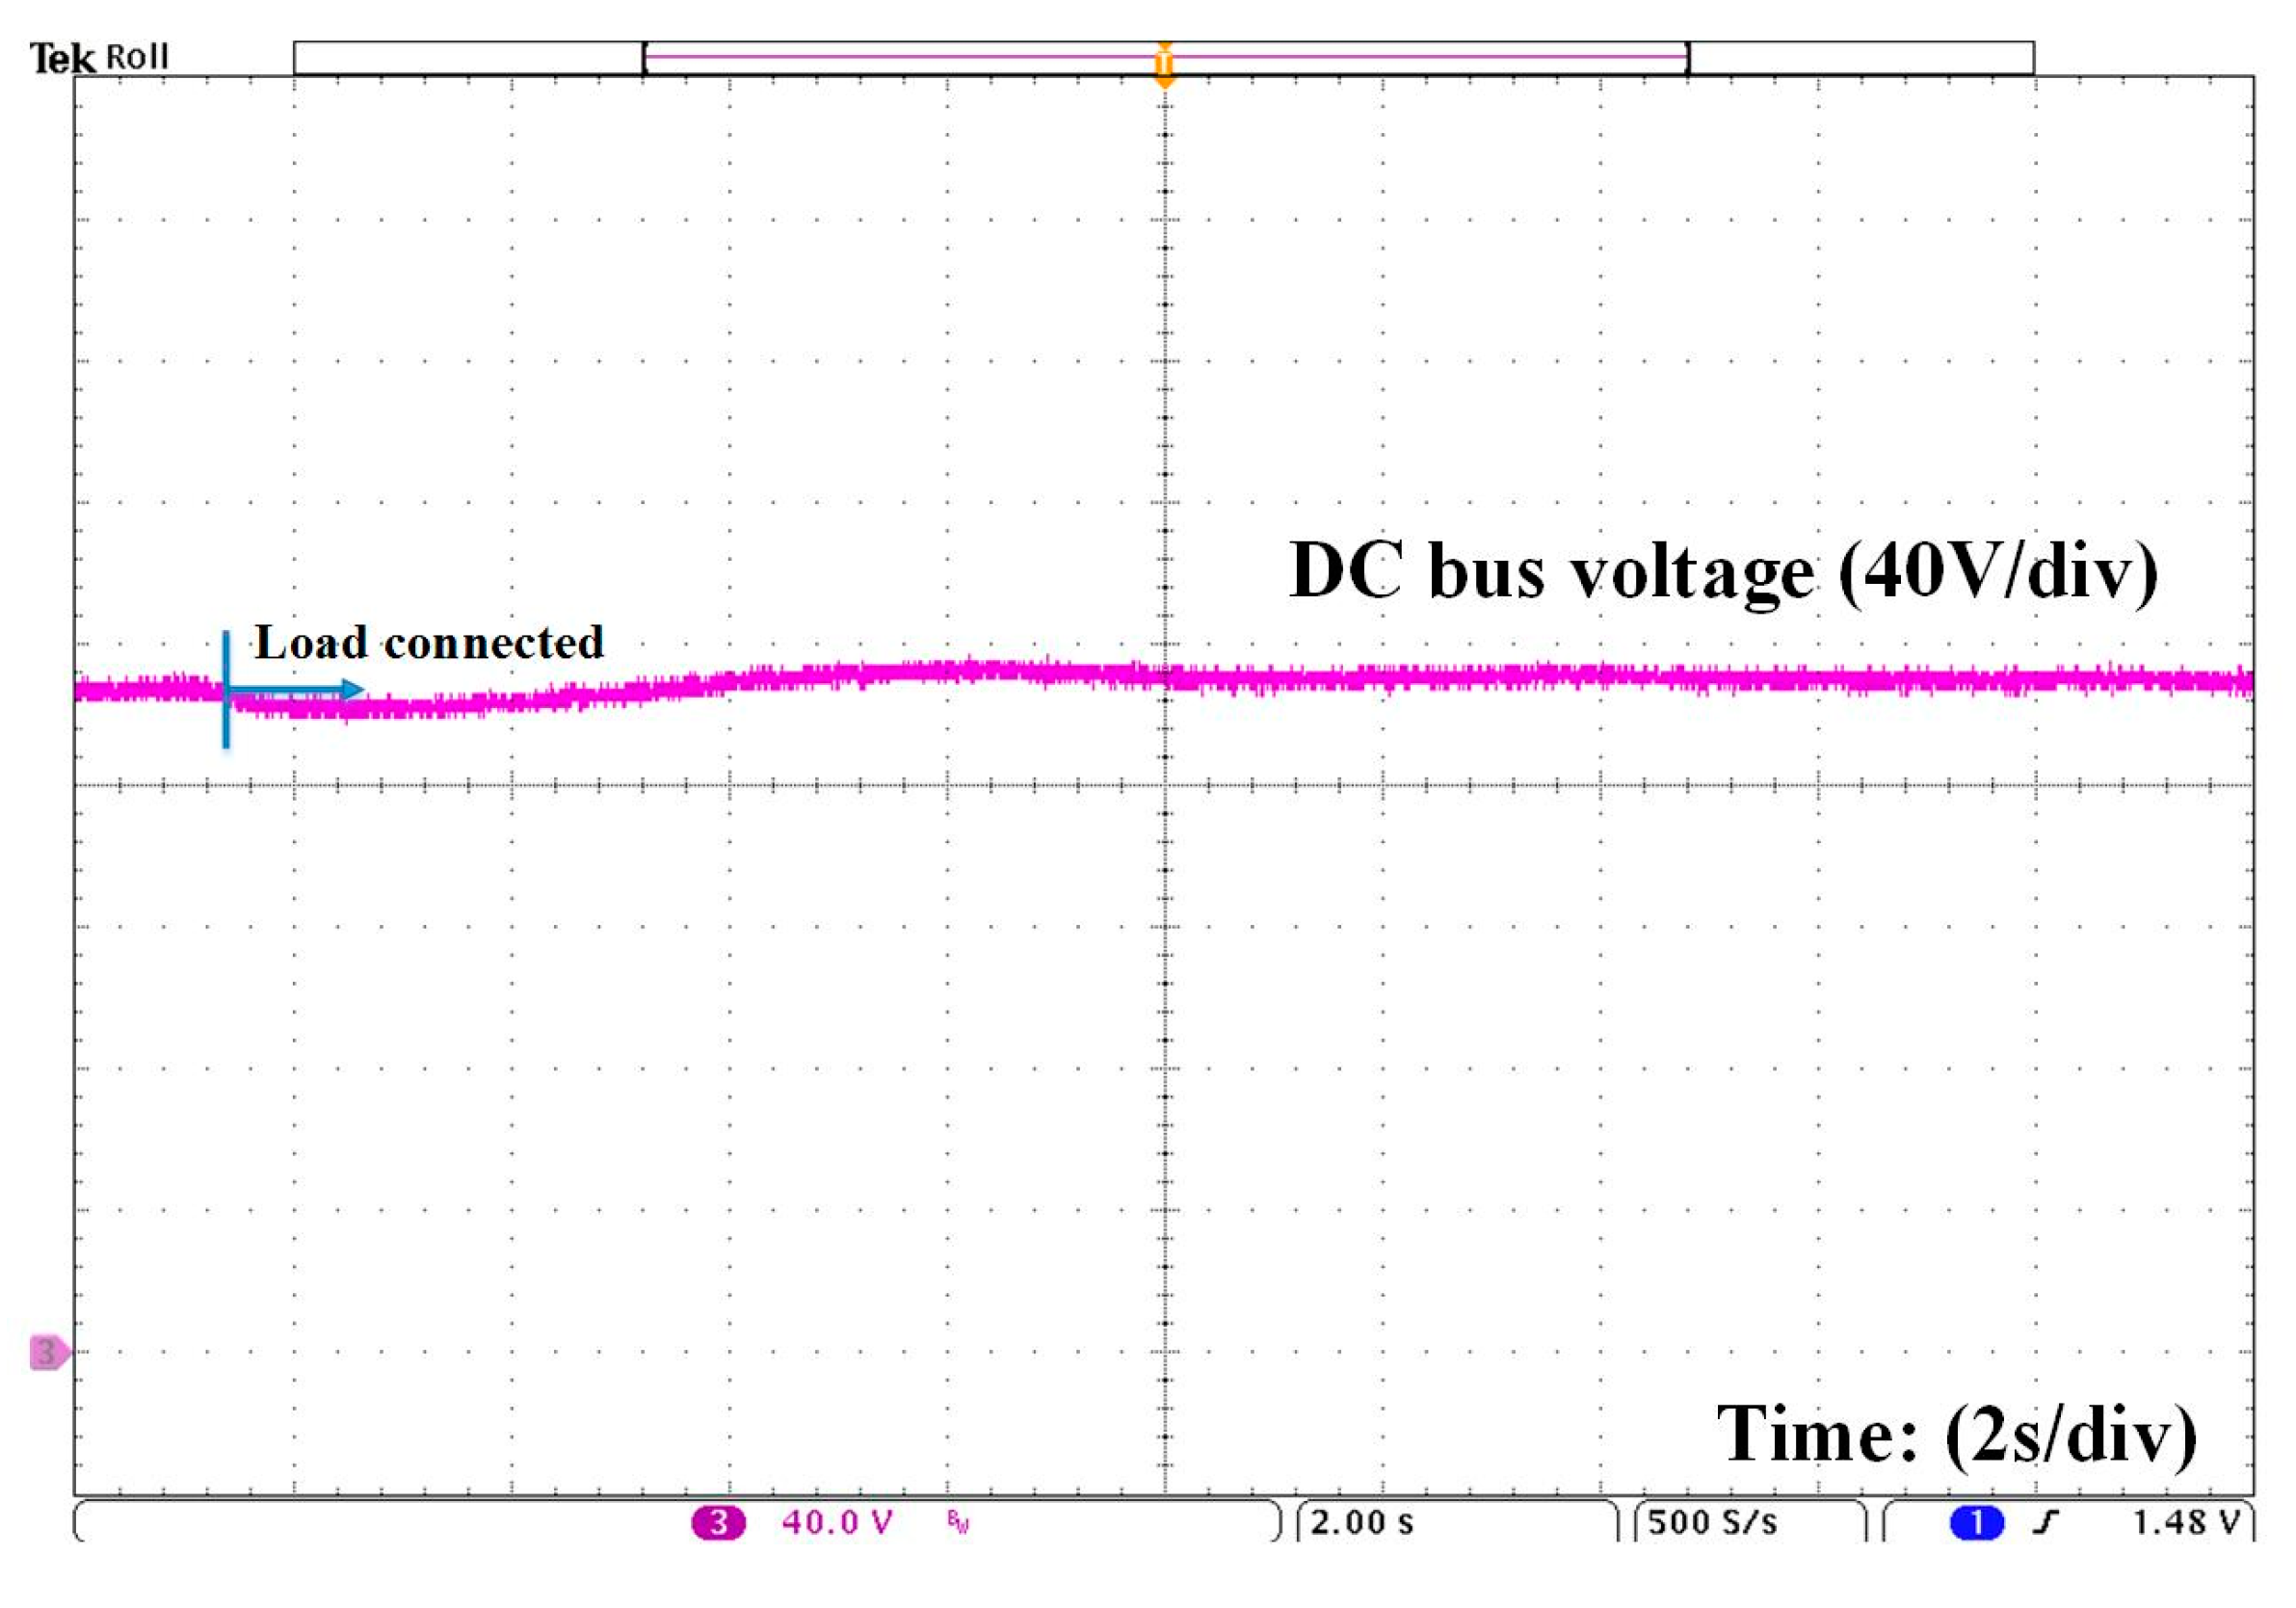
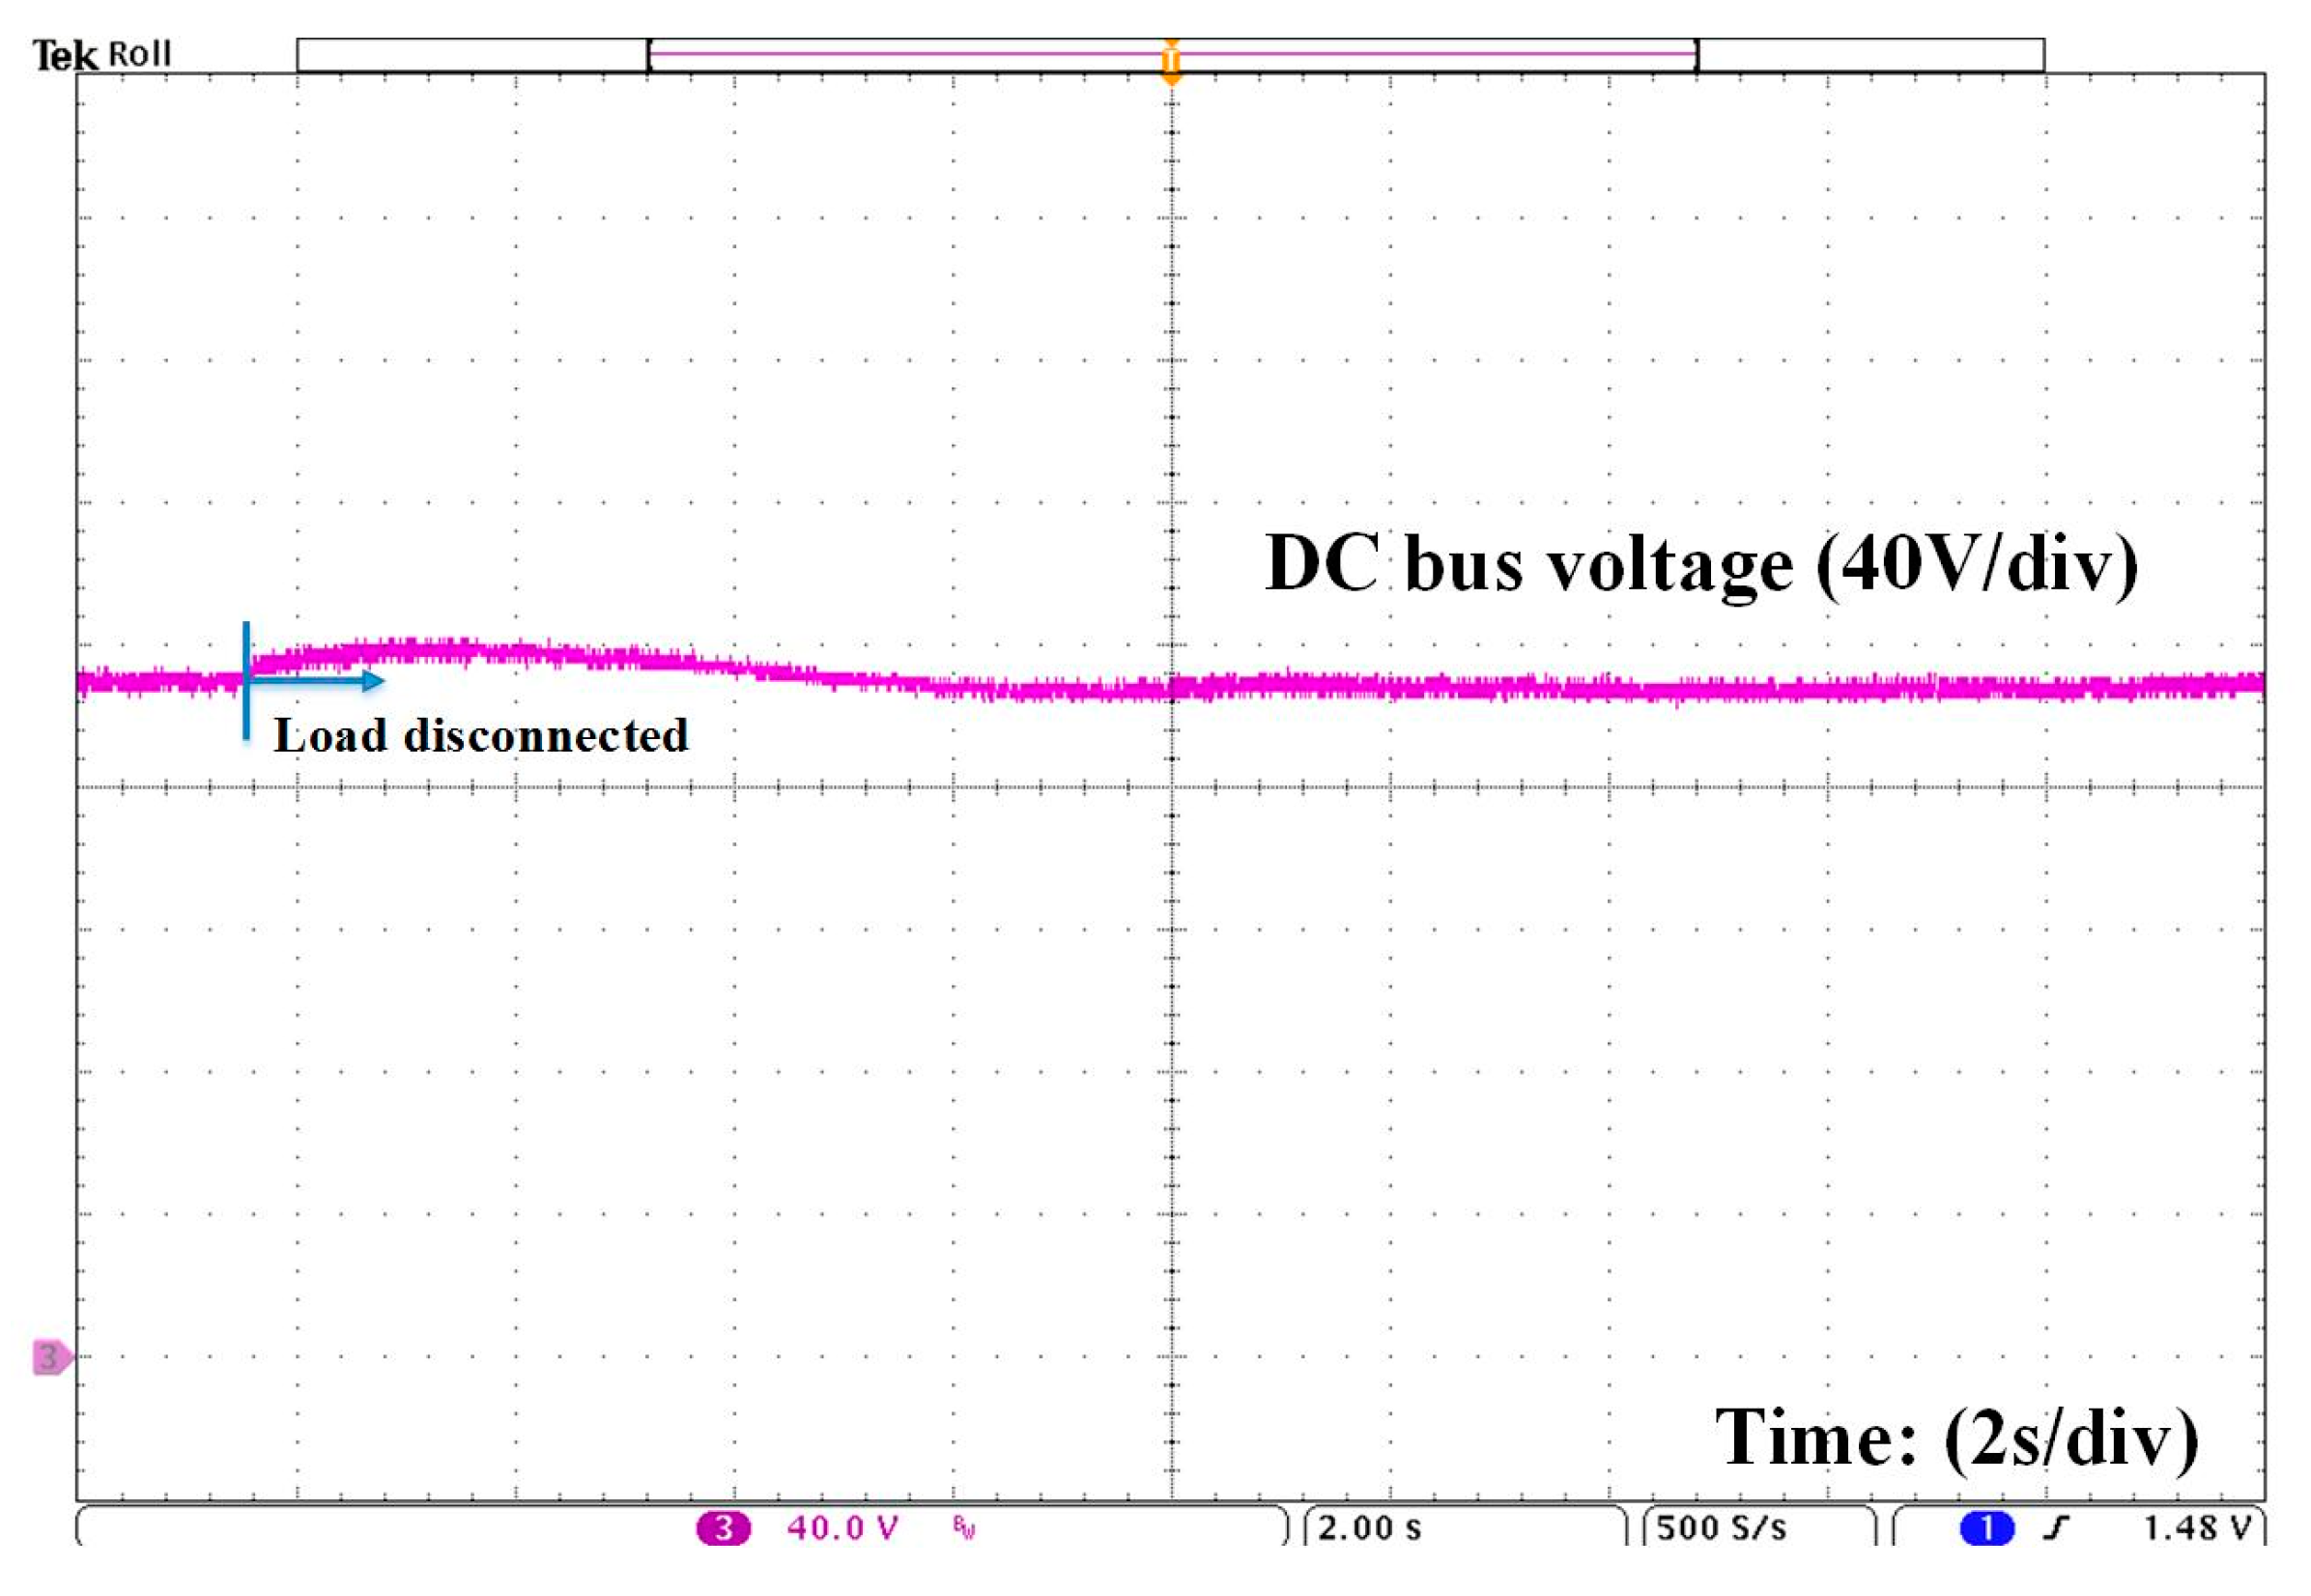
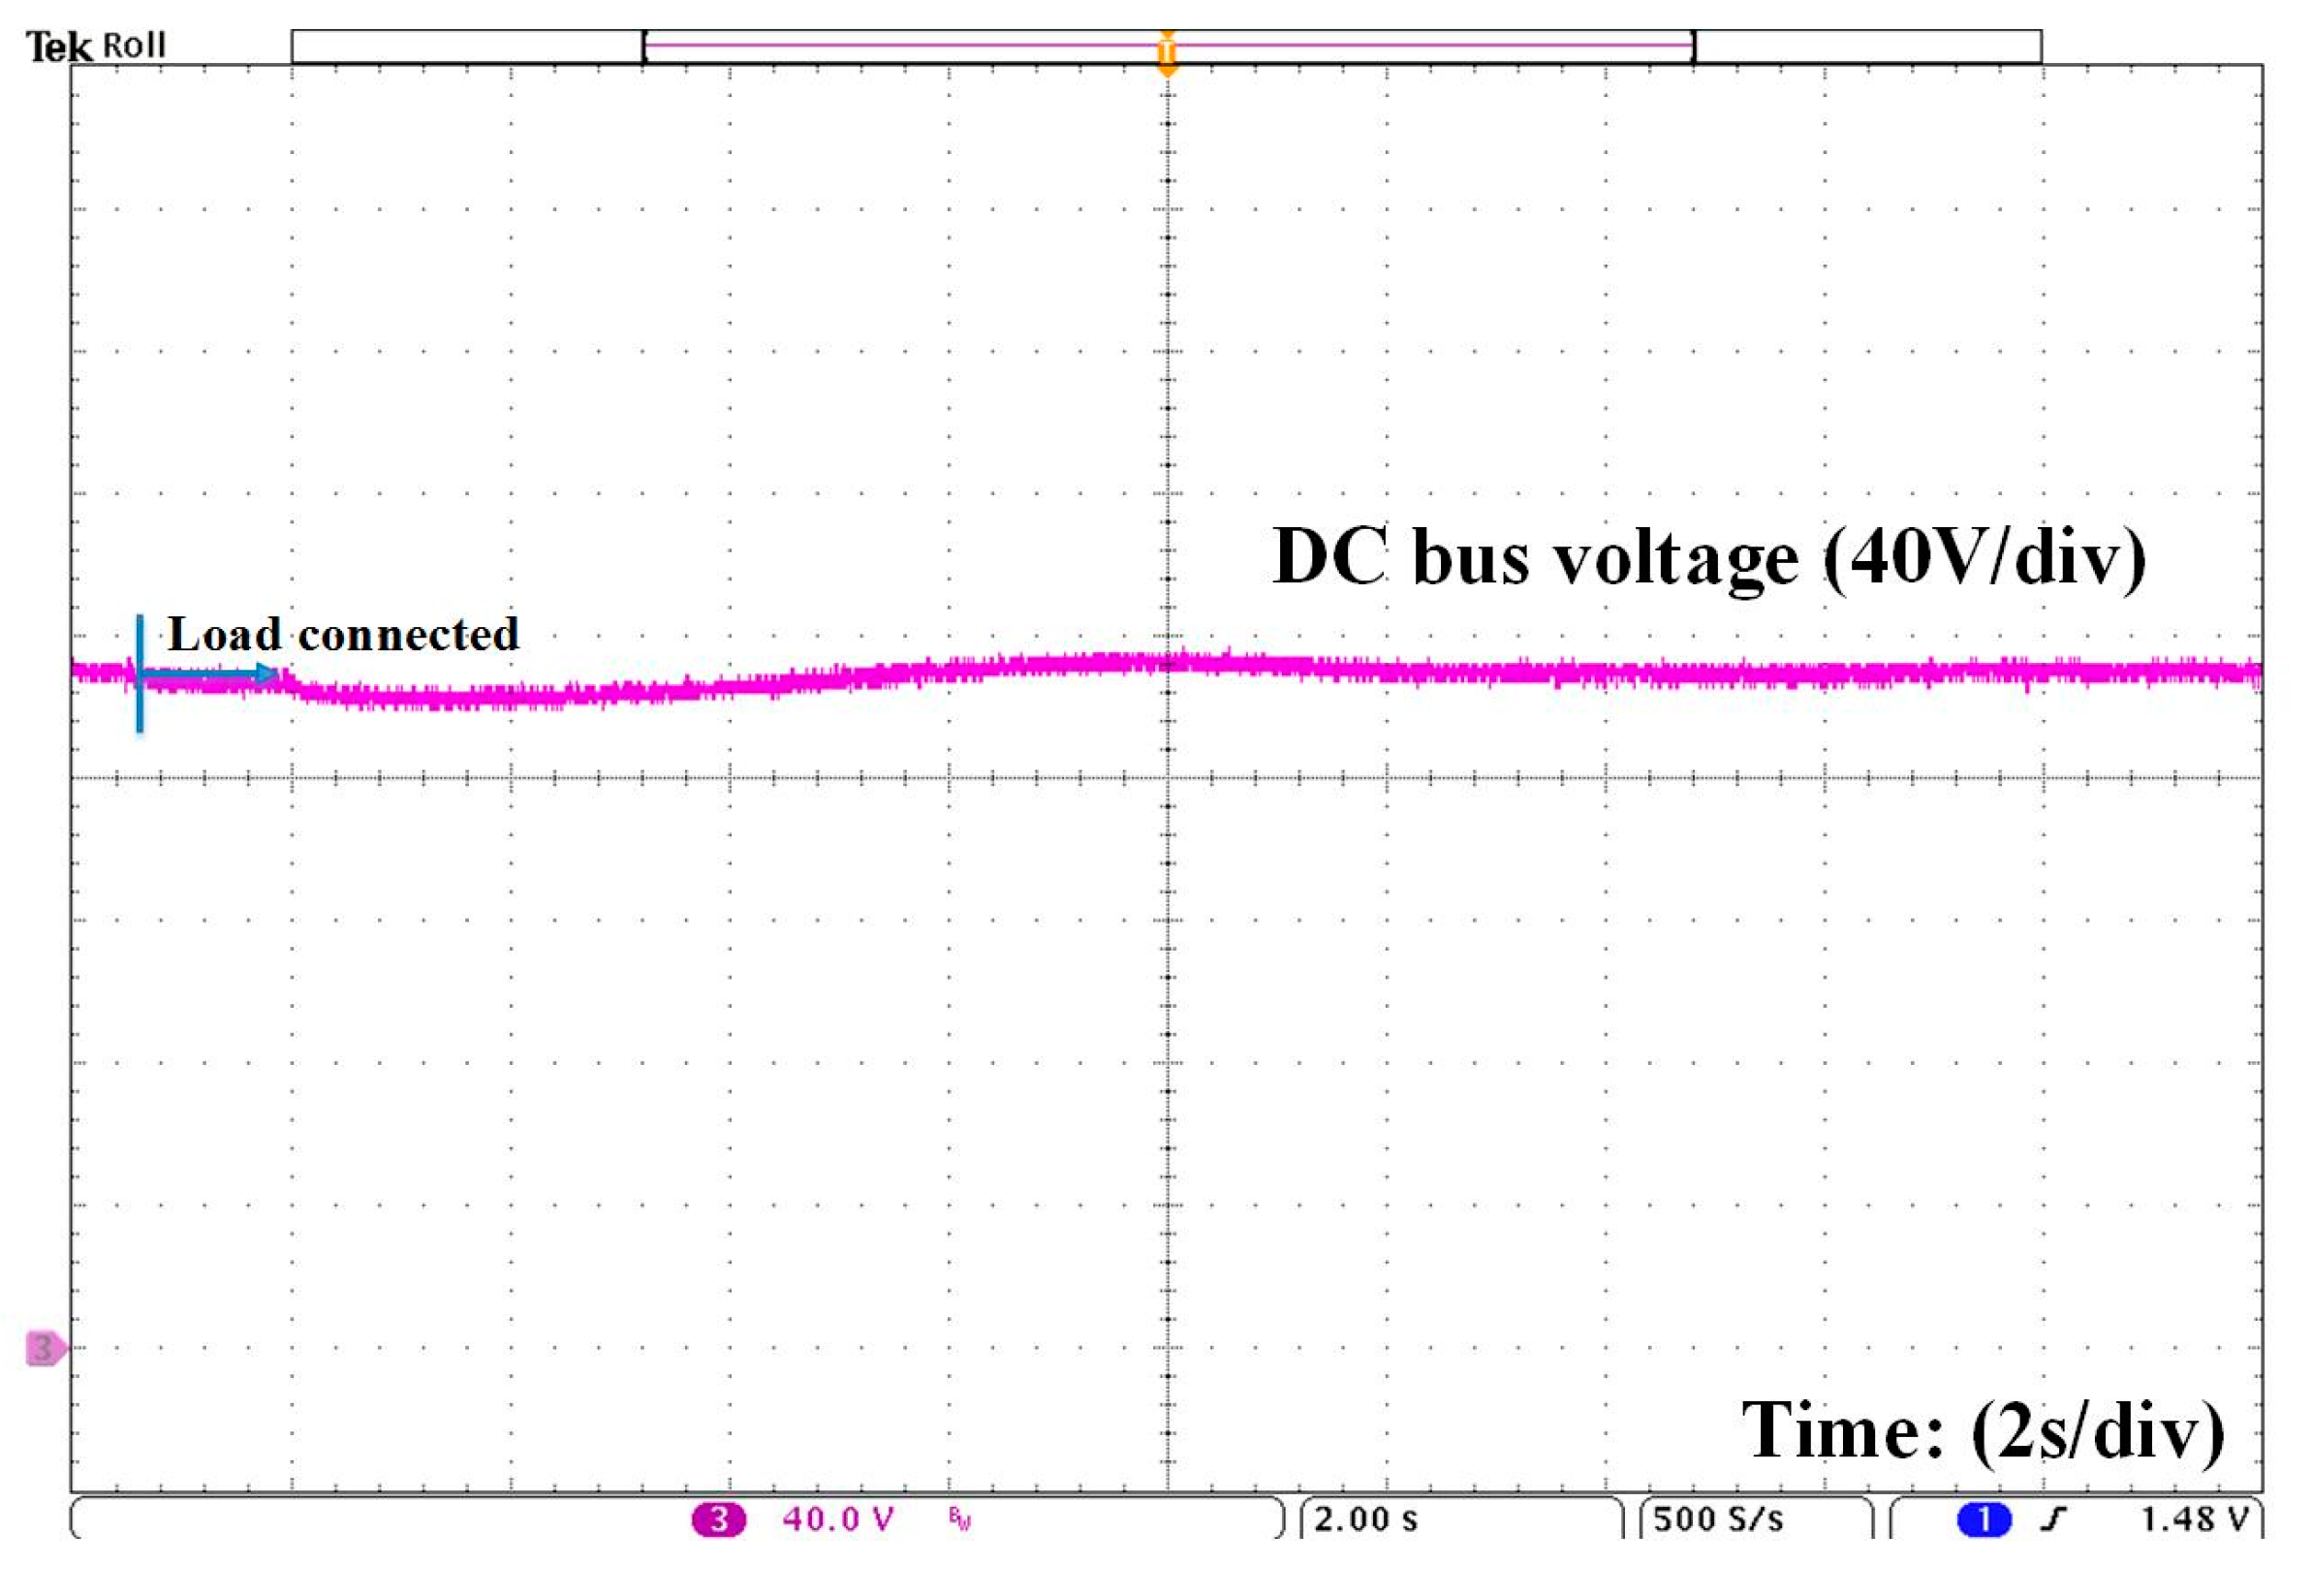
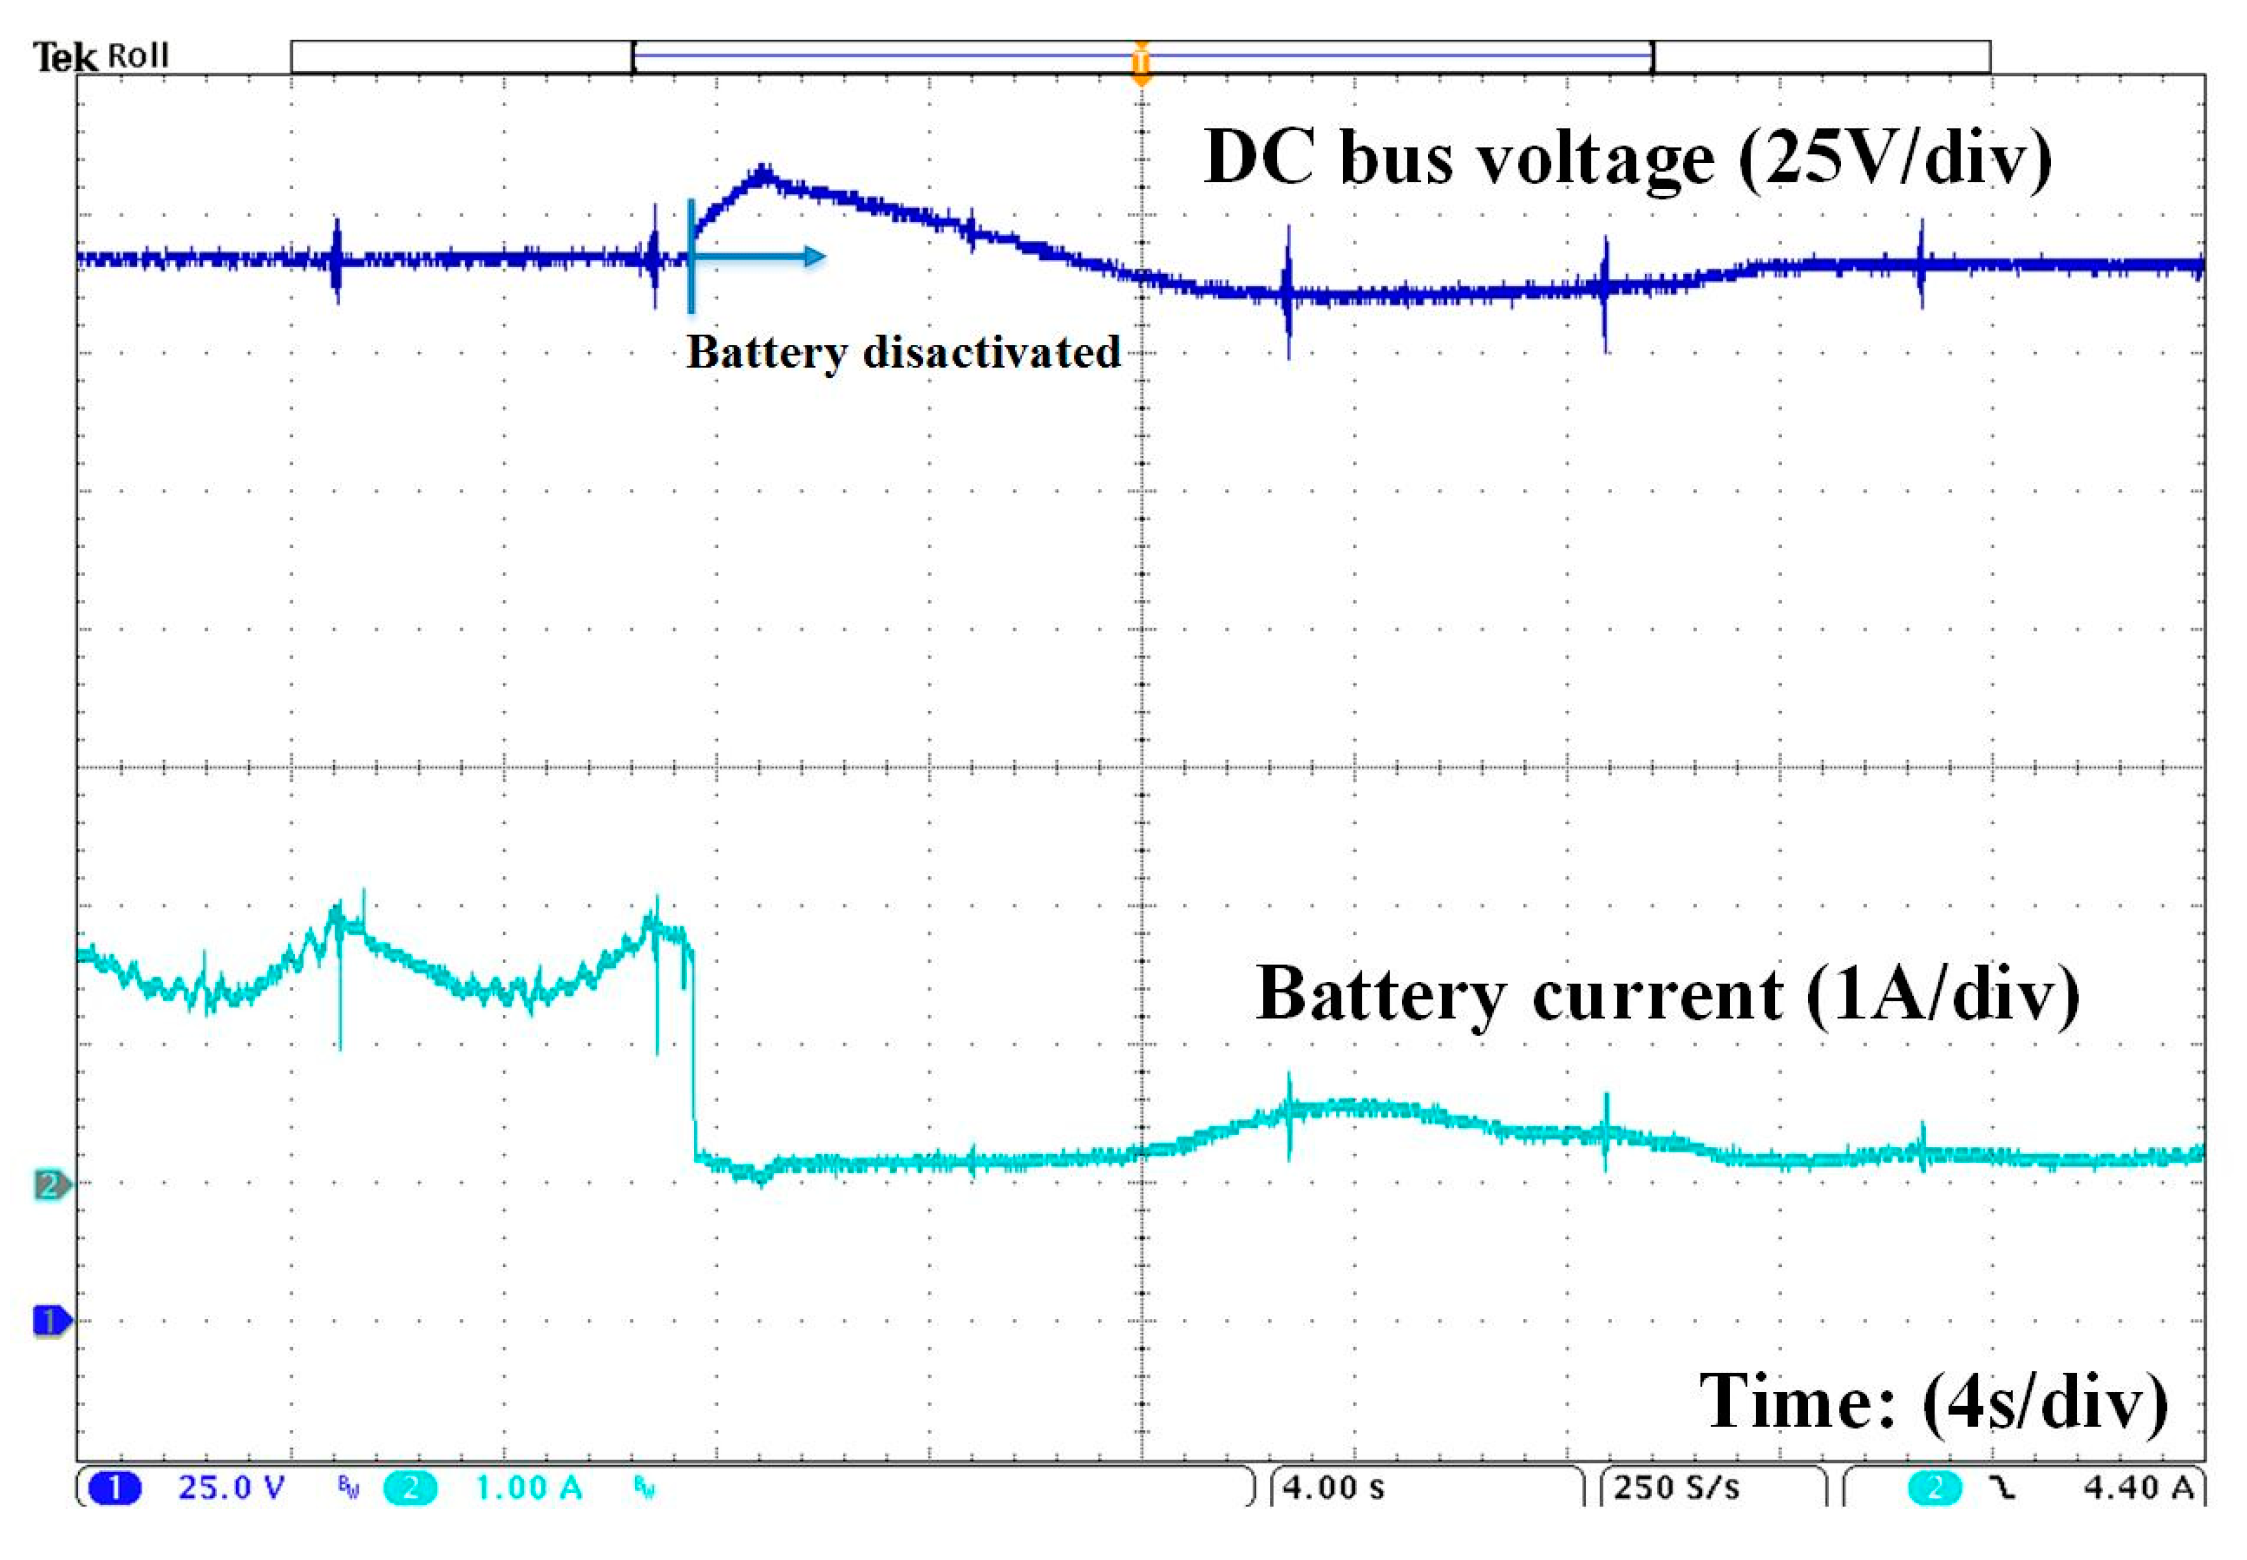
In the experimental results, the operation of the DC-µG is presented under principle operating conditions, all of them with the objective of evaluating the response of the DC bus to disturbances caused by the connection and disconnection of energy sources and real electronic loads. Throughout the different tests carried out, it was observed that the voltage bus of the proposed DC-µG remains within the operating range established in the design, and in each case the transitory response time ranged between 4 and 20 s. These periods are suitable for the design of the DC-µG because the voltage peaks and drops in the DC bus do not exceed 5% of the nominal value of the bus, this period is defined by the capacitance that the bus presents, that increased with the use of the bank of supercapacitors. This can result in the proposed bus voltage of the DC-µG being able to achieve short-term stability after being exposed to different disturbances. In addition, in the experiments performed, no inconvenience was observed in the operation of the power converters, so it is suggested that it is possible to extrapolate the design of the proposed DC-µG to a higher power.
Our proposal for administration and energy control of a DC-µG based on a state machine that presents response times similar to those shown in [30]. The authors obtained times between 4 and 37 s in 15 different operation modes using a supervisory control based on a state machine to satisfy the energy demand of an AC/DC µG and a FC to maintain the S°C of a BB. The effectiveness of the proposed was evaluated through extensive numeric simulations.
During the experiments that were carried out in this research, problems related to system instability caused by the dynamic interaction of the converters and/or impedances were not observed. For the design of the PECs, design techniques such as the one reported by [31] were used, taking into account whether the PEC commutes at a frequency at least ten times greater than the dynamics of the output voltage (or current), the switching noise is not mixed. The control technique used in parallel converters, in addition to the ratio of the impedances of the input/output sources contributed to the dynamics [32]. However, for future studies, a stability study, under conditions of higher power and a greater number of distributed generations (DGs) and loads, is necessary to ensure stability in certain interaction scenarios in the MG. If the noise is present in the complete system, a stability analysis can be done using the impedance of the source output filter and the input filter of the loads to find the loop with the lowest gain and evaluate it against criteria such as phase gain- phase margin or others [33,34,35].
Finally, for further study, the dimensioning of the components of the DC-µG proposed in order to make it economically viable will be considered. The methodology proposed by [36] is viable for this purpose because it demonstrates the effectiveness of a sizing method based on genetic algorithms applied to EMS similar to that proposed in this article. From the point of view of power electronics, the increase in the number of DGs represents a greater number of switched power converters. Dynamics under voltage drop conditions could present a problem in the stability of the DC bus.

Author Contributions

Investigation, A.P.-M.; Methodology, F.P.-P. and A.V.-L.; Project Administration, J.M.-N.; Validation, A.J.-G. All authors have read and agree to the published version of the manuscript.

Funding

This research received no external funding.

Conflicts of Interest

The authors declare no conflict of interest.

References

  1. Yu, Y.; Wada, K. Simulation Study of Power Management for a Highly Reliable Distribution System using a Triple Active Bridge Converter in a DC Microgrid. Energies 2018, 11, 3178. [Google Scholar] [CrossRef] [Green Version]
  2. Wang, H.; Huang, J. Joint investment and operation of microgrid. IEEE Trans. Smart Grid 2015, 8, 833–845. [Google Scholar] [CrossRef] [Green Version]
  3. Wang, H.; Huang, J. Incentivizing energy trading for interconnected microgrids. IEEE Trans. Smart Grid 2016, 9, 2647–2657. [Google Scholar] [CrossRef] [Green Version]
  4. Anvari-Moghaddam, A.; Guerrero, J.M.; Vasquez, J.C.; Monsef, H.; Rahimi-Kian, A. Efficient energy management for a grid-tied residential microgrid. IET Gener. Transm. Distrib. 2017, 11, 2752–2761. [Google Scholar] [CrossRef] [Green Version]
  5. García Elvira, D.; Valderrama Blaví, H.; Cid Pastor, À.; Martínez Salamero, L. Efficiency optimization of a variable bus voltage DC microgrid. Energies 2018, 11, 3090. [Google Scholar] [CrossRef] [Green Version]
  6. Dragičević, T.; Lu, X.; Vasquez, J.C.; Guerrero, J.M. DC microgrids—Part I: A review of control strategies and stabilization techniques. IEEE Trans. Power Electron. 2015, 31, 4876–4891. [Google Scholar] [CrossRef] [Green Version]
  7. Arunkumar, G.; Elangovan, D.; Sanjeevikumar, P.; Nielsen, J.B.H.; Leonowicz, Z.; Joseph, P.K. DC Grid for Domestic Electrification. Energies 2019, 12, 2157. [Google Scholar] [CrossRef] [Green Version]
  8. Zhao, Z.; Zhang, J.; He, Y.; Zhang, Y. Island DC Microgrid Hierarchical Coordinated Multi-Mode Control Strategy. Energies 2019, 12, 3012. [Google Scholar] [CrossRef] [Green Version]
  9. Zhang, Y.; Li, Y.W. Energy management strategy for supercapacitor in droop-controlled DC microgrid using virtual impedance. IEEE Trans. Power Electron. 2016, 32, 2704–2716. [Google Scholar] [CrossRef]
  10. Zhao, X.; Li, Y.W.; Tian, H.; Wu, X. Energy management strategy of multiple supercapacitors in a DC microgrid using adaptive virtual impedance. IEEE J. Emerg. Sel. Top. Power Electron. 2016, 4, 1174–1185. [Google Scholar] [CrossRef]
  11. Beykverdi, M.; Jalilvand, A.; Ehsan, M. Cooperative energy management of hybrid DC renewable grid using decentralized control strategies. Energies 2016, 9, 859. [Google Scholar] [CrossRef] [Green Version]
  12. Chen, M.; Ma, S.; Wan, H.; Wu, J.; Jiang, Y. Distributed Control Strategy for DC Microgrids of Photovoltaic Energy Storage Systems in Off-Grid Operation. Energies 2018, 11, 2637. [Google Scholar] [CrossRef] [Green Version]
  13. Al-Sakkaf, S.; Kassas, M.; Khalid, M.; Abido, M.A. An energy management system for residential autonomous DC microgrid using optimized fuzzy logic controller considering economic dispatch. Energies 2019, 12, 1457. [Google Scholar] [CrossRef] [Green Version]
  14. Zhang, L.; Chen, K.; Chi, S.; Lyu, L.; Cai, G. The Hierarchical Control Algorithm for DC Microgrid Based on the Improved Droop Control of Fuzzy Logic. Energies 2019, 12, 2995. [Google Scholar] [CrossRef] [Green Version]
  15. Zhang, L.; Chen, K.; Lyu, L.; Cai, G. Research on the Operation Control Strategy of a Low-Voltage Direct Current Microgrid Based on a Disturbance Observer and Neural Network Adaptive Control Algorithm. Energies 2019, 12, 1162. [Google Scholar] [CrossRef] [Green Version]
  16. Wu, H.; Locment, F.; Sechilariu, M. Experimental Implementation of a Flexible PV Power Control Mechanism in a DC Microgrid. Energies 2019, 12, 1233. [Google Scholar] [CrossRef] [Green Version]
  17. Han, Y.; Chen, W.; Li, Q. Energy management strategy based on multiple operating states for a photovoltaic/fuel cell/energy storage DC microgrid. Energies 2017, 10, 136. [Google Scholar] [CrossRef] [Green Version]
  18. Salas-Puente, R.; Marzal, S.; González-Medina, R.; Figueres, E.; Garcera, G. Experimental study of a centralized control strategy of a DC microgrid working in grid connected mode. Energies 2017, 10, 1627. [Google Scholar] [CrossRef] [Green Version]
  19. Chen, Y.K.; Wu, Y.C.; Song, C.C.; Chen, Y.S. Design and implementation of energy management system with fuzzy control for DC microgrid systems. IEEE Trans. Power Electron. 2012, 28, 1563–1570. [Google Scholar] [CrossRef]
  20. Behera, R.K.; Parida, S.K. DC microgrid management using power electronics converters. In Proceedings of the IEEE Eighteenth National Power Systems Conference, Guwahati, India, 18–20 December 2014; pp. 1–6. [Google Scholar]
  21. Zadeh, M.K.; Saublet, L.M.; Gavagsaz-Ghoachani, R.; Nahid-Mobarakeh, B.; Pierfederici, S.; Molinas, M. Energy management and stabilization of a hybrid DC microgrid for transportation applications. In Proceedings of the IEEE Applied Power Electronics Conference and Exposition, Long Beach, CA, USA, 20–24 March 2016; pp. 3397–3402. [Google Scholar]
  22. Hosseinzadeh, M.; Rajaei Salmasi, F. Fault-Tolerant Supervisory Controller for a Hybrid AC/DC Micro-Grid. IEEE Trans. Smart Grid 2018, 9, 2809–2823. [Google Scholar] [CrossRef]
  23. Sedaghati, R.; Shakarami, M.R. A Novel Control Strategy and Power Management of Hybrid PV/FC/SC/Battery Renewable Power System-Based Grid-Connected Microgrid. Sustain. Cities Soc. 2018. [Google Scholar] [CrossRef]
  24. Prasana, R.J.K.; Ramprasath, S.; Vijayasarathi, N. Design and analysis of hybrid DC-DC boost converter in continuous conduction mode. In Proceedings of the IEEE International Conference on Circuit, Power and Computing Technologies, Nagercoil, India, 18–19 March 2016; pp. 1–5. [Google Scholar]
  25. Attanasio, R.; Gennaro, F.; Scuderi, G. A grid tie micro inverter with reactive power control capability. In Proceedings of the AEIT Annual Conference, Mondello, Italy, 3–5 October 2013; pp. 1–6. [Google Scholar]
  26. Cao, J.; Schofield, N.; Emadi, A. Battery balancing methods: A comprehensive review. In Proceedings of the IEEE Vehicle Power and Propulsion Conference, Harbin, China, 3–5 September 2008; pp. 1–6. [Google Scholar]
  27. Killi, M.; Samanta, S. Modified perturb and observe MPPT algorithm for drift avoidance in photovoltaic systems. IEEE Trans. Ind. Electron. 2015, 62, 5549–5559. [Google Scholar] [CrossRef]
  28. Kwon, M.; Choi, S. Control scheme for autonomous and smooth mode switching of bidirectional DC–DC converters in a DC microgrid. IEEE Trans. Power Electron. 2017, 33, 7094–7104. [Google Scholar] [CrossRef]
  29. Li, X.; Guo, L.; Zhang, S.; Wang, C.; Li, Y.W.; Chen, A.; Feng, Y. Observer-based DC voltage droop and current feed-forward control of a DC microgrid. IEEE Trans. Smart Grid 2017, 9, 5207–5216. [Google Scholar] [CrossRef]
  30. Hosseinzadeh, M.; Salmasi, F.R. Power management of an isolated hybrid AC/DC micro-grid with fuzzy control of battery banks. IET Renew. Power Gener. 2014, 9, 484–493. [Google Scholar] [CrossRef]
  31. Erickson, R.W.; Maksimovic, D. Fundamentals of Power Electronics; Springer Science & Business Media: New York, NY, USA, 2001. [Google Scholar]
  32. Zhi, N.; Zhang, H.; Li, N.; Yang, J. System-level design and stability analysis of DC microgrid. In Proceedings of the International Power Electronics and Application Conference and Exposition, Shanghai, China, 5–8 November 2014; pp. 1134–1137. [Google Scholar]
  33. Wildrick, C.M.; Lee, F.C.; Cho, B.H.; Choi, B. A method of defining the load impedance specification for a stable distributed power system. IEEE Trans. Power Electron. 1995, 10, 280–285. [Google Scholar] [CrossRef]
  34. Feng, X.; Liu, J.; Lee, F.C. Impedance specifications for stable DC distributed power systems. IEEE Trans. Power Electron. 2002, 17, 157–162. [Google Scholar] [CrossRef]
  35. Sudhoff, S.D.; Glover, S.F.; Lamm, P.T.; Schmucker, D.H.; Delisle, D.E. Admittance space stability analysis of power electronic systems. IEEE Trans. Aerosp. Electron. Syst. 2000, 36, 965–973. [Google Scholar] [CrossRef] [Green Version]
  36. Feroldi, D.; Degliuomini, L.N.; Basualdo, M. Energy management of a hybrid system based on wind–solar power sources and bioethanol. Chem. Eng. Res. Des. 2013, 91, 1441–1455. [Google Scholar] [CrossRef]
Figure 1. Direct current microgrid (DC-µG) block diagram.
Energies 13 04074 g001
Figure 2. DC-µG experimental test-bed.
Energies 13 04074 g002
Figure 3. DC–DC boost converter.
Energies 13 04074 g003
Figure 4. Bidirectional DC–AC converter.
Energies 13 04074 g004
Figure 5. Bidirectional DC–DC converter.
Energies 13 04074 g005
Figure 6. General block system.
Energies 13 04074 g006
Figure 7. Global management controller (GMC) state machine diagram.
Energies 13 04074 g007
Figure 8. GMC flow diagram.
Energies 13 04074 g008
Figure 9. Voltage control (VC) for the boost converter.
Energies 13 04074 g009
Figure 10. Perturb and observe (P&O) control algorithm.
Energies 13 04074 g010
Figure 11. Maximum power point tracking (MPPT) control system diagram.
Energies 13 04074 g011
Figure 12. Control algorithm diagram for inverter.
Energies 13 04074 g012
Figure 13. Control for DC–AC converter working as an inverter.
Energies 13 04074 g013
Figure 14. Control for the DC–AC converter working as a rectifier.
Energies 13 04074 g014
Figure 15. Bus behavior on the two photovoltaic emulators (PVEs) ignition.
Energies 13 04074 g015
Figure 16. Bus behavior when the control and management system (CMS) is switched on.
Energies 13 04074 g016
Figure 17. LED-type lamp connection.
Energies 13 04074 g017
Figure 18. Disconnection of LED-type lamp.
Energies 13 04074 g018
Figure 19. Connection of 300 W fluorescent lamps.
Energies 13 04074 g019
Figure 20. Disconnection of 300 W fluorescent lamps.
Energies 13 04074 g020
Figure 21. Connection of 400 W fluorescent lamps.
Energies 13 04074 g021
Figure 22. Disconnection of 400 W fluorescent lamps.
Energies 13 04074 g022
Figure 23. Connection to the main grid (MG).
Energies 13 04074 g023
Figure 24. Ignition of the control for the rectifier.
Energies 13 04074 g024
Figure 25. Connection of 115 W LED lamp.
Energies 13 04074 g025
Figure 26. Disconnection of 115 W LED lamp.
Energies 13 04074 g026
Figure 27. Connection of 300 W fluorescent lamps.
Energies 13 04074 g027
Figure 28. Disconnection of 300 W fluorescent lamps.
Energies 13 04074 g028
Figure 29. Connection of 400 W fluorescent lamps.
Energies 13 04074 g029
Figure 30. Disconnection of 400 W fluorescent lamps.
Energies 13 04074 g030
Figure 31. Start of the power supply to the battery bank (BB).
Energies 13 04074 g031
Figure 32. End of the power supply to the BB.
Energies 13 04074 g032
Figure 33. Start of the power supply to the BB.
Energies 13 04074 g033
Figure 34. End of the power supply to the BB.
Energies 13 04074 g034
Figure 35. BB voltage in charging mode.
Energies 13 04074 g035
Figure 36. BB current in charging mode.
Energies 13 04074 g036
Figure 37. BB voltage in discharge mode.
Energies 13 04074 g037
Figure 38. BB current in discharge mode.
Energies 13 04074 g038
Figure 39. Output voltage–current oscillograms of the interconnected inverter with the MG.
Energies 13 04074 g039
Table 1. Bidirectional DC–DC converter parameters.
Design FeatureValue
Rated power1000 W
Maximum low voltage135 V
Minimum low voltage100 V
Maximum high voltage180 V
Minimum high voltage200 V
Switching frequency30 kHz
Current ripple in the inductor10%
Voltage ripple on the high side5%
Table 2. Passive elements.
ElementsValue
Inductor (L)11.11 mH
Low voltage capacitor (C1)12.50 µF
High voltage capacitor (C2)157.92 µF
Table 3. GMC START transitions.
INPUTSSTATESOUTPUTS
ConditionVbusPV PowerMGBatteryCurrent StateNext StatePVDC/DCDC/ACLoads
1185–195 V>800 WSTARTSTARTVCOFFOFFON
2188–192 V<800 WCHARGESTARTSTATE 2MPPTBUCKOFFON
3188–192 V<800 WAVAILABLESTARTSTATE 1MPPTOFFINVERTERON
4<183 V>800 WAVAILABLESTARTSTATE 3MPPTOFFRECTIFIERON
5<183 V>800 WNOTDISCHARGESTARTSTATE 4MPPTBOOSTOFFON
6<180NOTWITHOUTSTARTSTATE 7OFFOFFOFFOUT
Table 4. GMC transitions in STATE 1 and 2.
INPUTSSTATESOUTPUTS
ConditionVbusPV PowerMGBatteryCurrent StateNext StatePVDC/DCDC/ACLoads
7185–195 V<100 WSTATE 1STARTVCOFFOFFON
8185–195 VSTATE 1STATE 1MPPTOFFINVERTERON
9>198 VCHARGEDSTATE 2STARTVCOFFOFFON
10185–195 V<50 WSTATE 2STARTVCOFFOFFON
11185–195 VSTATE 2STATE 2MPPTBUCKOFFON
Table 5. GMC transitions in STATE 3 and 4.
INPUTSSTATESOUTPUTS
ConditionVbusPV PowerMGBatteryCurrent StateNext StatePVDC/DCDC/ACLoads
12<183 V>800 W>800 WDISCHARGESTATE 3STATE 5MPPTBOOSTRECTIFIERON
13>198 V<100 WSTATE 3STARTVCOFFOFFON
14<183 VNOTDISCHARGESTATE 3STATE 4MPPTBOOSTOFFON
15<183 VNOTNOTSTATE 3STARTVCOFFOFFON
16185–195 VSTATE 3STATE 3MPPTOFFRECTIFIERON
17188–192 VAVAILABLESTATE 4STATE 3MPPTOFFRECTIFIERON
18>198 VSTATE 4STARTVCOFFOFFON
19<183 VWITHOUTSTATE 4STARTVCOFFOFFON
20185–195 VNOTDISCHARGESTATE 4STATE 4MPPTBOOSTOFFON
Table 6. GMC transitions in STATE 5 and 6.
INPUTSSTATESOUTPUTS
ConditionVbusPV PowerMGBatteryCurrent StateNext StatePVDC/DCDC/ACLoads
21<183 V>800 W>800 W>800 WSTATE 5STATE 6MPPTBOOSTRECTIFIEROUT
22>198 VSTATE 5STATE 3MPPTOFFRECTIFIERON
23<183 VWITHOUTSTATE 5STATE 8MPPTOFFRECTIFIEROUT
24<183 VNOTSTATE 5STATE 9MPPTBOOSTOFFOUT
25185–195 VSTATE 5STATE 5MPPTBOOSTRECTIFIERON
26>198 VSTATE 6STATE 5MPPTBOOSTRECTIFIERON
27<180 V>800 W>800 W>800 WSTATE 6STATE 7OFFOFFOFFOUT
28<180 VNOTSTATE 6STATE 7OFFOFFOFFOUT
29<180 VWITHOUTSTATE 6STATE 7OFFOFFOFFOUT
30185–195 VSTATE 6STATE 6MPPTBOOSTRECTIFIEROUT
Table 7. GMC transitions in STATE 8 and 9.
INPUTSSTATESOUTPUTS
ConditionVbusPV PowerMGBatteryCurrent StateNext StatePVDC/DCDC/ACLoads
31>198 VSTATE 8STATE 3MPPTOFFRECTIFIERON
32<183 VNOTSTATE 8STATE 7OFFOFFOFFOUT
33185–195 VSTATE 8STATE 8MPPTOFFRECTIFIEROUT
34<183 VWITHOUTSTATE 9STATE 7OFFOFFOFFOUT
35>198 VSTATE 9STATE 4MPPTBOOSTOFFON
36185–195 VSTATE 9STATE 9MPPTBOOSTOFFOUT
Table 8. Response of the DC-µG to the connection and disconnection of loads and sources.
MG Supplying Power to the Loads
ResponseLoads
Con LEDDiscon LEDCon FL 300 WDiscon FL 300 WCon FL 400 WDiscon FL 400 W
Disturbance2.4 V (D)
(1.26%)
2 V (O)
(1.05%)
4 V (D)
(2.1%)
8 V (O)
(4.2%)
8 V (D)
(4.2%)
8 V (O)
(4.2%)
Timing4 s4 s6 s6 s6 s6 s
PVEs Supplying Power to the Loads
ResponseLoads
Con LEDDiscon LEDCon FL 300 WDiscon FL 300 WCon FL 400 WDiscon FL 400 W
Disturbance1.5 V (D)
(0.78%)
1.5 V (O)
(0.78%)
1.5 V (D)
(0.78%)
4.25 V (O)
(2.2%)
3 V (D)
(1.57%)
7.5 V (O)
(3.94%)
Timing10 s10 s4 s4 s10 s10 s
MG Supplying Power to the Loads and the BB
ResponseOperation
ActivationDeactivation
Disturbance1.65 V (D) (0.86%)2.5 V (O) (1.31%)
Timing10 s4 s
PVEs Supplying Power to the Loads and the BB
ResponseOperation
ActivationDeactivation
Disturbance8.75 V (D) (4.6%)8.75 V (O) (4.6%)
Timing6 s6 s

