Article

Education for Sustainable Energy: Comparison of Different Types of E-Learning Activities

by
María Ángeles Martín-Lara
1,* and
Nuria Rico
2
1
Chemical Engineering Department, Faculty of Sciences, Avda. Fuentenueva, s/n, 18071 Granada, Spain
2
Department of Statistics and Operational Research, Faculty of Sciences, Avda. Fuentenueva, s/n, 18071 Granada, Spain
*
Author to whom correspondence should be addressed.
Energies 2020, 13(15), 4022; https://doi.org/10.3390/en13154022
Submission received: 14 July 2020 / Revised: 30 July 2020 / Accepted: 31 July 2020 / Published: 4 August 2020

Abstract

:
This paper reports a comparison of results obtained by using different e-learning strategies for teaching a biogas topic in two courses of the chemical engineering degree at the University of Granada. Particularly, four different asynchronous e-learning activities were carefully chosen: (1) noninteractive videos and audio files; (2) reading papers and discussion; (3) virtual tour of recommended websites of entities/associations/organizations working in the biogas sector; (4) PowerPoint slides and class notes. Students evaluated their satisfaction level (assessment) and teachers gave scores for evaluation exams (scores). We discuss the results from a quantitative point of view to suggest recommendations for improving e-learning implementations in education for sustainable energy. For dependent variables, reached scores and satisfaction assessment, we find the differences between means for students in two different academic years are no significant. In addition, there are no significant differences between means depending on the type of course. Significant differences appear for scores and satisfaction assessment between different activities. Finally, we deeply analyze the relationship between score and satisfaction assessment. The results show a positive correlation between assessment of e-learning activities and the score level reached by students.

Graphical Abstract

1. Introduction

Our society bases its functioning on the use of energy. Energy is needed for everything: to illuminate houses and streets, to heat and cool interiors, to transport goods and people, to produce and prepare food, to manufacture almost everything people use, and so on. Until just two centuries ago humans obtained the energy they used from the strength of animals, from the fire produced by burning wood, and from the force of water and wind. At the end of the eighteenth century, with the invention of the steam engine and the great industrial and technological revolution that came with it, energy consumption was triggered, making new sources such as carbon necessary. Since then, the need for energy has been increasing progressively to the point where, at present, the degree of development of a country or region is measured by its energy consumption. Access to energy is universally recognized as key to economic development and to the realization of human and social wellbeing. Most of the energy humans consume today comes from fossil fuels such as oil, coal or natural gas. It is a natural resource but not renewable, which when demanded at too high a rate risks becoming scarce, or even exhausted, with all the problems that would entail. The massive use of fossil fuels, in addition to causing problems and social inequality due to its growing scarcity, is also causing environmental problems such as pollution, changes in biodiversity, and global warming, which can cause serious difficulties in the not too distant future. That is why many international institutions and movements raise the need to implement measures that promote a sustainable future, with energy savings and the use of other energy sources being the main solutions that can contribute to this. Considering that heat and transport represent 80 percent of total final energy consumption, particular efforts are needed in those areas to accelerate the uptake of renewables. International and national entities and stakeholders must collaborate to reshape the global energy system so that it participates fully towards the implementation of Goal 7 by transitioning to net-zero CO2 emissions by mid-century so as to meet the goals of the Paris Agreement including by introducing carbon pricing and phasing out fossil fuel subsidies [1].
Supporting the learning of sustainable energy is one of the central global contents of Higher Education [2]. Sustainable energy can be defined as the production and consumption of energy that supports sustainable development [3]. Energy is very relevant within the strategic policy of any country. In this sense, the energy crisis that is going through the country has repercussions on multiple economic sectors, including the production matrix and the transport sector, and has great social consequences by affecting the quality of life of the inhabitants. At the international level, this positioning on energy resources also has consequences such as dependence on imports and the consequent weight on the trade balance. The above situation implies the need to look for alternative energy sources that point to diversifying the energy matrix and intensifying the use of renewable resources. Sustainable energy includes renewable energies as solar energy, wind power, hydroelectric power, geothermal energy or the production of biofuels from biomass sources. In the face of this context, in this research, biogas, one of the most important renewable biofuels, was studied.
E-learning has garnered increasing attention in Higher Education in the last few decades [4,5,6,7]. However, a lack of usage at the university level is clear [8]. E-learning or virtual teaching is currently supporting traditional face-to-face teaching (teacher and students physically interacting in the classroom). Its use has transformed a great part of traditional teaching to convert students to active participants [9]. Particularly, the limited capacity of classrooms converts e-learning in a good alternative/complement since e-learning only requires a computer and internet connection. In addition, the flexibility (in terms of time and place) of e-learning has adapted it to be an interesting teaching method [10,11,12,13]. Another reason is the cost, since traditional teaching involves more staff expenses and costs more than e-learning [14]. From the perspective of students, a considerable number of studies have shown that implementing e-assessment activities can improve their learning and increase their motivation for the course [15,16]. Finally, from the perspective of teachers, some studies reported that, in general, teachers have good level of readiness and a positive attitude towards e-learning [17].
The best e-learning activities depend on the topic, individualities of the students (age, technological skills, number, intrinsic attributes, etc.), and individualities of the teacher. [18,19]. For example, sometimes it is difficult to respond to the diverse needs of the students (in function of their learning styles). In this sense, some activities can be too complicated for some students and too easy and gimmicky for others. Also, some teachers prefer include e-learning activities that involves discussion or practice in their courses and others are more comfortable designing e-learning activities in which students receive information through reading materials. Also, students in different disciplines exhibit different learning styles [20].
Jochems et al. [21] discussed the concept of “integrated e-learning” a combination of e-learning activities with conventional methods. With the global health crisis of coronavirus (COVID-19) going on, this study takes the concept of e-learning approaches to include a more extensive use of technology to grant students continuity in the face of adverse circumstances. A hybrid of face-to-face (in-person) learning and e-learning lessons is one of the many proposed models for the future. The question of how to incorporate and evaluate e-learning activities as part of a face-to-face learning course is a significant educational challenge in Higher Education. There has been little systematic quantitative research to date that addressed key aspects of student learning in experiences of e-learning activities combined with in-person learning.
In this work, four different asynchronous e-learning activities have been selected to identify the main asynchronous e-learning action for a biogas topic: (1) noninteractive videos and audio recordings; (2) readings; (3) virtual tour of recommended websites of entities/associations/organizations in the biogas sector; (4) PowerPoint slides and class notes.

2. Materials and Methods

2.1. Participants

This study involved students of the chemical engineering degree at the University of Granada, Spain. Two different courses participated in the study: the “Solid and Gaseous Waste Treatment (C1)” and “Biofuels and Renewable Energies (C2)” elective courses. Although both courses are optional and can be chosen by all undergraduate students, they are especially designed for final-year students between 21 and 22 years old.
A total of 72 students were registered on the two courses in the academic years 2018–2019 and 2019–2020 but only 68 students participated in the study. The other students did not attending class sessions on a regular basis. Each student participated in one e-learning activity. Regarding the information of the sample of students, 54.4% were males and 45.6% females, which was reasonably gender-balanced.
The numbers of students who participated and evaluated the e-learning activities are summarized in Table 1.

2.2. Description of the E-Learning Activities

The main purpose of all e-learning activities in the courses was promoting the students study in their own time and at their own place. With regards to the educational goal of the e-learning activities, it was “receiving knowledge” or acquisition according to Laurillard’s work on learning types [22]. That means learning specific terms, principles, practices, etc. It does not require students to do anything. This goal was met mainly by watching educational videos, listening to sound files, reading texts and multimedia presentations, among others [23].
Next, we provide a brief description of the e-learning activities chosen in this work.

2.2.1. Activity One: Noninteractive Videos and Radio Podcasts

A total of ten videos and three radio podcasts were provided to students. They included educational videos from different Spanish universities, four technical videos from international companies and three radio interviews featuring senior professors of different Spanish universities. In this e-learning activity, the students are physically passive but mentally active. They are “absorbing” knowledge.

2.2.2. Activity Two: Readings

With this activity, students had to read a total of five review papers and optionally summarize in a brief report with relevant details. The writing of the summary report helps students learn by requiring students to remember and understand the information.

2.2.3. Activity Three: Tour of Recommended Webs of Entities/Associations Working in Biogas Sector

A list of web pages of relevant entities/associations/organizations working in the biogas industry such as the World Biogas Association was provided to students. Students had to review the web pages and information and answer some questions provided by teacher. The URL links available to these resources are the following:

2.2.4. Activity Four: PowerPoint Slides and Class Notes

For developing this activity, the students had to analyze, revise and study a series of slides and class notes prepared and provided by the teacher.

2.3. Research Design

Table 2 summaries the distribution of the e-learning activities between students of different courses and academic years. Fully consistent with this type of study, there was no attempt by the researchers to assign certain participants to specific e-learning activities; they were randomly assigned by teachers of the course where the study was carried out.
In both courses, one or two weeks before the e-learning experience, students answered some opening exploration questions to provide information about their previous knowledge about the biogas sector. Results did not show significant dissimilarity among groups. In addition, the teacher was the same for both courses and academic years.

2.4. The Module Content

The module developed in the experiment was analysis of biogas technology for energy production and climate change mitigation. It is dedicated to increasing understanding of biogas as an energy option and includes contents about: (i) biomass resources for biogas production and feedstock characterization and pretreatment, (ii) fundamental engineering of biogas plants and (iii) biogas applications including its cleaning and upgrading to biomethane.
It is important to highlight that the content of the module was exactly the same for all e-learning activities and the two academic years and courses. The details about the courses content is provided as supplementary materials.

2.5. Postexperiment Questionnaire

At the end of the e-learning activity and some time later to see if the knowledge had been properly assimilated, participants performed a written exam, consisting of objective questions about the module content. It is important to mention that, for this study, the numerical score obtained from each student related only to the topic developed by e-learning activities.
The questions were the same for all students. Also, after the e-learning activity, participants were required to fill out a questionnaire to assess their perceived satisfaction and to give feedback on the system and their learning experience. In both questionnaires, the potential test scores ranged from 0 to 10 and the time for applied the tests were the same for all e-learning groups. With regards to the satisfaction survey, the following items were also evaluated using a Likert scale (disagree, neutral and agree). These items are an adaptation from the work of Ginns and Ellis [12].
  • Item 1: Guidelines for the e-learning activity needed to understand the purpose and contents of the unit are well provided and integrated in the course.
  • Item 2: The materials provided for the development of the unit are good and made the topic interesting to students.
  • Item 3: The e-learning activity helps students to learn better than in a face-to-face situation.
  • Item 4: The workload for the e-learning activity is convenient.
  • Item 5: Students have enough time to do/work on the e-learning activity.

2.6. Data Analysis

In the analysis of data we use the following statistical tools
  • Box plots: Boxplot was established as a standardized way of displaying the distribution of data. It is based on “minimum”, first quartile (Q1), median, third quartile (Q3), and “maximum” numbers. It gives information on the variability or dispersion of the data.
  • Analysis of variance (ANOVA): ANOVA is a very powerful tool to determine the influence that the independent variable (in our case: year, course and activity) has on the dependent variable (in our case score and assessment) and test the differences between two or more means.
  • Levene’s test: This is useful for assess the equality of variances for a variable calculated for two or more groups. Equal variances across samples are called homogeneity of variance.
  • Bonferroni test: This test was used to multiple comparisons when significant difference exists in ANOVA test. It allows us understand which means are statistically different.
  • Spearman’s Rho: A nonparametric measure of rank correlation taking values between −1 and 1, it indicates how well the relationship between two variables, in our case scores and satisfaction assessment, can be described using a monotonic function.
  • Pearson’s chi-squared test and dependence measures: The chi-squared test is used for determining if whether two qualitative variables are independent or not. For no independent variables, we study the direction and intensity of the relationship through dependence measures, in our case, through lambda, Goodman and Kruskal’s tau, Sommers’s D and Gamma measures. The first and second measures let us know if one of the variables is suitable in order to forecast on the other variable while Sommers’ D and Gamma are nonparametric measures of the strength and direction of association that exists between two ordinal variables, taking values between −1 and 1.
  • Odd ratio: This is a measure of the association between two binary variables. We calculated it using a binary logistic regression, commonly used to model the probability of a certain class or event. In our case, we look for the probability of a high score instead a low one for students, depending on low or high satisfaction assessment.

3. Results and Discussion

3.1. Data Description and Analysis of Differences between the Groups

Table 3 shows the mean and standard deviation values for each variable, score (exam point/mark) and assessment (valuation of the inclination by the e-learning experience), and for each category and factor group. One of the conclusions of Table 3 is that teachers need to focus not only on knowledge but also their students’ perceptions of the e-learning activities since the valuation of the e-learning activities was between 5.29 and 7.53 (not very good values).
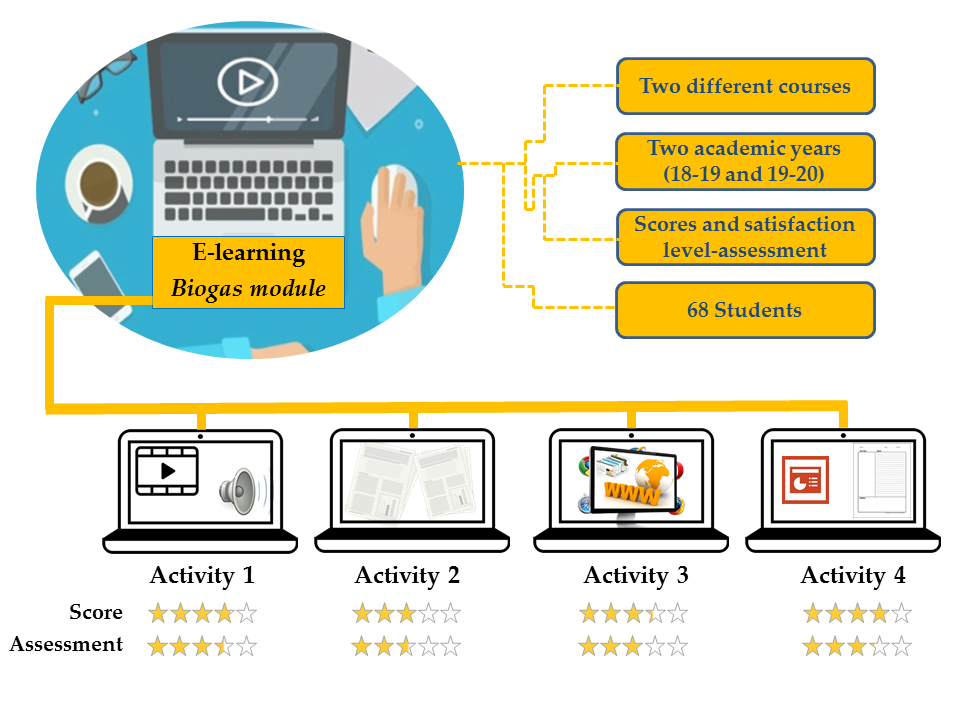
As for the number of students who enrolled in all the courses and academic years, a total of 17 students were assigned to each e-learning activity (28 from academic year 2018/2019 and course 1 and 40 for academic year 2019/2020 and course 2). Although we observe a higher number of students in academic year 2019/2020 and course 2, the number of students distributed in the different types of learning activities is similar.
As for the distribution of teachers for all groups, the same teacher taught face-to-face classes, and designed and reviewed e-learning activities.
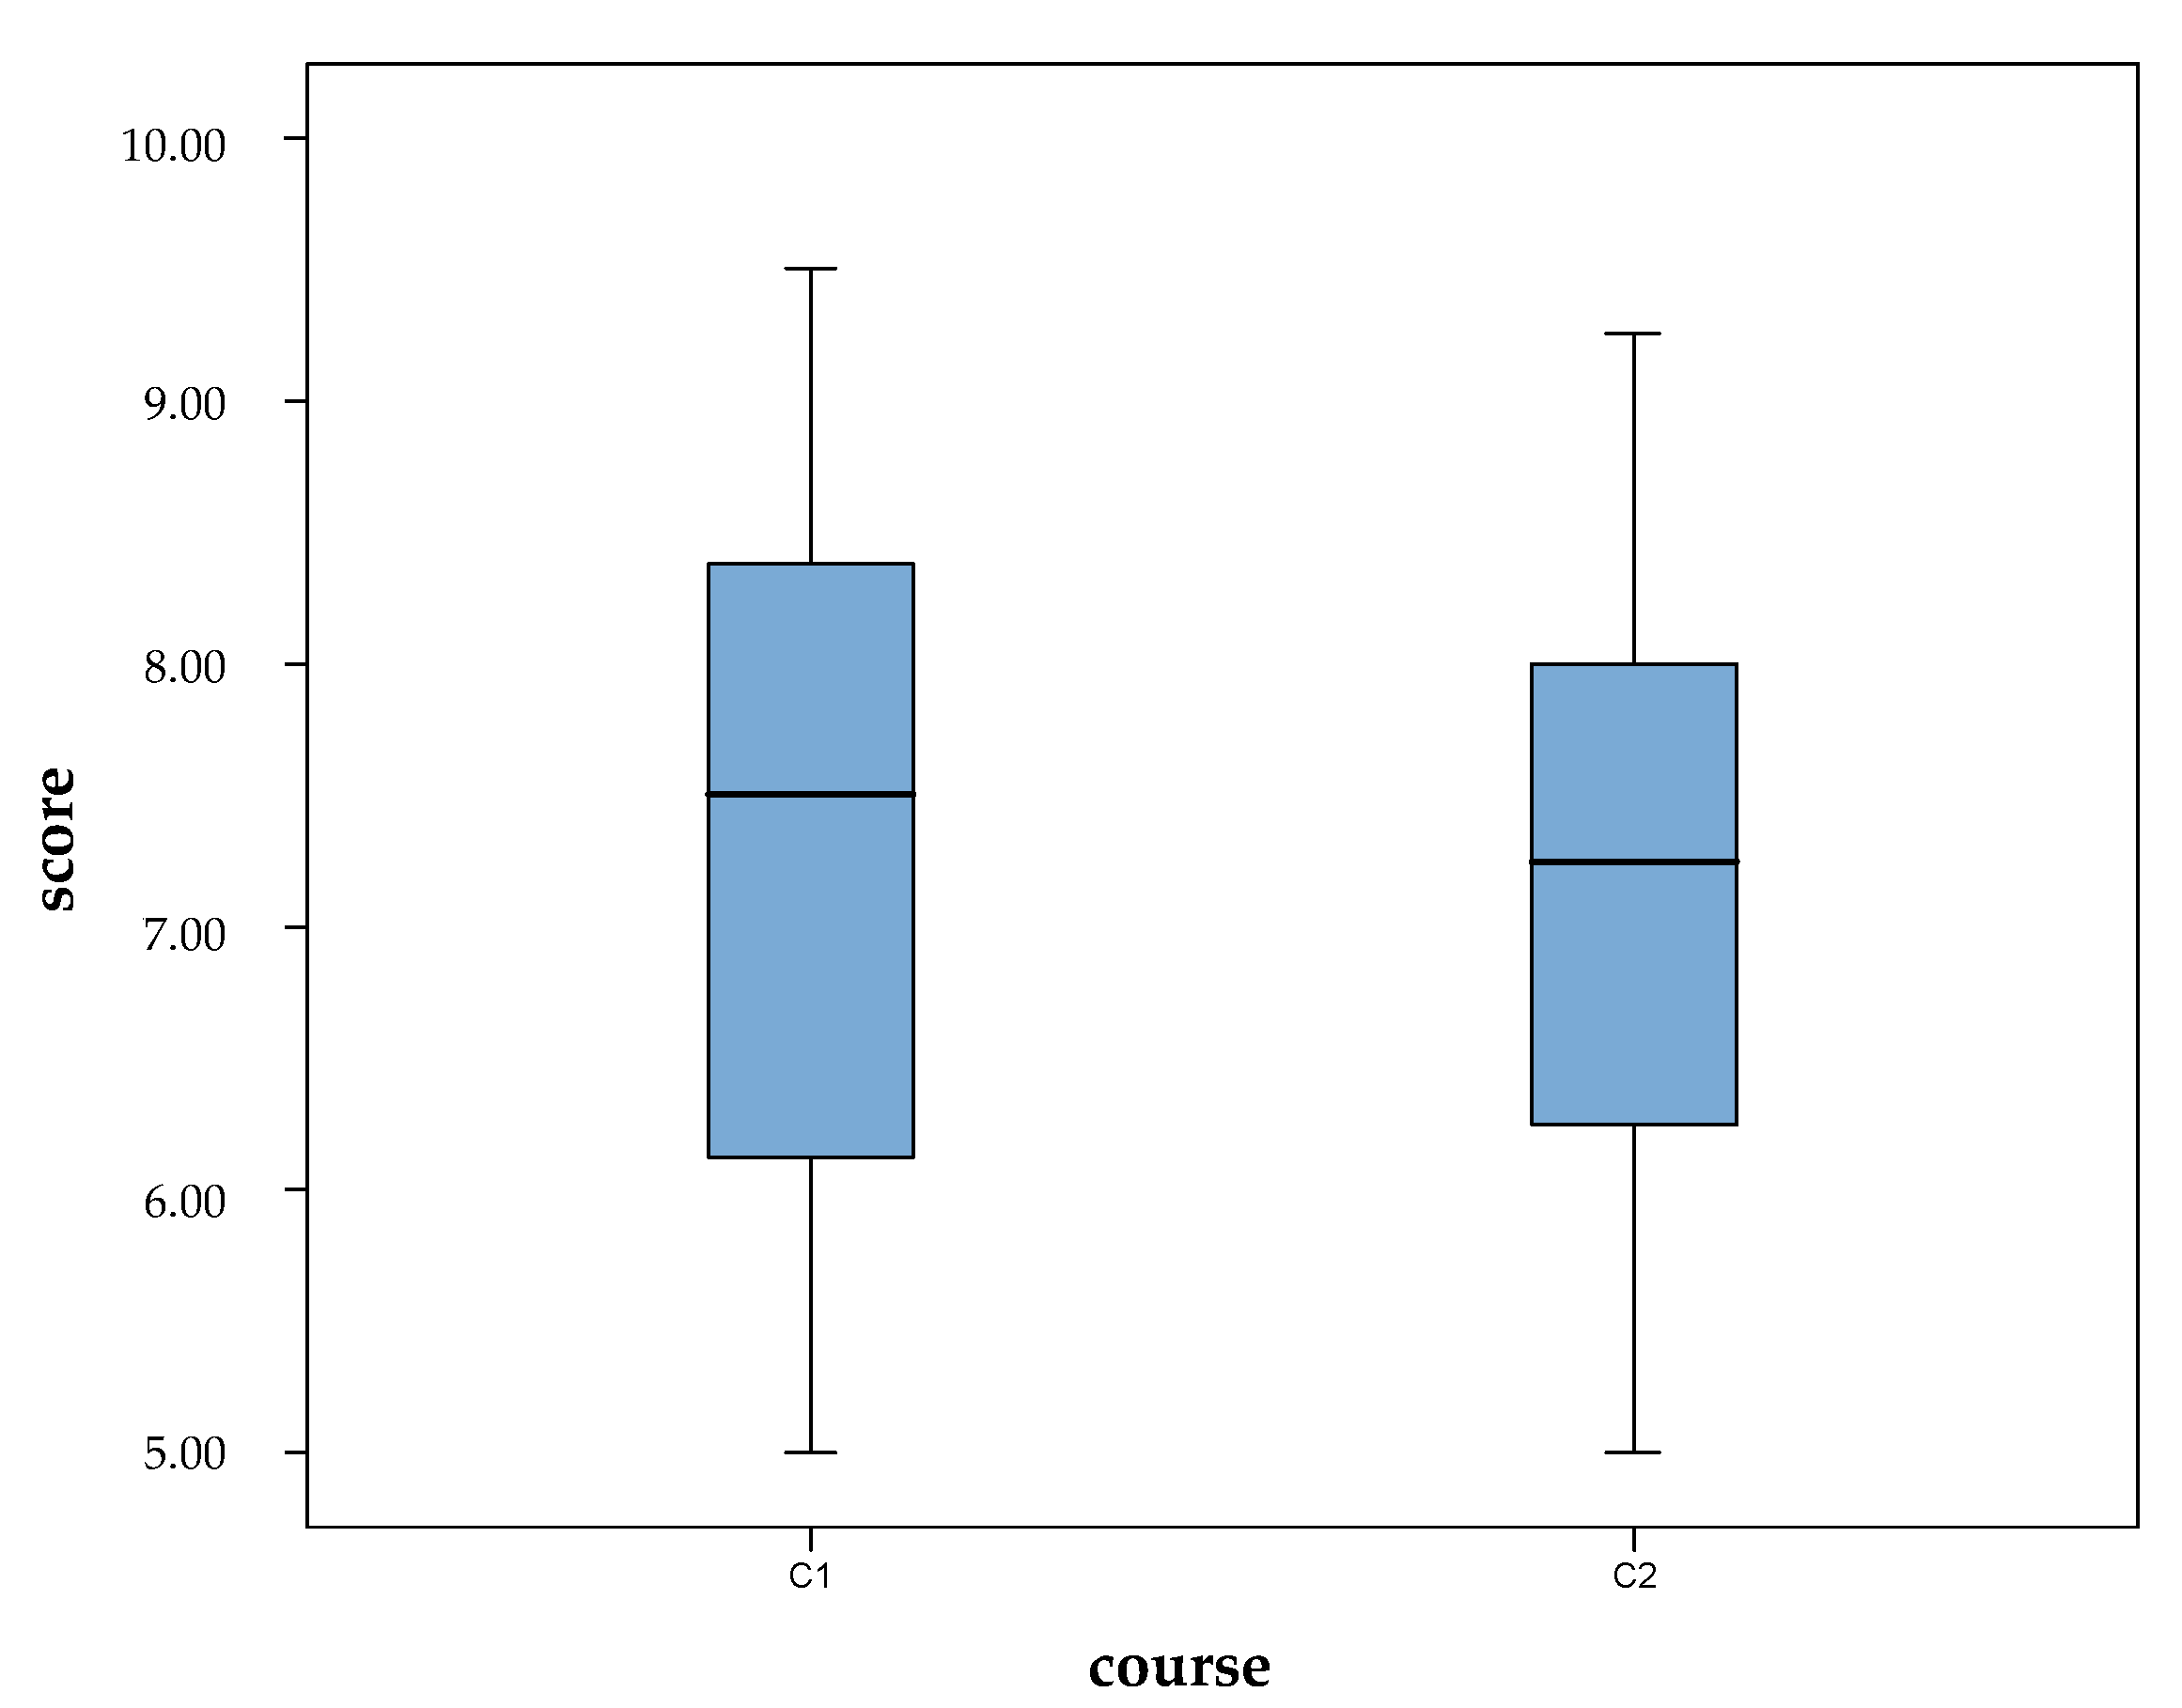
The academic performance (score) of the students is one of the most important dimensions in the learning process. For Ruiz et al. [24] academic performance is the result of countless factors ranging from personal aspects, those related to the family and social aspect in which the student is performed, those who depend on the institution and those that depend on teachers. As this study was performed in only one institution (University of Granada), with the same teacher, we will attribute differences to academic year, type of course and type of e-learning activity. However, some important limitations of the work must be noted. Firstly, we did not compare scores and assessment for e-learning activities against a face-to-face situation. Secondly, we did not measure students’ personal skills (e.g., reading skills) and other factors related to different learning processes that could be influencing scores and assessment. These factors are actually included as random error, and quantitative models work with this assumption, but we have no evidence they are no significant for dependent variables.

3.1.1. Differences between the Academic Years

Figure 1 shows the box plots to give a good graphical image of the concentration of data. On the left, we can see scores for two different academic years distributions are very similar. On the right, satisfaction assessment in these two academic years are similar too, with a slight difference between dispersions.
Analysis of variance (ANOVA) was used to determine if differences between academic years are significant (Table 4). A comparison of means showed that the observed difference was not significant in any of the variables.
In addition, to test the differences between the academic years, we performed a Levene’s test (Table 5). Results show that the variances between the academic years do not differ significantly from each other.

3.1.2. Differences between the Types of Course

As for the course followed by the students, in the box plots (Figure 2) we observe no difference in terms of the scores. It seems that there is a greater coincidence of results in terms of the assessment of course 1 than in terms of the assessment of course 2, in which there is a little more dispersion.
A comparison of means using ANOVA (Table 6) and Levene’s test (Table 7) indicate that the differences are not significant, either in terms of the average score and assessment or in terms of the variability of both. As a conclusion, we achieved comparability of scores and assessment between the two different courses.

3.1.3. Differences between the Types of E-Learning Activity

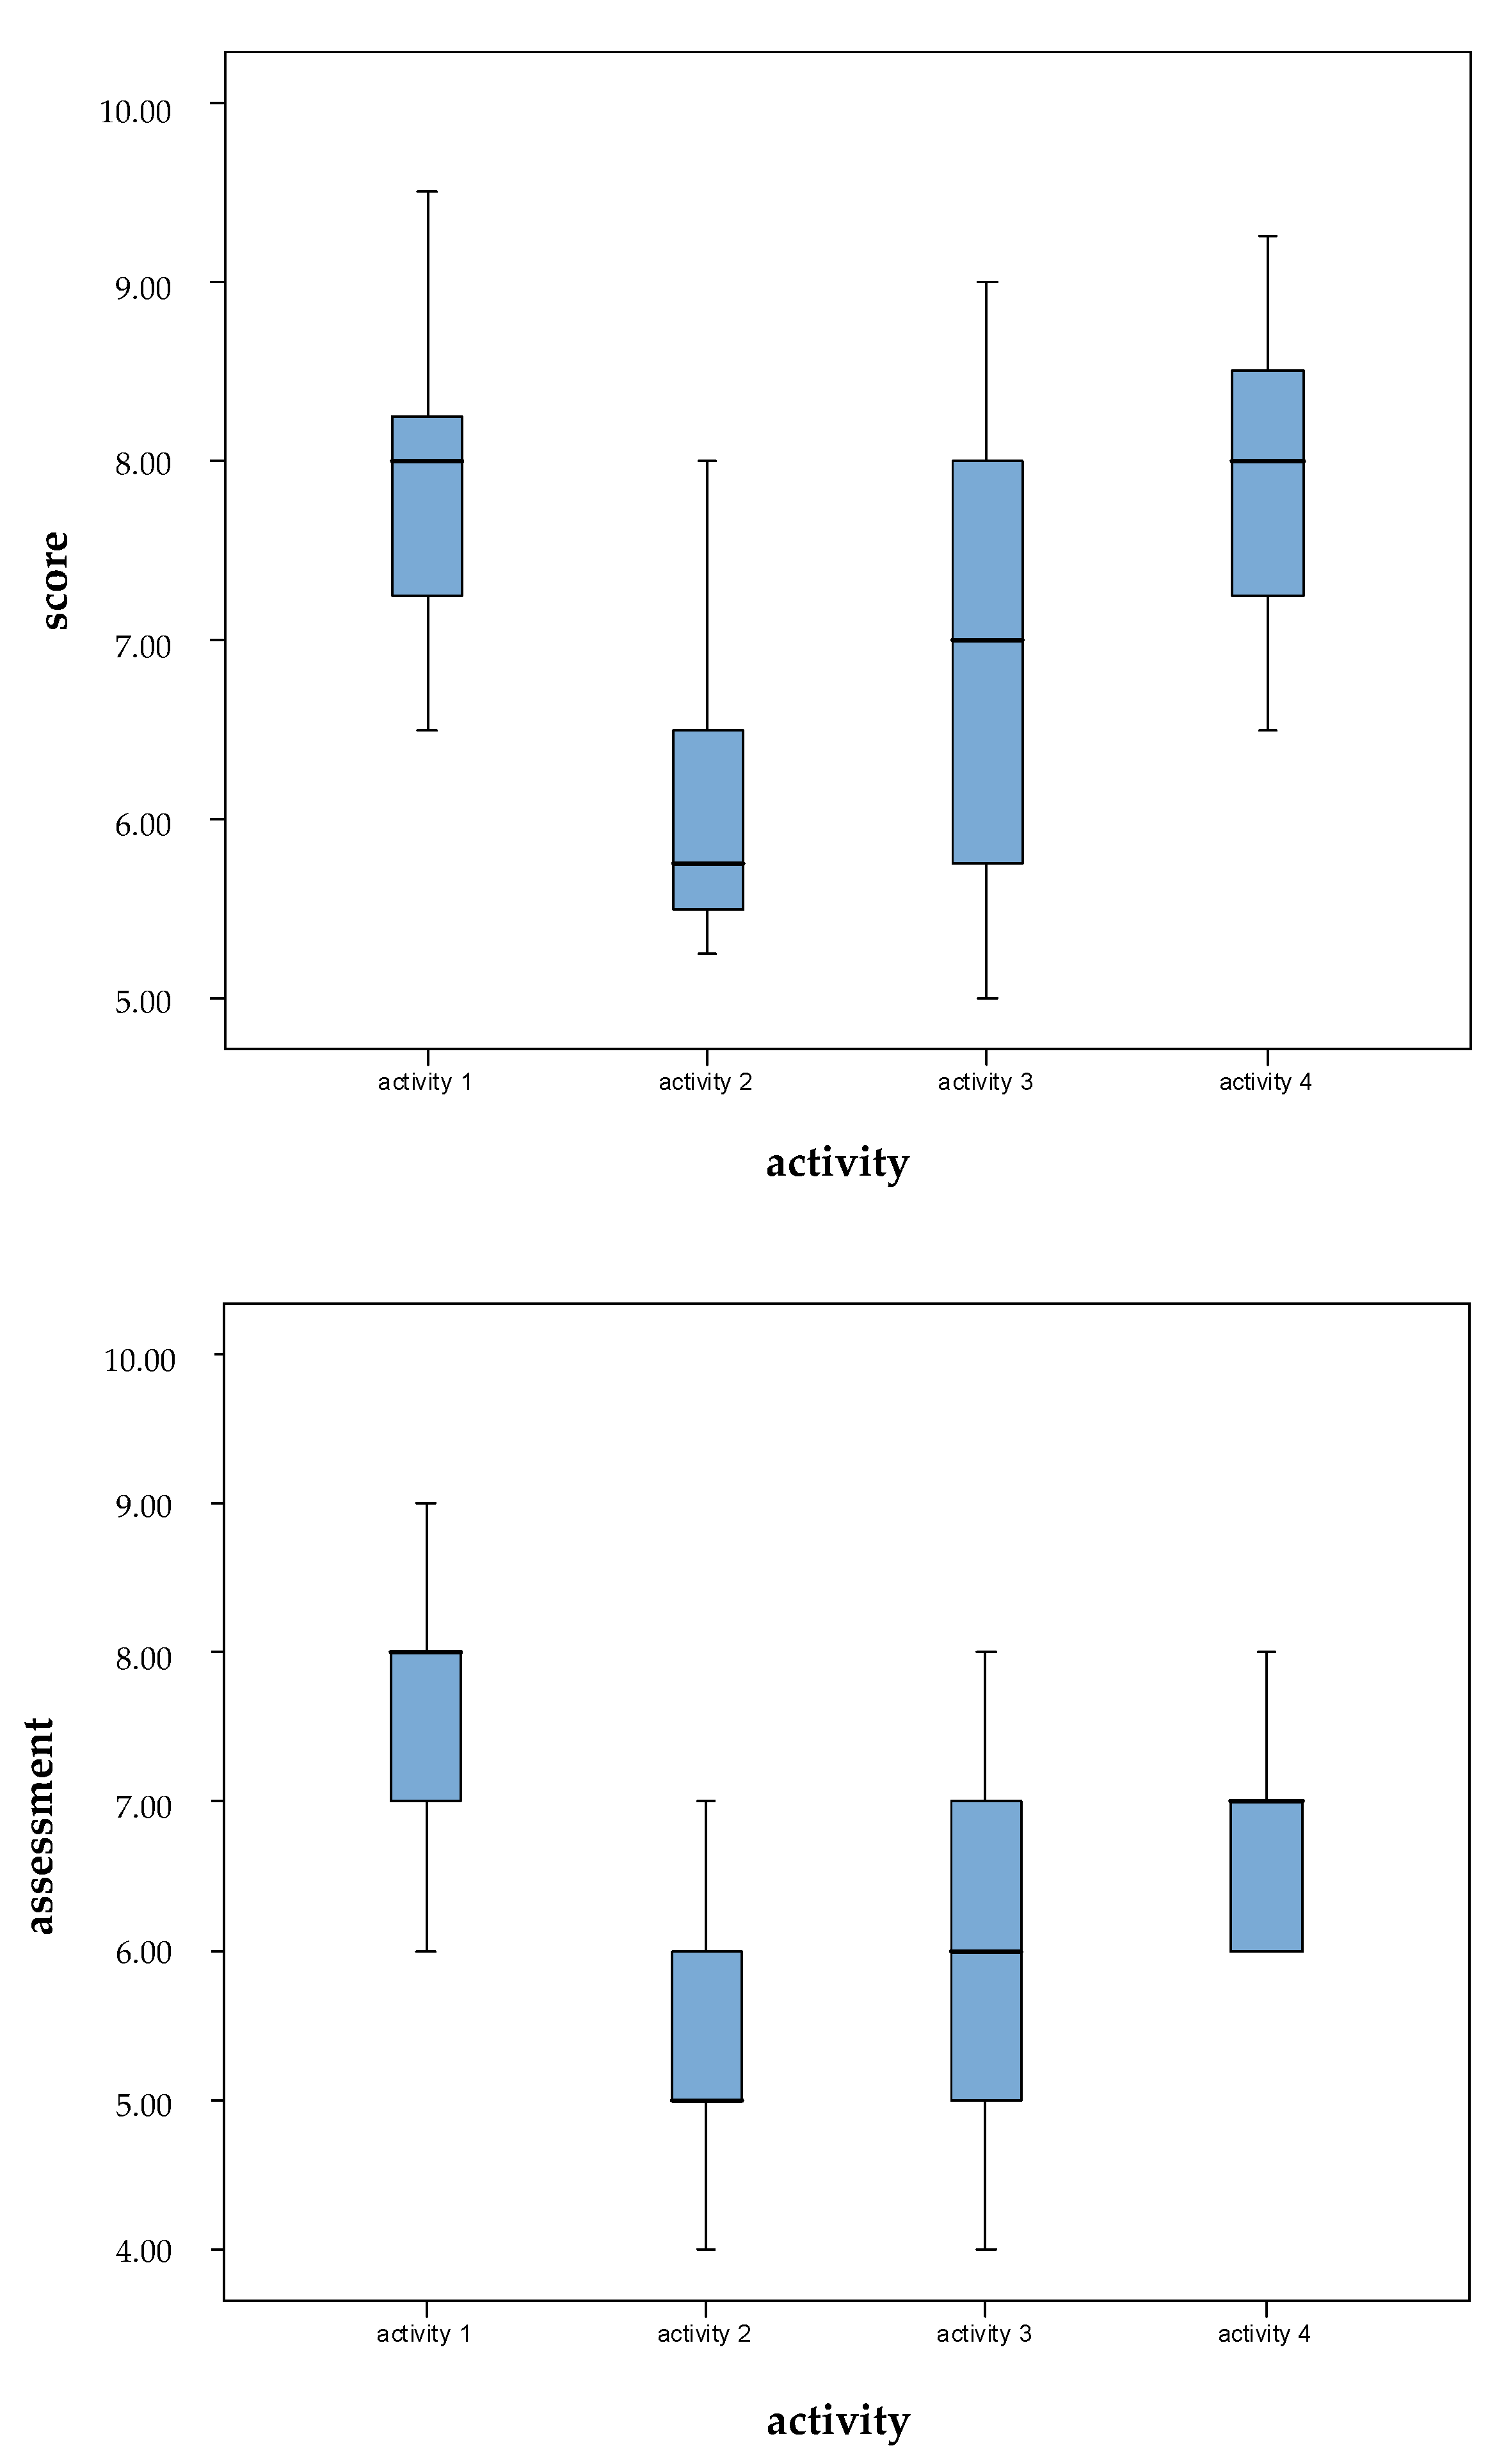
As for the score and valuation recorded for each activity, Figure 3 shows a decrease in both the score and the assessment of activity 2 with respect to activity 1, with activity 3 having the greatest variability.
By performing an analysis of the variance and Levene’s test (Table 8 and Table 9), we find significant differences in both the mean of scores and the mean of assessment of the different e-learning activities, and we find significant differences between variances of scores for two different activities.
As for the comparisons between pairs of activities, we performed the Bonferroni test. Table 10 reports the results. For test scores, activities 1 and 4 were similar to each other and activities 2 and 3 also, with significant differences between these two groups of activities. This means that test scores were similar when students used videos and podcasts to when they used PowerPoint slides and class notes, but they are statistically different from those observed when readings and websites were used. This fact may be due to the difference between active and passive learning. We can see the first and fourth activities as more passive learning methodologies, and the second and third ones as more active learning methodologies.
For student assessments of the activities, since activity 1 has significantly different ratings than the rest, activities 2 and 3 were observed similarly, and activities 3 and 4 also do not have a significant difference between their means. The first activity presents the highest ratings in assessment, and this is statistically significant. Although there are no differences between activities 1 and 4 regarding the final scores obtained, students express their predilection or satisfaction for passive learning through videos and podcasts (activity 1) compared to other learning activities oriented to type of learning “acquisition”.
The fourth activity presents the highest mean of scores but does not have the highest mean of assessment. This activity maintains a classic dynamic, where the material is provided to the students and they do not have to face any methodology other than the usual one. The main difference with a face-to-face classical methodology is the work is asynchronous and autonomous. Comparing the first and fourth activities, we observe that students prefer work with videos and podcasts rather than studying with PowerPoint slides and class notes, but it seems there are no differences in learning if we observe the scores.
Since the second and third activities do not show significant differences, both in scores and assessment, these two activities have very similar behavior. It seems there are no important differences between reading papers and discussing them and visiting websites to find information and answer questions about the topic. In these two activities, students need an extra effort to extract relevant information from sources. Both score and assessment means are lower than means for the first and fourth activities.
Table 11 focuses on the evaluation of the e-learning activities. For each one, students state whether they are agree, disagree or neutral with respect to five items of interest.
Students were generally positive about the value of the e-learning activity. They suggest that the provided materials were adequate for the unit of study on biogas.
We can see that the first activity has the highest percentages of agreement in all items. Items 3 and 4 have a very high percentage of agreement in the first activity (94.1%). It indicates students are very satisfied with the workload and feel they learn better using videos and podcasts than with a face-to-face situation.
The highest neutral percentage is for the second activity, reaching a 35.3% of neutral values for item 3. Although students do not agree, they either do not disagree with whether this activity helps students to learn better than the face-to-face situation. Students think that reading papers (at least the ones they read) and discussing them makes learning neither better nor worse.
The highest percentage of disagreement is for activity 3 and the third item. Activity 3 consists in visiting websites and answering some questions. Item 3 says it helps students to learn better. Looking at the values on Table 11, one can consider that they feel visiting websites does not help them to learn better.
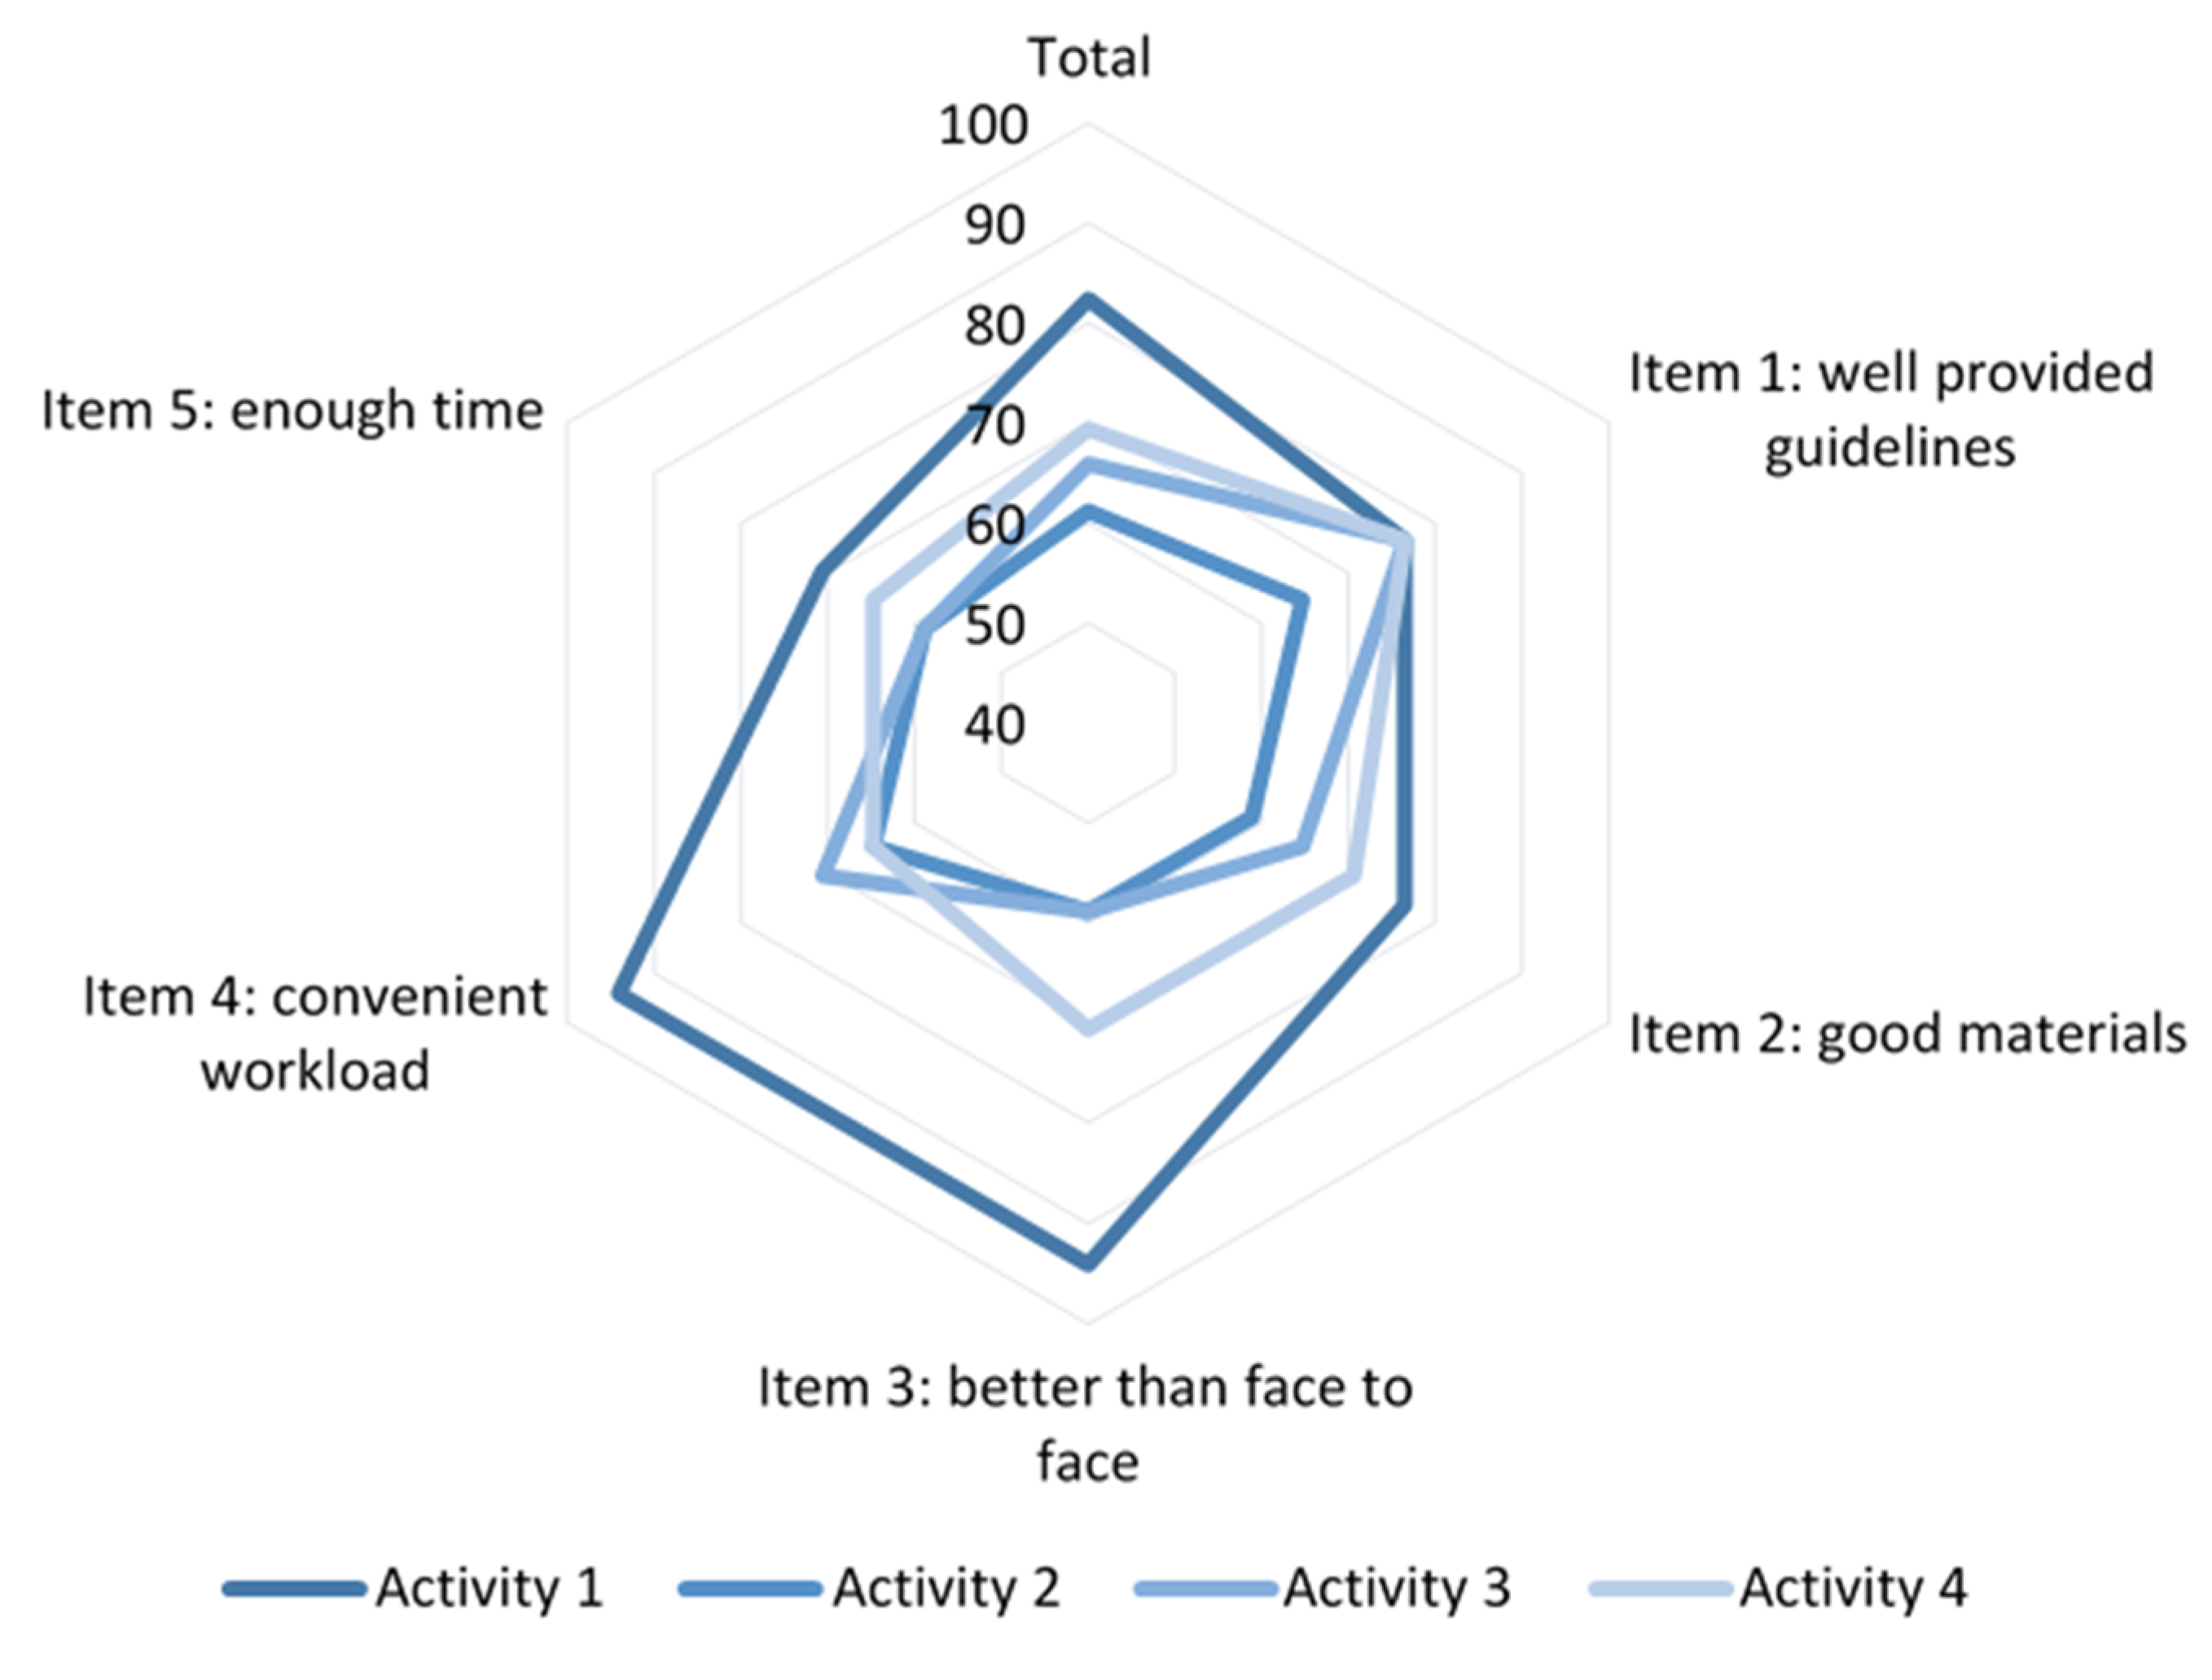
In Figure 4 we observe percentages of agreement for all activities and all items in a radial chart. We can see that the percentage of agreement responses is for all items and all activities over the 50% value. There is a very high percentage of agree responses for items 3 and 4 in the first activity and, for this activity, overall agreement is therefore high as well. The assessment mean for this activity is 7.53, as we can see in Table 3. On the other hand, the lowest agreement percentages are for activity 2. The assessment mean for activity 2 is the lowest one: 5.29 (Table 3). It suggests that agreement on items correlates positively with the satisfaction assessment.
Andersson [10] remarked that there are some important factors that can be considered major challenges for e-learning: (1) support and guidance for students (it can be connected to the type and design of the e-learning activity and explain differences found between them); (2) flexibility: e-learning can be performed for “anytime, anywhere”; (3) access: the access to the technology and the quality of the connectivity are factors that affect the success or failure in e-learning activities [25]; (4) academic confidence: refers to the students’ previous academic experience and qualifications [26]; (5) personal attitudes to e-learning.

3.2. Exploring the Relationship between Scores and Assessment

It can be observed that the scoring and assessment variables had a positive correlation between them; high scores relate to high values in students’ opinion. This can be analyzed by studying the correlation; the value of the Rho Spearman’s coefficient was 0.528, significant value, which indicates a positive relationship with moderate intensity (value between −1 and 1). The Spearman coefficient near to the extremes (−1 or 1) indicates a higher correlation, and, when it is near to the value of 0, it shows a lower connection.
To analyze in depth the relationship between scores and assessment, we split observed values into two groups: scores and assessment less than the value of 7 are considered as “low” and scores/assessment equal to 7 and onwards are considered as “high”. By doing this, the variables are reduced to ordinals and the degree of dependence they present can be better observed.
Table 12 provides a double-entry contingency table that reflects the information.
From the data of Table 13 the Pearson’s chi-squared test of independence was performed and results are summarized in Table 13. This test is useful to assess whether two variables are independent of each other. The result of this contrast is that both variables (ordinals treated) were not independent, but were related to each other.
Table 14 shows some dependency measures.
The value of gamma of 0.742, a symmetrical measure of association suitable for use with ordinal variables, is significant. It indicates moderately positive strong association between the two variables (scores and assessment). Its directional version, Somers’ D, D = 0.428, indicates that the relationship, while consistent, was not entirely so because, although to a lesser extent, there was a percentage of cases in which low values of one variable are not related to low values of the other and high values of one are not related to high values of the other, which are the so-called tied cases.
From the value of lambda, an asymmetrical measure of association that is suitable for use with nominal variables, the relation between variables is not significant (sig. = 0.148). It indicates that knowledge of one of the variables does not significantly reduce uncertainty over the other and therefore it was not helpful in predicting the value of the other, either in general (symmetrically) or in either direction (predicting rating knowing valuation or vice versa).
Finally, the tau value of Goodman and Kruskal shows the strength of association of the data when both variables are ordinal measured. Value of 0.171 was significant, but although there is no absence of association, the value close to zero indicates, like the previous value, that errors do not reduce if we use the information of one of the variables to predict the value of the other. In that sense, the relationship between variables is not useful.
The last analytic method used to explore correlation between score and assessment was binary logistic regression, and the value of the odd ratio (OR) with variables redefined in categorical (low/high). In this case, the OR value is 6.75, that is, the probability of having a high score instead of a low score, is 6.75 times higher for those students who have a high appreciation of the course than for those who express a low rating opinion. Previous research works [27,28,29] also found positive correlations between valuation of the e-learning environment and learning outcomes.

4. Conclusions

Exploratory research such as the e-learning activities described in this study is necessary to understand how to better use online activities to complement the face-to-face learning. From the results of analysis of the variance, there were significant differences in both the average scores and the average assessment of the different e-learning activities.
We found better results in both scores and satisfaction assessments when students performed the most “passive” e-learning activities (watching videos and listening podcasts).
The quantitative study shows a positive and strong correlation between assessment and scores, and we can see a very high advantage for a high exam score in students that have a high satisfaction assessment.
We think it is necessary to study more different e-learning activities, for sustainable energies courses, in order to find balance between a better performance and students’ high satisfaction level.
However, the real progress in designing new learning styles based on the quality learning materials can be evaluated only as a long-term effect.

Supplementary Materials

The following are available online at https://www.mdpi.com/1996-1073/13/15/4022/s1.

Author Contributions

Conceptualization, M.Á.M.-L.; methodology, M.Á.M.-L.; software, N.R.; formal analysis, N.R.; investigation, M.Á.M.-L.; writing—original draft preparation, M.Á.M.-L.; writing—review and editing, M.Á.M.-L. All authors have read and agreed to the published version of the manuscript.

Funding

This research received no external funding.

Acknowledgments

The authors would like to thank the students who participated in the activities during the 2018–2019 and 2019–2020 academic courses.

Conflicts of Interest

The authors declare no conflict of interest.

References

  1. The Future Is now Science for Achieving Sustainable Development. Available online: https://sustainabledevelopment.un.org/content/documents/24797GSDR_report_2019.pdf (accessed on 20 July 2020).
  2. Aksela, M.; Wu, X.; Halonen, J. Relevancy of the massive open online course (MOOC) about sustainable energy for adolescents. Educ. Sci. 2016, 6, 40. [Google Scholar] [CrossRef] [Green Version]
  3. Chu, S.; Majumdar, A. Opportunities and challenges for a sustainable energy future. Nature 2012, 488, 294–303. [Google Scholar] [CrossRef] [PubMed]
  4. Njenga, J.K. E-Learning in Higher Education. In Encyclopedia of International Higher Education Systems and Institutions; Springer: Maine, The Netherlands, 2017; pp. 1–6. [Google Scholar] [CrossRef]
  5. Otto, D.; Becker, S. E-Learning and Sustainable Development. In Encyclopedia of Sustainability in Higher Education; Springer: Cham, Switzerland, 2018; p. 8. [Google Scholar] [CrossRef]
  6. Kirkwood, A. E-learning: You don’t always get what you hope for. Technol. Pedagog. Educ. 2009, 18, 107–121. [Google Scholar] [CrossRef]
  7. Schieffer, L. The Benefits and Barriers of Virtual Collaboration Among Online Adjuncts. J. Instr. Res. 2016, 5, 109–125. [Google Scholar] [CrossRef]
  8. Mercader, C.; Gairín, J. University teachers’ perception of barriers to the use of digital technologies: The importance of the academic discipline. Int. J. Educ. Technol. High. Educ. 2020, 17, 4. [Google Scholar] [CrossRef]
  9. Cohen, E.; Nycz, M. Learning objects and e-learning: An informing science perspective. Interdiscip. J. E-Learn. Learn. Objects 2006, 2, 23–34. [Google Scholar] [CrossRef] [Green Version]
  10. Andersson, A. Seven major challenges for e-learning in developing countries: Case study eBIT, Sri Lanka. Int. J. Educ. Dev. Inf. Commun. Technol. (IJEDICT) 2008, 4, 46. [Google Scholar]
  11. Andersson, A.; Grönlund, A. A conceptual framework for E-learning in developing countries: A critical review of research challenges. Electron. J. Inf. Syst. Dev. Ctries. 2009, 38, 1–16. [Google Scholar] [CrossRef]
  12. Ginns, P.; Ellis, R. Quality in blended learning: Exploring the relationships between on-line and face-to-face teaching and learning. Internet High. Educ. 2007, 10, 53–64. [Google Scholar] [CrossRef]
  13. Paul, J.; Jefferson, F. A comparative analysis of student performance in an online vs. face-to-face environmentl science course from 2009 to 2016. Front. Comput. Sci. 2019. [Google Scholar] [CrossRef] [Green Version]
  14. Sanderson, P.E. E-learning: Strategies for delivering knowledge in the digital age. Internet High. Educ. 2002, 5, 185–188. [Google Scholar] [CrossRef]
  15. Mora, M.C.; Sancho-Bru, J.L.; Iserte, J.L.; Sánchez, F.T. An e-assessment approach for evaluation in engineering overcrowded groups. Comput. Educ. 2012, 59, 732–740. [Google Scholar] [CrossRef]
  16. Wen, H.; Gramoll, K. Group-based Real-time Online Three-Dimensional Learning System for Solid Mechanics. In Proceedings of the 36th ASEE/IEEE Frontiers in Education Conference, San Diego, CA, USA, 27–31 October 2006. [Google Scholar] [CrossRef]
  17. Mavi, D.; Erçağ, E. Analysis of the Attitudes and the Readiness of Maker Teachers Towards E-Learning, with Use of Several Variables. Int. Online J. Educ. Teachnol. 2020, 7, 684–710. [Google Scholar]
  18. Barnard, L.; Lan, W.Y.; To, Y.M.; Paton, V.O.; Lai, S.L. Measuring self-regulation in online and blended learning environments. Internet High. Educ. 2009, 12, 1–6. [Google Scholar] [CrossRef]
  19. Kelly, H.F.; Ponton, M.K.; Rovai, A.P. A comparison of student evaluations of teaching between online and face-to-face courses. Internet High. Educ. 2007, 10, 89–101. [Google Scholar] [CrossRef]
  20. Zhan, G.Q.; Moodie, D.R.; Sun, Y.; Wang, B. An investigation of college students’ learning styles in the US and China. J. Learn. High. Educ. 2013, 9, 169–178. [Google Scholar]
  21. Jochems, W.; van Merriënboer, J.; Koper, R. (Eds.) An introduction to integrated e-Learning. In Integrated e-Learning: Implication for Pedagogy, Technology and Organization; RoutledgeFalmer: London, UK, 2004. [Google Scholar] [CrossRef]
  22. Laurillard, D.; Kennedy, E.; Charlton, P.; Wild, J.; Dimakopoulos, D. Using technology to develop teachers as designers of TEL: Evaluating the learning designer. Br. J. Educ. Technol. 2018, 49. [Google Scholar] [CrossRef]
  23. Stoyanova, S.; Yovkov, L. Educational objectives in e-learning. Int. J. Humanit. Soc. Sci. Educ. (IJHSSE) 2016, 3, 8–11. [Google Scholar] [CrossRef]
  24. Ruiz, G.; Ruiz, J.; Ruiz, E. Indicador global de rendimiento. Rev. Iberoam. Educ. 2010, 52. [Google Scholar] [CrossRef]
  25. Bon, A. Can the Internet in tertiary education in Africa contribute to social and economic development? Int. J. Educ. Dev. Inf. Commun. Technol. (IJEDICT) 2007, 3, 121–133. [Google Scholar]
  26. Li, C.; Irby, B. An overview of online education: Attractiveness, benefits, challenges, concerns and recommendations. Coll. Stud. J. 2008, 42, 449–458. [Google Scholar]
  27. Crawford, K.; Gordon, S.; Nicholas, J.; Prosser, M. Qualitatively different experiences of learning mathematics at university. Learn. Instr. 1998, 8, 455–468. [Google Scholar] [CrossRef]
  28. Lizzio, A.; Wilson, K.; Simons, R. University students’ perceptions of the learning environment and academic outcomes: Implications for theory and practice. Stud. High. Educ. 2002, 27, 27–51. [Google Scholar] [CrossRef]
  29. Watkins, D. Correlates of approaches to learning: A cross-cultural meta-analysis. In Perspectives on Thinking, Learning, and Cognitive Styles; Sternberg, R., Zhang, L., Eds.; LEA: New York, NY, USA, 2001. [Google Scholar]
Figure 1. Box plots of score and assessment in function of academic year.
Energies 13 04022 g001
Figure 2. Box plots of score and assessment in function of type of course.
Energies 13 04022 g002aEnergies 13 04022 g002b
Figure 3. Box plots of score and assessment in function of type e-learning activity.
Energies 13 04022 g003
Figure 4. Radial graphic of agreement percentage for each item in all activities.
Energies 13 04022 g004
Table 1. Distribution of the students who participated and evaluated the e-learning activities by course and academic year.
C1C2
2018–20192019–20202018–20192019–2020
Total number of students registered12181923
Total number of students that participated in the study11171723
Male510913
Female67810
Table 2. Distribution of the e-learning activities between students (groups and treatments).
Type of E-Learning ActivityC1C2
2018–20192019–20202018–20192019–2020
E-learning activity one2456
E-learning activity two3446
E-learning activity three3446
E-learning activity four3545
Table 3. Mean and standard deviation (SD) values for each variable, category and factor group.
Learning EnvironmentScoreAssessmentCount
MeanSDMeanSD
Academic year2018/20197.251.176.541.0428
2019/20207.181.276.181.3840
Type of courseCourse 17.321.286.461.0728
Course 27.131.206.231.3740
Type of e-learning activityActivity 17.900.827.530.7217
Activity 26.100.805.290.7717
Activity 36.851.345.941.0917
Activity 47.990.776.531.1817
Total7.211.236.321.2568
Table 4. Results of the ANOVA analysis for testing the significance of academic year.
Sum of SquaresDegrees of FreedomVariance Estimate (Mean Square)F RatioSig.
ScoreBetween0.07810.0780.0510.822
Within100.498661.523
Total100.57667
AssessmentBetween2.14312.1431.3770.245
Within102.739661.557
Total104.88267
Table 5. Results of Levene’s test for equality of variances (academic year).
Fdf1df2Sig.
Score0.6151660.436
Assessment1.7111660.195
Table 6. Results of the ANOVA analysis for testing the significance of type of course.
Sum of SquaresDegrees of FreedomVariance Estimate (Mean Square)F RatioSig.
ScoreBetween0.59610.5960.3930.533
Within99.981661.515
Total100.57667
AssessmentBetween0.9410.9430.5990.442
Within103.939661.575
Total104.88267
Table 7. Results of Levene’s test for equality of variances (type of course).
Fdf1df2Sig.
Score0.3261660.570
Assessment2.4351660.123
Table 8. Results of the ANOVA analysis for testing the significance of type of e-learning activity.
Sum of SquaresDegrees of FreedomVariance Estimate (Mean Square)F RatioSig.
ScoreBetween41.245313.74814.8300.000
Within59.331640.927
Total100.57667
AssessmentBetween45.941315.31416.6280.000
Within58.941640.921
Total104.88267
Table 9. Results of Levene’s test for equality of variances (type of e-Learning activities).
Fdf1df2Sig.
score3.5923640.018
assessment1.0243640.388
Table 10. Summary of Bonferroni test for type of e-learning activity.
Dependent Variable(I)
Activity
(J) ActivityMean Difference (I-J)Std. ErrorSig.95% Interval
Lower BoundUpper Bound
ScoreActivity 1Activity 21.794120.330250.0000.89492.6933
Activity 31.044120.330250.0140.14491.9433
Activity 4−0.088240.330251.000−0.98740.8109
Activity 2Activity 1−1.794120.330250.000−2.6933−8949
Activity 3−0.750000.330250.159−1.64920.1492
Activity 4−1.882350.330250.000−2.7815−0.9832
Activity 3Activity 1−1.044120.330250.014−1.9433−0.1449
Activity 20.750000.330250.159−0.14921.6492
Activity 4−1.132350.330250.006−2.0315−0.2332
Activity 4Activity 10.088240.330251.000−0.81090.9874
Activity 21.882350.330250.0000.98322.7815
Activity 31.132350.330250.0060.23322.0315
AssessmentActivity 1Activity 22.235290.329160.0001.33913.1315
Activity 31.588240.329160.0000.69202.4845
Activity 41.000000.329160.0210.10381.8962
Activity 2Activity 1−2.235290.329160.000−3.1315−1.3391
Activity 3−0.647060.329160.322−1.54330.2492
Activity 4−1.235290.329160.002−2.1315−0.3391
Activity 3Activity 1−1.588240.329160.000−2.4845−0.6920
Activity 20.647060.329160.322−0.24921.5433
Activity 4−0.588240.329160.472−1.48450.3080
Activity 4Activity 1−1.000000.329160.021−1.8962−0.1038
Activity 21.235290.329160.0020.33912.1315
Activity 30.588240.329160.472−0.30801.4845
Table 11. Observed answers (D = Disagree, N = Neutral, A = Agree) for items focusing on quality of e-learning activities. Data in % except global punctuation (assessment) in absolute number about a maximum of 10.
ItemType of E-Learning Activity
Activity 1Activity 2Activity 3Activity 4
DNADNADNADNA
15.917.676.511.823.564.75.917.676.511.811.876.5
211.811.876.511.829.458.811.823.564.711.817.670.6
30.05.994.15.935.358.823.517.658.811.817.670.6
45.90.094.111.823.564.711.817.670.617.617.664.7
517.611.870.617.623.558.817.623.558.817.617.664.7
Total8.29.482.411.827.161.214.120.065.914.116.569.4
Table 12. Multivariate frequency distribution of the scores and assessment classified by levels (low/high).
Score
LowHigh
AssessmentLow2016
High527
Table 13. Results of Pearson’s chi-squared test of independence.
ValuedfAsymp. Sig. (2-Sided)Exact Sig. (2-Sided)Exact Sig. (1-Sided)
Pearson’s Chi-Squared 11.619 b10.001
Continuity Correction a9.96510.002
Likelihood Ratio12.24710.000
Fisher’s Exact Test 0.0010.001
Linear-by-Linear Association11.44810.001
N of Valid Cases68
a Computed only for a 2 × 2 table. b 0 cells (0.0%) have expected count less than 5. The minimum expected count is 11.76.
Table 14. Summary of different correlation tests.
ValorStd. Error aProximate T b Proximate Sig.
LambdaSymmetric0.2630.1671.4450.148
Assessment as dependent0.3440.1661.7130.087
Score as dependent0.1600.2200.6690.504
Tau of Goodmanand KruskalAssessment as dependent0.1710.087 0.001 c
Score as dependent0.1710.087 0.001 c
d of SomersSymmetric0.4130.1063.8050.000
Assessment as dependent0.4280.1093.8050.000
Score as dependent0.3990.1053.8050.000
GammaSymmetric0.7420.1333.8050.000
N of Valid cases68
a Not assuming the null hypoythesis. b Using the asymptotic standard error assuming the null hypothesis. c Based on chi-square approximation.

