Article

Underground Pumped Storage Hydropower Case Studies in Belgium: Perspectives and Challenges

1
Aero-Thermo-Mecganics Department, Université libre de Bruxelles, 1050 Brussels, Belgium
2
Department of Civil, Structural and Environmental Engineering, Trinity College, The University of Dublin, 2 Dublin, Ireland
3
Laboratory for Hydraulic Machines, École Polytechnique Fédérale de Lausanne (EPFL), 1007 Lausanne, Switzerland
*
Author to whom correspondence should be addressed.
Energies 2020, 13(15), 4000; https://doi.org/10.3390/en13154000
Submission received: 1 June 2020 / Revised: 15 July 2020 / Accepted: 16 July 2020 / Published: 3 August 2020
(This article belongs to the Special Issue Underground Pumped Storage Plants)

Abstract

:
To avoid the geographical and topographical prerequisites of the conventional pumped hydro energy storage, the use of underground cavities as water reservoirs allows countries without steep topography, such as Belgium, to increase the potential of the energy storage capacity. Belgium abounds in disused mines and quarries convertible into water basins. In this article, two Belgian case studies are presented and discussed for their singularity. A slate quarry in Martelange is discussed in technical aspects proposing three operating scenarios. Moreover, a preliminary economic analysis of the underground pumped storage system and a greenhouse gas emission evaluation for the storage system’s lifetime are presented. The analysis for a 100 MW power plant estimates a total initial investment of over 12 million euros and two million of CO 2 avoided over its lifetime. This article also proposes the use of the coal mine 500 m deep of Pérronnes-lez-Binche. The mine representation discussed here offers a high energy capacity, but the substantial head drop (from about 500 to 200 m) challenges the selection of the hydraulic turbomachinery. A 1D simulation computed in SIMSEN draws out the behaviour of the unusual hydraulic configuration of turbines in series.

1. Introduction

The Belgian energy system is facing essential challenges in reducing its dependence on fossil fuels [1]. Investing in energy efficiency and converting the actual energy-mix towards a higher share of renewable energy resources are the next goals of the country in agreement with the latest European directives [2]. In the last decade, the power generation mix and the energy markets have been affected by growing development in renewable energy sources (RES). The green certificate system in support of RES facilities has been particularly useful as its share has increased from 3.6% in 2000 to 26.9% in 2018 (the production has increased by 6.6 times in 18 years) [3]. With the spreading of these new environmentally-friendly policies, the energy transmission and distribution systems have to tackle the variability of renewable sources while the power demands from industry and householder are not diminishing [4].
To be able to maintain the grid frequency near to its nominal values (grid quality), different wholesale markets have been set up, and they play on different time horizons, related to actual production and consumption. In the long term, producers and consumers can negotiate large volumes of electricity on futures markets with monthly, quarterly, and yearly maturities [5]. They protect themselves against unpredictable fluctuations in energy prices. In Belgium, futures contracts are negotiated on the ICE Index [6] and the European Energy Exchange (EEX). Another possibility is that two companies enter into a contract with each other, often referred to as an over-the-counter contract (OTC). The day before the actual delivery, a more accurate estimate of demand is possible based on internal and international information and events likely to influence demand, for example, weather data. Producers, suppliers, and large industrial consumers, therefore, negotiate on the day-ahead market. It is generally organised as an auction market, based on the economic priority curve [7]. In Belgium, the day-ahead market is managed by EPEX SPOT Belgium [8]. Electricity is negotiated on an hourly basis. In reality, the day-ahead demand forecast will never be fully accurate. The supply will also be different from expectations due to changes in wind, sunlight, or unexpected plant outages [9]. This is why the third type of market has been created: the intraday market. It allows market participants to correct their injection or withdrawal on the network shortly before actual delivery. In Belgium, the continuous intraday market is also organised by EPEX SPOT Belgium [8].
In the most recent analysis of the Belgian adequacy and flexibility for 2020–2030, the national transmission system operator (TSO) projects a need for a more than 40% increase in flexibility compared to 2020 [10]. Potential sources of flexibility include flexible production, demand-side management, interconnection, and energy storage facility. Pumped hydro energy storage (PHES) is viewed as a technically reliable solution, however, its investment costs, and more specifically the cost of reservoir excavation, are often considered too high [11]. An important task for the future remains thus acknowledging that the solution using existing reservoirs can be an economically feasible alternative.
Given the recent developments in the power industry and the current shift to renewable generation, energy storage is increasingly considered as a future key player in the industry [12,13]. However, for PHES projects to be developed, the economics of energy storage must be assessed, which includes the study of the achievable revenues. Those can come from two sources. On the one hand, from the shift of energy generation/consumption. The value arising from this action derives from price arbitrage on power markets. On the other hand, energy storage can provide TSOs with reserves for ancillary services, thereby taking part in the real-time balancing of supply and demand of electricity [5,8]. This energy reserve consists of idly running power generating systems, being able to start up very quickly, to react in cases of failures of other generators, failures on lines, or blackouts. According to the agreement, the plant must respond within seconds or minutes and for a defined amount of power [14]. In order to be able to operate as a spinning reserve, the systems need to have a fast reaction time and maintain a level of charge ready to respond to promptly. A parallel pipeline dedicates to pumping need to be installed to the one for generating to assure the constant capacity availability. However, this would represent an additional level of complexity in the frame of energy management and infrastructure [15].
Concerning the storage capacity required in the event of the Belgian nuclear reactors phase-out, set to be from 2022 to 2025, the various scenarios remain vague until today. The future Belgian energy-mix would be shaped by the energy transition toward 100% renewable in 2050, as declared by European Union [16], and thus by high variability of the power resources [17]. What is known is that today Belgium is not able to count on sufficient renewable energy storage capacity to compensate for the nuclear shutdown. The national storage capacity is currently 1.3 GW, which is comparable to that of a modern nuclear power plant, but it can run for 3 to 4 h only. Most of the totality of the capacity relies on pumped hydro energy storage (PHES) technology, which uses the potential energy kept by water pumped in an upper reservoir [18]. The higher the difference between the two basin water levels, namely the head, the higher the stored capacity [18].
Due to its geomorphology condition, Belgium does not have promising sites for other conventional PHES with sufficient head and surface [11]. Therefore, underground pumped storage hydroelectricity (UPSH) facilities could represent a valuable solution in increasing the national energy storage capacity [19]. In these systems, the hydropower head is obtained by exploiting the depth of an underground cavity instead of elevated reservoirs. However, the use of underground cavities as lower reservoirs for hydropower applications is not widespread [20] and its technology has not yet passed the research and development phase.
In this context, this paper provides a set of preliminary economic and technical considerations, applied to two different cases for UPSH located in the Walloon region in Belgium. This work defines and details the main characteristics of potentially exploitable sites to carry out a pumped storage arrangement reusing existing surfaces or underground cavities as reservoirs. Two UPSH case studies present different hydrogeological contexts: a former slate quarry of Martelange in the Luxembourg province and a representation of a coal mine in the Hainaut province. They are separately presented and each proposed analysis points out the major challenges and opportunities that this kind of energy storage system should consider and achieve. Developments of innovative hydraulic systems setup are carried out in light of the characteristics of the investigated coal mine and the slate quarry. Furthermore, environmental and economic aspects for the Martelange case are projected at the end of its life used as a water storage reservoir.
Section 2 presents the literature review of the technology and existing projects on the UPSH, within the turbomachinery specifics. In Section 3, the case study of a UPSH exploiting the slate quarry of Martelange is described: the turbomachinery selection, preliminary cost-benefit analysis and insight on environmental impact on CO 2 emissions are presented. Section 4 illustrates the second case study of a pumped storage system that uses a Belgian old coal mine. Different scenarios of turbines’ implementation are simulated to cope with the specificity of the underground cavity. Section 5 gives an outline towards the results and the challenges to establish the innovative contribution of the UPSH system for future energy storage. The conclusions are provided in Section 6.

2. Literature Review

2.1. Underground Pumped Storage Hydroelectricity

The patent for underground energy storage applied to hydropower is to R. A. Fessenden, being the first to record the idea of "placing the lower reservoir, not on the surface of the earth, but subterraneously, so as to have a high negative gravitation potential with reference to the earth’s surface" [21]. Nowadays, there is no evidence of an existing underground pumped hydro system but a few research projects worldwide in the attempt to re-valuate abandoned quarries or mines. In the early 1980s, a preliminary geological investigation was conducted to find a suitable site in the Netherlands, pointing to the limestone rock of South Limberg to a reservoir at about 1000 m depth [22]. In Belgium, the project Smart-water had the objective of collecting the tools and information in socio-legal, economic, hydraulic, and hydro-geologic aspects to detect specific underground sites in the Walloon region for energy storage use [20,23]. In another research project, because of the lack of topographical reliefs in Singapore, the Bukit Timah granite quarry has been evaluated as the lower reservoir for a UPSH plant of 370 MW, which was found economically comparable to an oil-fired plant at the time [24]. In Germany, the coal mine of Prosper-Haniel has been studied as a lower reservoir for a closed-loop UPSH or in an open system, presenting the challenges of the rock stability, its porosity, and the composition of the used water [24,25]. In Minnesota, USA, ten sites are analysed and explained to produce caverns that could be used as the lower reservoir in a PHES [19,26]. In New Jersey, an iron mine was proposed as the lower reservoir for a UPSH but the Mount Hope project [27] never went further. Also, Australia, Estonia, and Finland have shown recent interest in UPSH solutions with the respective Bendigo [28], Muuga [29], and Callio [30] projects.
In the framework of a UPSH plant, not all types of soil have adequate characteristics. Soft sediments and friable rocks cannot withstand the erosion created by the generating-pumping cycles of UPSH facilities and porous rocks are thus unsuitable as underground water reservoirs [31]. Indeed, coal and metalliferous mines as slate and black marble quarries could be taken into account for their rock stability. Groundwater interactions and oscillations in piezometric heads by the influence of hydraulic conductivity of the surrounding aquifer are possible but are limited [32], as the head variation depends heavily on the flow rate pumped from or injected in the cavity. Pujades E. et al. have estimated the groundwater exchanges positively as they mitigate the head variation due to regular operation of the turbomachinery [23].
In Belgium, the exploitation of coal mines became historically intense with the usage of heavy machinery for extraction and more powerful dewatering pumps in the 18th century. In 1900, Belgium was counting over 300 mines for a total of about 20 million tons of national production, second only to England. After that, the production starts declining, recording the closure of the last coalfield in the Sambre-Meuse Valley in 1984. What is left today in Belgium is a very high number of abandoned mines and quarries coming from an important but now passed mineral-processing industry. New use of these underground cavities could represent a chance to strengthen the Belgian energy storage capacity.
Today, only two PHES facilities are located in Belgium. Table 1 shows their main specifications.
The Coo-Trois-Ponts was constructed in two stages: the first operation in 1971 installed three single stage reversible pump turbines totalling 474 MW. In 1980, another three units of larger capacity were added. Coo was built originally in complement to nuclear development for stand-by black start power and flexibility needs. This plant is characterised by a roundtrip efficiency of 75%, while the Plate-Taille PHES plant reaches 70% [33]. The latter has a smaller power capacity and it runs four reversible Francis turbines of 36 MW each, commissioned in 1981 [34].

2.2. Turbomachinery Options in UPSH

The turbomachinery selection in a UPSH, as in all conventional hydropower plants, is critical for a positive power outcome and financial availability [19]. In pumped hydro energy storage systems, hydraulic turbines produce energy when needed from the potential energy stored in the upper water reservoir; low-cost electricity power (during off-peak time) feed hydraulic pumps and restore the capacity of the upper reservoir from the lower one. The ternary-set solution consists of three separate groups of turbine, pump, and motor/generator coupled on the same shaft. Both the pump and the turbine are optimised for selected operating conditions and guarantee the highest hydraulic performance. The current trend is nevertheless replacing them with reversible groups. Reversible pump-turbines (RPTs) are indeed commonly used in pumped hydro energy storage systems [35,36]. These machines are designed to run in both pumping and generating modes reducing the required volume (reducing excavation costs) and fittings. However, the hydraulic design of the runner implies higher costs due to its double function. Francis turbine runner and a centrifugal impeller pump have significant differences in design; in particular, the Francis runner has shorter channels and higher entrance angles that make it incompatible for a good operation in pump; for the latter, the flow being slowed, the boundary layers would be too exposed to flow detachment [36,37]. The design of a reversible turbine must in principle be designed as a pump impeller which, in reverse operation, will work in a turbine mode. In general, this layout makes the hydraulic efficiency of one reversible runner be lower than a normal Francis runner [37]. In this context, it is further noted that if the optimal yields in the pump and turbine of a reversible runner have a similar value, the optimal operating points do not coincide at equal speed for both directions of rotation. In particular, the specific energy transferred to the fluid in pumping is less than the available specific energy during generation. In other words, energy available to the turbine is equal to the gross mass energy—corresponding to the altitude difference between upstream and downstream water levels—reduced by pressure losses of the hydroelectric plant while the delivered pump’s energy must be equal to the gross mass energy plus the related load losses.
The main drawback of a reversible turbine is the requirement of reversing the direction of rotational speed to pass from turbine operation to pump operation (or vice versa) [38], which lengthens the time required for these operations. Furthermore, the pump start is not easier than for a ternary group. It must be insured with an auxiliary turbine, a static frequency converter, an asynchronous generator-motor start, the pump being eventually disengaged to decrease the resilient torque. Another drawback of the reversible turbine is that the distributor-diffuser, necessary to adjust the operation in turbine, creates operational difficulties in pump mode; this element is then strongly stressed by pressure fluctuations at the wheel outlet, and precautions should be taken to avoid too strong vibrations. Finally, the reversible turbine does not allow choosing a higher generated power than consumed in pumping; due to the very design of these machines, if the rotation speeds are equal for both speeds, these powers are at most substantially equal.
Impulse turbines do not fit in the UPSH plant for their operating concept unless there is not a high vertical growth of the lower reservoir. Their runner is always at ambient pressure, and its efficiency would drop considerably if submerged [39] as it could happen in a powerhouse beneath the lower reservoir.
In recent times, pump as turbine (PAT) have been used for pico- and micro-power generation, but very few manufacturers offer PATs larger than 1 MW in size. In such a system, a pump operates in reverse so that it functions as a turbine. Baumgarten et al. [40] propose that the significant benefit is that mass production of pumps means that they are comparatively much more cost-effective than conventional turbines. Nourbakhsh et al. [41] state that pumps are relatively simple and easy to maintain and have a maximum competitive efficiency when compared to conventional turbines, Novara et al. [42] describe a cost model for the use of pumps as turbines. The efficiency of the pump in turbine mode usually lays lower than conventional hydro turbines, but the primary advantage of using a PAT instead of a traditional hydro turbine is the potential cost savings. Difficulties arise in the prediction of the PAT efficiency [43]: they are not designed to run in reverse mode, and the four-quadrant diagnostic tests are not usually performed by the manufacturers to maintain a low price. Very few cases of small-scale energy storage use PATs. Manolakos et al. describe a micro-hydraulic storage system that implements a PAT for micro hydropower production in Donoussa island, Greece, [44]. In Tournai, Belgium, a single centrifugal PAT is integrated with a variable speed driver and it is used for both pumping and generating phases in a micro smart-grid to cope with the intermittent production of renewable energy [45].
Table 2 resumes the hydraulic turbines characteristics in relation to UPSH, and Figure 1 gives a graphical representation of the turbine’s applications.

3. The Slate Quarry of Martelange Case Study

3.1. Hydropower Plant Description

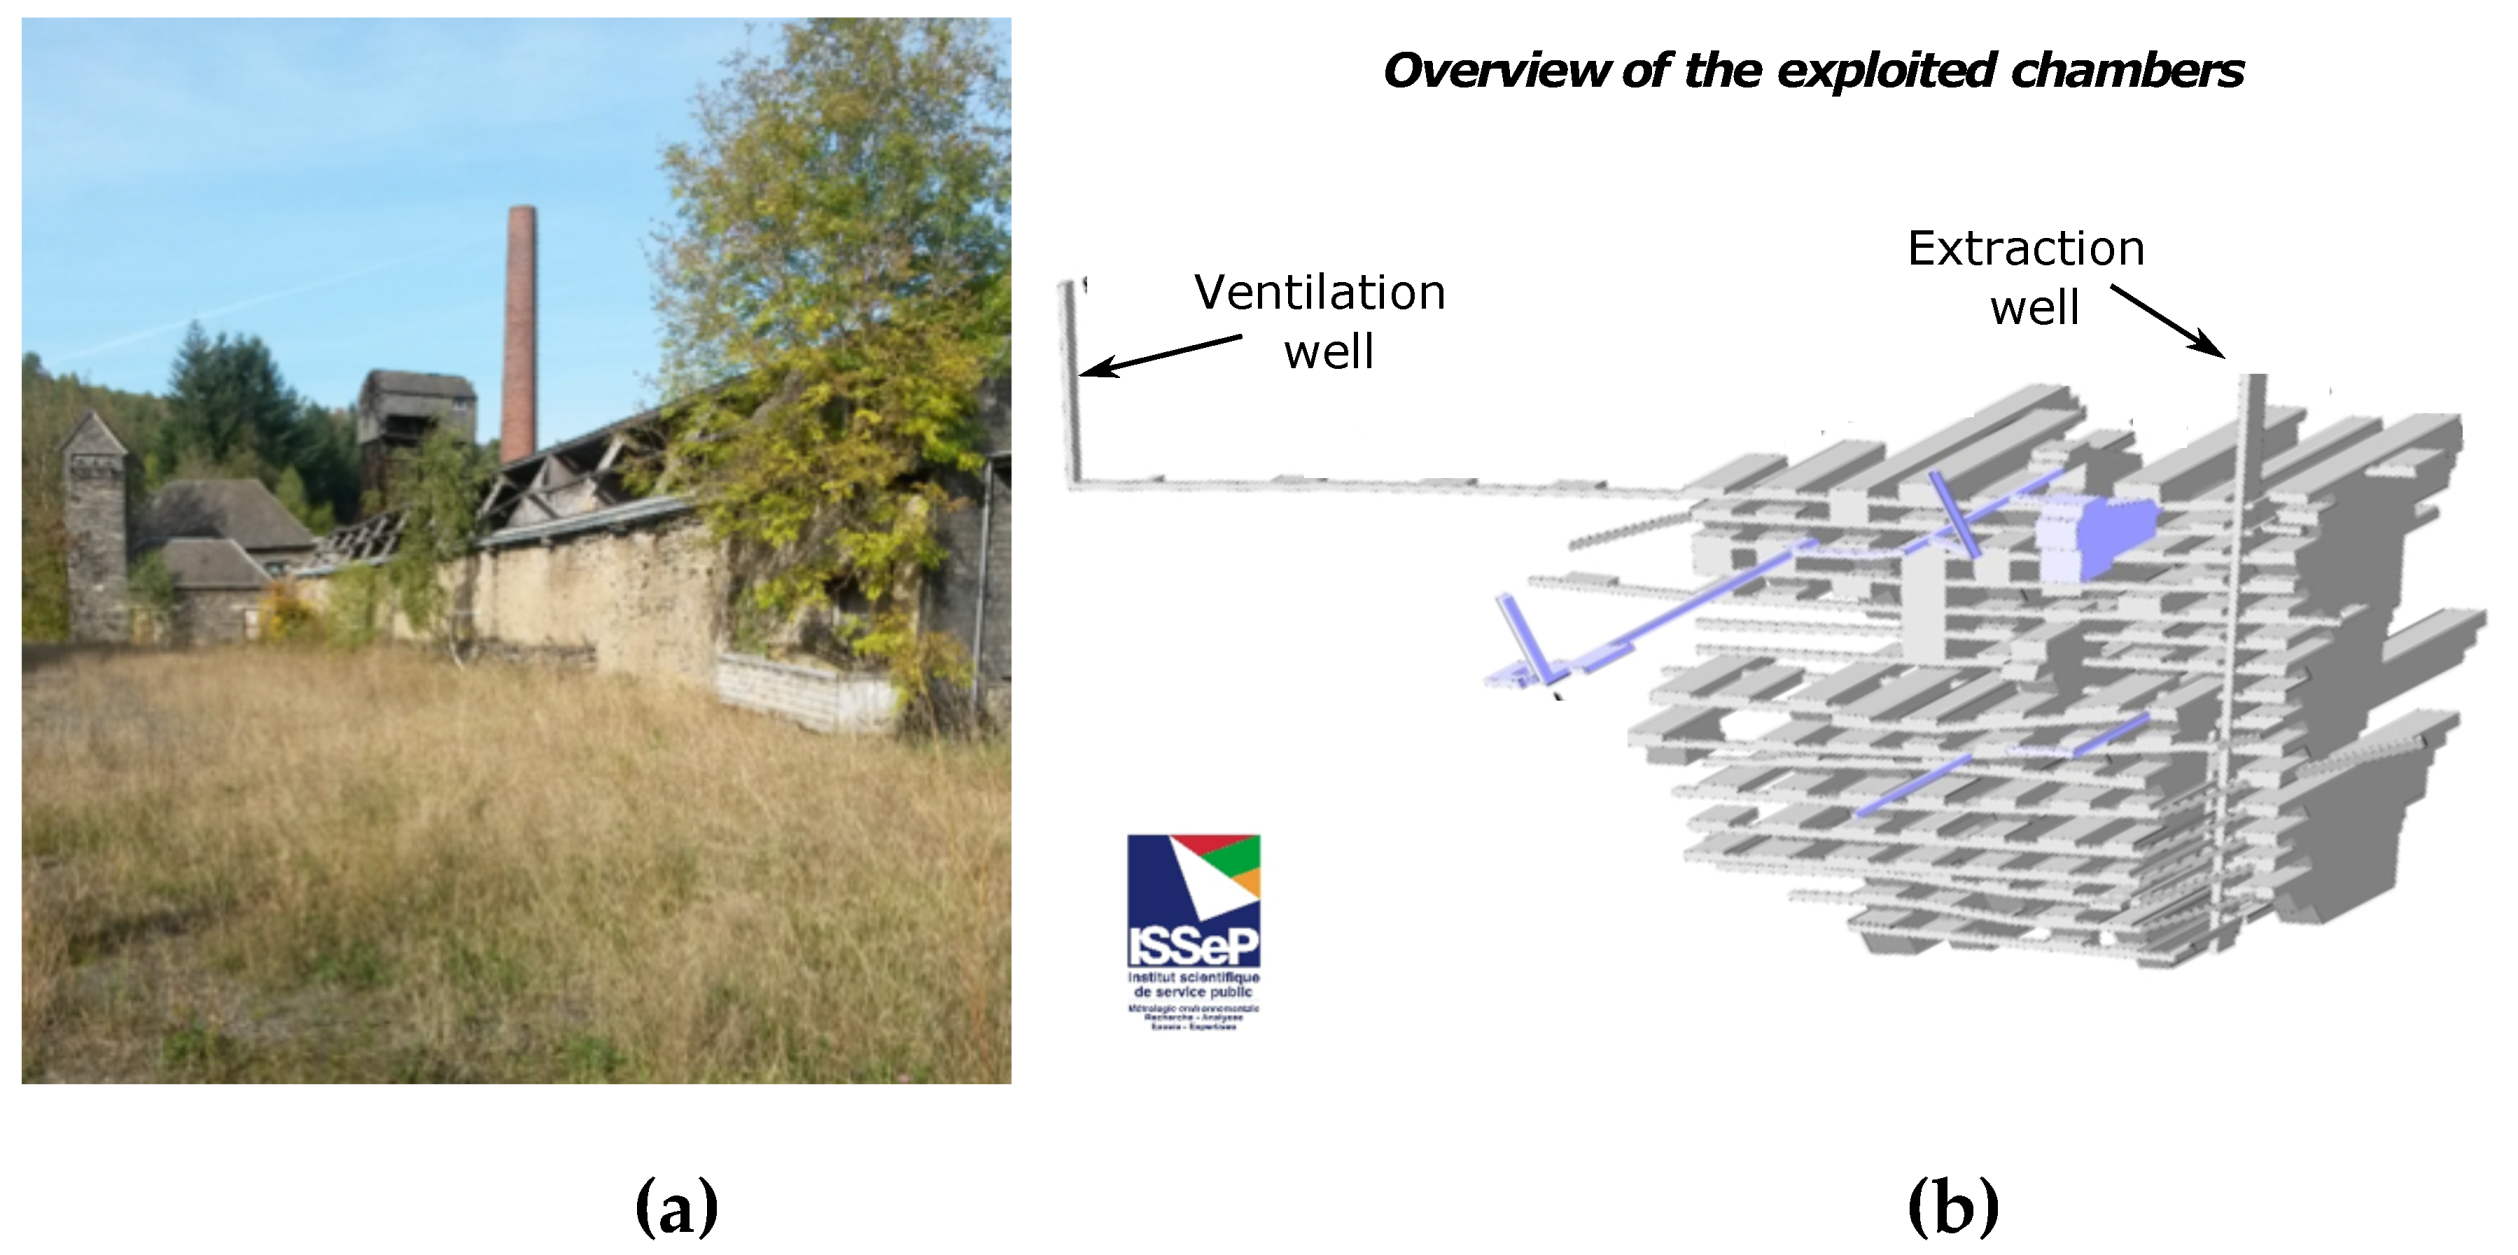
The proposed site is situated at the edge of the municipality of Martelange at 380 m above sea level in the province of Luxembourg, Belgium, by the Sauer river. The site is an abandoned slate mine, where the last activities stopped in 1995, and many of the above-ground infrastructures still stand at the location (see Figure 2a). It should also be noted that underground quarries are generally not to be included in water reservoir selection because of unacceptable risks of the instability of the overlying base by relatively shallow exploitation. Slate quarries are, however, an exception in this respect, given the nature of the material mined in highly inclined decametric layers and having, therefore, led to deep cavities of impressive size, low porosity, and low permeability.
Today, the underground water-leaks flooded the quarry of Martelange that consists of 9 distinguishable cavern structures, of which the deepest runs over 17 floors (see Figure 2b). The highest room is over 50 m in height and the longest one over 85 m in length, running over a total depth of 180 m. The existing excavated void volume in the mine is estimated to be around 1,700,000 m 3 . However, it was determined that, including the nine main caverns and secondary cavities, only about 800,000 m 3 is the maximum available for storage by leaving the lowest part of the cavities filled with water permanently [20]. In this way, this would shorten the total gross head at 160 m, but emptying the reservoir at its maximum represents additional costs and technical challenges, and finally, the major part of the available volume lies in the upper part of the quarry.
The nearby Haart hill represents a convenient location for the upper reservoir of the PHES plant in Martelange. At 470 m above sea level, the upper plateau of the hill is at a distance of approximately 550 m. Figure 3 illustrates the location of Martelange and the head gap from Haart hill and the mine [48]. Taking into consideration the depth of the mine, a height difference of 250 m is thus available. On the fields on this plateau, the upper reservoir of the same capacity as the lower reservoir can be built. Here, high voltage (220 kV) powerlines exist, the length of transmission lines needed from the power station towards the electricity grid is thus largely reduced, reducing the transmission losses significantly. The cadastral information shows that multiple and diverse individuals and companies own the land parcels in the zone of interest (Figure 3). In order to be able to install the upper reservoir and the penstock tunnels, agreements must be formed with all parties owning a land parcel that would be implicated in the construction. This agreement can resolute accepting the installation of the system on their property, or in transferring the ownership of the land parcel. Close to the underground caverns, the Sauer river runs, which could provide the water needed to fill up the reservoirs initially and can also provide a way of collecting the surplus water in case of emergencies. However, this river also leads to specific challenges, as it provides drinking water to the reservoir in ’Lac de la Haute-Sûre’, Grand Duchy of Luxembourg. Strict regulations are applied to the water quality of this river and would have important implications in terms of water potability and water supply obligations [49].

3.2. Turbomachinery Selection

Based on the possible two options for the upper reservoir, one on the Haart hill or exploiting the basin by the Sauer river, different turbomachinery configurations are presented for this case of study:
(A)
A single hydraulic turbine type Francis under a head of 160 m and by exploiting an upper reservoir at ground level (by the river).
(B)
A Francis turbine installed for a gross total head of 250 depth by using the upper reservoir on Haart hill.
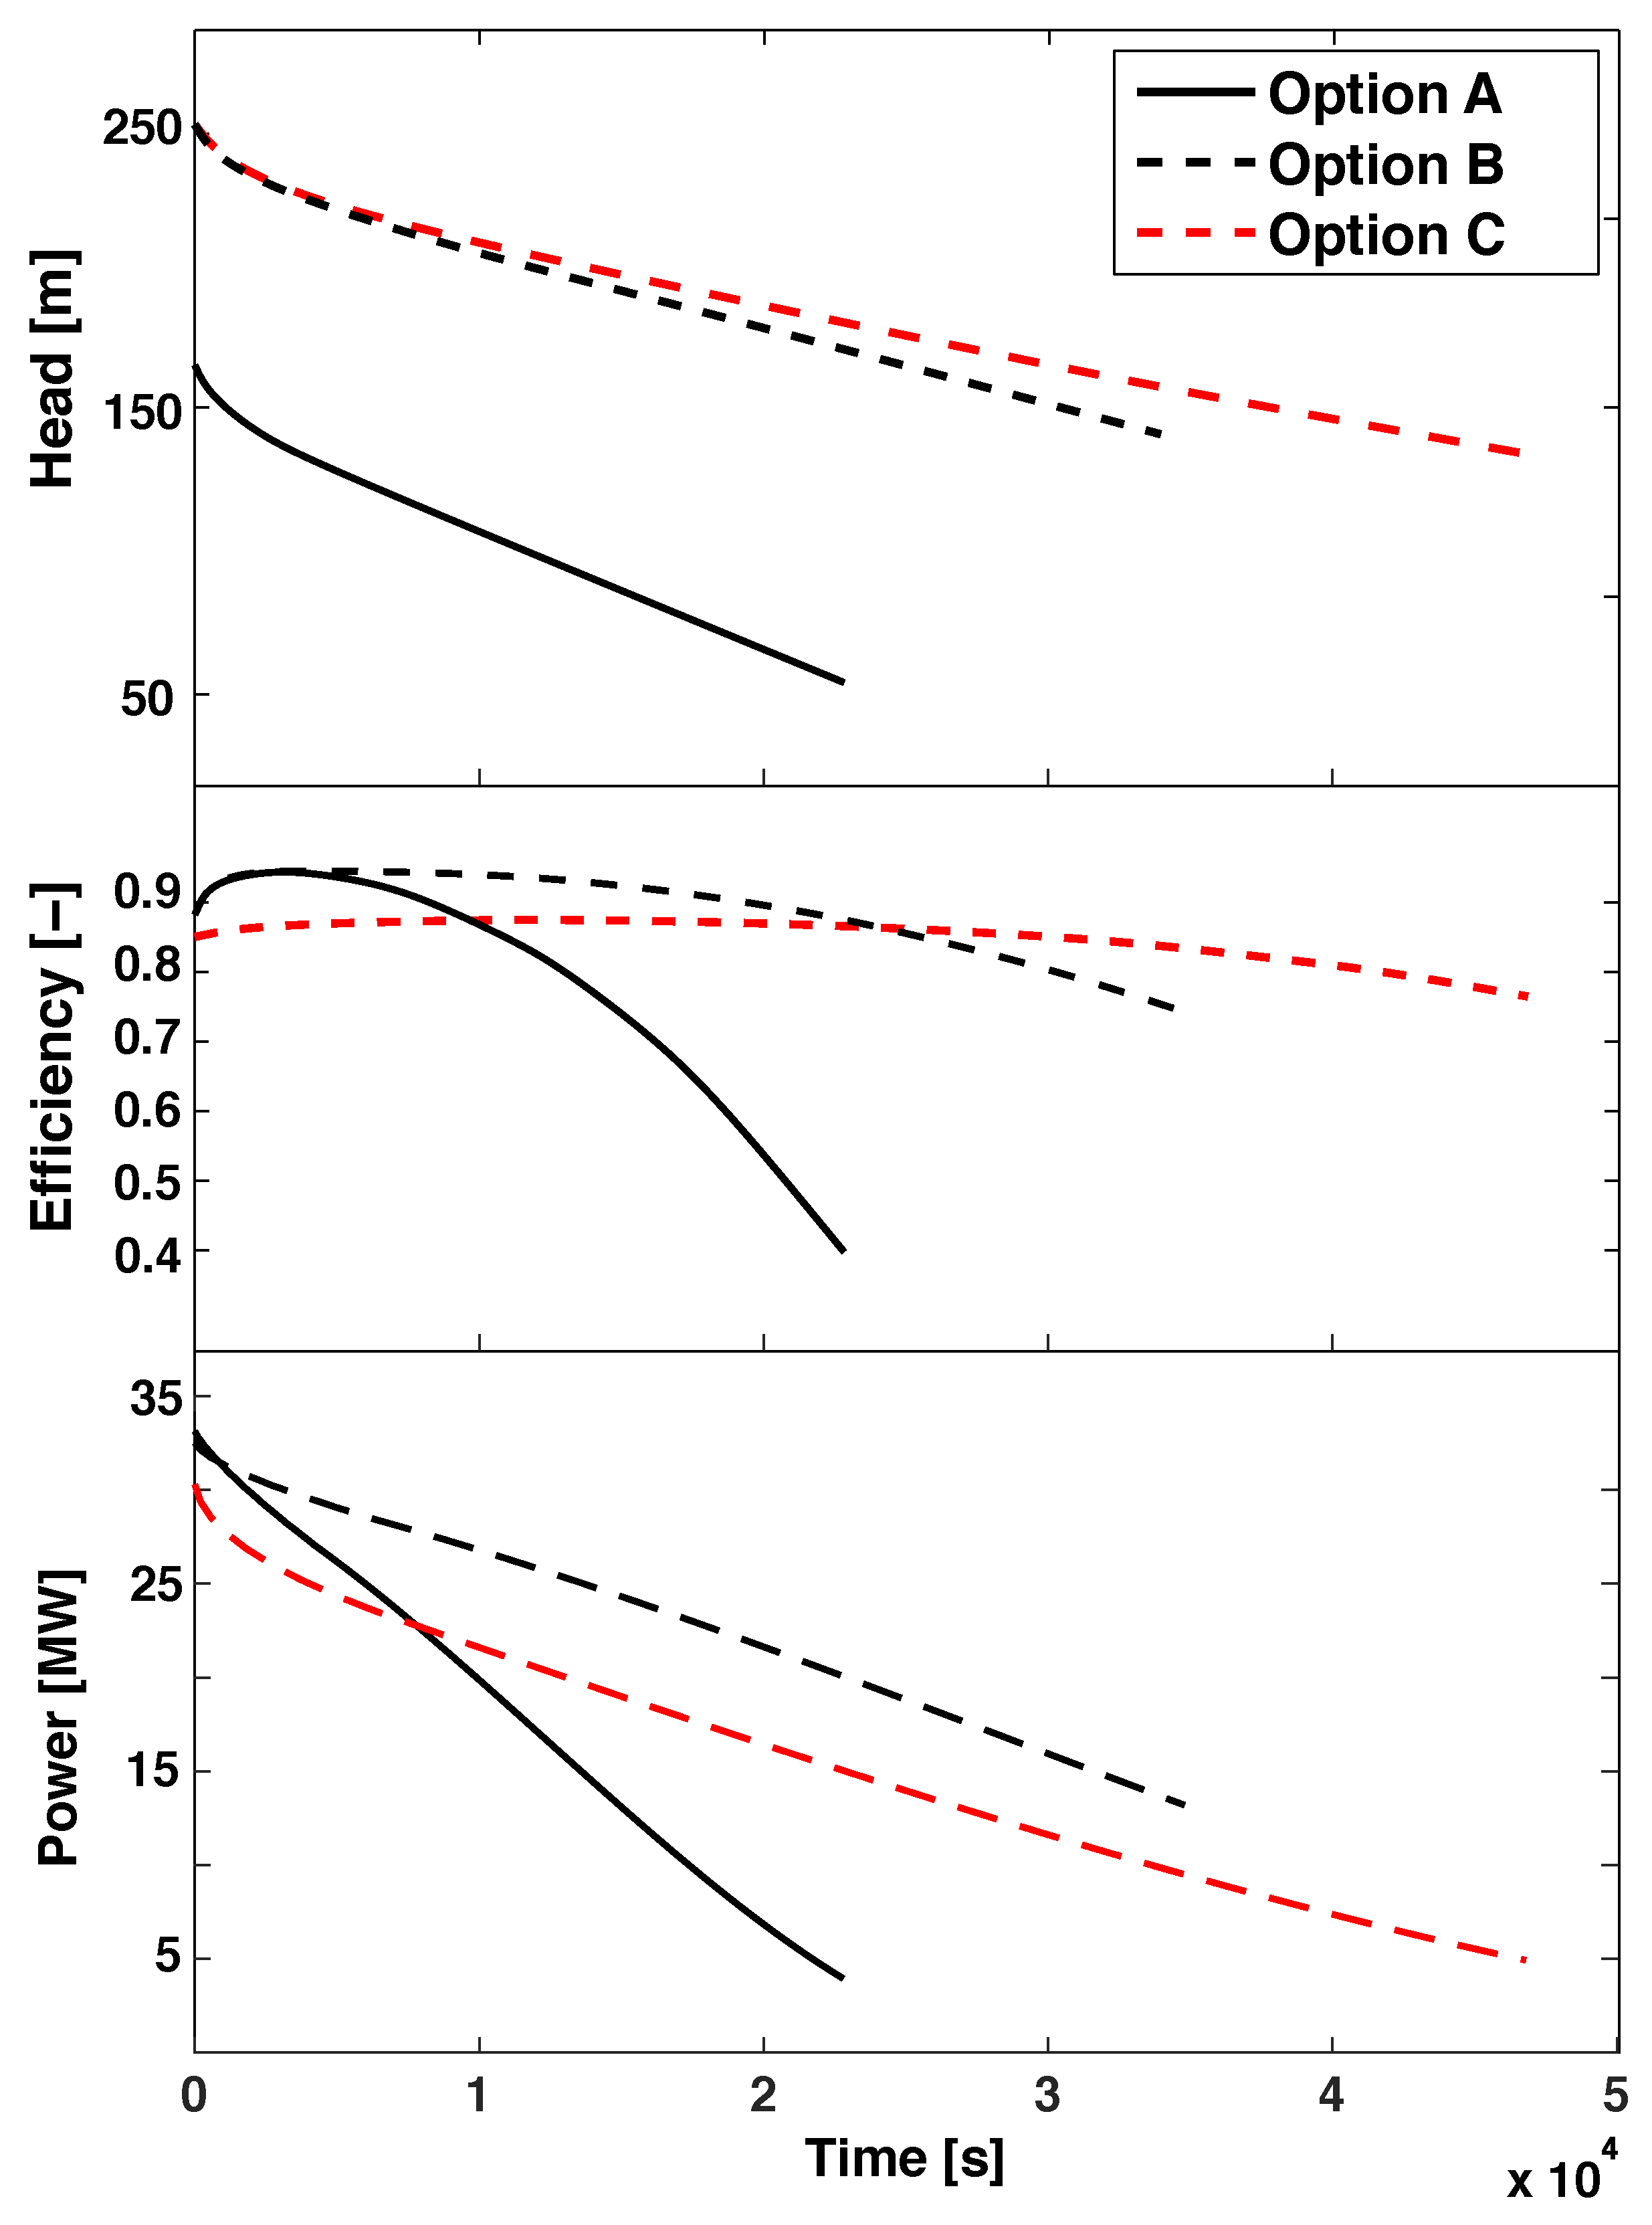
(C)
Likewise, option B, but installing a group of PATs instead.
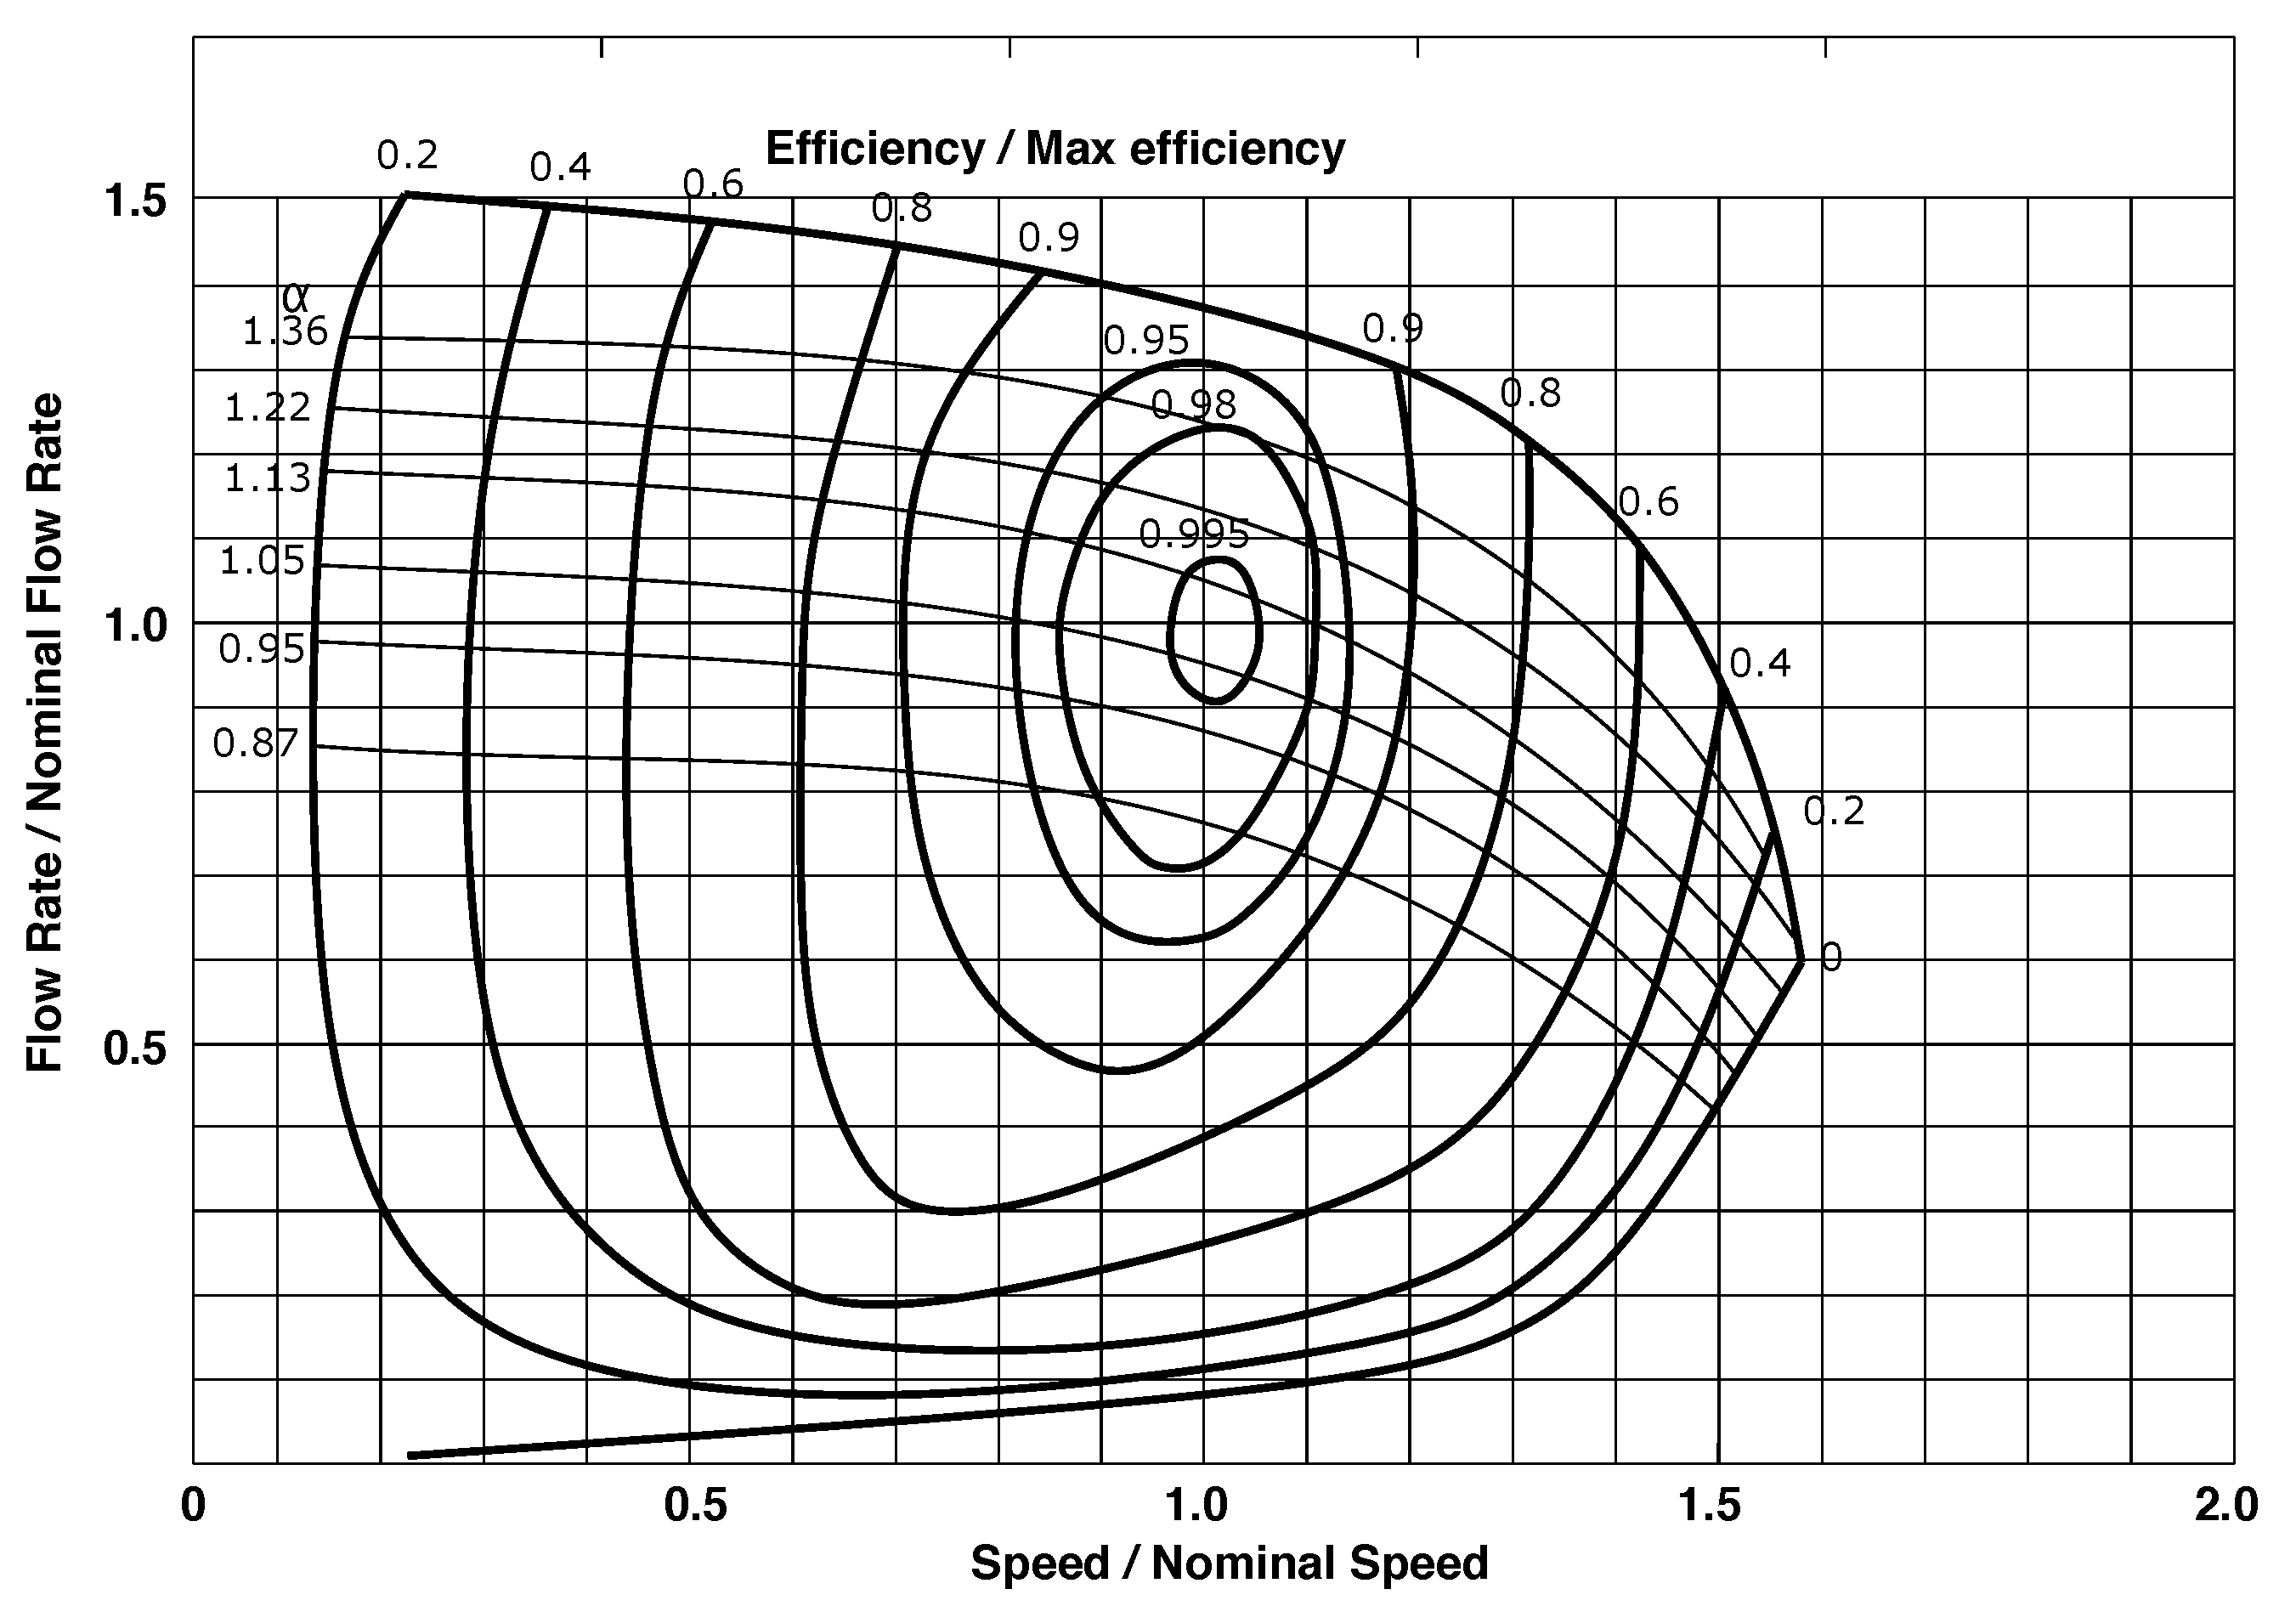
The optimal set up of the machinery depends on the required power size, pumping and generating scheduling and, indeed, economic return. Purely by way of example, Figure 4 shows all the configurations for a peak power production of 30 MW. This additional constrain influences the setup, sizes and flow rates of the hydraulic machines due to the different head exploitable in the different scenarios. The flow rate in option A has to be large enough to match with the power required under a lower available head, while options B and C can afford a lower total flow rate. Comparing the cases adopting the Francis turbine, one can find a relevant variation in the peak of nominal flow rate: 26 m 3 /s in the case A and 17 m 3 /s in the case B. Francis turbines exploit guide vanes to modulate the flow rate and deviate the streamline for performance advantages. Figure 5 shows the Francis turbine’s hillchart and its performance adaptability by its guide vanes regulation. The hydraulic efficiency peak is generally higher than in PATs [43] for this size and operating conditions. As plotted in case C, 3 PATs are coupled in parallel to raise the total flow rate and aim to the system power target of 30 MW. They are implemented with variable speed to operate in a wider range of head and flow rates [50]. The total flow rate in option C stays between the values of about 16 m 3 /s at available high head (Figure 4) and 10 m 3 /s at low head and lower speed. The reduced total flow rate in option C (Figure 6) causes a more extended period of generating. Variable rotational speed allows characteristic curves to shift accordingly to meet a new working condition point at high hydraulic efficiency. As speed changes, efficiency follows parabolic curves with their apexes at the origin of the graph. Thus, except for a slight shift depending on the Reynold numbers, efficiency is independent of the rotational speed. In case A, the load floats from a deep part-load of 35 % up to 107 % of the nominal value: this wide range produces a significant variation in hydraulic efficiency for strong cavitation vortex during refilling of the reservoir, and it would drastically limit the energy capacity. As in cases B and C, installing the upper reservoir on a higher altitude cuts down the off-design range, which is very relevant and affecting the turbine performance in case A. For option B and C, the load varies from 65 % to 104 %. Because of a lower efficiency characteristic and less flow rate involved, in configuration C the power production is lower than the corresponding use of the Francis turbine.

3.3. Preliminary Costs Analysis

Different strategies are analysed to define the pumping and generating-period based on the peak power size. Ranging from 30 to 100 MW power levels and referring to the Belpex energy price, an estimation of operation cost and revenue can be determined. The optimal strategy is determined by a trade-off between yearly revenue and investment costs. In order to estimate the profitability of the project, and estimate the time for a return on investment, a preliminary net present value (NPV) calculation is provided over 40 years, the assumed lifetime of the plant. Table 3 summarises the estimation of the different costs of case B for a 100 MW UPSH plant.
One of the design parameters in a hydroelectric plant is the size of the penstock tunnel and pipes. The larger the penstock tunnel, the smaller the friction losses with the pipe walls will be, which is, of course, desirable. However, larger pipes require more massive tunnels, increasing the material and excavation costs considerably. Moreover, over time, the roughness of the internal wall of the pipe worsens due to wear and corrosion. All these factors are relevant in the penstock design. The operation and maintenance costs are calculated based on Connolly et al. [51]. Their estimation is split up in a percentage of the investment, and a cost per energy consumed/produced: fixed yearly operation and maintenance cost 1.5 euro /MWh and 1.5% of the investment [51].
The yearly revenue is calculated based on the operation parameters, and it comprises both the income from generating and the costs for pumping. Another part of operation cost is related to the head loss due to friction. The Darcy–Weisbach calculation estimates the head loss in the pipeline, and cash flow loss due to friction loss uses the Belpex electricity price. This resulted in a lost revenue of around 4.2 M EUR/yr. The payback period of the initial investment is assumed to be 20 years. It is thus assumed those down payments are made every year in the first 20 years of plant operation; the yearly cash flow is then: Cash flow = yearly revenue – (down payment + Operation and Maintenance costs + Costs of head loss). The revenue from spinning reserve depends highly on the negotiations with the transmission system operator. It is therefore not possible to estimate the revenue from such operation for along the project lifetime; however, this might be a viable exploitation option. The evolution of the NPV value over 40 years marks that the time necessary to obtain a return of investment is within nine years.

3.4. Estimation of the Greenhouse Gas Emission

An estimation of the greenhouse gas emissions (GHG), cradle to grave, is discussed in this section for the realisation of the site. The employed method, and the values of different parameters are as described by Denholm and Kulcinski [54]. The emissions are expressed in an equivalent number of tons of CO 2 emitted. The assessment is based on life cycle assessments (LCA) of existing PHES plants, using statistical considerations. The life cycle greenhouse gas emissions for a PHES plant originate from three major sources.
  • Emissions related to the generation of the stored electricity: these GHG emissions depend on the energy mix of the country, in Belgium in 2018 a total of 16 Mtons of equivalent CO 2 was emitted, generating 92 TWh resulting in an emission ratio (or carbon intensity) of 0.174 ton CO 2 /MWh [55]. This is then multiplied with the total pumping energy, over 40 years (the assumed lifetime of the plant).
  • Emissions related to the operation of the storage plant. GHG emissions occur in the site preparation, reservoir development, the construction of (turbo)machinery, etc. Also, the GHG emissions related to the decommissioning of the plant are taken into account.
  • Emissions related to the construction of the facility. The values for these emissions in tons of CO 2 per MWh of storage capacity are given in Table 4, and are calculated based on Denholm and Kulcinski, [54].
When assuming the current carbon intensity of the energy generation, one can estimate the avoided GHG emissions, resulting from the use of energy stored in the Martelange PHES plant, rather than energy coming from the traditional generation plants. Of course, this is only an indication and can be used in comparison to other projects. The real GHG emissions will heavily depend on the actual carbon intensity of the generation mix, which is not necessarily (and not even likely) the same in 20 years as it is now.
The avoided GHG emissions are calculated in the same way as the emissions related to the stored energy. The estimated carbon intensity of the energy mix in Belgium 0.174 ton CO 2 /MWh [55] is multiplied with the total generated energy, over 40 years (the assumed lifetime of the plant).
An estimation of the GHG emissions, is given in Table 4.
The estimation of avoided GHG emissions over a 40 years lifetime, as described in Table 5, assumes the same carbon intensity of the energy mix 40 years from now as it is today. This is a largely improbable situation, however, for reasons described above, it is hardly possible to accurately predict the evolution of the carbon intensity in the energy mix.

4. The Coal Mine of Péronnes-lez-Binche Case Study

4.1. Hydropower Plant Description

The case study discussed here is a simplified formulation of the existing site due to the limited knowledge of its network of galleries and tunnels. The topology definition of a coal mine is hard to be defined as every site has its specific structure in terms of size, galleries, drainage system, geology and hydrology. However, this reduced configuration could provide a valid case study in hydro-mechanical design, and preliminary performance analysis and challenges.
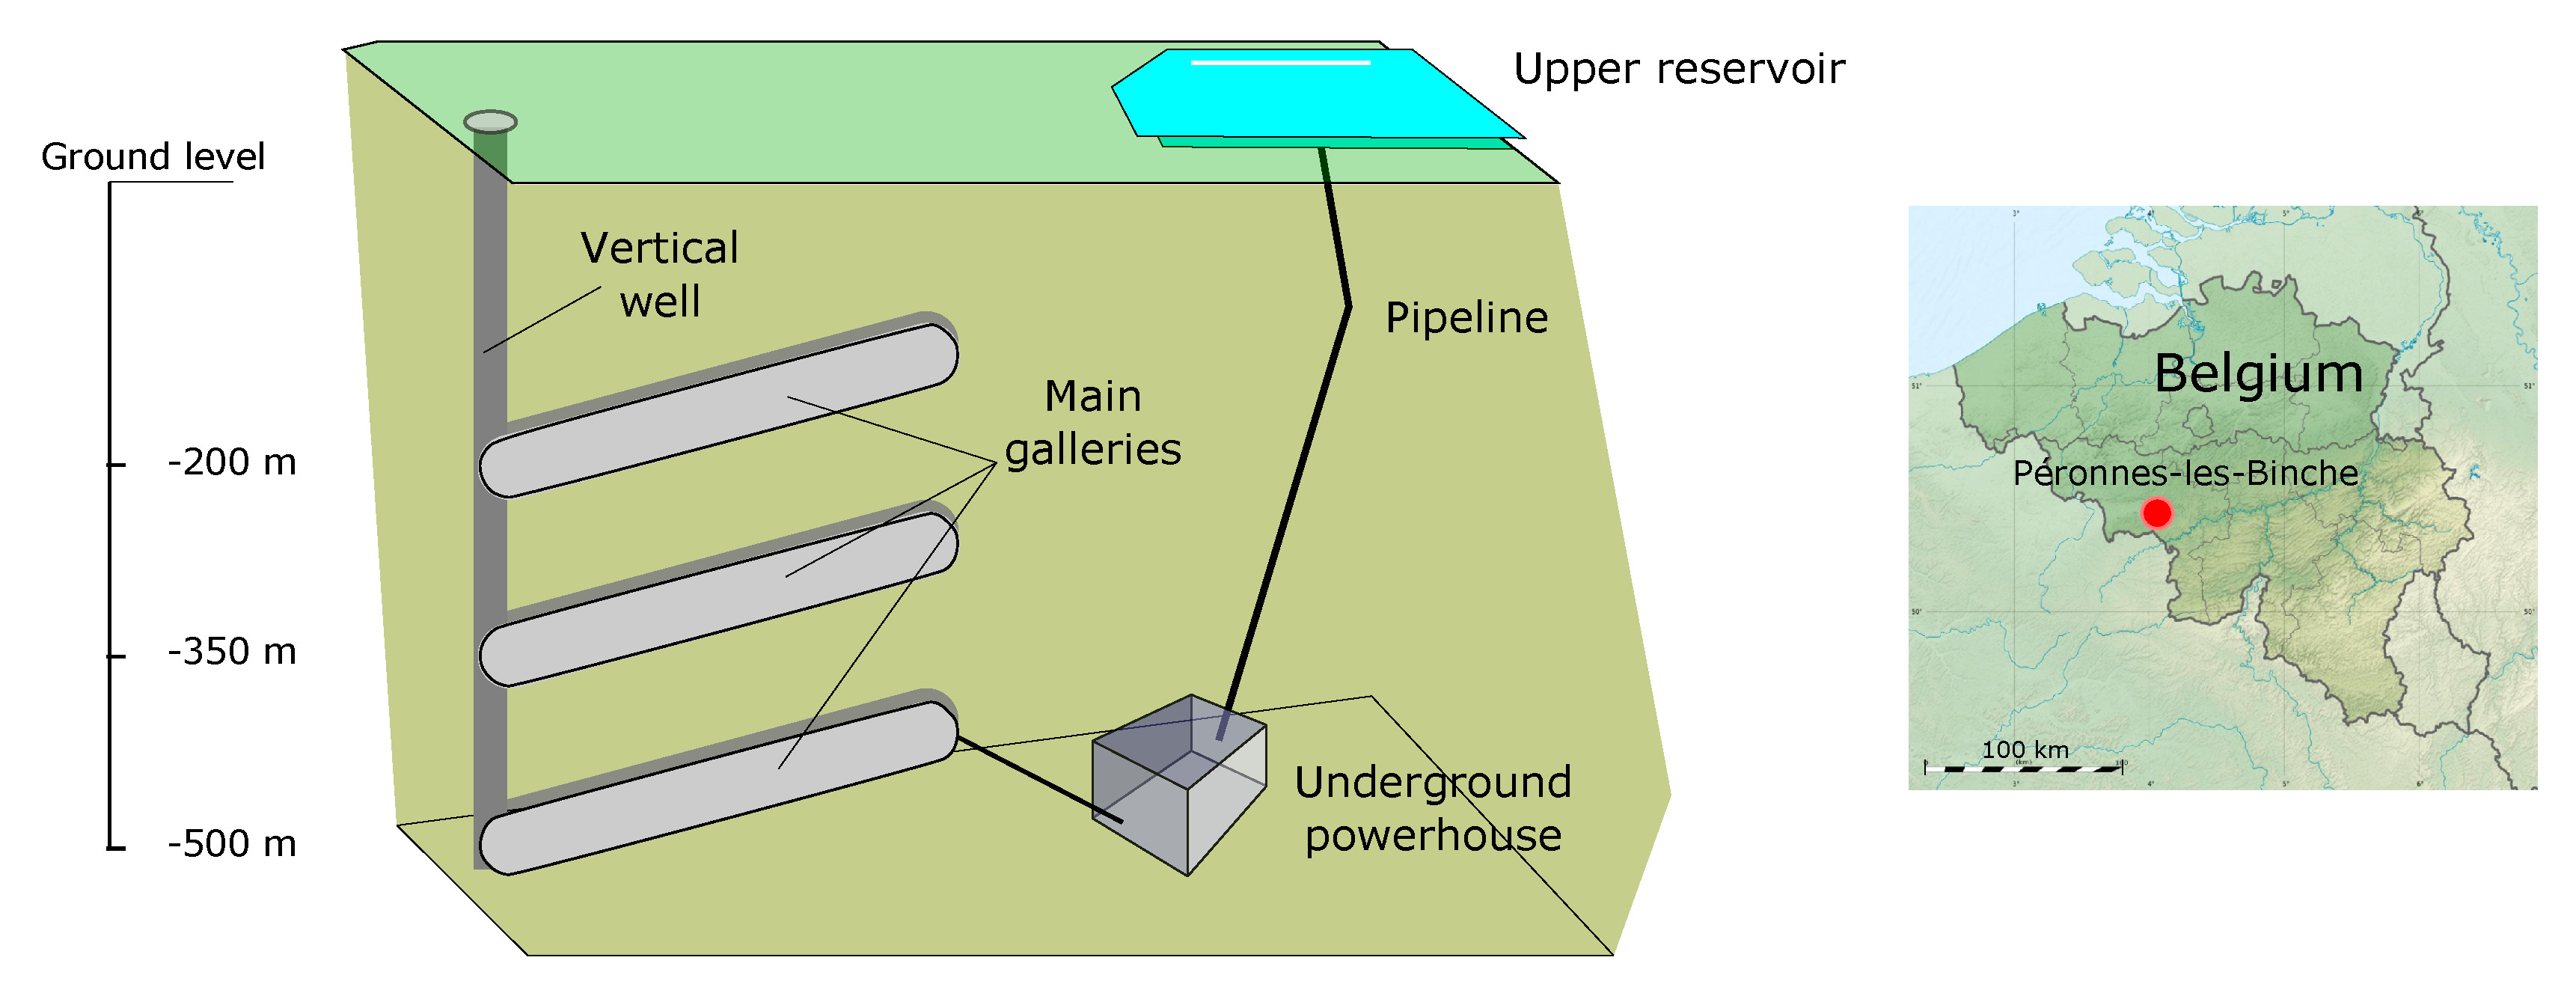
The proposed theoretical case study represents the configuration of the Péronnes-lez-Binche: two vertical wells (4 m diameter) reach the depth of 500 m and are crossed by three extensive horizontal galleries at 200, 350 and 500 m depth each. The secondary galleries are entirely spread along the central tunnels and could represent a substantial raise of available volume even if their length is usually a fraction of the main galleries.
The main challenge for this site is the high variation of the available head in the regular operation of the system. The three horizontal galleries, of 5000 m 3 each, provide a quasi-steady condition for the turbines and pumps. The first vertical well is employed to give access from the ground level to the powerhouse at the bottom of the mine for construction works and to place the penstock. The second well represents the primary connection to the horizontal galleries, which form the tailwater level reservoir (Figure 7). Due to the limited volumetric capacity of the vertical well, a modest change in water volume produces an abrupt variation in the water level and thus in the piezometric pressure along with the vertical pit. The head switches from the maximum gross head capacity of 500 m down to 200 m during the complete refilling of the mine as the lower reservoir. The operating conditions would suffer relevant head drops during the transition between two galleries in the vertical well.

4.2. Turbomachinery Selection

There is no hydraulic turbine able to tackle this high variation of load alone. The extremely large fluctuation in energy generation by the filling or emptying of the mine during a full cycle requires a combination of multiple turbomachines and the sum of the turbine energy production has to cover the net head peak. In this case, a series of three Francis turbines could be implemented to split the full charge, due to the net head variation in the three main galleries. With the assumption of adopting an upper reservoir at the ground level, the full group of Francis turbines need to operate under a 500 m gross head, two turbines at 350 head and only the last, when the water reaches the third horizontal gallery, at 200 m depth. Additional connecting pipes and turbine by-pass fitting are therefore necessary to modulate the turbines group operational load and isolate one or two, when required because of the head variation.
Figure 8 provides an overview of the possible turbines group arrangement. The penstock coming from the upper reservoir has direct access to the spiral casing of the turbine I or it can deviate the water flow to the next machine. Similarly, turbine II can operate or be by-passed into turbine III. This configuration presents high hydraulic efficiency per turbine but it requires important investment costs since three hydroelectric units are needed. Furthermore, the new design of the draft-tube of each turbine represents a further engineering challenge, since the draft-tube plays the critical role of recovering energy by reducing the flow’s kinetic energy [56] and it is crucial to avoid the perturbation of the operating conditions of the following turbine in the series.
A 1D numerical model of the proposed hydropower plant, illustrated in Figure 7, has been developed to perform a feasibility study on the selection of the hydraulic turbines and to predict the turbomachines’ behaviour under different operating scenarios. For this purpose, the SIMSEN software is used, in which mass and momentum conservation equations are modelled according to their electrical equivalent, as presented in [57,58]. The SIMSEN components representing the power plant are illustrated in Figure 9. The integrated dynamic behaviour of the whole system is simulated in the time domain through a set of first-order nonlinear ordinary differential equations [59]. The model features the upper reservoir located at ground level, the penstock with diameter D P = 0.9 m and length L P = 545 m, the powerhouse located at -510 m and the lower reservoir in which the depth varies as a function of time and of the flow discharge. The following equation is implemented to simulate the head variation H t ( t ) of the power plant during each transition between two horizontal galleries through the well:
H t 1 ( t ) = min ( H 2 , H 1 + Q × t A ) H t 2 ( t ) = min ( H 3 , H 2 + Q × t A )
where H 1 , H 2 and H 3 are the depth of the three horizontal galleries, respectively, Q is the discharge at the outlet section of the turbine III and A is the cross-section of the well. A distributed model of the losses in the penstock is adopted, as presented in [57,60], by assuming that the piping system will be made by stainless steel.
Three identical Francis turbines are selected with a D = 0.55 m runner diameter and the specific speed ν = 0.13 [-] is defined as follows:
ν = ω × Q 1 / 2 π × ( 2 E ) 3 / 4
where ω is the angular speed of the runner [rad/s], Q is the discharge [m 3 /s], and E is the nominal specific energy [J/kg].
Two scenarios for the turbines operating condition have been simulated:
  • SCENARIO A: the machines operate only during steady head conditions. During head variation the turbines are by-passed until a new steady condition happens;
  • SCENARIO B: it implies the continuous operation of the hydraulic turbines also during transient head conditions. A by-pass strategy depending on the head variation is proposed.
In the first investigated operating condition, Francis turbines operate in series with H = 500 m and all by-pass valves are closed. As soon as the first horizontal gallery is filled-up, all turbines are switched off and the flow discharge is pass through the by-pass piping system. When the water level reaches the second horizontal gallery, the valves of the by-pass of the turbines II and III are closed and only turbine II and III operate at H = 350 m. When the second horizontal gallery is filled-up, all turbines are switched-off, as for the first transition, and all valves are open to let the flow discharge pass through the by-pass piping system. Finally, only the turbine III operates at H = 200 m, when the third horizontal gallery is reached.
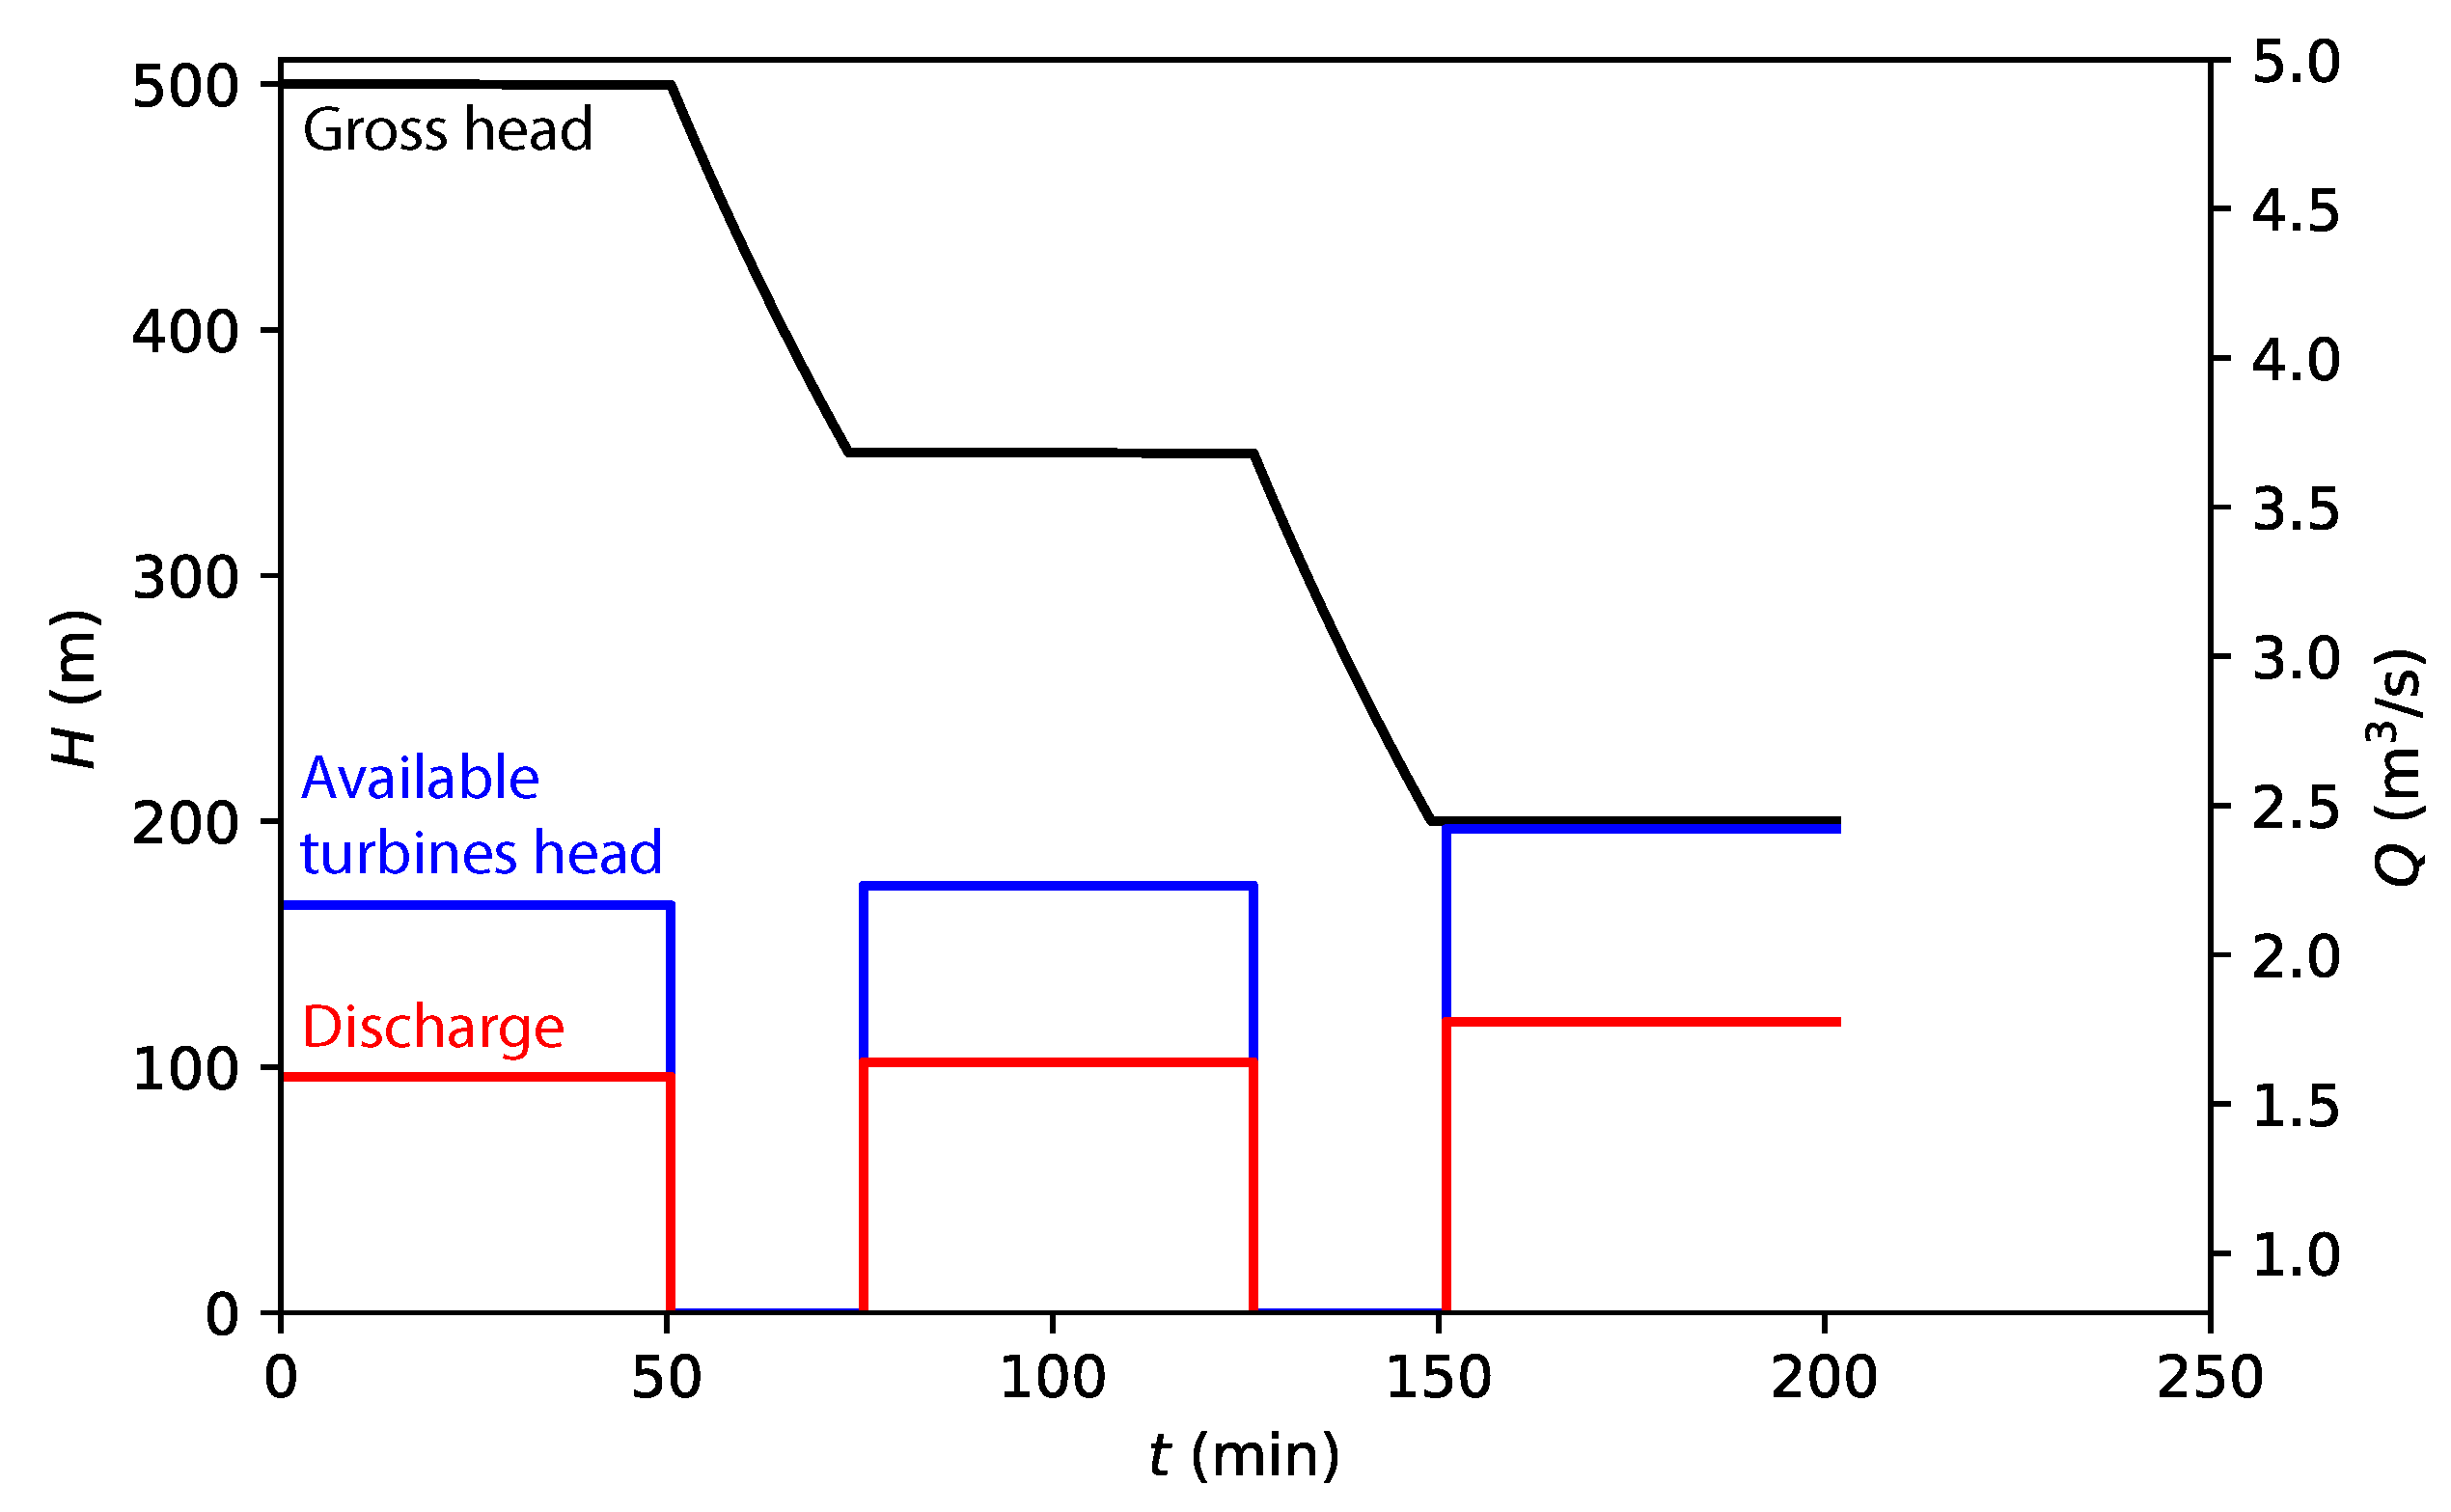
The results of the simulation during the whole transition process are illustrated in Figure 10. It can be observed that the available turbine head is shared equally between the machines and this allows maintaining an acceptable head variation throughout the power plant operation. The head range for which the turbines have to be designed is within 165 and 200 m. The discharge is set within 1.6 m 3 / s and 1.8 m 3 / s to operate at the highest efficiency depending on the head.
The first scenario’s operating condition implies a dramatic energy loss. During the transition from one horizontal reservoir to the following one, the flow discharge is not exploited for energy production to avoid a part-load operation of the hydraulic machines due to the dynamic change of the head. This energy loss E r [J] corresponds to about 6 MWh by considering the integral of the available power over the transition time between the horizontal galleries, computed as follows [61]:
E r = t ρ g Q ( t ) H ( t ) d t
where Q ( t ) and H ( t ) are the instantaneous discharge [m 3 /s] and available head [m], respectively and ρ is the water density [kg/m 3 ]. Furthermore, it is important to notice that numerous start-up and shut-down of the machines, as well as several modifications of the operating point, lead to unsteady loading, and this might result in fatigue collateral damage and additional cost in maintenance [62].
The second investigated scenario implies a continuous operation of the hydraulic turbomachines during the transition between the horizontal galleries. Therefore, an investigation on the feasibility of the machine operation during the dynamic head changes is performed. The optimisation of the strategy for switching-on and off of the turbines is out of the scope of this paper as well as the study of the machines’ start-up and stop transitions since this will be strictly dependent on the final design and performance hillchart of the machines.
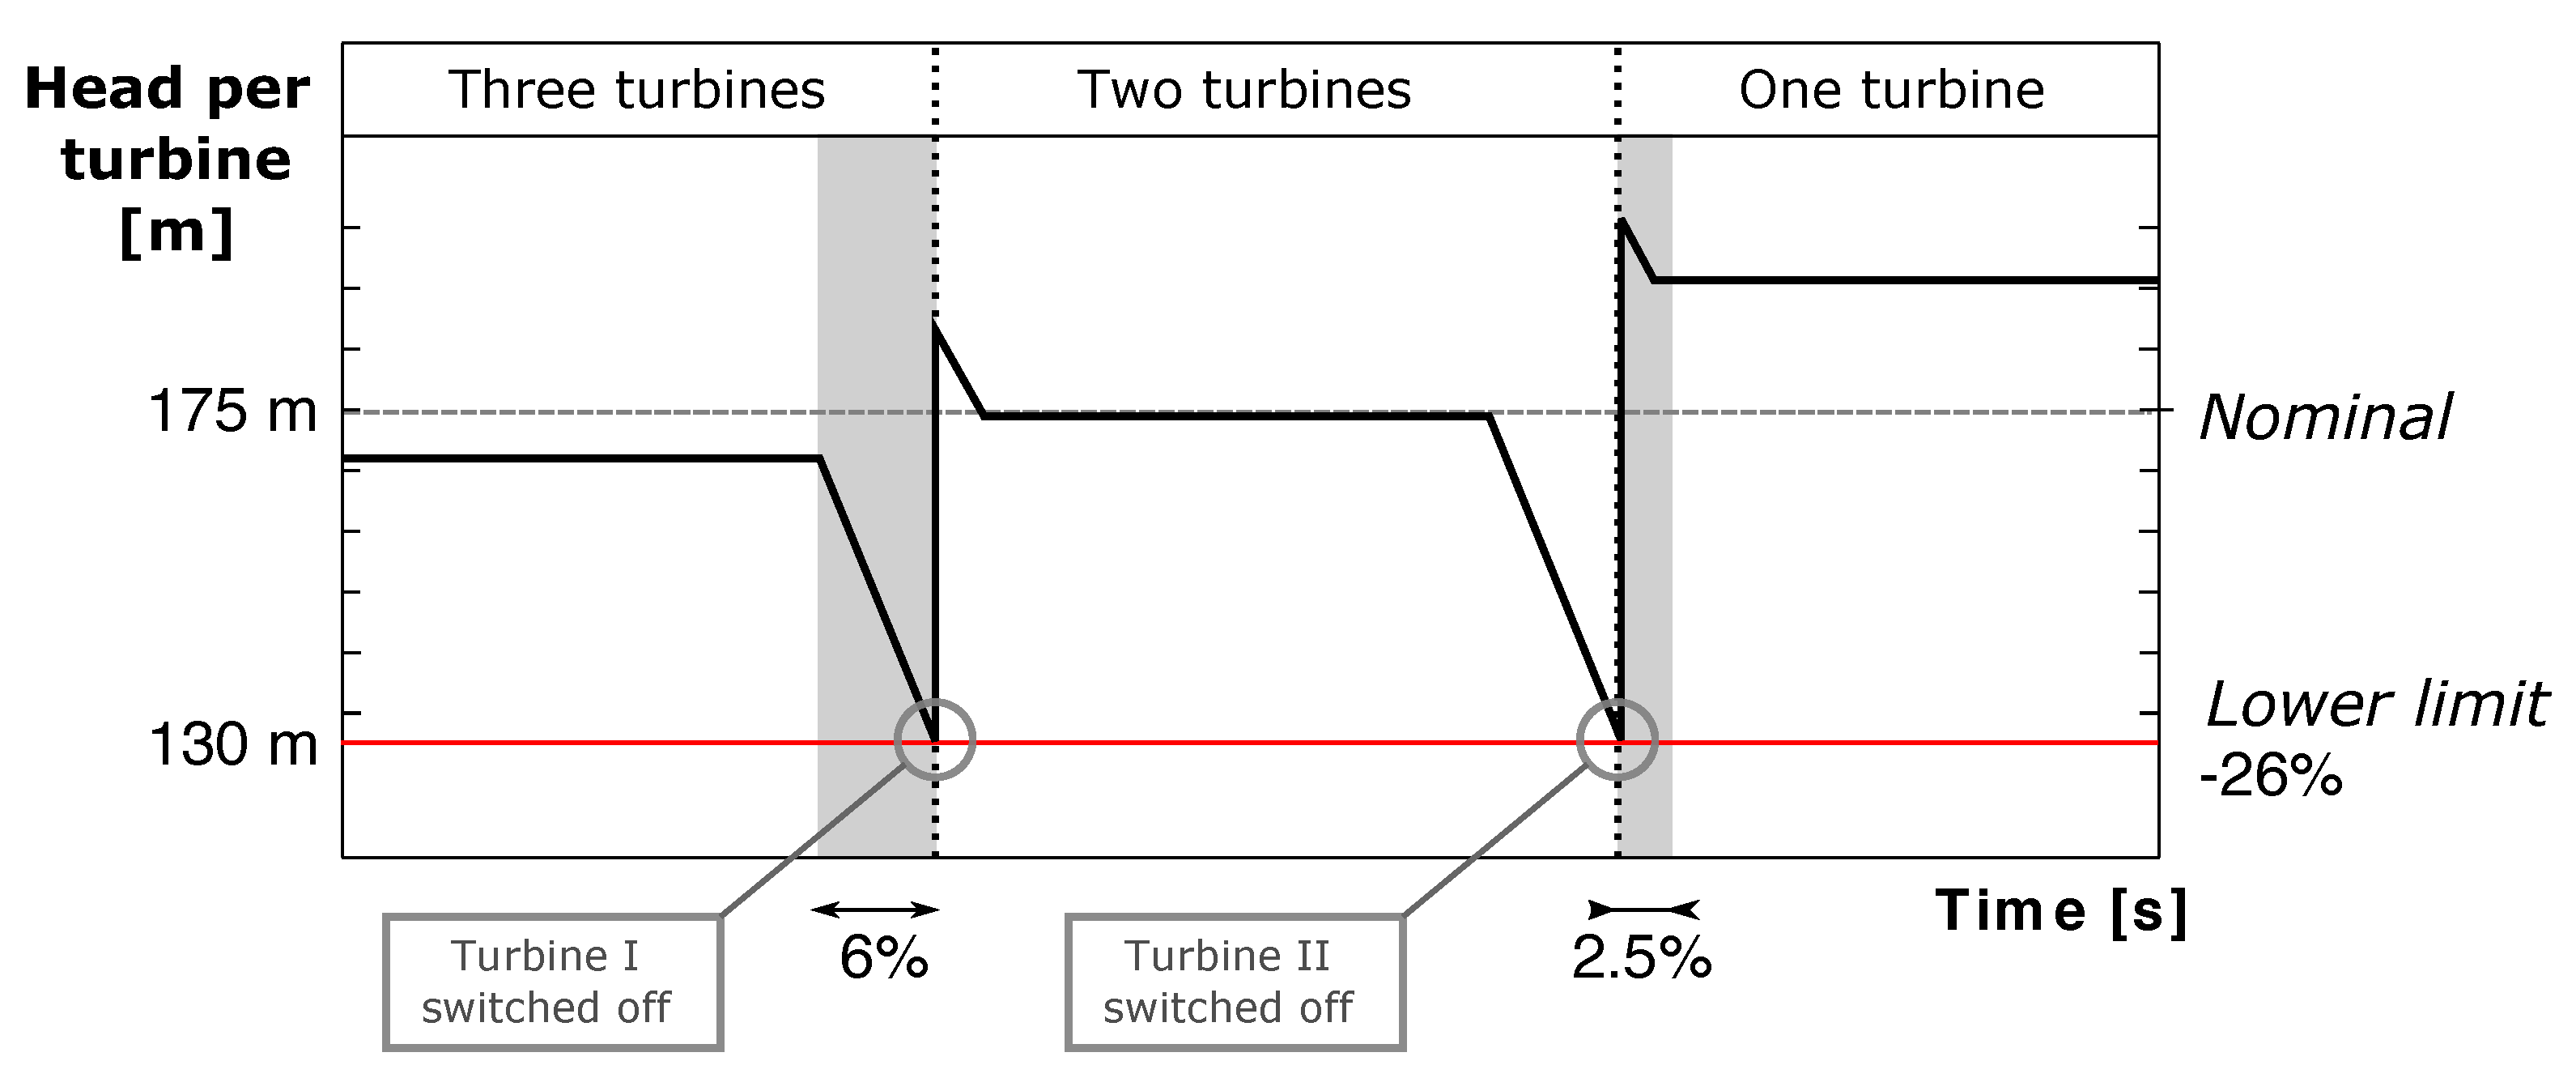
Important variations in head would require the selected Francis turbines to operate in part-load and full conditions, which can cause several vibrations and induce dangerous cavitation phenomena [63,64,65]. Figure 11 illustrates the three phases in which three turbines are operating until the lower load limit is reached, then only two turbines, and, eventually, a single Francis turbine is in function. During the first transition, the selected machines enter in part-load regime after a decrease in head of 14%. Therefore, the first hypothesis of this scenario is to shut down the first turbine (turbine I as depicted in Figure 8) after a variation of Δ H = 105 m to the gross head of the power plant, which corresponds to a variation in the available head of each turbine equal to the 26% of the nominal head. The turbines would operate in part-load condition, but only for a limited time, about 900 s, which corresponds to the 6% of the operating time and this is not critical for the machine safety [64]. After the stop and by-pass of the turbine I, the turbines II and III would experience an increase of the head and discharge allowing the machines to leave the part-load condition until the second horizontal gallery is reached, which corresponds to the nominal operating condition for both machines.
Similarly, during the second transition to reach the third horizontal gallery, both turbine II and III operate until a variation in available head on each turbine equals to the 26% of the nominal head is reached. Then, turbine II is stopped and by-passed. The turbine III now operates alone and at full load condition until the third horizontal gallery is reached, corresponding to the 2.5% of the operating time. The results of the numerical simulation of this operating condition of the hydraulic machines are presented in Figure 12.

5. Discussion

5.1. The Quarry of Martelange Case Study

The preliminary cost analysis conducted in Section 3.3 provides important economic insights. The specific cost of the initial investment for UPSH at the quarry of Martelange of 121.57 EUR/kW underline the economic advantage of this kind of system. PHES is a mature energy storage technology [18,66] and expenditures are statistically defined in the literature. The annual OPEX is estimated about 6–10% of the total initial investment [67,68,69]. At these terms, Martelange UPSH is still under the averaged power capital cost range of 530–2700 EUR/kW [67,70].
A relevant benefit of the implemented UPSH is the avoided GHG emissions. For the Martelange case study, over two million tons of CO 2 equivalent can be avoided, which equals to about 10% of the total CO 2 emissions in Belgium for households in 2018 (26.8 million tons of CO 2 equivalent) [71]. An additional environmental advantage in using groundwater instead of surface water is that it also reduces or eliminates the impact to fish populations [72]. However, in order to provide a more comprehensive analysis of the environmental effects generated by the implementation of the power system, additional impact on biodiversity, hydrogeology, geomorphology must be assessed.
A drawback of this configuration is that hydrochemical related issues and groundwater exchanges could further raise costs and affect the system’s performances [73]. The soil on-site in the Martelange mine is slate. Slate is highly water-impermeable, an essential quality in a PHES reservoir, and this is the reason why the mine is currently flooded. However, the mine has known an incoming water flow over its entire lifetime, and the water pressure is lower than the hydrostatic pressure necessary for fracking (meaning that the slate layer will not be fracked by the water pressure). It can be expected that no significant damage will occur to the soil and that the cavity will remain intact, during the operation of the UPSH system: the quarry is expected to withstand the cyclic pressure due to filling and emptying of the reservoir [49]. The main concern for this type of mine is the damage that the water has done or will do while leaking in, and, in particular, the possible pressure relief openings in the mine due to erosion. These openings might cause higher leakage rates and lower structural sturdiness than expected. Even though it is expected that the mine structure can withstand the cyclic pressures, and that leakage will be acceptable, on-site testing will still be necessary to determine the exact site-specific properties. Cracks in the soil are very dependent on local conditions, and significant difference might occur from one site to another.
The stability of the soil is also crucial to avoid that water erodes small particles of the cavity. This process forms debris in the water which can possibly hit the turbine at high speed causing damages. The use of water with a high content of debris, sand and muck, which is typical for an inactive quarry as the one analysed, can cause wear to the gap between runner and casing of the turbine. Thus, the efficiency drops in a pump-turbine with closed impeller (e.g., fast Francis or some PAT) as constant erosion takes place. Experimental investigations have shown a reduction of up to 5% on centrifugal pump efficiency by the increase of the impeller gap [74]. The correct manufacturing material has to be picked up in a later stage of the project to deal with mechanical and chemical corrosion. This will only have an impact on price and not really on the hydraulics. In this regard, providing a sample of the site’s water composition to the manufacturer results necessary.

5.2. The Coal Mine of Péronnes-lez-Binche Case Study

The selection of the hydraulic turbomachinery configuration relies on a technical feasibility analysis. For a given reservoir capacity there is probably an advantage in using fewer machines as far as the powerhouse volume (and therefore its construction and excavation costs) is concerned [75]. Specific costs for the turbomachinery selection are related to the type of arrangement and the expected fittings and connections. Interestingly, the size of the turbine runners can affect the construction methodology and setup of the powerhouse. The runner diameter would insert additional constrains in its transportation and installation. In the presented case, the vertical well’s diameter, as it is, limits the maximum transportable breadth. Although, it presents an already existing access to the mine and drives the plant-construction cost down [11].
The simulations of the turbines series have shown their behaviour in the case of two different operation regimes: the first one avoids the high head variation by shutting-off the turbines’ group and fully by-passing the water flow when the vertical wells are met; the second regime operates continuously but it by-passes a turbine at the time and splits the available head to the remainder of running machines. The latter scenario records a higher capacity, 27% gain in energy production, it reduces the total number of start-up and stop for turbine II (−50%) and turbine III (−100%) due to the by-passing system, and it does not require the by-pass piping system between turbine III and the tailwater reservoir. On the other hand, the turbines are operating in the variable head, although limited, which could compromise the machines’ safety if the operation is prolonged in this condition.
The creation of multi-stage turbines has precedents in responding to reduce the cost of investments for a given power by seeking to use sites of high fall with low flow rates, while single-stage turbines did not allow to exploit such great heads [37]. An example is the 1217 m head multi-stage pump-turbines of the same type without wicked gates in Super Bissorte power stations in the Alps close to the Italian–French border, operating since 1987 [76]. Since these machines with fixed diffusers do not allow any variable power load, the system can be combined with other turbines for partial flexibility.
As an alternative to the analysed configuration, a Deriaz turbine could be employed. However, the cost-benefit advantage of installing a compact and advanced-technology pump-turbine, such as Deriaz Turbine, can be partially reduced by the additional costs in the mechanical apparatus as required for adjustable runner blades. On the other hand, the conception and design of a pump-turbine at fixed geometry requires additional tests in pump mode (four quadrants) in comparison with a pure turbine.
A Deriaz pump-turbine can be installed for providing a more compact solution to the exploitation of two galleries. The Deriaz-type pump-turbine has the unique feature of a broad range of operation (40–120%) of the nominal load) at high hydraulic efficiency by using double regulation of the guide vanes and runner blades [38]. The Deriaz pump-turbine needs to adjust the vane ring and runner blade according to the currently available head and consequently its water discharge as well [47]. The flow rate varies in this configuration, catching up a more significant total period of the power generation phase if compared to the scenario in which all series of Francis turbines are switched off during the wells transitions. However, historically, the Deriaz pump-turbine has not been favoured over the Francis turbine because of its mechanical complexity and cost [77]. A study on the investment costs between the solution with a Deriaz turbine and the solution with the series of the three Francis turbines should be assessed to compare the two solutions.
Finally, variable speed solutions can also be implemented to tackle the fluctuation of the load. The solution consists in rotating the reversible turbine at different rotational speeds in the pump and turbine mode, but it is not primarily used due to its complications in the alternator-engine connection level. Variable rotational speed could provide a +10% gain in hydraulic efficiency in partial load for specific Francis turbine applications [78] but additional drops in the global efficiency need to be considered from the variable speed devices.

6. Conclusions

Nowadays, the need for energy storage reflects economic, environmental, geopolitical, and technological considerations. The growing global demand for fossil fuels, the resulting rise in prices, and the political turmoil in several producing countries have made the energy supply partly uncertain. Energy storage is, therefore, a geostrategic asset and ineludible need to limit losses during overproduction, thus reducing overall energy consumption. Pumped hydro energy storage represents the most used technology for storing energy today but has definite geomorphic limitations. On the other hand, UPSH installation does not require the presence of mountain ranges because the lower reservoir may be an unused cavity in the underground. Although the Belgian landscape is relatively flat, it counts hundreds of mines and quarries into disuse.
This paper presents the study of a coal mine and a slate quarry suitable for UPSH applications. Their main features are described with concern of the significant challenges in geometry complexity and actual potential capacity with a multidisciplinary approach by considering both economical and technical aspects.
For the Martelange case study, the preliminary economic analysis concludes that the return of investment is within nine years, underlying the potential viability of a UPSH project in Belgium. The GHG emissions breakdown of the investigated site lifetime showed that the avoided GHG emissions over the system lifetime overpasses two million tons of CO 2 equivalent.
The analysis on the turbomachinery selection highlighted that the high variation of the head during generating cycles is critical for the machine reliability and it calls to non-traditional turbine setups for preserving a profitable energy capacity, as well as to safeguard the turbines. Based on the options adopted in the Martelange case study, part-load conditions space from 35–107% to 65–104% and both Francis turbines and PATs with variable speed can be implemented to tackle high available head stretches. Multi-stage pump-turbines, driven by a full-size frequency converter, offer a compact and reliable solution. PATs present the most cost-effective solution for micro-scale hydropower, but there is still no precedent in the literature to preserve this strength in small scale PHES.
For the coal mine case study of Péronnes-lez-Binche, a series of separate Francis turbine can also be installed to deal with the extreme variable head operations. This concept is unusual and the cost analysis of this solution should be assessed and compared to other hydroelectric units. In this regards, 1D numerical simulations have been carried out to investigate the operation’s feasibility in the coal mine case study. The Francis turbines succeed in balancing the instant available head according to the operation in full series or in by-pass. Interestingly, the SIMSEN 1D simulation proved the 6 MWh saving in the applied system by letting the turbines continuously run instead of shutting off the system during head high gradient periods.

Author Contributions

Conceptualization, A.M.; methodology, A.M., J.S.; investigation, A.M, J.S. and E.V.; resources, A.M, J.S. and E.V.; data curation, A.M, J.S. and E.V.; writing—original draft preparation, A.M.; writing—review and editing, A.M, J.S., E.V. and P.H.; supervision, P.H.; funding acquisition, P.H. All authors have read and agreed to the published version of the manuscript.

Funding

Authors wish to acknowledge all the partners of the SmartWater project, the Service Public Wallonie—SPW and Multitel for their support and coordination.

Acknowledgments

Authors wish to acknowledge all the partners of the Smart-Water project and Multitel for their support and coordination.

Conflicts of Interest

The authors declare no conflict of interest.

Abbreviations

The following abbreviations are used in this manuscript:
EEXEuropean Energy Exchange
GHGgreenhouse gas
LCAlife cycle assessment
NPVnet present value
OTCover-the-counter contract
OPEXoperation expenses
PATpump as turbine
PHESpumped hydro energy storage
RESrenewable energy sources
RPTreversible pump-turbine
TSOtransmission system operator
UPSHunderground pumped storage hydroelectricity

References

  1. Limpens, G.; Jeanmart, H. Electricity storage needs for the energy transition: An EROI based analysis illustrated by the case of Belgium. Energy 2018, 152, 960–973. [Google Scholar] [CrossRef]
  2. European Commission. Energy and Environment: Liberalisation of the Electricity and Gas Markets. 2012. Available online: http://ec.europa.eu/competition/sectors/energy (accessed on 15 January 2020).
  3. International Energy Agency—IEA. Renewable Information: Database Documentation. 2018. Available online: https://www.iea.org (accessed on 30 April 2020).
  4. Matsuo, Y.; Endo, S.; Nagatomi, Y.; Shibata, Y.; Komiyama, R.; Fujii, Y. Investigating the economics of the power sector under high penetration of variable renewable energies. Appl. Energy 2020, 267, 113956. [Google Scholar] [CrossRef]
  5. de Almeida, A.T.; Fonseca, P.; Falkner, H.; Bertoldi, P. Market transformation of energy-efficient motor technologies in the EU. Energy Policy 2003, 31, 563–575. [Google Scholar] [CrossRef] [Green Version]
  6. Endex, I. Belgian Power Basload Futures. In Contract Specifications; Technical Report; ICE: Washington, DC, USA, 2015. [Google Scholar]
  7. Vallés, M.; Reneses, J.; Cossent, R.; Frías, P. Regulatory and market barriers to the realization of demand response in electricity distribution networks: A European perspective. Electr. Power Syst. Res. 2016, 140, 689–698. [Google Scholar] [CrossRef]
  8. De Vos, K. Negative Wholesale Electricity Prices in the German, French and Belgian Day-Ahead, Intra-Day and Real-Time Markets. Electr. J. 2015, 28, 36–50. [Google Scholar] [CrossRef]
  9. Engelken, M.; Römer, B.; Drescher, M.; Welpe, I.M.; Picot, A. Comparing drivers, barriers, and opportunities of business models for renewable energies: A review. Renew. Sustain. Energy Rev. 2016, 60, 795–809. [Google Scholar] [CrossRef]
  10. CONCERE-CNC PNEC 2030. Plan National Energie-Climat PNEC; Technical Report. Brussels, Belgium, 2019. Available online: https://www.cnc-nkc.be/en/NECP (accessed on 18 December 2019).
  11. Steimes, J.; Al Zohbi, G.; Hendrick, P.; Haut, B.; Doucement, S. Cost and revenue breakdown for a pumped hydroelectric energy storage installation in Belgium. In Proceedings of the Sustainable Hydraulics in the Era of Global Change—4th European Congress of the International Association of Hydroenvironment Engineering and Research, IAHR 2016, Liege, Belgium, 27–29 July 2016. [Google Scholar]
  12. Worrell, E.; Laitner, J.A.; Ruth, M.; Finman, H. Productivity benefits of industrial energy efficiency measures. Energy 2003, 28, 1081–1098. [Google Scholar] [CrossRef] [Green Version]
  13. Ceglia, F.; Esposito, P.; Marrasso, E.; Sasso, M. From smart energy community to smart energy municipalities: Literature review, agendas and pathways. J. Clean. Prod. 2020, 254, 1–47. [Google Scholar] [CrossRef]
  14. Palizban, O.; Kauhaniemi, K. Energy storage systems in modern grids—Matrix of technologies and applications. J. Energy Stor. 2016, 6, 248–259. [Google Scholar] [CrossRef]
  15. Deane, J.P.; Ó Gallachóir, B.P.; McKeogh, E.J. Techno-economic review of existing and new pumped hydro energy storage plant. Renew. Sustain. Energy Rev. 2010, 14, 1293–1302. [Google Scholar] [CrossRef]
  16. European Commission. A Roadmap for moving to a competitive low carbon economy in 2050. COM 2011, 11, 25–34. [Google Scholar] [CrossRef]
  17. Meeus, L.; Azevedo, I.; Marcantonini, C.; Glachant, J.M.; Hafner, M. EU 2050 Low-Carbon Energy Future: Visions and Strategies. Electr. J. 2012, 25, 57–63. [Google Scholar] [CrossRef] [Green Version]
  18. Rehman, S.; Al-Hadhrami, L.M.; Alam, M.M. Pumped hydro energy storage system: A technological review. Renew. Sustain. Energy Rev. 2015, 44, 586–598. [Google Scholar] [CrossRef]
  19. Martin, G.G. Underground Pumped Hydroelectric Energy Storage; Technical Report; Pacific Northwest Lab.: Richland, WA, USA, 2011. [CrossRef]
  20. Spriet, J. A Feasibility Study of Pumped Hydropower Energy Storage Systems in Underground Cavities. Master’s Thesis, Bruface (ULB-VUB Faculty of Engineering), Brussels, Belgium, 2014. [Google Scholar]
  21. Fessenden, R.A. System of Storing Power. U.S. Patent 1247520A, 20 November 1917. [Google Scholar]
  22. Min, A.P.N. Ondergrondse Pomp Accumulatie Centrale: Effectiviteitsverbetering Dmv Verschillende Pomp-Turbinevermogens. Master’s Thesis, Technische Universiteit Delft, Delft, The Netherlands, 1984. [Google Scholar]
  23. Pujades, E.; Orban, P.; Bodeux, S.; Archambeau, P.; Erpicum, S.; Dassargues, A. Underground pumped storage hydropower plants using open pit mines: How do groundwater exchanges influence the efficiency? Appl. Energy 2017, 190, 135–146. [Google Scholar] [CrossRef]
  24. Wong, I.H. An underground pumped storage scheme in the Bukit Timah granite of Singapore. Tunn. Undergr. Space Technol. 1996, 11, 485–489. [Google Scholar] [CrossRef]
  25. Alvarado, R.; Niemann, A. Underground Pumped-Storage Hydroelectricity Using Exisiting Coal Mining Infrastructure. In Proceedings of the 36th IAHR World Congress, The Hague, The Netherlands, 28 June–3 July 2015; pp. 1–8. [Google Scholar]
  26. Zillmann, A.; Perau, E. A conceptual analysis for an underground pumped storage plant in rock mass of the Ruhr region. In Proceedings of the Geotechnical Engineering for Infrastructure and Development—XVI European Conference on Soil Mechanics and Geotechnical Engineering, ECSMGE 2015, Edinburgh, Scotland, UK, 13–17 September 2015; Volume 7, pp. 3789–3794. [Google Scholar]
  27. US Army Corps of Engineers. An Assessment of Hydroelectric Pumped Storage; Technical Report—National Hydroelectric Power Resources Study; The U.S. Army Engineer Institute for Water Resources: Washington, DC, USA, 1981. [Google Scholar]
  28. Bendigo Sustainability Group. Bendigo Mines Pumped Hydro Project. Available online: https://www.bsg.org.au/bendigo-pumped-hydro-project/ (accessed on 2 January 2020).
  29. Energiasalv Pakri OU. The Muuga Seawater Pumped Hydroelectricity Storage Project. Available online: http://www.tuuleenergia.ee/en/2018/02/ (accessed on 20 January 2020).
  30. Northern Ostrobothnia Centre for Economic Development Transport envionment. Energy Storage in Mine. Available online: https://callio.info (accessed on 20 January 2020).
  31. Bear, J.; Cheng, A.H.D. Modeling Groundwater Flow and Contaminant Transport. In Modeling Groundwater Flow and Contaminant Transport; Springer: Cham, Switzerland, 2010. [Google Scholar] [CrossRef]
  32. Bodeux, S.; Pujades, E.; Orban, P.; Brouyère, S.; Dassargues, A. Interactions between groundwater and the cavity of an old slate mine used as lower reservoir of an UPSH (Underground Pumped Storage Hydroelectricity): A modelling approach. Eng. Geol. 2017, 217, 71–80. [Google Scholar] [CrossRef] [Green Version]
  33. Geth, F.; Brijs, T.; Kathan, J.; Driesen, J.; Belmans, R. An overview of large-scale stationary electricity storage plants in Europe: Current status and new developments. Renew. Sustain. Energy Rev. 2015, 52, 1212–1227. [Google Scholar] [CrossRef] [Green Version]
  34. Vanbellingen, R.; Lejeune, A.; Marchal, J.; Poels, M.; Salhoul, M. Vibration of Screen at La Plate Taille Hydro Storage Power Station in Belgium. In Proceedings of the Congress of International Association for Hydraulic Research, Moscow, Russia, 5–9 September 1983; Volume 3, pp. 325–336. [Google Scholar]
  35. Akinyele, D.O.; Rayudu, R.K. Review of energy storage technologies for sustainable power networks. Sustain. Energy Technol. Assess. 2014, 8, 74–91. [Google Scholar] [CrossRef]
  36. Dixon, S.; Hall, C. Fluid Mechanics and Thermodynamics of Turbomachinery; Butterworth-Heinemann: Oxford, UK, 2010. [Google Scholar] [CrossRef]
  37. Jaumotte, A.L.; Decock, P.; Megnint, L.; Verdurand, G. Hydraulic turbines: Description and Evolution. In Description et évolution. Techniques de L’ingénieur. Génie Mécanique; Turbines hydrauliques: Paris, France, 1994; Volume BL3, ISSN 1762-8768. [Google Scholar]
  38. Morabito, A.; de Oliveira e Silva, G.; Hendrick, P. Deriaz pump-turbine for pumped hydro energy storage and micro applications. J. Energy Stor. 2019, 24, 100788. [Google Scholar] [CrossRef]
  39. Židonis, A.; Aggidis, G.A. State of the art in numerical modelling of Pelton turbines. Renew. Sustain. Energy Rev. 2015, 45, 135–144. [Google Scholar] [CrossRef]
  40. Baumgarten, S.; Guder, W. Pumpen als Turbinen. Tech. Kompakt Pumpen Anl. 2005, 11, 2–9. [Google Scholar]
  41. Nourbakhsh, A.; Derakhshan, S.; Javidpour, E.; Riasi, A. Centrifugal & axial pumps used as turbines in small hydropower stations. In Proceedings of the Hidroenergia 2010: International Congress on Small Hydropower International Conference and Exhibition on Small Hydropower, Lausanne, Switzerland, 16–19 June 2010; pp. 16–19. [Google Scholar]
  42. Novara, D.; Carravetta, A.; McNabola, A.; Ramos, H.M. Cost Model for Pumps as Turbines in Run-of-River and In-Pipe Microhydropower Applications. J. Water Resour. Plan. Manag. 2019, 145, 04019012. [Google Scholar] [CrossRef]
  43. Binama, M.; Su, W.T.; Li, X.B.; Li, F.C.; Wei, X.Z.; An, S. Investigation on pump as turbine (PAT) technical aspects for micro hydropower schemes: A state-of-the-art review. Renew. Sustain. Energy Rev. 2017, 79, 148–179. [Google Scholar] [CrossRef]
  44. Manolakos, D.; Papadakis, G.; Papantonis, D.; Kyritsis, S. A stand-alone photovoltaic power system for remote villages using pumped water energy storage. Energy 2004, 29, 57–69. [Google Scholar] [CrossRef]
  45. Morabito, A.; Hendrick, P. Pump as turbine applied to micro energy storage and smart water grids: A case study. Appl. Energy 2019, 241, 567–579. [Google Scholar] [CrossRef]
  46. Paish, O. Micro-hydropower: Status and prospects. Proc. Inst. Mech. Eng. Part A J. Power Energy 2002, 216, 31–40. [Google Scholar] [CrossRef]
  47. Deriaz, P.; Warnock, J.G. Reversible Pump-Turbines for Sir Adam Beck-Niagara Pumping-Generating Station. J. Basic Eng. 1959, 81, 521–529. [Google Scholar] [CrossRef]
  48. Service public de Wallonie. Géoportail de la Wallonie. Available online: https://geoportail.wallonie.be (accessed on 29 June 2020).
  49. Gronemeier, K.; Jäckel, B. Pumped-Storage Hydroelectricityplan Martelange Pre-Feasibility-Study; L4391 Pontpierre: Luxembourg, 2013. [Google Scholar]
  50. Morabito, A.; Furtado, G.C.A.; Amarante Mesquita, A.L.; Hendrick, P. Variable speed regulation for pump as turbine in a micro pumped hydro energy storage application. In Proceedings of the 38th IAHR World Congress—“Water: Connecting the World”, Panama City, Panama, 1–6 September 2019; pp. 4039–4046. [Google Scholar] [CrossRef]
  51. Connolly, D.; Lund, H.; Finn, P.; Mathiesen, B.V.; Leahy, M. Practical operation strategies for pumped hydroelectric energy storage (PHES) utilising electricity price arbitrage. Energy Policy 2011, 39, 4189–4196. [Google Scholar] [CrossRef] [Green Version]
  52. de Oliveira e Silva, G.; Hendrick, P. Pumped hydro energy storage in buildings. Appl. Energy 2016, 179, 1242–1250. [Google Scholar] [CrossRef]
  53. Ogayar, B.; Vidal, P.G. Cost determination of the electro-mechanical equipment of a small hydro-power plant. Renew. Energy 2009, 34, 6–13. [Google Scholar] [CrossRef]
  54. Denholm, P.; Kulcinski, G.L. Life cycle energy requirements and greenhouse gas emissions from large scale energy storage systems. Energy Convers. Manag. 2004, 45, 2153–2172. [Google Scholar] [CrossRef]
  55. International Energy Agency. Data and Statistics. Available online: https://www.iea.org/ (accessed on 5 March 2020).
  56. Valentín, D.; Presas, A.; Egusquiza, E.; Valero, C.; Egusquiza, M.; Bossio, M. Power swing generated in Francis turbines by part load and overload instabilities. Energies 2017, 10, 2124. [Google Scholar] [CrossRef] [Green Version]
  57. Nicolet, C. Hydroacoustic Modelling and Numerical Simulation of Unsteady Operation of Hydroelectric Systems. Ph.D. Thesis, EPFL, Lausanne, Switzerland, 2007. [Google Scholar]
  58. Nicolet, C.; Avellan, P.F.; Sapin, A. New Tool for the Simulation of Transient Phenomena in Francis Turbine Power Plants. In Proceedings of the Hydraulic Machinery and Systems—21st IAHR Symposium, Avellan, France, 9–12 September 2002. [Google Scholar]
  59. Nicolet, C.; Greiveldinger, B.; Herou, J.J.; Kawkabani, B.; Allenbach, P.; Simond, J.; Avellan, F. High-Order Modeling of Hydraulic Power Plant in Islanded Power Network. IEEE Trans. Power Syst. 2007, 22, 1870–1880. [Google Scholar] [CrossRef]
  60. Landry, C. Hydroacoustic Modeling of a Cavitation Vortex Rope for a Francis Turbine. Ph.D. Thesis, EPFL, Lausanne, Switzerland, 2015. [Google Scholar]
  61. Dunlap, R.A. Renewable Energy: Volumes 2; Morgan & Claypool Publishers: San Rafael, UK, 2020; pp. 14–17. [Google Scholar]
  62. Ye, J.; Zeng, W.; Zhao, Z.; Yang, J.; Yang, J. Optimization of pump turbine closing operation to minimizewater hammer and pulsating pressures during load rejection. Energies 2020, 13, 1000. [Google Scholar] [CrossRef] [Green Version]
  63. Müller, A.; Favrel, A.; Landry, C.; Avellan, F. Fluid–structure interaction mechanisms leading to dangerous power swings in Francis turbines at full load. J. Fluids Struct. 2016, 69, 56–71. [Google Scholar] [CrossRef]
  64. Favrel, A. Prediction of hydro-acoustic resonances in hydropower plants by a new approach based on the concept of swirl number. J. Hydraul. Res. 2019, 1–18. [Google Scholar] [CrossRef]
  65. Pereira, J.G. Predicting the Dynamic Behavior of Francis Turbine Generating Units. Ph.D. Thesis, EPFL, Lausanne, Switzerland, 2019. [Google Scholar]
  66. Sabihuddin, S.; Kiprakis, A.E.; Mueller, M. A numerical and graphical review of energy storage technologies. Energies 2015, 8, 172–216. [Google Scholar] [CrossRef]
  67. Albadi, M.H.; Al-Busaidi, A.S.; El-Saadany, E.F. Using PHES to facilitate wind power integration in isolated systems—Case study. In Proceedings of the 2017 IEEE International Conference on Industrial Technology (ICIT), Toronto, ON, Canada, 22–25 March 2017. [Google Scholar] [CrossRef]
  68. Chen, H.; Cong, T.N.; Yang, W.; Tan, C.; Li, Y.; Ding, Y. Progress in electrical energy storage system: A critical review. Prog. Nat. Sci. 2009, 19, 291–312. [Google Scholar] [CrossRef]
  69. Poullikkas, A. A comparative overview of large-scale battery systems for electricity storage. Renew. Sustain. Energy Rev. 2013, 27, 778–788. [Google Scholar] [CrossRef]
  70. Nikolaidis, P.; Poullikkas, A. Cost metrics of electrical energy storage technologies in potential power system operations. Sustain. Energy Technol. Assess. 2018, 25, 43–59. [Google Scholar] [CrossRef]
  71. OECD Environmental Data.Technical Report. 2019. Available online: https://stats.oecd.org/ (accessed on 6 February 2020).
  72. Yang, C.J.; Jackson, R.B. Opportunities and barriers to pumped-hydro energy storage in the United States. Renew. Sustain. Energy Rev. 2011, 15, 839–844. [Google Scholar] [CrossRef]
  73. Pujades, E.; Orban, P.; Archambeau, P.; Erpicum, S.; Dassargues, A. Numerical study of the Martelange mine to be used as underground reservoir for constructing an Underground Pumped Storage Hydropower plant. Adv. Geosci. 2018, 45, 51–56. [Google Scholar] [CrossRef] [Green Version]
  74. Mou, J.; Chen, Z.; Gu, Y.; Fan, T. Effect of sealing ring clearance on pump performance. World Pumps 2016, 2016, 38–41. [Google Scholar] [CrossRef]
  75. Tam, S.W.; Clinch, J. Study of Certain Economic Aspects of Turbomachinery for Underground Pumped Hydroelectric Storage Plants; Technical Report; Argonne National Lab.: Lemont, IL, USA, 1979. [Google Scholar]
  76. Truong, Q.M.; Bouvet, Y.; Periolat, C. Ultra high head units for France’s Super Bissorte pumped-storage plant. Int. Water Power Dam Constr. 1988, 40, 11–15. [Google Scholar]
  77. Erskine, A.; Van Rooy, O. The complete refurbishment of Culligran underground hydropower station. In Hydropower Developments—New Projects, Rehabilitation, and Power Recovery; John Wiley and Sons Ltd.: Chichester, West Sussex, UK, 2004; Volume 2004, pp. 125–140. [Google Scholar]
  78. Iliev, I.; Trivedi, C.; Dahlhaug, O.G. Variable-speed operation of Francis turbines: A review of the perspectives and challenges. Renew. Sustain. Energy Rev. 2019, 103, 109–121. [Google Scholar] [CrossRef]
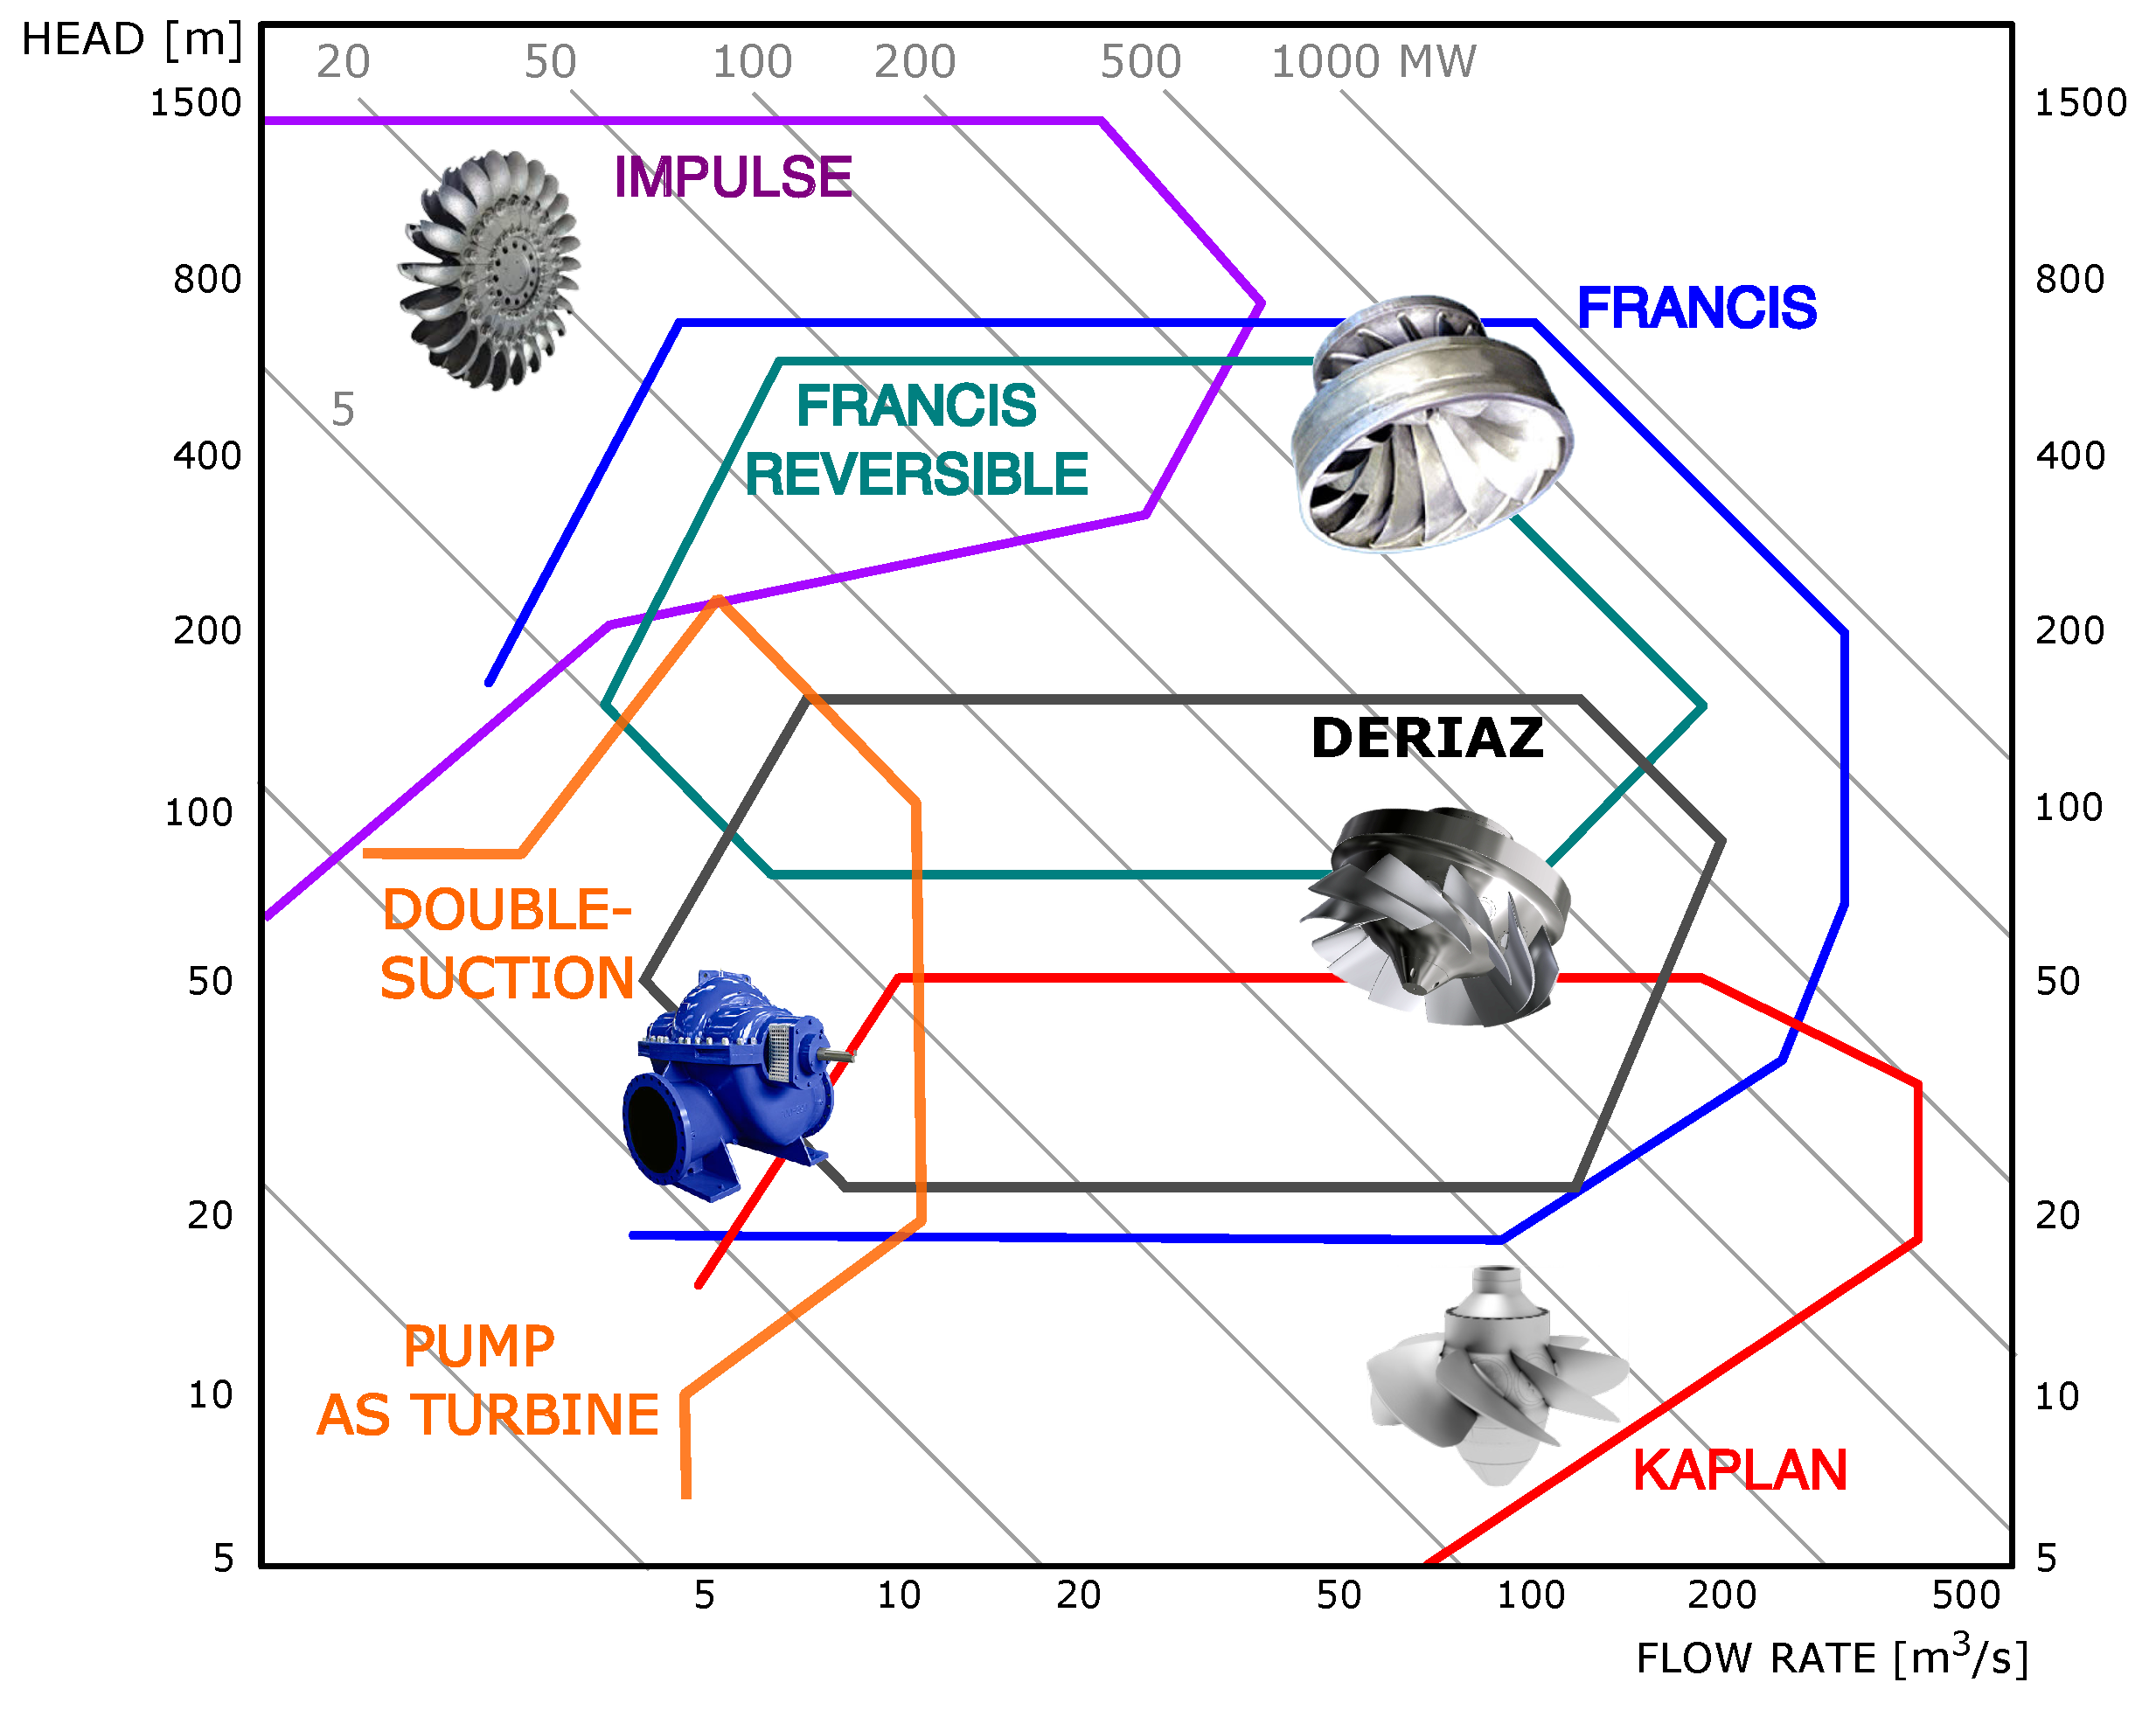
Figure 1. Types of hydraulic turbines in their application area Q-H. Adapted from [38,46,47] and authors’ data.
Energies 13 04000 g001
Figure 2. (a) The slate mine on the Martelange site; (b) 3D model of the mine made by Institut scientifique Wallon de surveillance, de sûreté et de recherche en environnement (ISSeP).
Energies 13 04000 g002
Figure 3. View of Martelange, the mine, and the proposed upper reservoir adapted from [48].
Energies 13 04000 g003
Figure 4. The evolution of the gross head, hydraulic efficiency and power by time for the three turbomachinery configurations A, B and C. Please note in configuration C, pump as turbines (PATs) are coupled with a variable speed driver.
Energies 13 04000 g004
Figure 5. Performance of a slow-Francis turbine by the variation of the relative guide vanes angle α : the speed variation and the flow variation over the their nominal values are on the x-axis and y-axis, respectively.
Energies 13 04000 g005
Figure 6. Performance estimation of the 3 double suction PATs in parallel (p = 3) under 250 m gross head. In the graph other characteristic curve are presented: performance for two PATs in parallel (p = 2) and a single PAT (p = 1). In red, the runaway limit in which in no positive torque is produced.
Energies 13 04000 g006
Figure 7. Scheme of the coal mine. The lower reservoir of the UPSH plant consists of three main galleries and the vertical mine shaft.
Energies 13 04000 g007
Figure 8. Schematic representation of turbine I (for 200 m gross head), II and III (both at 150 m gross head) in series.
Energies 13 04000 g008
Figure 9. SIMSEN components to simulate the Péronnes-lez-Binche power plant.
Energies 13 04000 g009
Figure 10. Time history of the gross head, available head and discharge of each Francis turbine operating at maximum efficiency for the given head (Scenario A).
Energies 13 04000 g010
Figure 11. Operating sequence of the three Francis turbines in series to cope with 300 m gross head variation of the power plant.
Energies 13 04000 g011
Figure 12. Time history of the gross head, available head (left), and discharge (right) of each Francis turbine for the operating conditions presented in scenario B.
Energies 13 04000 g012
Table 1. Existing pumped hydro storage plants in Belgium.
Power CapacityStored EnergyHead
Coo-Trois-Ponts1164 MW5 GWh250 m
Plate-Taille144 MW0.796 GWh45 m
Table 2. Available turbomachinery solutions for Underground Pumped Storage Hydroelectricity (UPSH).
SolutionHead RangeTurbomachineryCharacteristics
Ternaryh > 200 mDistinct turbine and pump groupsExpensive and bulkier solution. Each turbomachine is optimised for pumping or generating. Indicated in the case where the target generated power is quite distinct from the pumping power.
RPTh < 60 mVariable geometry type KaplanSmaller excavation costs. An invertible rotation speed system is required. RPT design is more expensive than for traditional hydraulic turbines.
25 < h < 170 mVariable geometry type Deriaz
70 < h < 600 mFrancis pump-turbine at fixed or variable speed
Table 3. Breakdown of the total initial investment cost expressed in euro.
Cost NameCost Value EURSource
Installation and commissioning3,000,000[15]
Cost of the upper reservoir per volume (V [m 2 ])4,383,500[52] C = 345 V 0.316
Cost of the penstock80,681[20]
Cost of the pumping pipe57,983[20] 600 EUR/ton
Cost of the turbomachinery and electrical equipment1,634,600[53]
Landownership agreements3,000,000Estimation of negotiation
Total initial investment12,157,000
Table 4. Estimation of the greenhouse gas emissions (GHG) emissions per MWh of storage capacity.
ItemEmissions CO 2
Operation1.8 tons CO 2 / GWh
Tunnelling and powerhouse construction8.1 tons CO 2 /MWh
Electrical equipment9.7 tons CO 2 /MWh
Balancing of the plant3.0 tons CO 2 /MWh
Upper reservoir creation2.15 tons CO 2 /MWh
Decommissioning0.8 tons CO 2 /MWh
Table 5. Estimation of the GHG emissions over a 40-year lifetime.
ItemEmissions Ton CO 2
GHG emissions of the stored electricity2,454,123
GHG emissions of plant operation0.9
GHG emissions of plant construction11,875
Tunnelling and powerhouse construction4050
Electrical equipment4850
Balancing of the plant1500
Upper reservoir creation1075
Decommissioning400
Total GHG Emissions16,407,000
Estimation of the avoided GHG Emissions2,179,460