Evolution of Soot Particle Number, Mass and Size Distribution along the Exhaust Line of a Heavy-Duty Engine Fueled with Compressed Natural Gas


Abstract
1. Introduction
2. Materials and Methods
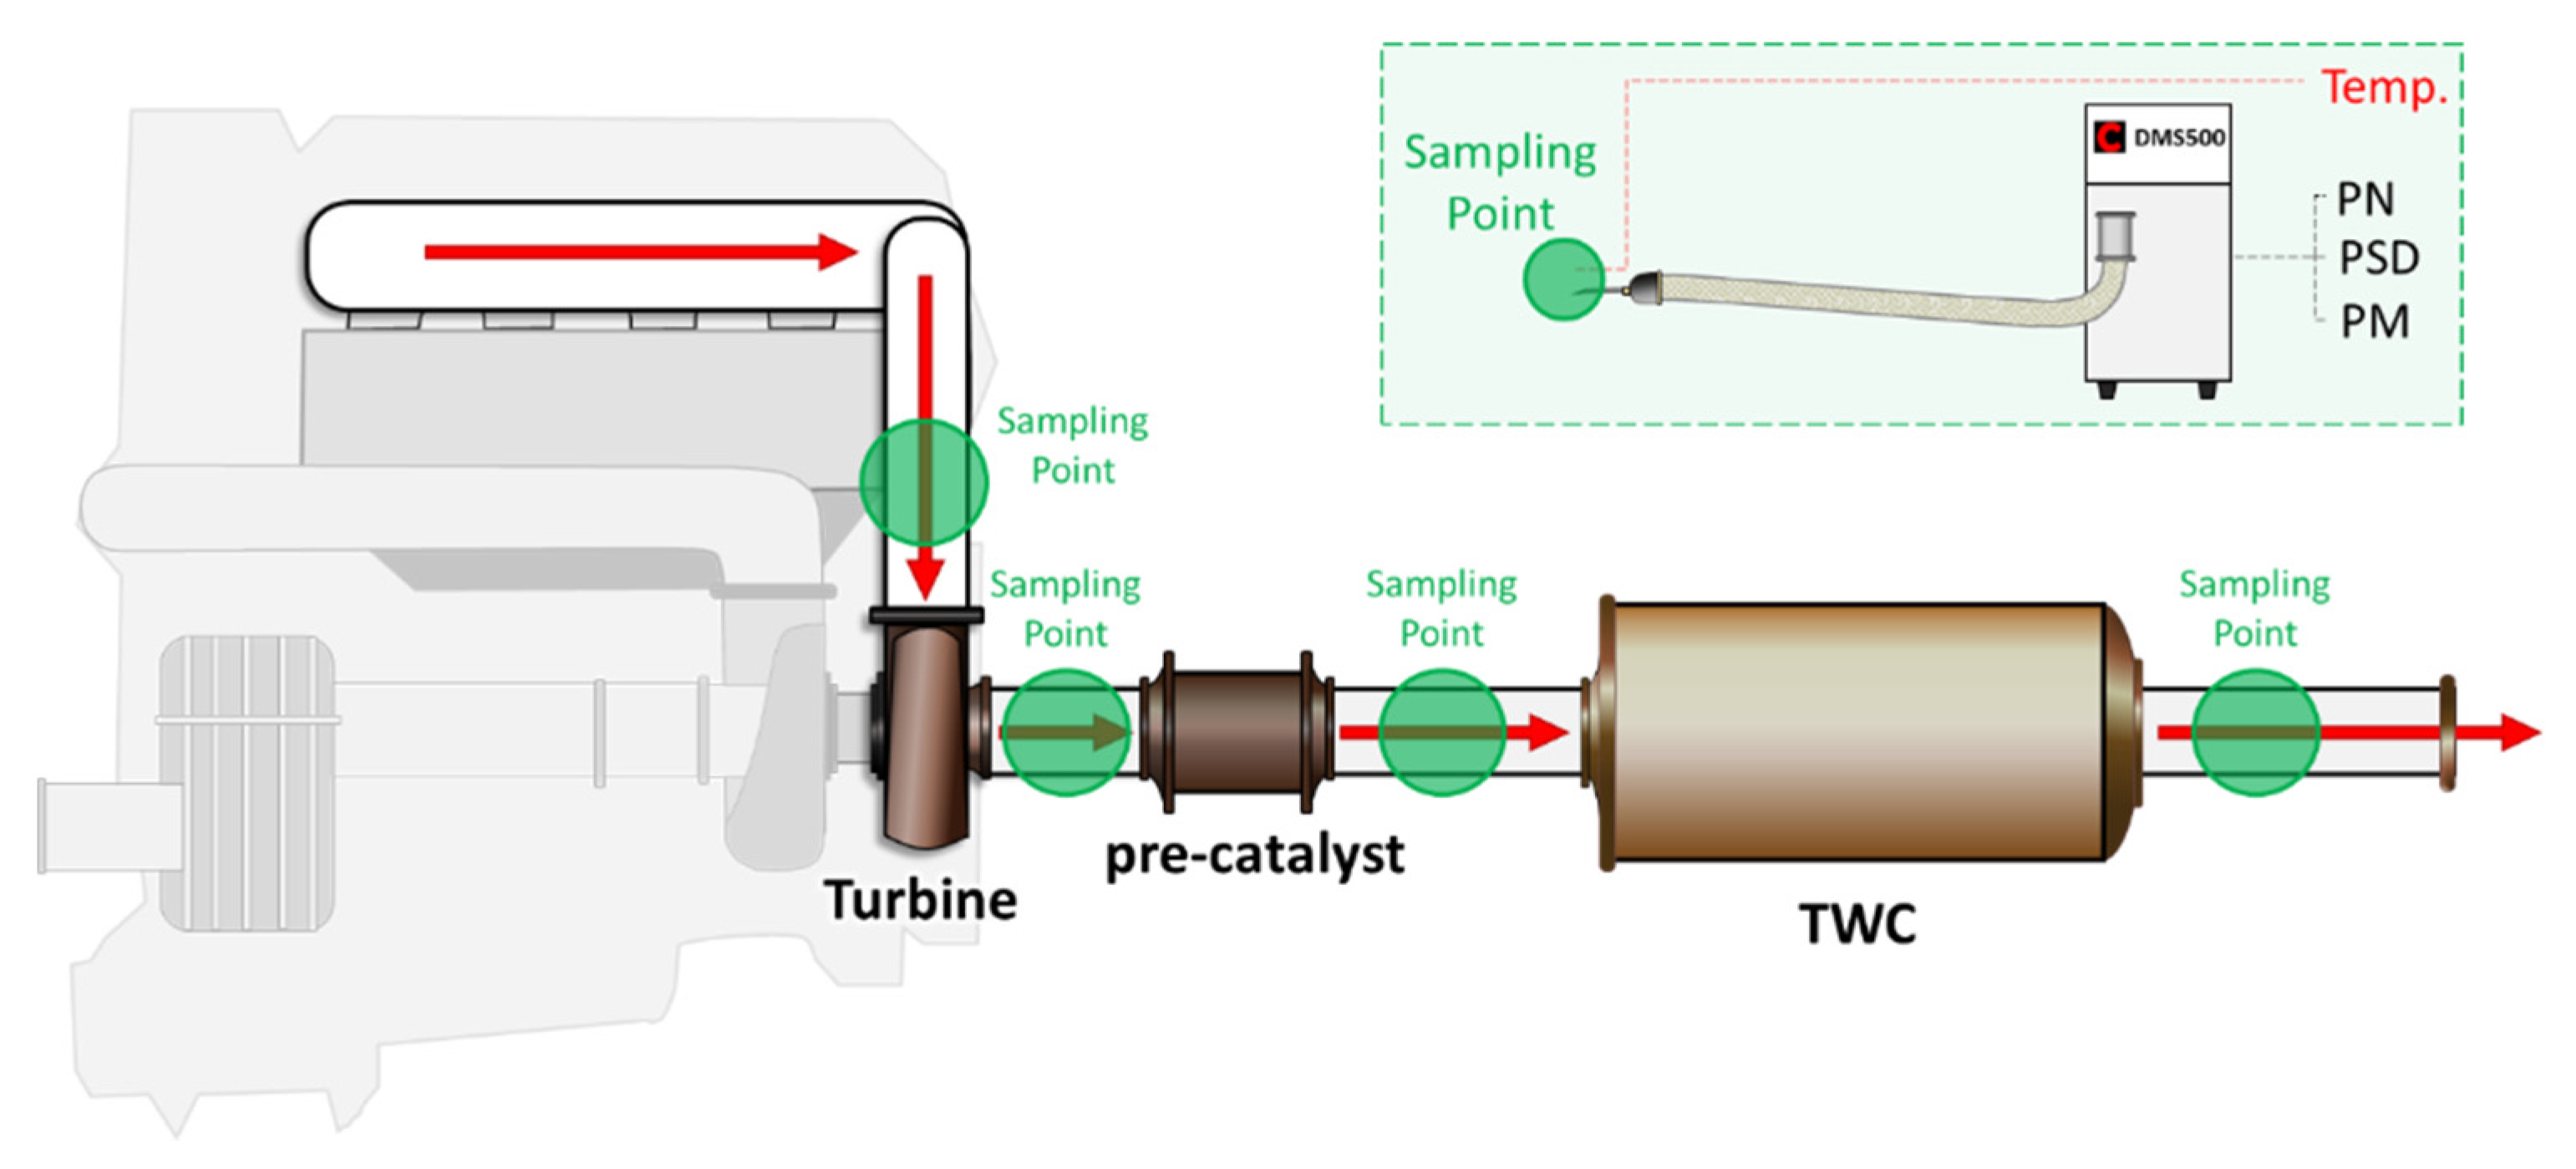
2.1. Experimental Apparatus
2.2. Experimental Procedure
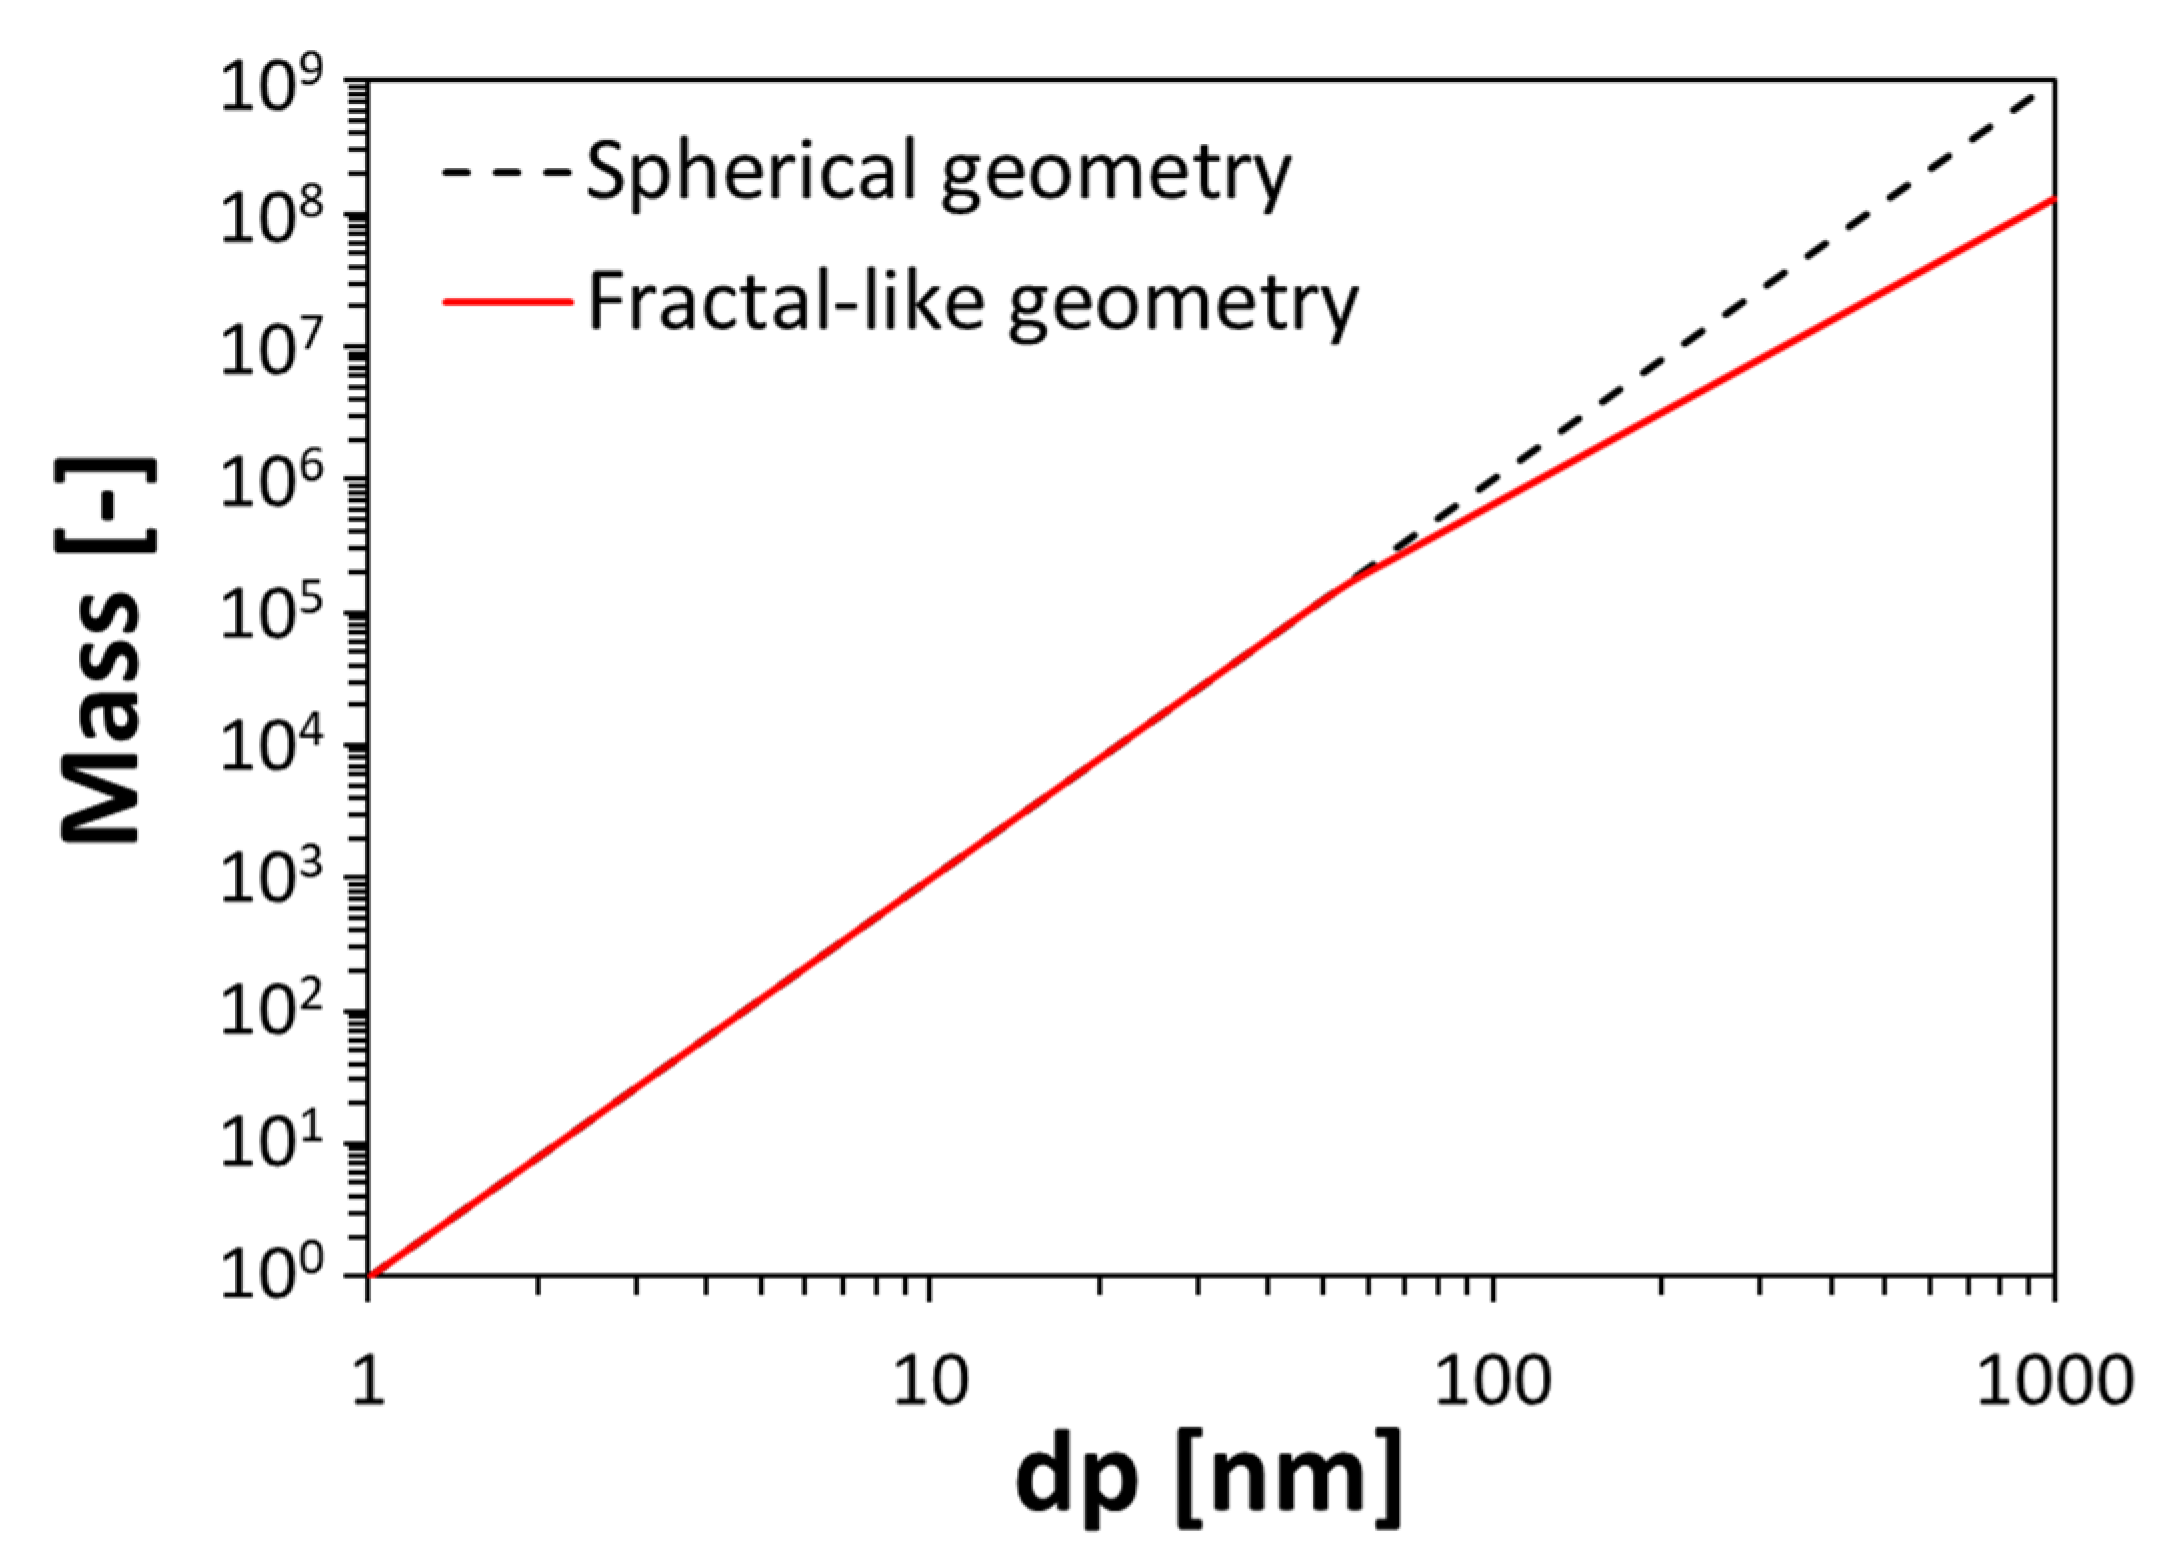
2.3. Data Reduction
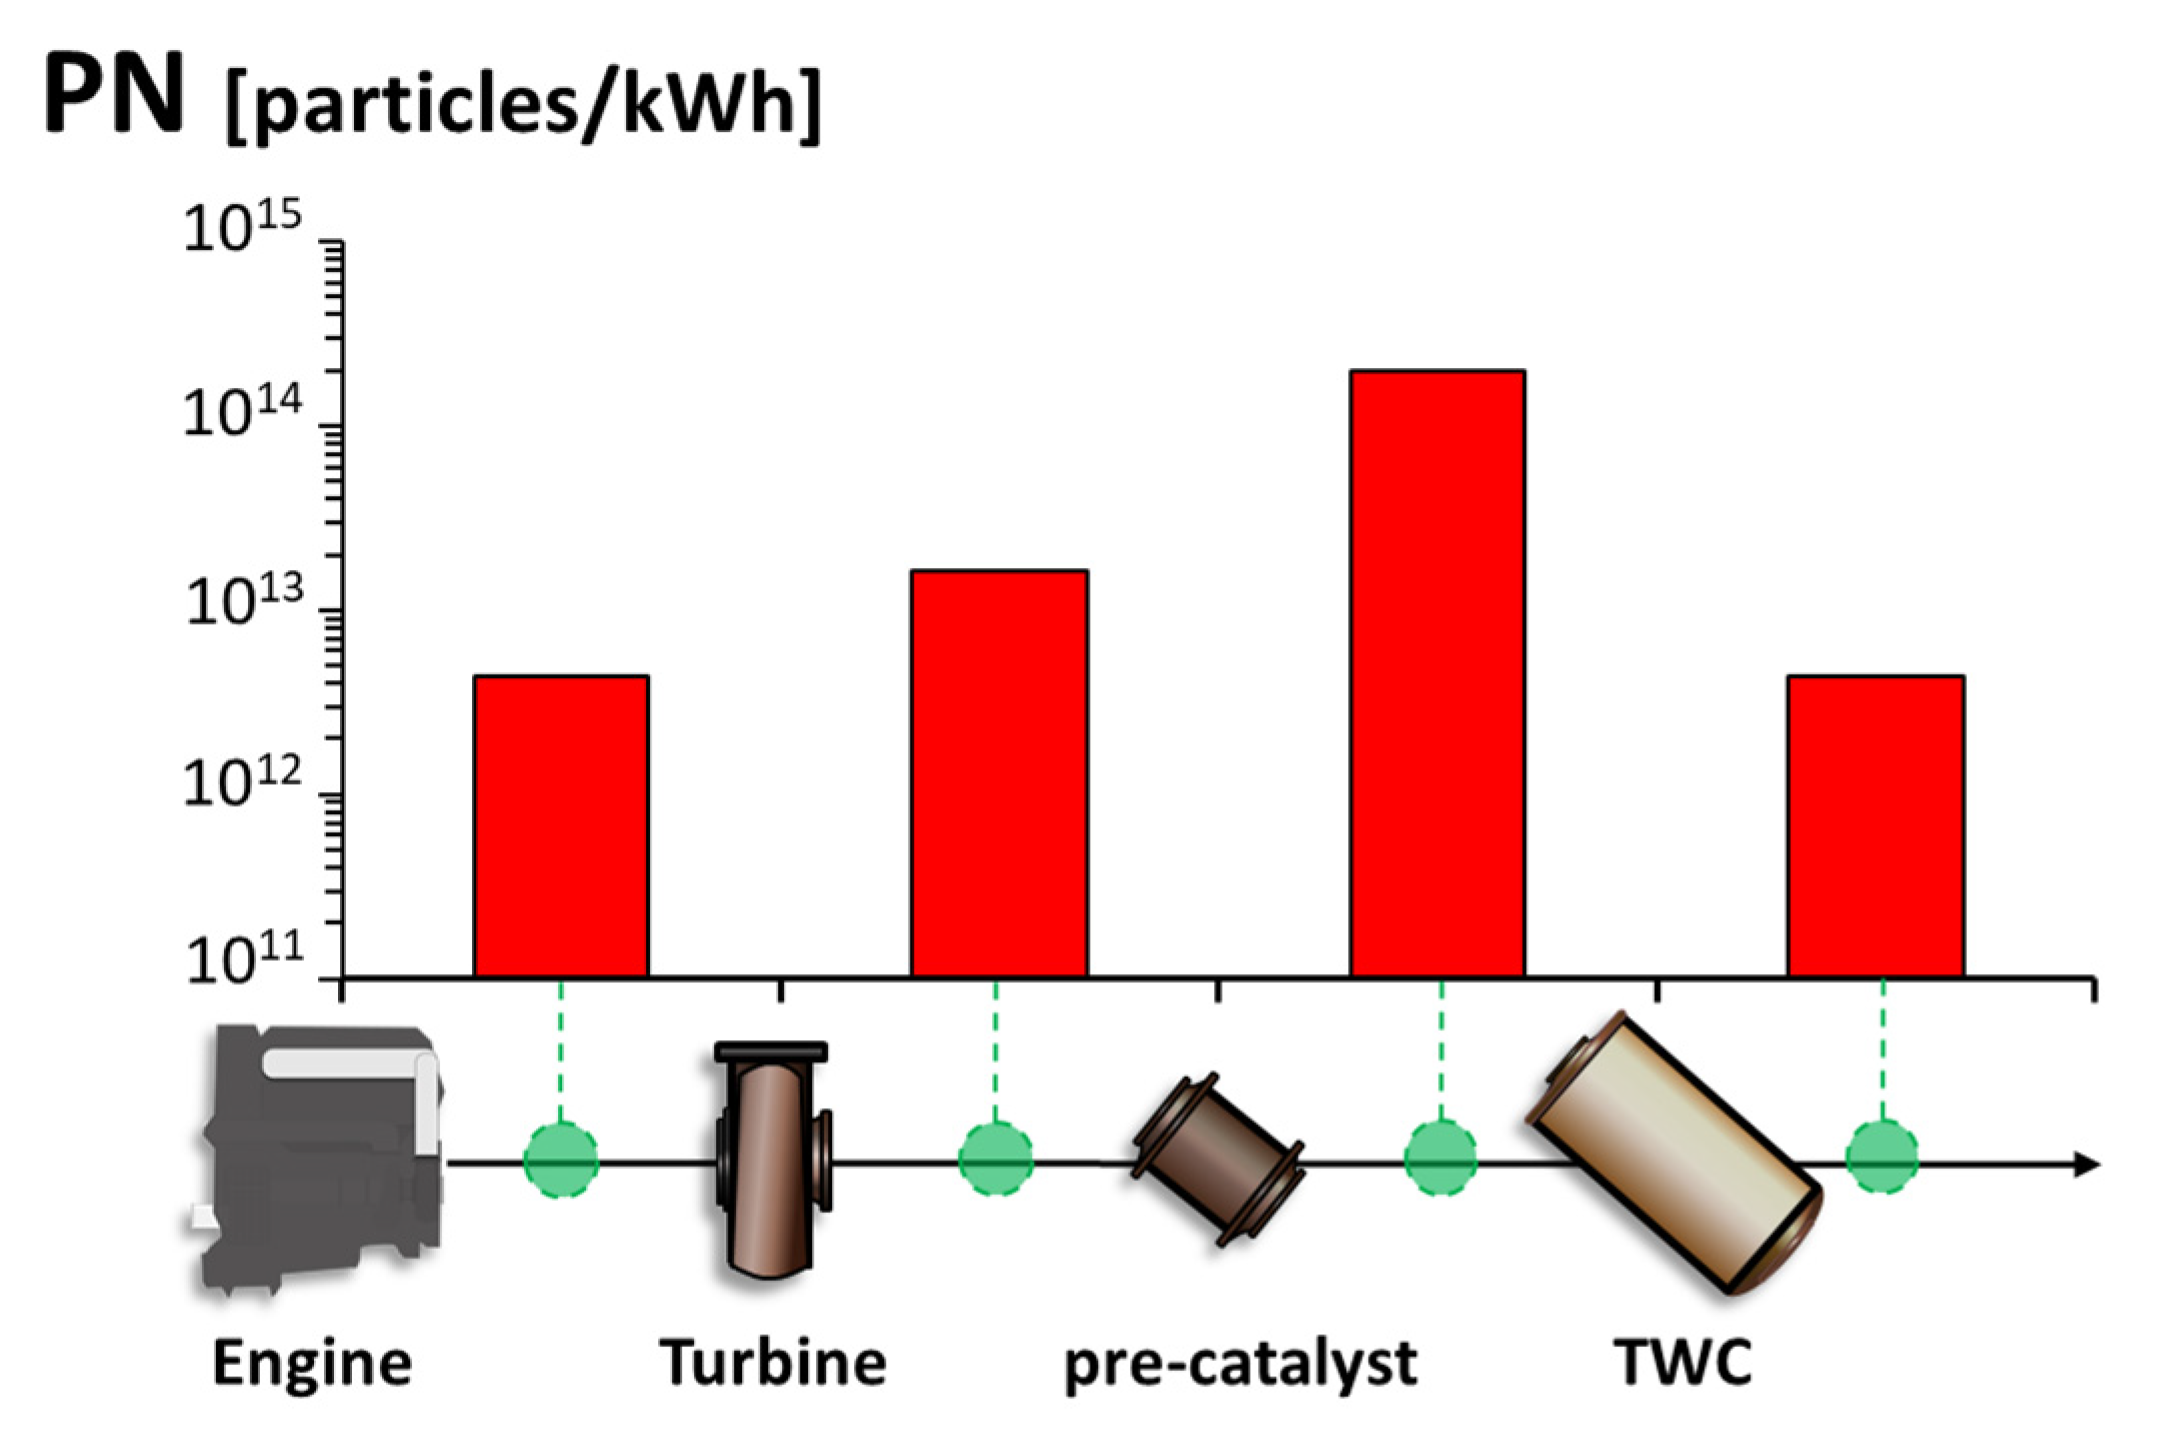
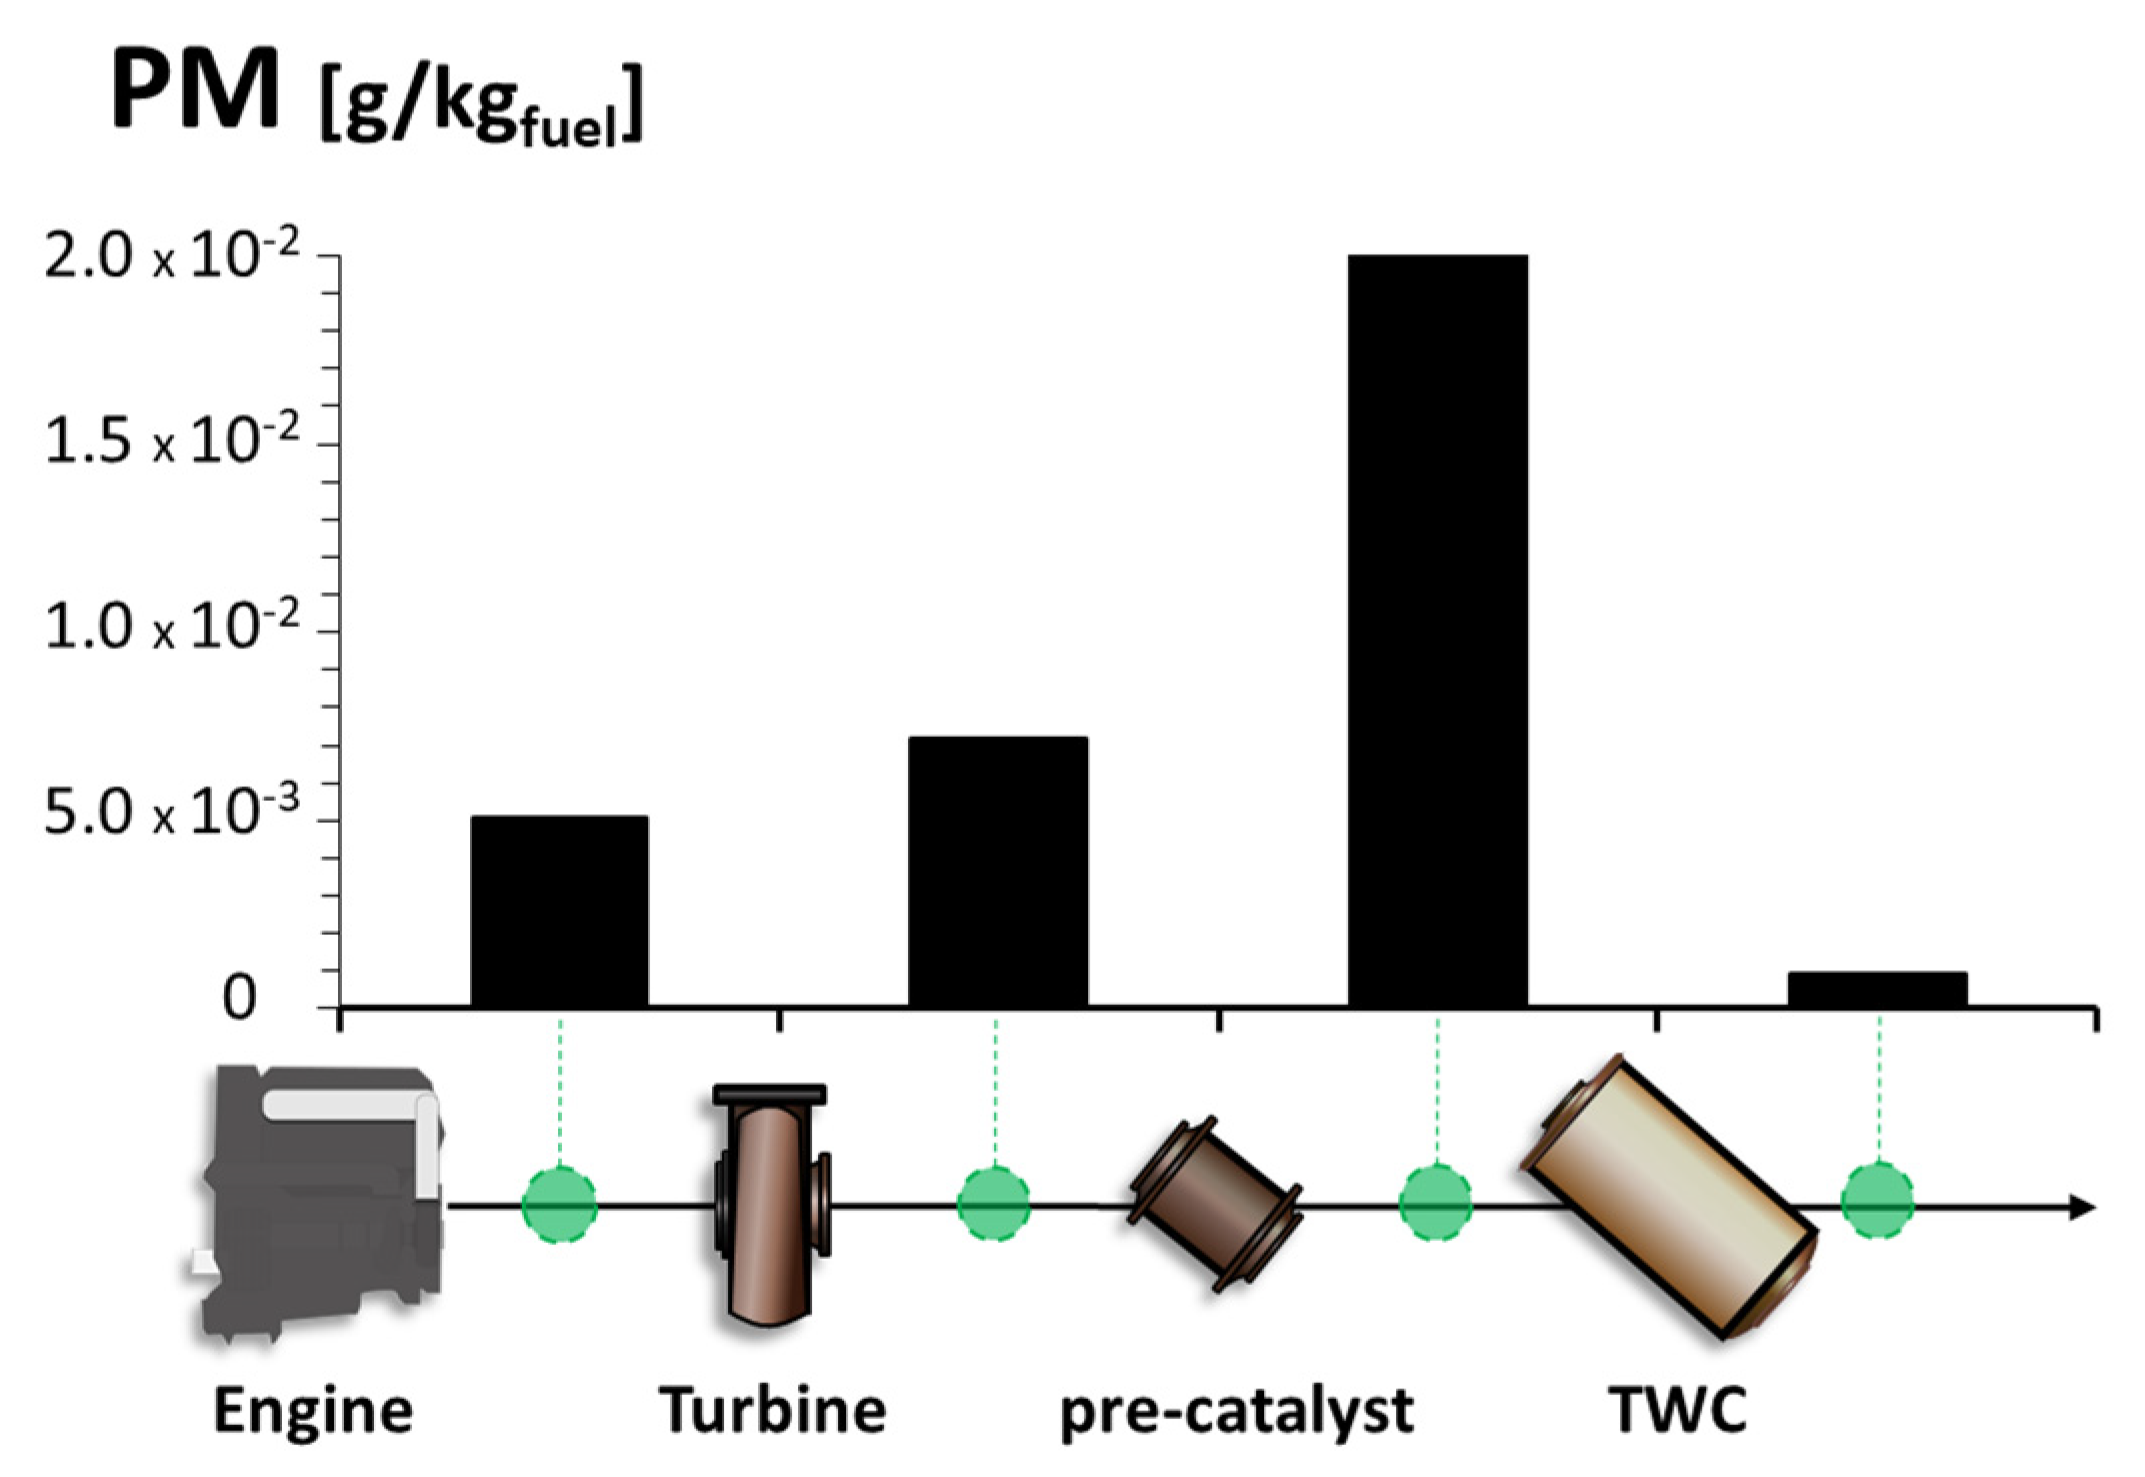
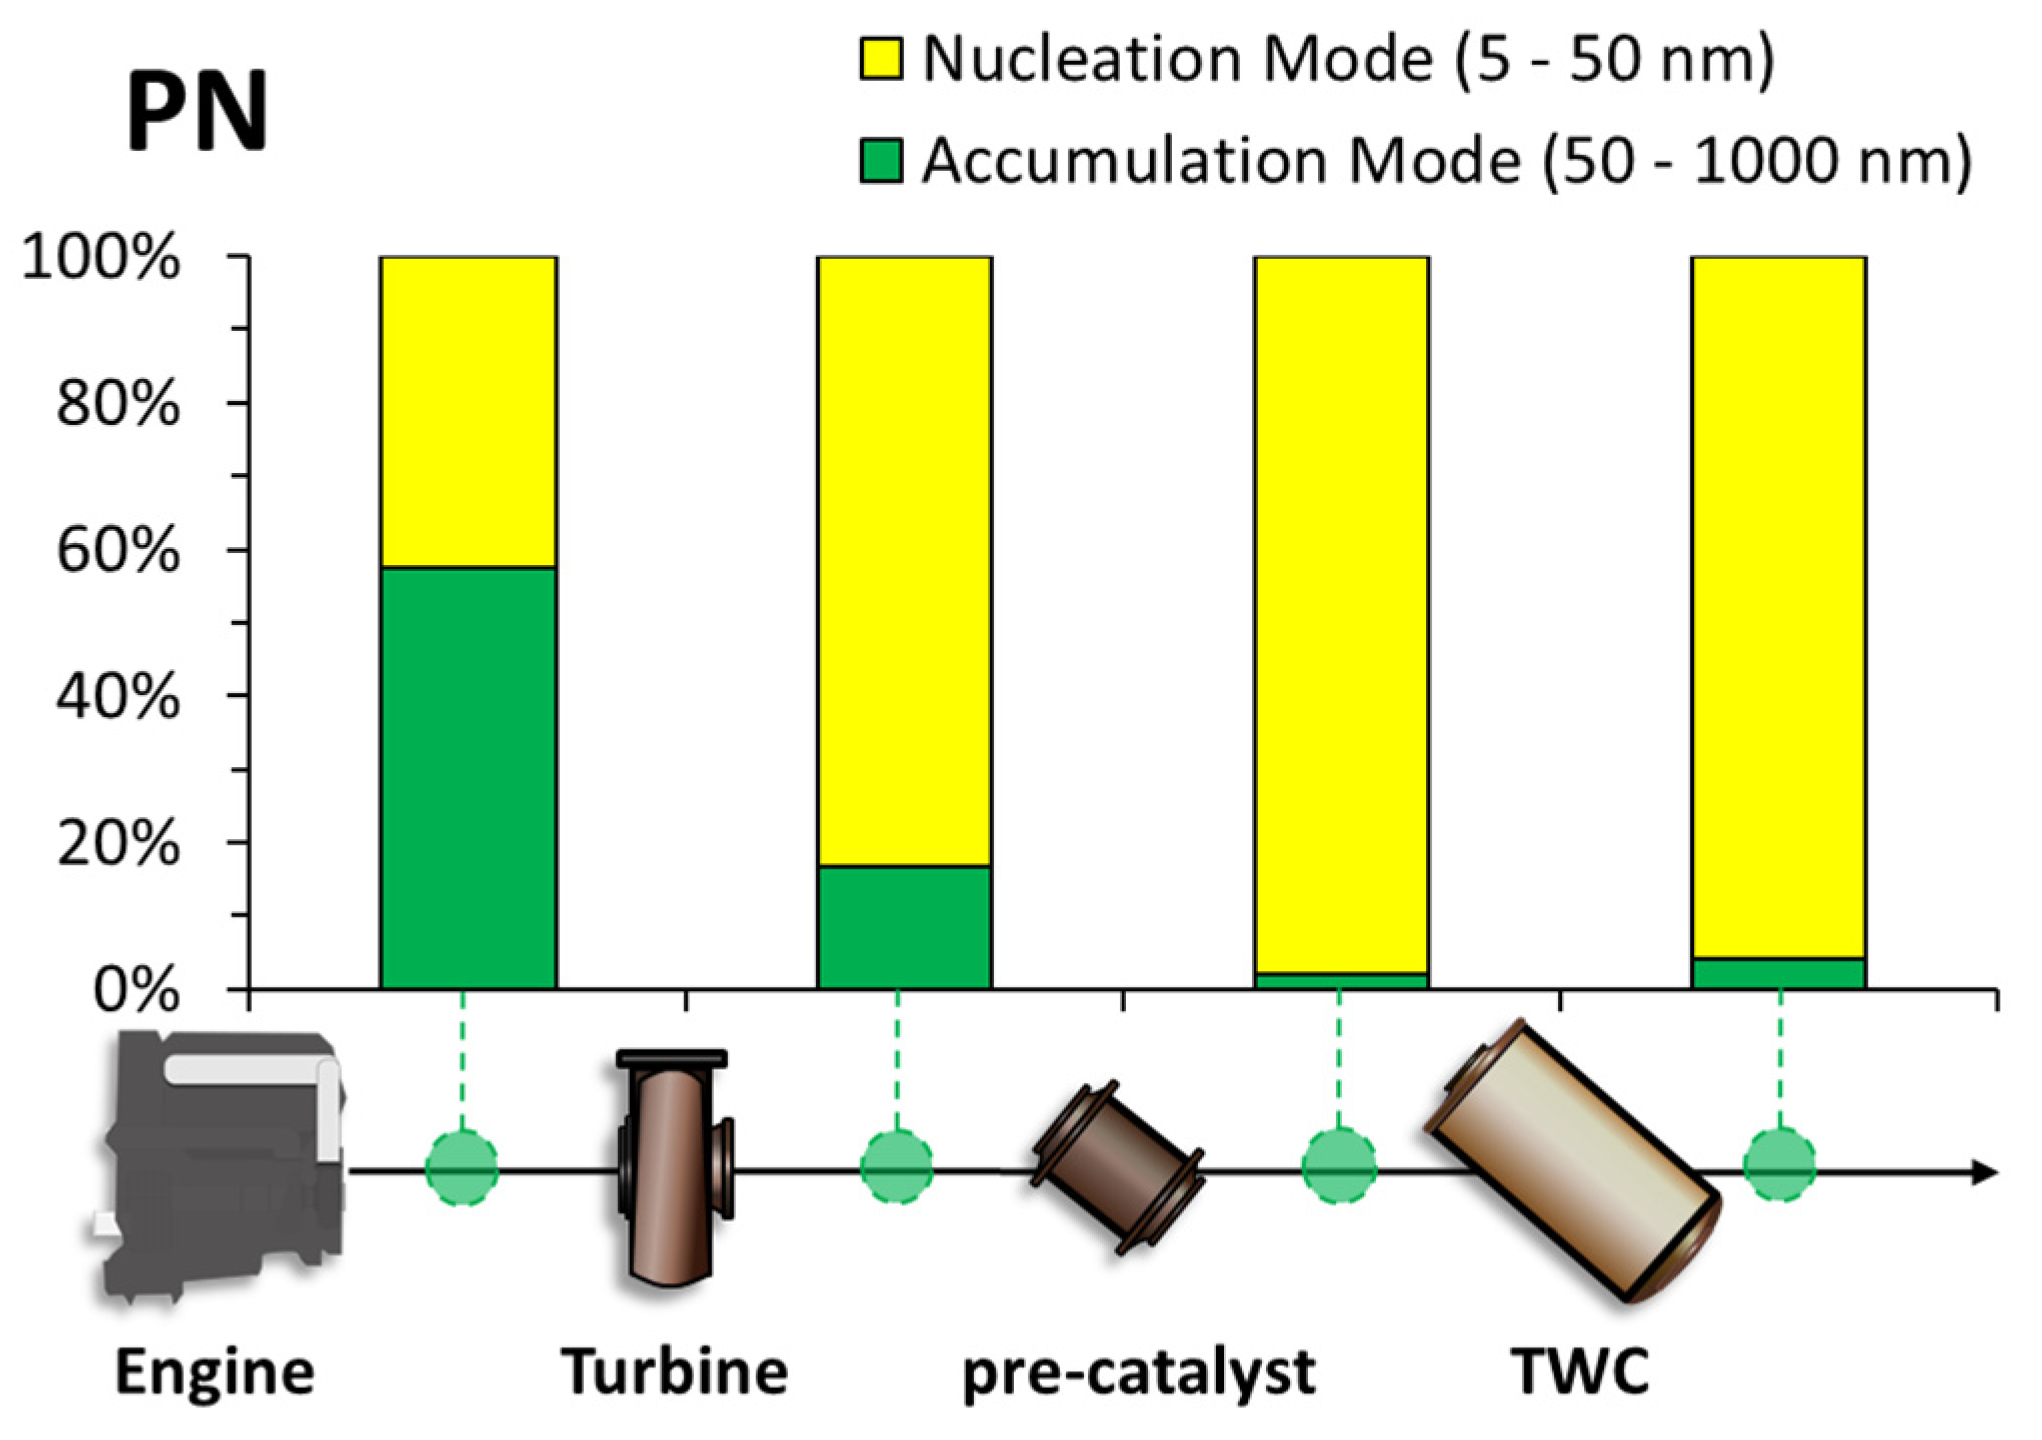
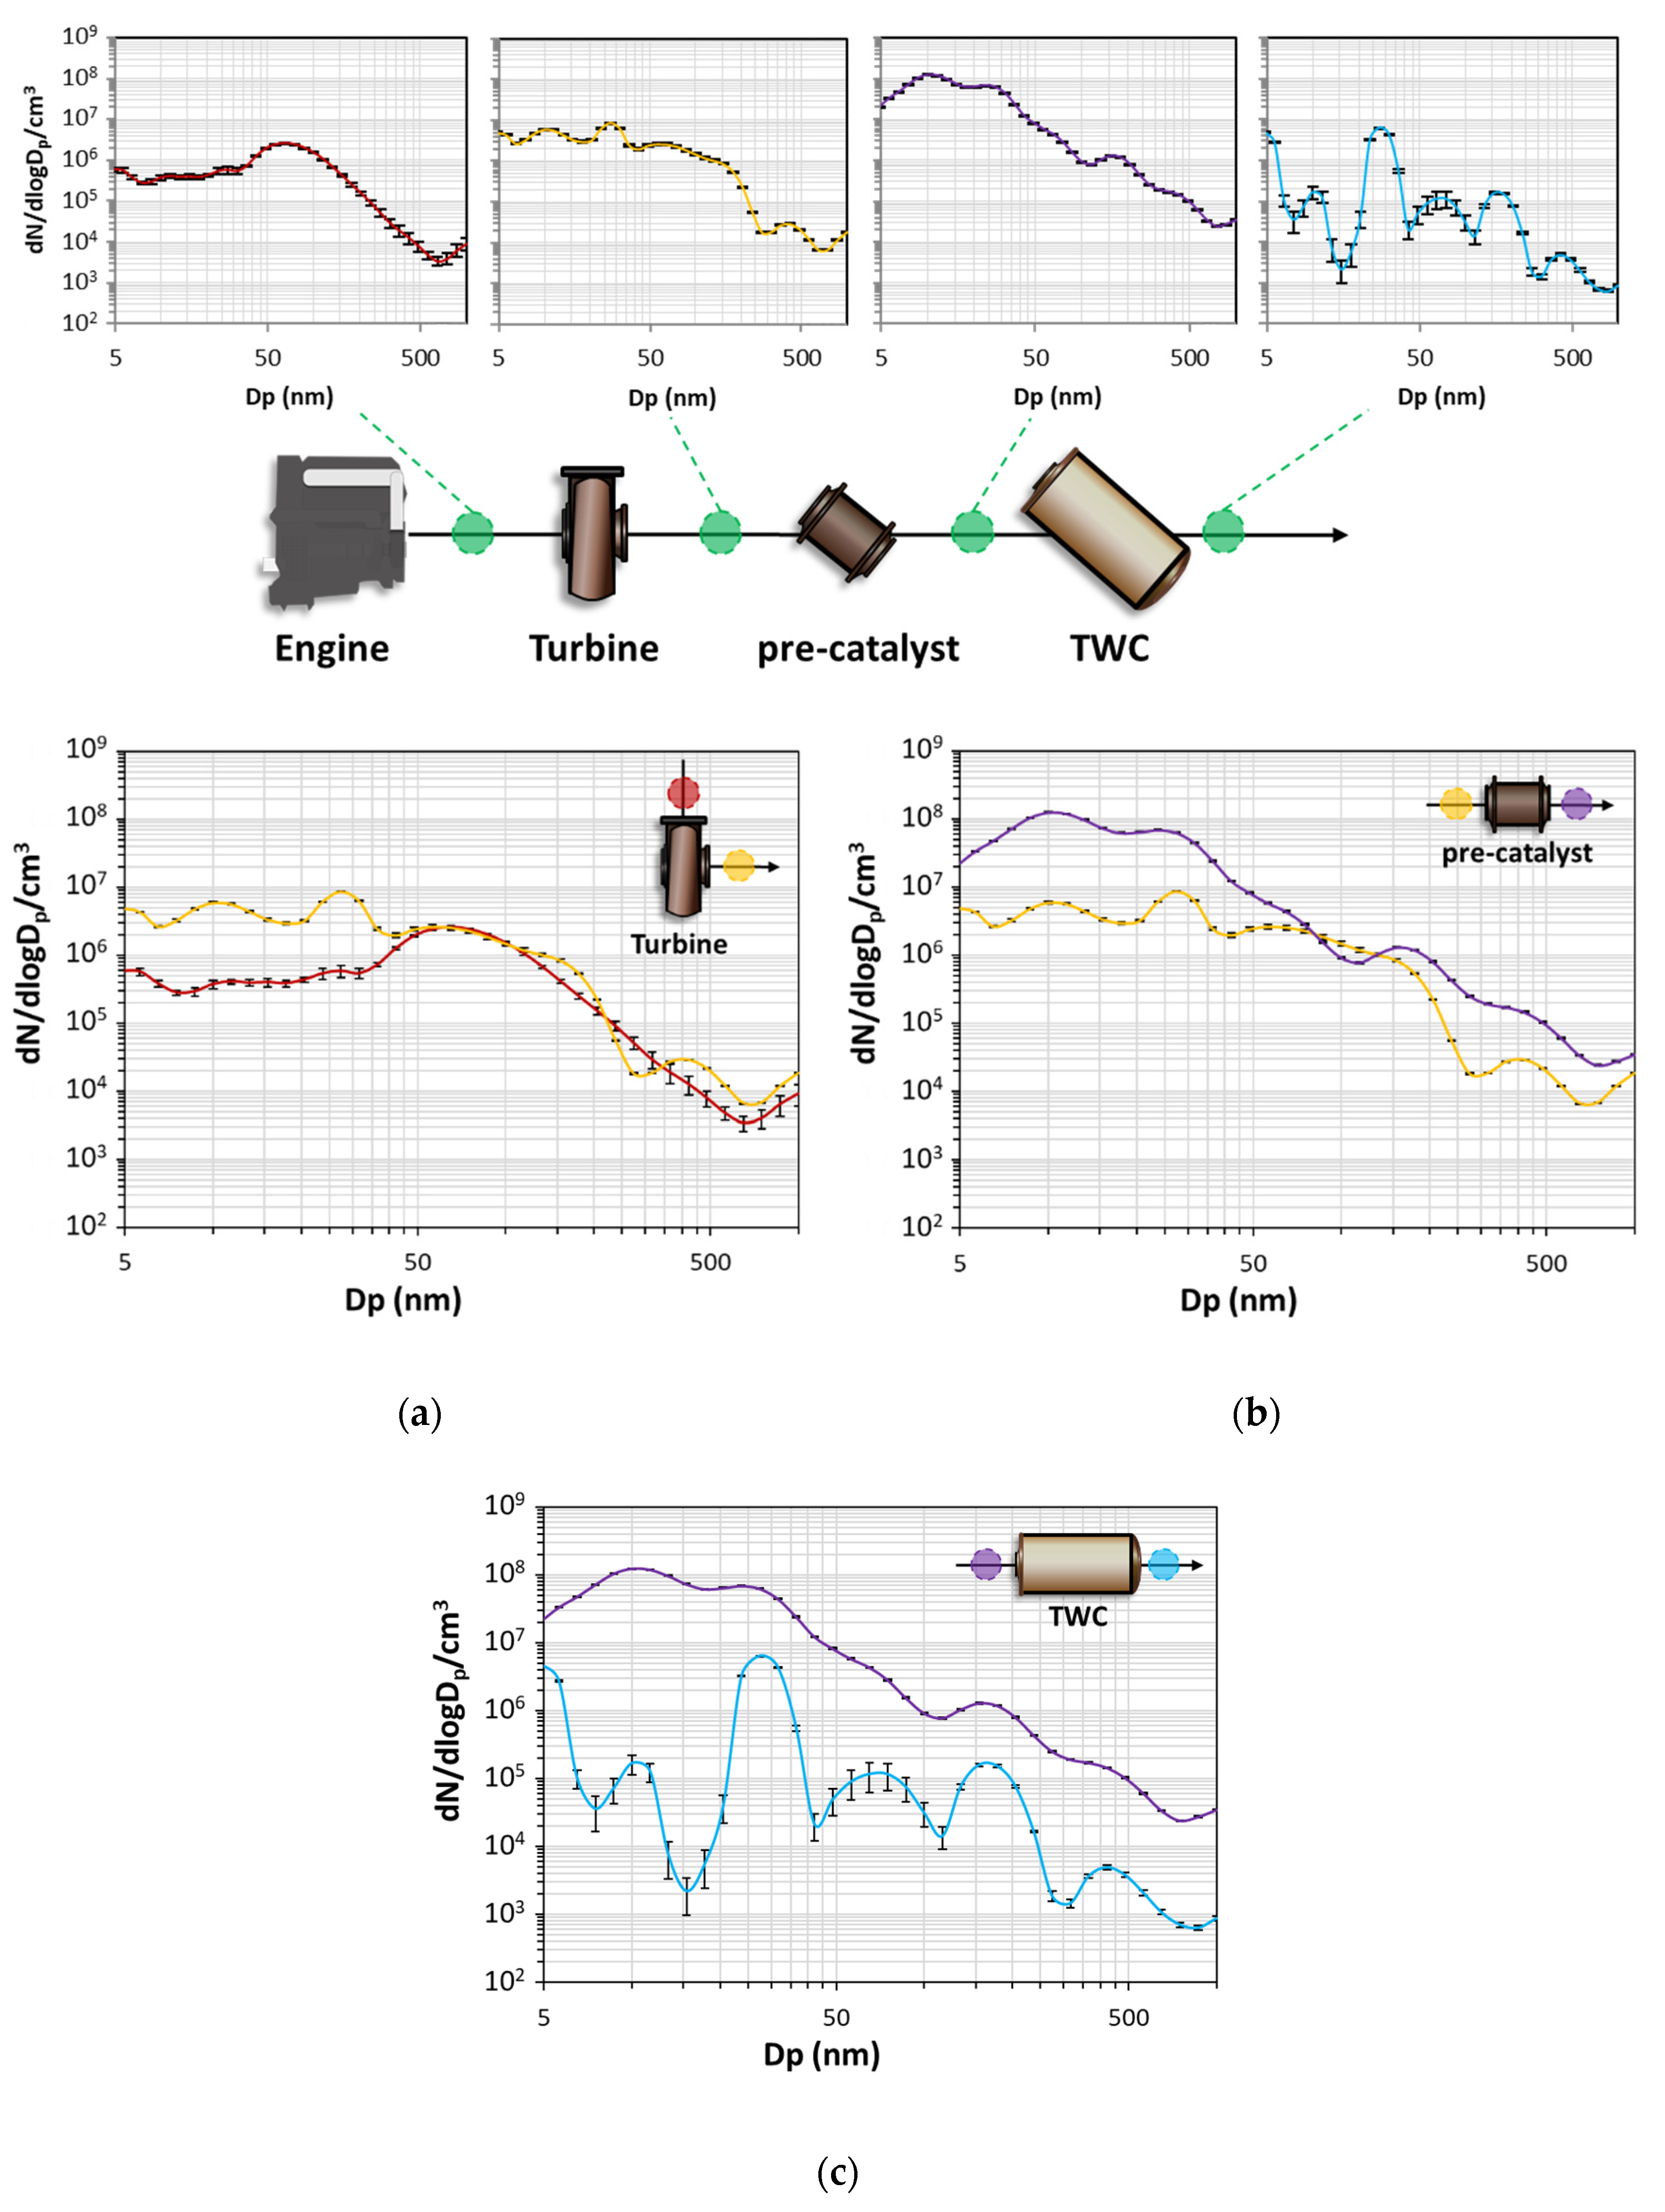
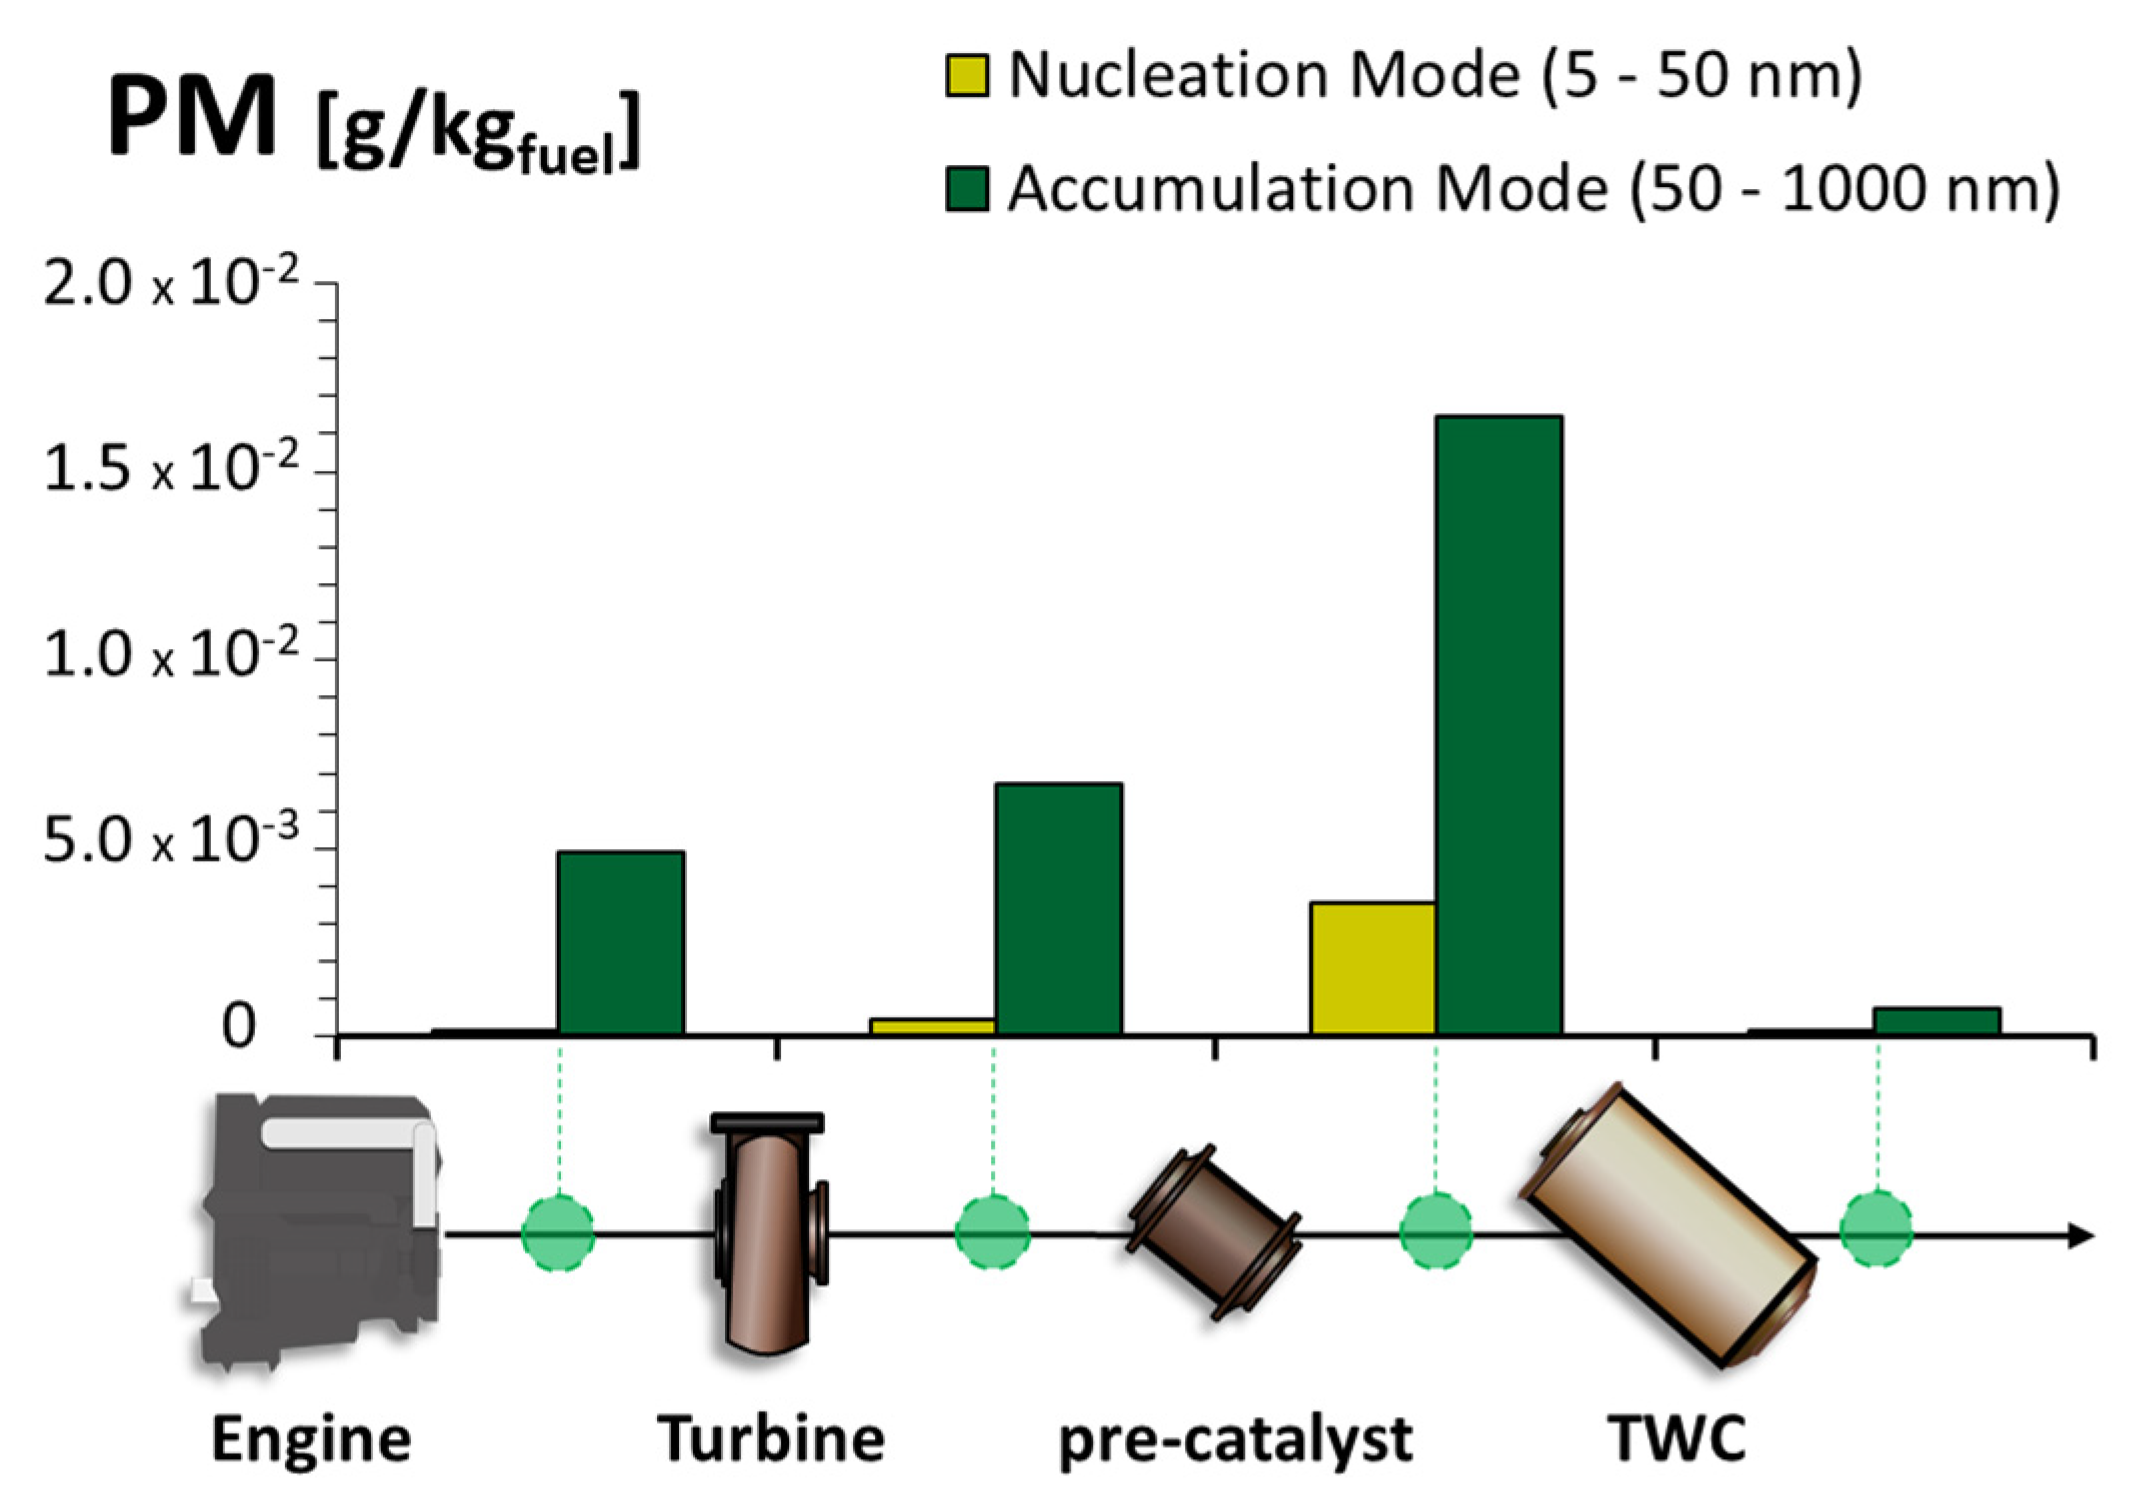
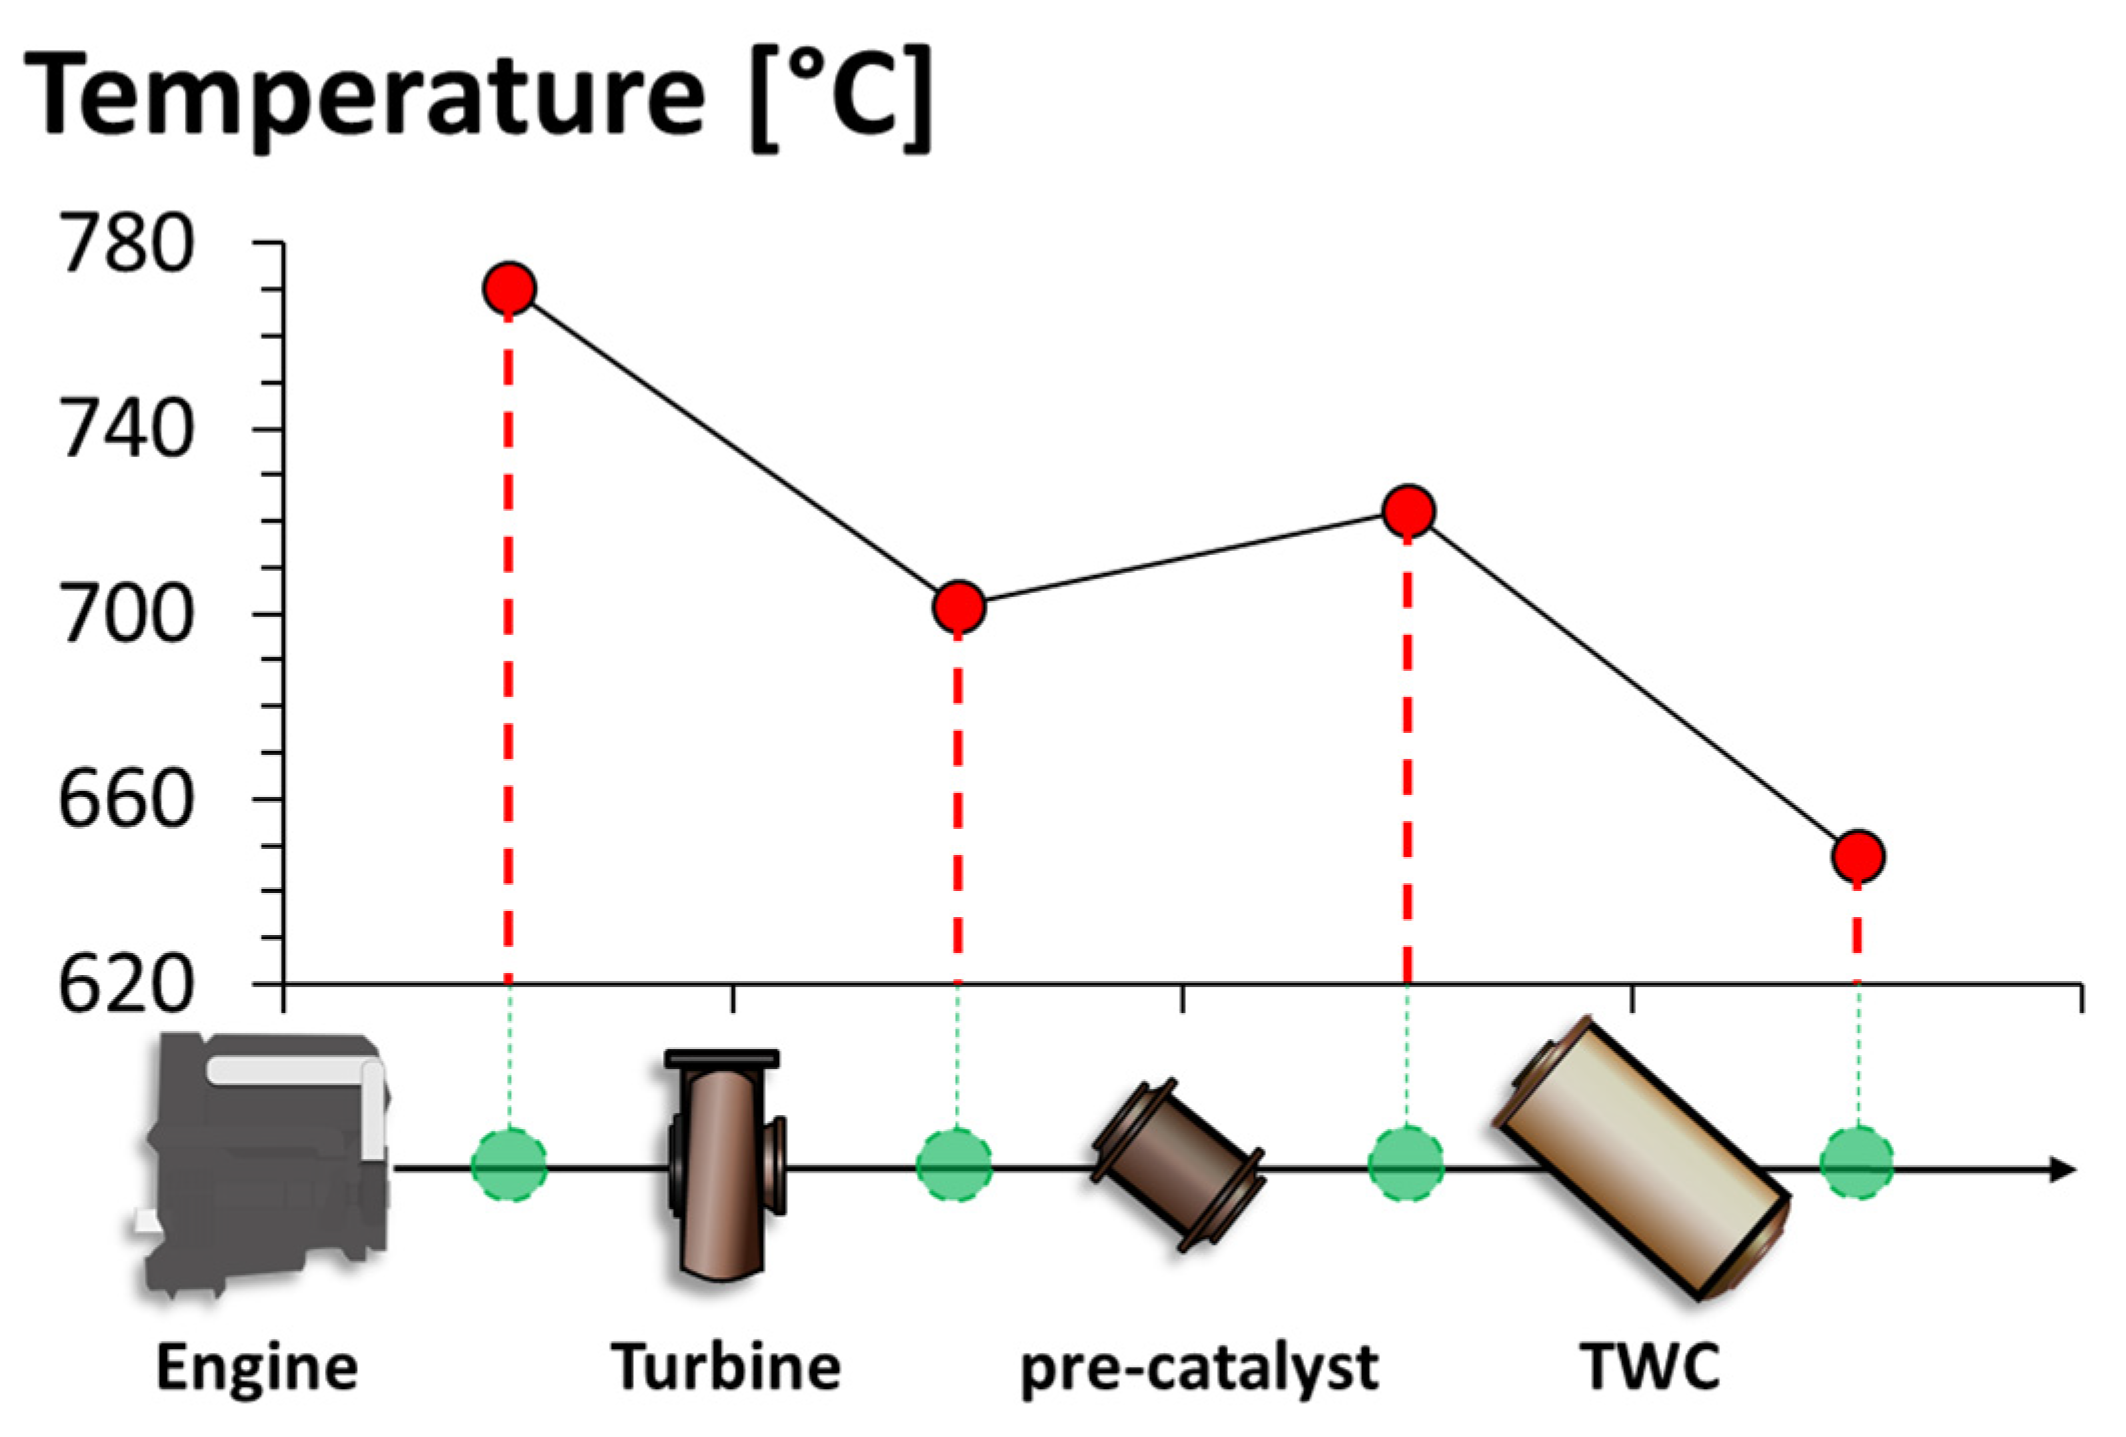
3. Results
4. Conclusions
Author Contributions
Funding
Conflicts of Interest
References
- Reitz, R.D.; Ogawa, H.; Payri, R.; Fansler, T.; Kokjohn, S.; Moriyoshi, Y.; Agarwal, A.K.; Arcoumanis, D.; Assanis, D.; Bae, C.; et al. IJER editorial: The future of the internal combustion engine. Int. J. Engine Res. 2020. [Google Scholar] [CrossRef]
- Kalghatgi, G. Is it really the end of internal combustion engines and petroleum in transport? Appl. Energy 2018, 225, 965–974. [Google Scholar] [CrossRef]
- Leach, F.; Kalghatgi, G.; Stone, R.; Miles, P. The scope for improving the efficiency and environmental impact of internal combustion engines. Transp. Eng. 2020, 1, 100005. [Google Scholar] [CrossRef]
- Wanitschke, A.; Hoffmann, S. Are battery electric vehicles the future? An uncertainty comparison with hydrogen and combustion engines. Environ. Innov. Soc. Transit. 2019. [Google Scholar] [CrossRef]
- Kawamoto, R.; Mochizuki, H.; Moriguchi, Y.; Nakano, T.; Motohashi, M.; Sakai, Y.; Inaba, A. Estimation of CO2 Emissions of internal combustion engine vehicle and battery electric vehicle using LCA. Sustainability 2019, 11, 2690. [Google Scholar] [CrossRef]
- Qiao, Q.; Zhao, F.; Liu, Z.; Jiang, S.; Hao, H. Cradle-to-gate greenhouse gas emissions of battery electric and internal combustion engine vehicles in China. Appl. Energy 2017, 204, 1399–1411. [Google Scholar] [CrossRef]
- Requia, W.J.; Mohamed, M.; Higgins, C.D.; Arain, A.; Ferguson, M. How clean are electric vehicles? Evidence-based review of the effects of electric mobility on air pollutants, greenhouse gas emissions and human health. Atmos. Environ. 2018, 185, 64–77. [Google Scholar] [CrossRef]
- Senecal, P.K.; Leach, F. Diversity in transportation: Why a mix of propulsion technologies is the way forward for the future fleet. Results Eng. 2019, 4, 100060. [Google Scholar] [CrossRef]
- Cotera, P.; Arias, M. The Pathway to Sustainable Transport. In Sustainable Mobility; IntechOpen: London, UK, 2020. [Google Scholar]
- Sripad, S.; Viswanathan, V. Performance metrics required of next-generation batteries to make a practical electric semi truck. ACS Energy Lett. 2017, 2, 1669–1673. [Google Scholar] [CrossRef]
- Reitz, R.D. Directions in internal combustion engine research. Combust. Flame 2013, 160, 1–8. [Google Scholar] [CrossRef]
- Distaso, E.; Amirante, R.; Calò, G.; De Palma, P.; Tamburrano, P.; Reitz, R.D. Predicting Lubricant Oil Induced Pre-Ignition Phenomena in Modern Gasoline Engines: The Reduced GasLube Reaction Mechanism. Fuel 2020, 281, 118709. [Google Scholar] [CrossRef]
- Johnson, T.; Joshi, A. Review of vehicle engine efficiency and emissions. SAE Int. J. Engines 2018, 11, 1307–1330. [Google Scholar] [CrossRef]
- Distaso, E.; Amirante, R.; Tamburrano, P.; Reitz, R.D. Understanding the role of soot oxidation in gasoline combustion: A numerical study on the effects of oxygen enrichment on particulate mass and number emissions in a spark-ignition engine. Energy Convers. Manag. 2019, 184, 24–39. [Google Scholar] [CrossRef]
- Teodosio, L.; Bozza, F.; Tufano, D.; Giannattasio, P.; Distaso, E.; Amirante, R. Impact of the laminar flame speed correlation on the results of a quasi-dimensional combustion model for Spark-Ignition engine. Energy Procedia 2018, 148, 631–638. [Google Scholar] [CrossRef]
- Kalghatgi, G.; Johansson, B. Gasoline compression ignition approach to efficient, clean and affordable future engines. Proc. Inst. Mech. Eng. Part D J. Automob. Eng. 2018, 232, 118–138. [Google Scholar] [CrossRef]
- Duronio, F.; De Vita, A.; Montanaro, A.; Villante, C. Gasoline direct injection engines—A review of latest technologies and trends. Part 2. Fuel 2020, 265, 116947. [Google Scholar] [CrossRef]
- Distaso, E.; Amirante, R.; Cassone, E.; Catapano, F.; De Palma, P.; Sementa, P.; Tamburrano, P. Experimental and Numerical Analysis of a Pre-Chamber Turbulent Jet Ignition Combustion System; SAE Tech. Pap. 2019-24-0018; SAE International: Warrendale, PA, USA, 2019. [Google Scholar] [CrossRef]
- Bhurat, S.S.; Pandey, S.; Chintala, V.; Ranjit, P.S. Technical barriers and their solutions for deployment of HCCI engine technologies—A review. Int. J. Ambient Energy 2019, 1–14. [Google Scholar] [CrossRef]
- Robertson, D.; Prucka, R. A Review of Spark-Assisted Compression Ignition (SACI) Research in the Context of Realizing Production Control Strategies; SAE Technical Paper 2019-24-0027; SAE International: Warrendale, PA, USA, 2019. [Google Scholar]
- Paykani, A.; Kakaee, A.-H.; Rahnama, P.; Reitz, R.D. Progress and recent trends in reactivity-controlled compression ignition engines. Int. J. Engine Res. 2016, 17, 481–524. [Google Scholar] [CrossRef]
- Di Mauro, A.; Chen, H.; Sick, V. Neural network prediction of cycle-to-cycle power variability in a spark-ignited internal combustion engine. Proc. Combust. Inst. 2019, 37, 4937–4944. [Google Scholar] [CrossRef]
- Amirante, R.; Coratella, C.; Distaso, E.; Rossini, G.; Tamburrano, P. Optical device for measuring the injectors opening in common rail systems. Int. J. Automot. Technol. 2017, 18, 729–742. [Google Scholar] [CrossRef]
- Ravaglioli, V.; Ponti, F.; De Cesare, M.; Stola, F.; Carra, F.; Corti, E. Combustion Indexes for Innovative Combustion Control. SAE Int. J. Engines 2017, 10, 2371–2381. [Google Scholar] [CrossRef]
- Amirante, R.; Casavola, C.; Distaso, E.; Tamburrano, P. Towards the Development of the In-Cylinder Pressure Measurement Based on the Strain Gauge Technique for Internal Combustion Engines; SAE Technical Papers 2015-24-2419; SAE International: Warrendale, PA, USA, 2015. [Google Scholar] [CrossRef]
- Kuronita, T.; Sakai, T.; Queck, D.; Puts, R.; Visser, S.; Herrmann, O.; Nishijima, Y. A Study of Dynamic Combustion Control for High Efficiency Diesel Engine; SAE Technical Papers 2020-01-0297; SAE International: Warrendale, PA, USA, 2020. [Google Scholar]
- Bae, C.; Kim, J. Alternative fuels for internal combustion engines. Proc. Combust. Inst. 2017, 36, 3389–3413. [Google Scholar] [CrossRef]
- Cho, H.M.; He, B.Q. Spark ignition natural gas engines—A review. Energy Convers. Manag. 2007, 48, 608–618. [Google Scholar] [CrossRef]
- Amirante, R.; Distaso, E.; Di Iorio, S.; Pettinicchio, D.; Sementa, P.; Tamburrano, P.; Vaglieco, B.M. Experimental Investigations on the Sources of Particulate Emission within a Natural Gas Spark-Ignition Engine; SAE Technical Papers 2017-24-0141; SAE International: Warrendale, PA, USA, 2017. [Google Scholar] [CrossRef]
- Distaso, E.; Amirante, R.; Cassone, E.; De Palma, P.; Sementa, P.; Tamburrano, P.; Veglieco, B.M. Analysis of the Combustion Process in a Lean-Burning Turbulent Jet Ignition Engine Fueled with Methane. Energy Convers. Manag. 2020, in press. [Google Scholar]
- Amirante, R.; Distaso, E.; Di Iorio, S.; Sementa, P.; Tamburrano, P.; Vaglieco, B.M.; Reitz, R.D. Effects of natural gas composition on performance and regulated, greenhouse gas and particulate emissions in spark-ignition engines. Energy Convers. Manag. 2017, 143, 338–347. [Google Scholar] [CrossRef]
- Karavalakis, G.; Hajbabaei, M.; Jiang, Y.; Yang, J.; Johnson, K.C.; Cocker, D.R.; Durbin, T.D. Regulated, greenhouse gas, and particulate emissions from lean-burn and stoichiometric natural gas heavy-duty vehicles on different fuel compositions. Fuel 2016, 175, 146–156. [Google Scholar] [CrossRef]
- Amirante, R.; Distaso, E.; Tamburrano, P.; Reitz, R.D. Analytical Correlations for Modeling the Laminar Flame Speed of Natural Gas Surrogate Mixtures. Energy Proc. 2017, 126, 850–857. [Google Scholar] [CrossRef]
- McTaggart-Cowan, G.P.; Rogak, S.N.; Munshi, S.R.; Hill, P.G.; Bushe, W.K. The influence of fuel composition on a heavy-duty, natural-gas direct-injection engine. Fuel 2010, 89, 752–759. [Google Scholar] [CrossRef]
- Amirante, R.; Distaso, E.; Tamburrano, P.; Reitz, R.D. Laminar Flame Speed Correlations for Methane, Ethane, Propane and their Mixtures, and Natural Gas and Gasoline for Spark-Ignition Engine Simulations. Int. J. Engine Res. 2017, 18, 951–970. [Google Scholar] [CrossRef]
- Nylund, N.-O.; Erkkilä, K.; Lappi, M.; Ikonen, M. Transit bus emission study: Comparison of emissions from diesel and natural gas buses. In Proceedings of the IANGVA Conf, Buenos Aires, Argentina, 6–17 December 2004. [Google Scholar]
- Jayaratne, E.R.; Meyer, N.K.; Ristovski, Z.D.; Morawska, L.; Miljevic, B. Critical analysis of high particle number emissions from accelerating compressed natural gas buses. Environ. Sci. Technol. 2010, 44, 3724–3731. [Google Scholar] [CrossRef]
- Amirante, R.; Distaso, E.; Napolitano, M.; Tamburrano, P.; Iorio, S.D.; Sementa, P.; Vaglieco, B.M.; Reitz, R.D. Effects of lubricant oil on particulate emissions from port-fuel and direct-injection spark-ignition engines. Int. J. Engine Res. 2017, 18, 606–620. [Google Scholar] [CrossRef]
- Jayaratne, E.R.; Meyer, N.K.; Ristovski, Z.D.; Morawska, L. Volatile properties of particles emitted by compressed natural gas and diesel buses during steady-state and transient driving modes. Environ. Sci. Technol. 2012, 46, 196–203. [Google Scholar] [CrossRef] [PubMed]
- Alanen, J.; Saukko, E.; Lehtoranta, K.; Murtonen, T.; Timonen, H.; Hillamo, R.; Karjalainen, P.; Kuuluvainen, H.; Harra, J.; Keskinen, J.; et al. The formation and physical properties of the particle emissions from a natural gas engine. Fuel 2015, 162, 155–161. [Google Scholar] [CrossRef]
- Hajbabaei, M.; Karavalakis, G.; Johnson, K.C.; Lee, L.; Durbin, T.D. Impact of natural gas fuel composition on criteria, toxic, and particle emissions from transit buses equipped with lean burn and stoichiometric engines. Energy 2013, 62, 425–434. [Google Scholar] [CrossRef]
- Bhardawaj, A.; Habib, G.; Kumar, A.; Singh, S.; Nema, A.K. A review of ultrafine particle-related pollution during vehicular motion, health effects and control. J. Environ. Sci. Public Health 2017, 1, 268–288. [Google Scholar] [CrossRef]
- Eisazadeh, H.; Ehteram, M.A.; Khazaee, I. Diffusion charging measurements on exhaust solid particle number and lung deposited surface area of compressed natural gas and diesel buses. Environ. Sci. Pollut. Res. 2020, 27, 16929–16939. [Google Scholar] [CrossRef]
- Distaso, E.; Amirante, R.; Tamburrano, P.; Reitz, R.D. Steady-state Characterization of Particle Number Emissions from a Heavy-Duty Euro VI Engine Fueled with Compressed Natural Gas. Energy Proc. 2018, 148, 671–678. [Google Scholar] [CrossRef]
- Rönkkö, T.; Virtanen, A.; Vaaraslahti, K.; Keskinen, J.; Pirjola, L.; Lappi, M. Effect of dilution conditions and driving parameters on nucleation mode particles in diesel exhaust: Laboratory and on-road study. Atmos. Environ. 2006, 40, 2893–2901. [Google Scholar] [CrossRef]
- Lim, M.C.H.; Ayoko, G.A.; Morawska, L.; Ristovski, Z.D.; Jayaratne, E.R. Effect of fuel composition and engine operating conditions on polycyclic aromatic hydrocarbon emissions from a fleet of heavy-duty diesel buses. Atmos. Environ. 2005, 39, 7836–7848. [Google Scholar] [CrossRef]
- Qin, J.; Li, X.; Pei, Y. Effects of Combustion Parameters and Lubricating Oil on Particulate Matter Emissions from a Turbo-Charged GDI Engine Fueled with Methanol/Gasoline Blends; SAE Technical Papers; SAE International: Warrendale, PA, USA, 2014. [Google Scholar] [CrossRef]
- Singh, A.P.; Pal, A.; Agarwal, A.K. Comparative particulate characteristics of hydrogen, CNG, HCNG, gasoline and diesel fueled engines. Fuel 2016, 185, 491–499. [Google Scholar] [CrossRef]
- Adlercreutz, L.; Cronhjort, A.; Stenlaas, O. Particle Emission Measurements in a SI CNG Engine Using Oils with Controlled Ash Content. In Proceedings of the JSAE/SAE Powertrains, Fuels and Lubricants International Meeting, Kyoto, Japan, 26–29 August 2019. [Google Scholar]
- Miller, A.L.; Stipe, C.B.; Habjan, M.C.; Ahlstrand, G.G. Role of lubrication oil in particulate emissions from a hydrogen-powered internal combustion engine. Environ. Sci. Technol. 2007, 41, 6828–6835. [Google Scholar] [CrossRef] [PubMed]
- Tonegawa, Y.; Oguchi, M.; Tsuchiya, K.; Sasaki, S.; Ohashi, T.; Goto, Y. Evaluation of Regulated Materials and Ultra Fine Particle Emission from Trial Production of Heavy-Duty CNG Engine; SAE Technical Papers; SAE International: Warrendale, PA, USA, 2006. [Google Scholar] [CrossRef]
- Amirante, R.; Distaso, E.; Tamburrano, P.; Reitz, R.D. Measured and Predicted Soot Particle Emissions from Natural Gas Engines; SAE Technical Papers 2015-24-2518; SAE International: Warrendale, PA, USA, 2015. [Google Scholar] [CrossRef]
- Napolitano, P.; Alfè, M.; Guido, C.; Gargiulo, V.; Fraioli, V.; Beatrice, C. Particle emissions from a HD SI gas engine fueled with LPG and CNG. Fuel 2020, 269, 117439. [Google Scholar] [CrossRef]
- Thiruvengadam, A.; Besch, M.C.; Yoon, S.; Collins, J.; Kappanna, H.; Carder, D.K.; Ayala, A.; Herner, J.; Gautam, M. Characterization of particulate matter emissions from a current technology natural gas engine. Environ. Sci. Technol. 2014, 48, 8235–8242. [Google Scholar] [CrossRef] [PubMed]
- El-Sherif, A.S. Effects of natural gas composition on the nitrogen oxide, flame structure and burning velocity under laminar premixed flame conditions. Fuel 1998, 77, 1539–1547. [Google Scholar] [CrossRef]
- Distaso, E.; Amirante, R.; Calò, G.; De Palma, P.; Tamburrano, P.; Reitz, R.D. Investigation of Lubricant Oil influence on Ignition of Gasoline-like Fuels by a Detailed Reaction Mechanism. Energy Proc. 2018, 148, 663–670. [Google Scholar] [CrossRef]
- Liu, H.; Li, Z.; Xu, H.; Ma, X.; Shuai, S. Nucleation mode particle evolution in a gasoline direct injection engine with/without a three-way catalyst converter. Appl. Energy 2020, 259, 114211. [Google Scholar] [CrossRef]
- Lähde, T.; Rönkkö, T.; Virtanen, A.; Schuck, T.J.; Pirjola, L.; Hämeri, K.; Kulmala, M.; Arnold, F.; Rothe, D.; Keskinen, J. Heavy duty diesel engine exhaust aerosol particle and ion measurements. Environ. Sci. Technol. 2009, 43, 163–168. [Google Scholar] [CrossRef]
- Whelan, I.; Samuel, S.; Hassaneen, A. Investigation into the role of catalytic converters on tailpipe-out nano-scale particulate matter from gasoline direct injection engine. In Proceedings of the International Powertrains, Fuels & Lubricants Meeting, San Diego, CA, USA, 25–27 October 2010. [Google Scholar]
- Whelan, I.; Timoney, D.; Smith, W.; Samuel, S. The effect of a three-way catalytic converter on particulate matter from a gasoline direct-injection engine during cold-start. SAE Int. J. Engines 2013, 6, 1035–1045. [Google Scholar] [CrossRef]
- Maricq, M.M.; Chase, R.E.; Xu, N.; Laing, P.M. The effects of the catalytic converter and fuel sulfur level on motor vehicle particulate matter emissions: Light duty diesel vehicles. Environ. Sci. Technol. 2002, 36, 283–289. [Google Scholar] [CrossRef]
- Getsoian, A.B.; Theis, J.R.; Lambert, C.K. Sensitivity of Three-Way Catalyst Light-Off Temperature to Air-Fuel Ratio. Emiss. Control Sci. Technol. 2018, 4, 136–142. [Google Scholar] [CrossRef]
- Nakanishi, Y.; Suehiro, Y.; Hashimoto, M.; Narishige, T.; Takeuchi, R.; Shimamoto, Y.; Sano, S.; Iwakura, H. Development of Low Temperature Active Three Way Catalyst. In Proceedings of the WCX SAE World Congress Experience, Detroit, MI, USA, 9–11 April 2019. [Google Scholar]
- Graskow, B.R.; Kittelson, D.B.; Abdul-Khalek, I.S.; Ahmadi, M.R.; Morris, J.E. Characterization of Exhaust Particulate Emissions from a Spark Ignition Engine; 980528 SAE Technical Papers; SAE International: Warrendale, PA, USA, 1998. [Google Scholar]
- Maricq, M.M.; Xu, N. The effective density and fractal dimension of soot particles from premixed flames and motor vehicle exhaust. J. Aerosol Sci. 2004, 35, 1251–1274. [Google Scholar] [CrossRef]
- Park, K.; Cao, F.; Kittelson, D.B.; McMurry, P.H. Relationship between particle mass and mobility for diesel exhaust particles. Environ. Sci. Technol. 2003, 37, 577–583. [Google Scholar] [CrossRef] [PubMed]
- Maricq, M.M.; Xu, N.; Chase, R.E. Measuring particulate mass emissions with the electrical low pressure impactor. Aerosol Sci. Technol. 2006, 40, 68–79. [Google Scholar] [CrossRef]
- Braun, A.; Huggins, F.E.; Seifert, S.; Ilavsky, J.; Shah, N.; Kelly, K.E.; Sarofim, A.; Huffman, G.P. Size-range analysis of diesel soot with ultra-small angle X-ray scattering. Combust. Flame 2004, 137, 63–72. [Google Scholar] [CrossRef]
- Di Stasio, S. Observation of restructuring of nanoparticle soot aggregates in a diffusion flame by static light scattering. J. Aerosol Sci. 2001, 32, 509–524. [Google Scholar] [CrossRef]
- Kittelson, D.B.; Watts, W.F.; Johnson, J.P.; Thorne, C.; Higham, C.; Payne, M.; Goodier, S.; Warrens, C.; Preston, H.; Zink, U.; et al. Effect of fuel and lube oil sulfur on the performance of a diesel exhaust gas continuously regenerating trap. Environ. Sci. Technol. 2008, 42, 9276–9282. [Google Scholar] [CrossRef]
- Roumeliotis, I.; Mathioudakis, K. Analysis of moisture condensation during air expansion in turbines. Int. J. Refrig. 2006, 29, 1092–1099. [Google Scholar] [CrossRef]
- Puzun, A.; Wanchen, S.; Guoliang, L.; Manzhi, T.; Chunjie, L.; Shibao, C. Characteristics of particle size distributions about emissions in a common-rail diesel engine with biodiesel blends. Proc. Environ. Sci. 2011, 11, 1371–1378. [Google Scholar] [CrossRef][Green Version]
- Kim, K.; Si, W.; Jin, D.; Kim, J.-H.; Cho, J.; Baek, S.; Myung, C.-L.; Park, S. Characterization of engine oil additive packages on diesel particulate emissions. J. Mech. Sci. Technol. 2020, 34, 931–939. [Google Scholar] [CrossRef]
- Osada, H.; Aoyagi, Y.; Shimada, K.; Akiyama, K.; Goto, Y.; Suzuki, H. SOF component of lubricant oil on diesel PM in a high boosted and cooled EGR engine. In Proceedings of the SAE World Congress & Exhibition, Detroit, MI, USA, 16–19 April 2007. [Google Scholar]
- De Petris, C.; Giglio, V.; Police, G. Some Insights on Mechanisms of Oil Consumption; SAE Technical Papers; SAE International: Warrendale, PA, USA, 1996. [Google Scholar] [CrossRef]
- Eastwood, P. Particulate Emissions from Vehicles; John Wiley & Sons: Hoboken, NJ, USA, 2008; Volume 20. [Google Scholar]
- Yoon, S.; Hu, S.; Kado, N.Y.; Thiruvengadam, A.; Collins, J.F.; Gautam, M.; Herner, J.D.; Ayala, A. Chemical and toxicological properties of emissions from CNG transit buses equipped with three-way catalysts compared to lean-burn engines and oxidation catalyst technologies. Atmos. Environ. 2014, 83, 220–228. [Google Scholar] [CrossRef]
- Vijayakumar, V.; Tyagi, B.; Mathai, R.; Singh, S.; Sehgal, A.K. Effect of Crankcase Oil on the Particle Size Distribution and Total Number Concentration in a Heavy Duty CNG Engine. In Proceedings of the JSAE/SAE 2015 International Powertrains, Fuels & Lubricants Meeting, Kyoto, Japan, 1–4 September 2015. [Google Scholar]
- D’Alessio, A.; Barone, A.C.; Cau, R.; D’Anna, A.; Minutolo, P. Surface deposition and coagulation efficiency of combustion generated nanoparticles in the size range from 1 to 10 nm. Proc. Combust. Inst. 2005, 30, 2595–2603. [Google Scholar] [CrossRef]
- Cortes, C.; Gil, A. Modeling the gas and particle flow inside cyclone separators. Prog. Energy Combust. Sci. 2007, 33, 409–452. [Google Scholar] [CrossRef]
- Cucchi, M.; Samuel, S. Influence of the exhaust gas turbocharger on nano-scale particulate matter emissions from a GDI spark ignition engine. Appl. Therm. Eng. 2015, 76, 167–174. [Google Scholar] [CrossRef][Green Version]
- Marshall, J.S. Particle aggregation and capture by walls in a particulate aerosol channel flow. J. Aerosol Sci. 2007, 38, 333–351. [Google Scholar] [CrossRef]
- Samuel, S.; Hassaneen, A.; Morrey, D. Particulate matter emissions and the role of catalytic converter during cold start of GDI engine. In Proceedings of the SAE 2010 Powertrains Fuels & Lubricants Meeting, San Diego, CA, USA, 25–27 October 2010. [Google Scholar]
- Mizuno, T.; Suzuki, J. Development of a new DPNR catalyst. In Proceedings of the SAE 2004 World Congress & Exhibition, Detroit, MI, USA, 8–11 March 2004. [Google Scholar]


| Displacement | |
| Stroke | |
| Bore | |
| Compression Ratio | |
| Maximum Power | |
| Maximum Torque |
© 2020 by the authors. Licensee MDPI, Basel, Switzerland. This article is an open access article distributed under the terms and conditions of the Creative Commons Attribution (CC BY) license (http://creativecommons.org/licenses/by/4.0/).
Share and Cite
Distaso, E.; Amirante, R.; Calò, G.; De Palma, P.; Tamburrano, P. Evolution of Soot Particle Number, Mass and Size Distribution along the Exhaust Line of a Heavy-Duty Engine Fueled with Compressed Natural Gas. Energies 2020, 13, 3993. https://doi.org/10.3390/en13153993
Distaso E, Amirante R, Calò G, De Palma P, Tamburrano P. Evolution of Soot Particle Number, Mass and Size Distribution along the Exhaust Line of a Heavy-Duty Engine Fueled with Compressed Natural Gas. Energies. 2020; 13(15):3993. https://doi.org/10.3390/en13153993
Chicago/Turabian StyleDistaso, Elia, Riccardo Amirante, Giuseppe Calò, Pietro De Palma, and Paolo Tamburrano. 2020. "Evolution of Soot Particle Number, Mass and Size Distribution along the Exhaust Line of a Heavy-Duty Engine Fueled with Compressed Natural Gas" Energies 13, no. 15: 3993. https://doi.org/10.3390/en13153993
APA StyleDistaso, E., Amirante, R., Calò, G., De Palma, P., & Tamburrano, P. (2020). Evolution of Soot Particle Number, Mass and Size Distribution along the Exhaust Line of a Heavy-Duty Engine Fueled with Compressed Natural Gas. Energies, 13(15), 3993. https://doi.org/10.3390/en13153993