Article

Comparative Study of Tubular Solar Stills with Phase Change Material and Nano-Enhanced Phase Change Material

by
M. Mohamed Thalib
1,
Athikesavan Muthu Manokar
1,*,
Fadl A. Essa
2,
N. Vasimalai
3,
Ravishankar Sathyamurthy
4 and
Fausto Pedro Garcia Marquez
5,*
1
Department of Mechanical Engineering, B.S. Abdur Rahman Crescent Institute of Science and Technology, Chennai 600 048, India
2
Mechanical Engineering Department, Faculty of Engineering, Kafrelsheikh University, Kafrelsheikh 33516, Egypt
3
Department of Chemistry, B.S. Abdur Rahman Crescent Institute of Science and Technology, Chennai 600 048, India
4
Department of Automobile Engineering, Hindustan Institute of Technology and Science, Chennai 603103, Tamil Nadu, India
5
Ingenium Research Group, Universidad Castilla-La Mancha Ciudad Real, 13071 Ciudad Real, Spain
*
Authors to whom correspondence should be addressed.
Energies 2020, 13(15), 3989; https://doi.org/10.3390/en13153989
Submission received: 6 July 2020 / Revised: 28 July 2020 / Accepted: 30 July 2020 / Published: 2 August 2020
(This article belongs to the Special Issue Maintenance Management in Solar Energy Systems)

Abstract

:
This study is intended to investigate and analyze the operational performances of the Conventional Tubular Solar Still (CTSS), Tubular Solar Still with Phase Change Material (TSS-PCM) and Tubular Solar Still with Nano Phase Change Material (TSS-NPCM). Paraffin wax and graphene plusparaffin wax were used in the CTSS to obtain the modified solar still models. The experimental study was carried out in the three stills to observe the operational parameters at a water depth of 1 cm. The experiment revealed that TSS-NPCM showed the best performance and the highest yield in comparison to other stills. The distillate yield from the CTSS, TSS-PCM and TSS-NPCM was noted to be 4.3, 6.0 and 7.9 kg, respectively, the daily energy efficiency of the stills was observed to be 31%, 46% and 59%, respectively, and the daily exergy efficiency of the stills was recorded to be 1.67%, 2.20% and 3.75%, respectively. As the performance of the TSS-NPCM was enhanced, the cost of freshwater yield obtained was also low in contrast to the other two types of stills.

1. Introduction

The world is breaking barriers to achieve advancements and developments in all fields. However, in this race of so-called development, nature seems to be affected. The lack of freshwater is a visible issue. Though developed nations have found a way to tackle this adverse effect, underdeveloped and developing countries are still fighting for survival. Scientists have been developing various ideas and models to solve the issue of lack of freshwater and electricity [1,2,3,4]. The tubular design of the solar still has its own advantages, and other models have proved to be effective [5,6,7]. Several modifications have been added to the Tubular Solar Still (TSS) to make it even more productive [8,9,10]. The tubular model is one of the effective ways to get potable water [11,12,13]. Arunkumar et al. [14] analyzed the productivity of the TSS with a parabolic concentrator (PC) and the concentric TSS with a PC. Several factors, e.g., temperatures of water, air and yield, were noted. The potable water yield from the conventional PC-TSS (CPC-TSS) was seen to be 3710 mL/day, while in Concentric Parabolic Concentrator (CPC)-Conventional-TSS (CPC-CTSS), it was 4960 mL/day.
Chang et al. [15] investigated a new model vertical tubular solar device to desalinate brackish water using a multi-effect. It was reported that it achieved a distillate yield of 1.162 kg/h when there was a 400 W heat input. Elashmawy [16] examined the performance of a TSS along with a PC solar tracking system. This model enhanced the yield by 676% and minimized the yield cost by 45.5%. Elshamy and El-Said [17] researched the TSS with a semi-circular corrugated absorber for improving its efficiency. The corrugated absorber plate increased the desalination rate by 26.27%. The energy and exergy efficiencies also rose by 25.9% and 23.7% in each instance in comparison to the efficiency of the still with a flat plate. Hou et al. [18] introduced a new multi-effect vertical TSS model and analyzed the productivity increase by using the effect of carrier gas-water vapor mixture. Compared to air as a carrier gas, helium gas produced the highest yield of 1.19 kg/h and showed a 30.76% enhancement in yield.
Hou et al. [19] studied a novel vertical TSS to determine the mass transfer co-efficient and methods to enhance it. The highest yield was recorded to be 653.89 g/h. Rahbar et al. [20] did a relative study between tubular and triangular stills to evaluate their performance. In general, the tubular still showed better yield productivity than the triangular solar still. Xie et al. [21] experimented with a TSS which functioned in a vacuum condition. The highest efficiency of the still was noted to be above 0.9%. Al-Hamadani and Shukla [22] analyzed the productivity and performance of a solar still by using lauric acid and myristic acid separately as Phase Change Material (PCM). It was reported that the usage of lauric acid showed greater productivity and energy efficiencies in comparison to myristic acid. Ansari et al. [23] analyzed the output and efficiency of a solar still in passive mode along with a system to store heat energy. Asbik et al. [24] reported the exergy of a solar still which made use of paraffin as PCM to store and retrieve energy. El-Sebaii et al. [25] studied the performance of a solar still with a single basin using stearic acid as PCM. The freshwater yield was noted to be 9.005 kg/m2day, while the efficiency was recorded to be 85.3%. Kabeel and Abdelgaied [26] researched the performance and productivity of a solar still with PCM. The percentage rise in the productivity of the still model was noted to be 67.18% greater than that of the conventional still, while the freshwater yield noted to be 7.54 L/m2day. Kabeel et al. [27] analyzed the performance of a modified still coupled with a collector and PCM. The distilled water yield was recorded to be 9.36 L/m2day, which was calculated to be 109% enhanced when compared to that of the conventional still. Mousa and Gujarathi [28] studied the freshwater productivity of stills using PCM and reported a yield of 2.1 L/day. Shalaby et al. [29] introduced a novel v-corrugated absorber solar still with PCM, and a considerable rise in yield was reported. Rufuss et al. [30] analyzed the performance of a solar still with Nano Phase Change Material (NPCM) (TiO2, CuO and GO). When GO nanoparticles were used, the yield was noted to be 5.28 L/m2/day, which was the highest when compared to the other nanoparticles. Arunkumar et al. [31] experimented on the impact of air and water cooling systems on the productivity of the TSS. The air-cooled system produced a yield of 2050 mL/day, while the water-cooled system yielded 5000 mL/day. Chen et al. [32] investigated the efficiency and productivity of a three-effect TSS. At the optimal heating power of 300 W, the performance ratio reaches the value of 1.3, which is the highest. The recent literature on passive [33,34,35] and active [36,37,38] solar stills was studied. From the referred works, it is noted that only a few research studies were done using TSS with PCM. Several researchers have also made minor modifications to the conventional model of TSS to enhance productivity. Different types of PCM have been used in the past, but the yield production obtained was not commercially viable. The use of graphene NPCM has helped in enhancing freshwater yield by a comparatively better amount. The productivity, thermal and exergy efficiency were also better for the TSS-NPCM in comparison to conventional models. The model with NPCM showed 81%, 87.02% and 124.55% increase in freshwater production, thermal and exergy efficiency when compared to the efficiencies of the conventional models because of the high thermal efficiency and heat absorption capacity of graphene. The maximum yield obtained from the TSS-NPCM in the current study was noted to be 7.91 kg, which is higher than the conventional stills, and the stills using normal PCM. Hence, this work is mainly based on the comparative study of the operational performances between the TSS with paraffin wax (PCM) and TSS with graphene and paraffin wax (NPCM).

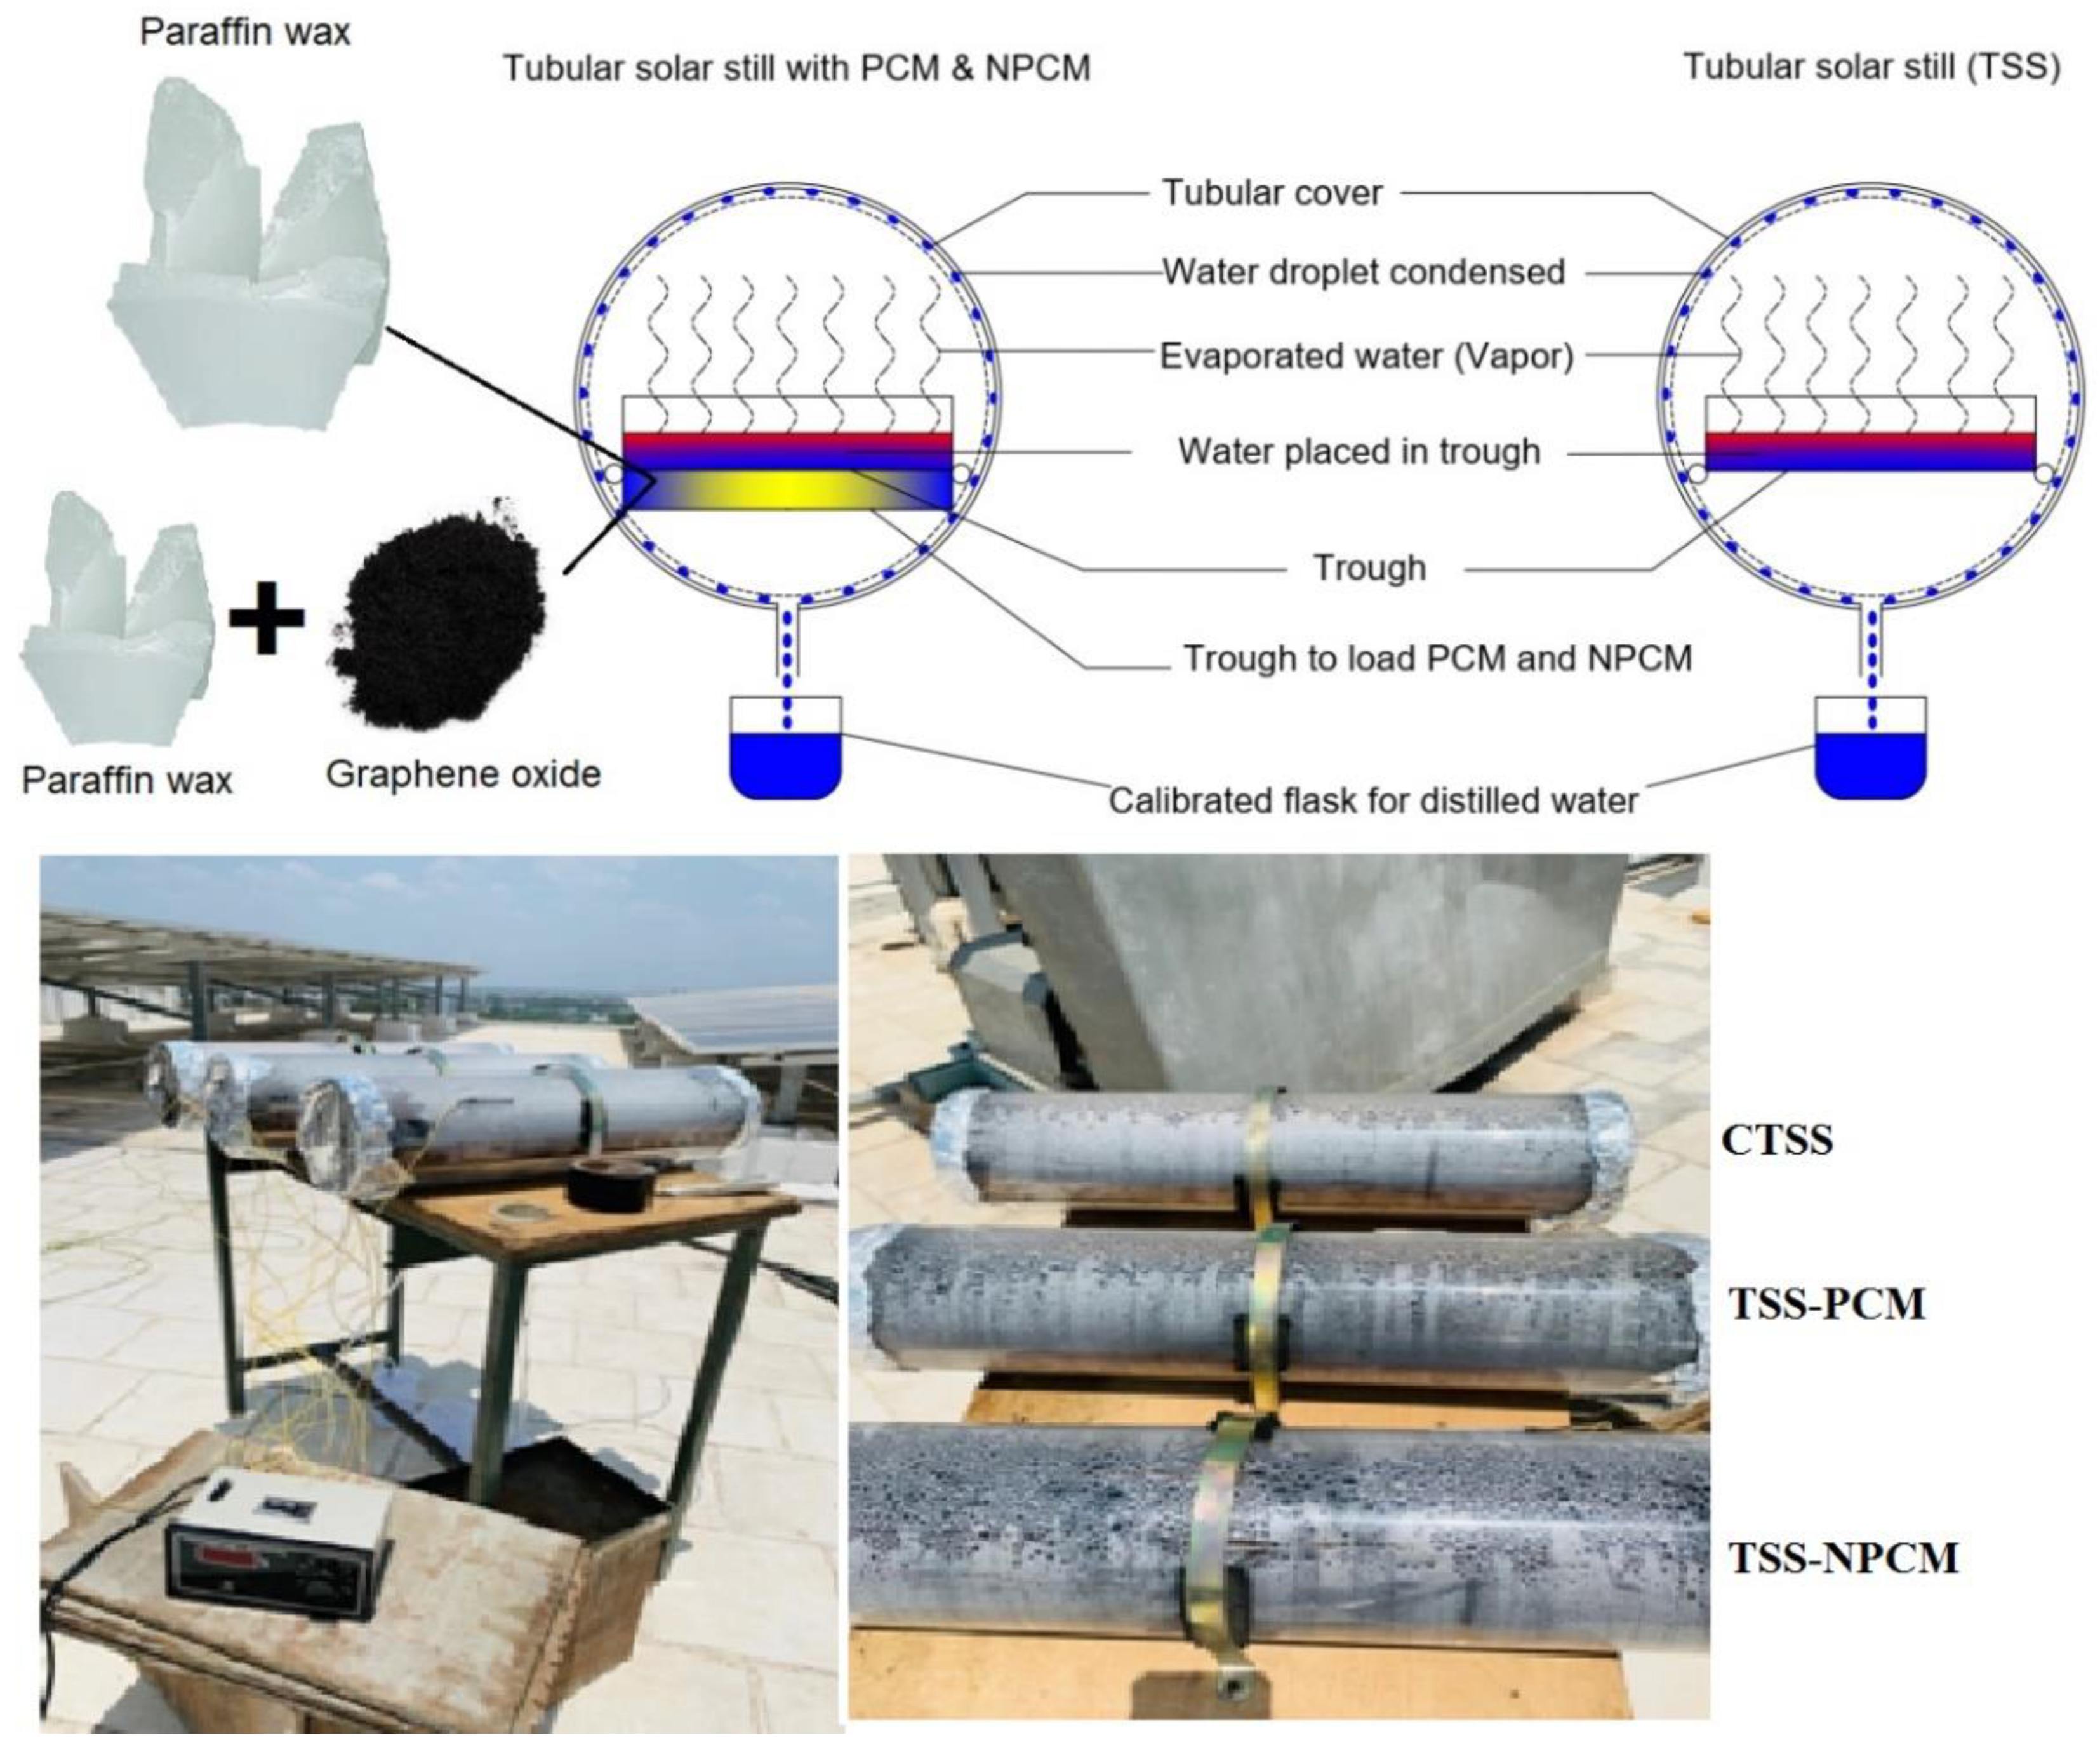
2. Design and Construction of the Tubular Solar Stills

The schematic and photo of the CTSS, TSS-PCM and TSS-NPCM are depicted in Figure 1. A CTSS consists of a polymethylmethacrylate tube of dimensions 68 cm length and 18.5 cm outer diameter and a basin in which the water is poured, and the desalination process is done. The measurements of the basin, which is made from a 0.1 cm thick sheet metal, are 66 cm (Length) × 13 cm (Width) × 3 cm (Height). In the TSS-PCM and TSS-NPCM models, there is a storage area in the sheet metal basin inside which the PCM (paraffin wax) and NPCM (graphene and paraffin wax) are kept. Above this enclosed layer, the water is poured. This combination of the TSS model along with NPCM (graphene) showed better productivity and efficiency compared to the CTSS. The setups for all three models are assembled in a stand, and thermocouple electrodes fitted to its elements and placed under sunlight on an elevated area. The brackish water is poured in the basin for depths of 1 cm to observe the operational parameters. Then the water evaporates and condenses on the inner face of the acrylic tube, which is collected and stored in beakers using outlet tubes. J-type thermocouple with a range of 0 to 400 °C is used to measure the temperatures [39]. Industrial grade yellow paraffin wax with a melting point of 55 °C is used as the PCM. Initially, for graphene preparation, 20 g of graphite and 20 g of sodium chloride (NaCl) were mixed and pulverized, after which the filtration process was carried out using de-ionized water. The wet graphene was dried and then mixed with molten paraffin wax (PCM) to form the NPCM (Figure 2). Graphene conducts heat and electricity efficiently. Using these high thermal conductivity nanoparticles can enhance productivity. The thermal conductivity of graphene at room temperature is about 2000–4000 W⋅m−1K−1. This number is still among the highest of any known material. In both computer simulations and experiments, the researchers found that the larger the segments of graphene, the more heat it could transfer. Theoretically, graphene could absorb an unlimited amount of heat. The melting point, density, thermal conductivity and specific heat capacity of the graphene are 55 °C, 800 kg/m3, 2000 W⋅m−1·K−1 and 2850 J/kg·K, respectively [30]. The uncertainty associated with the instruments and the ranges is provided in Table 1.

3. Outcomes and Analyses

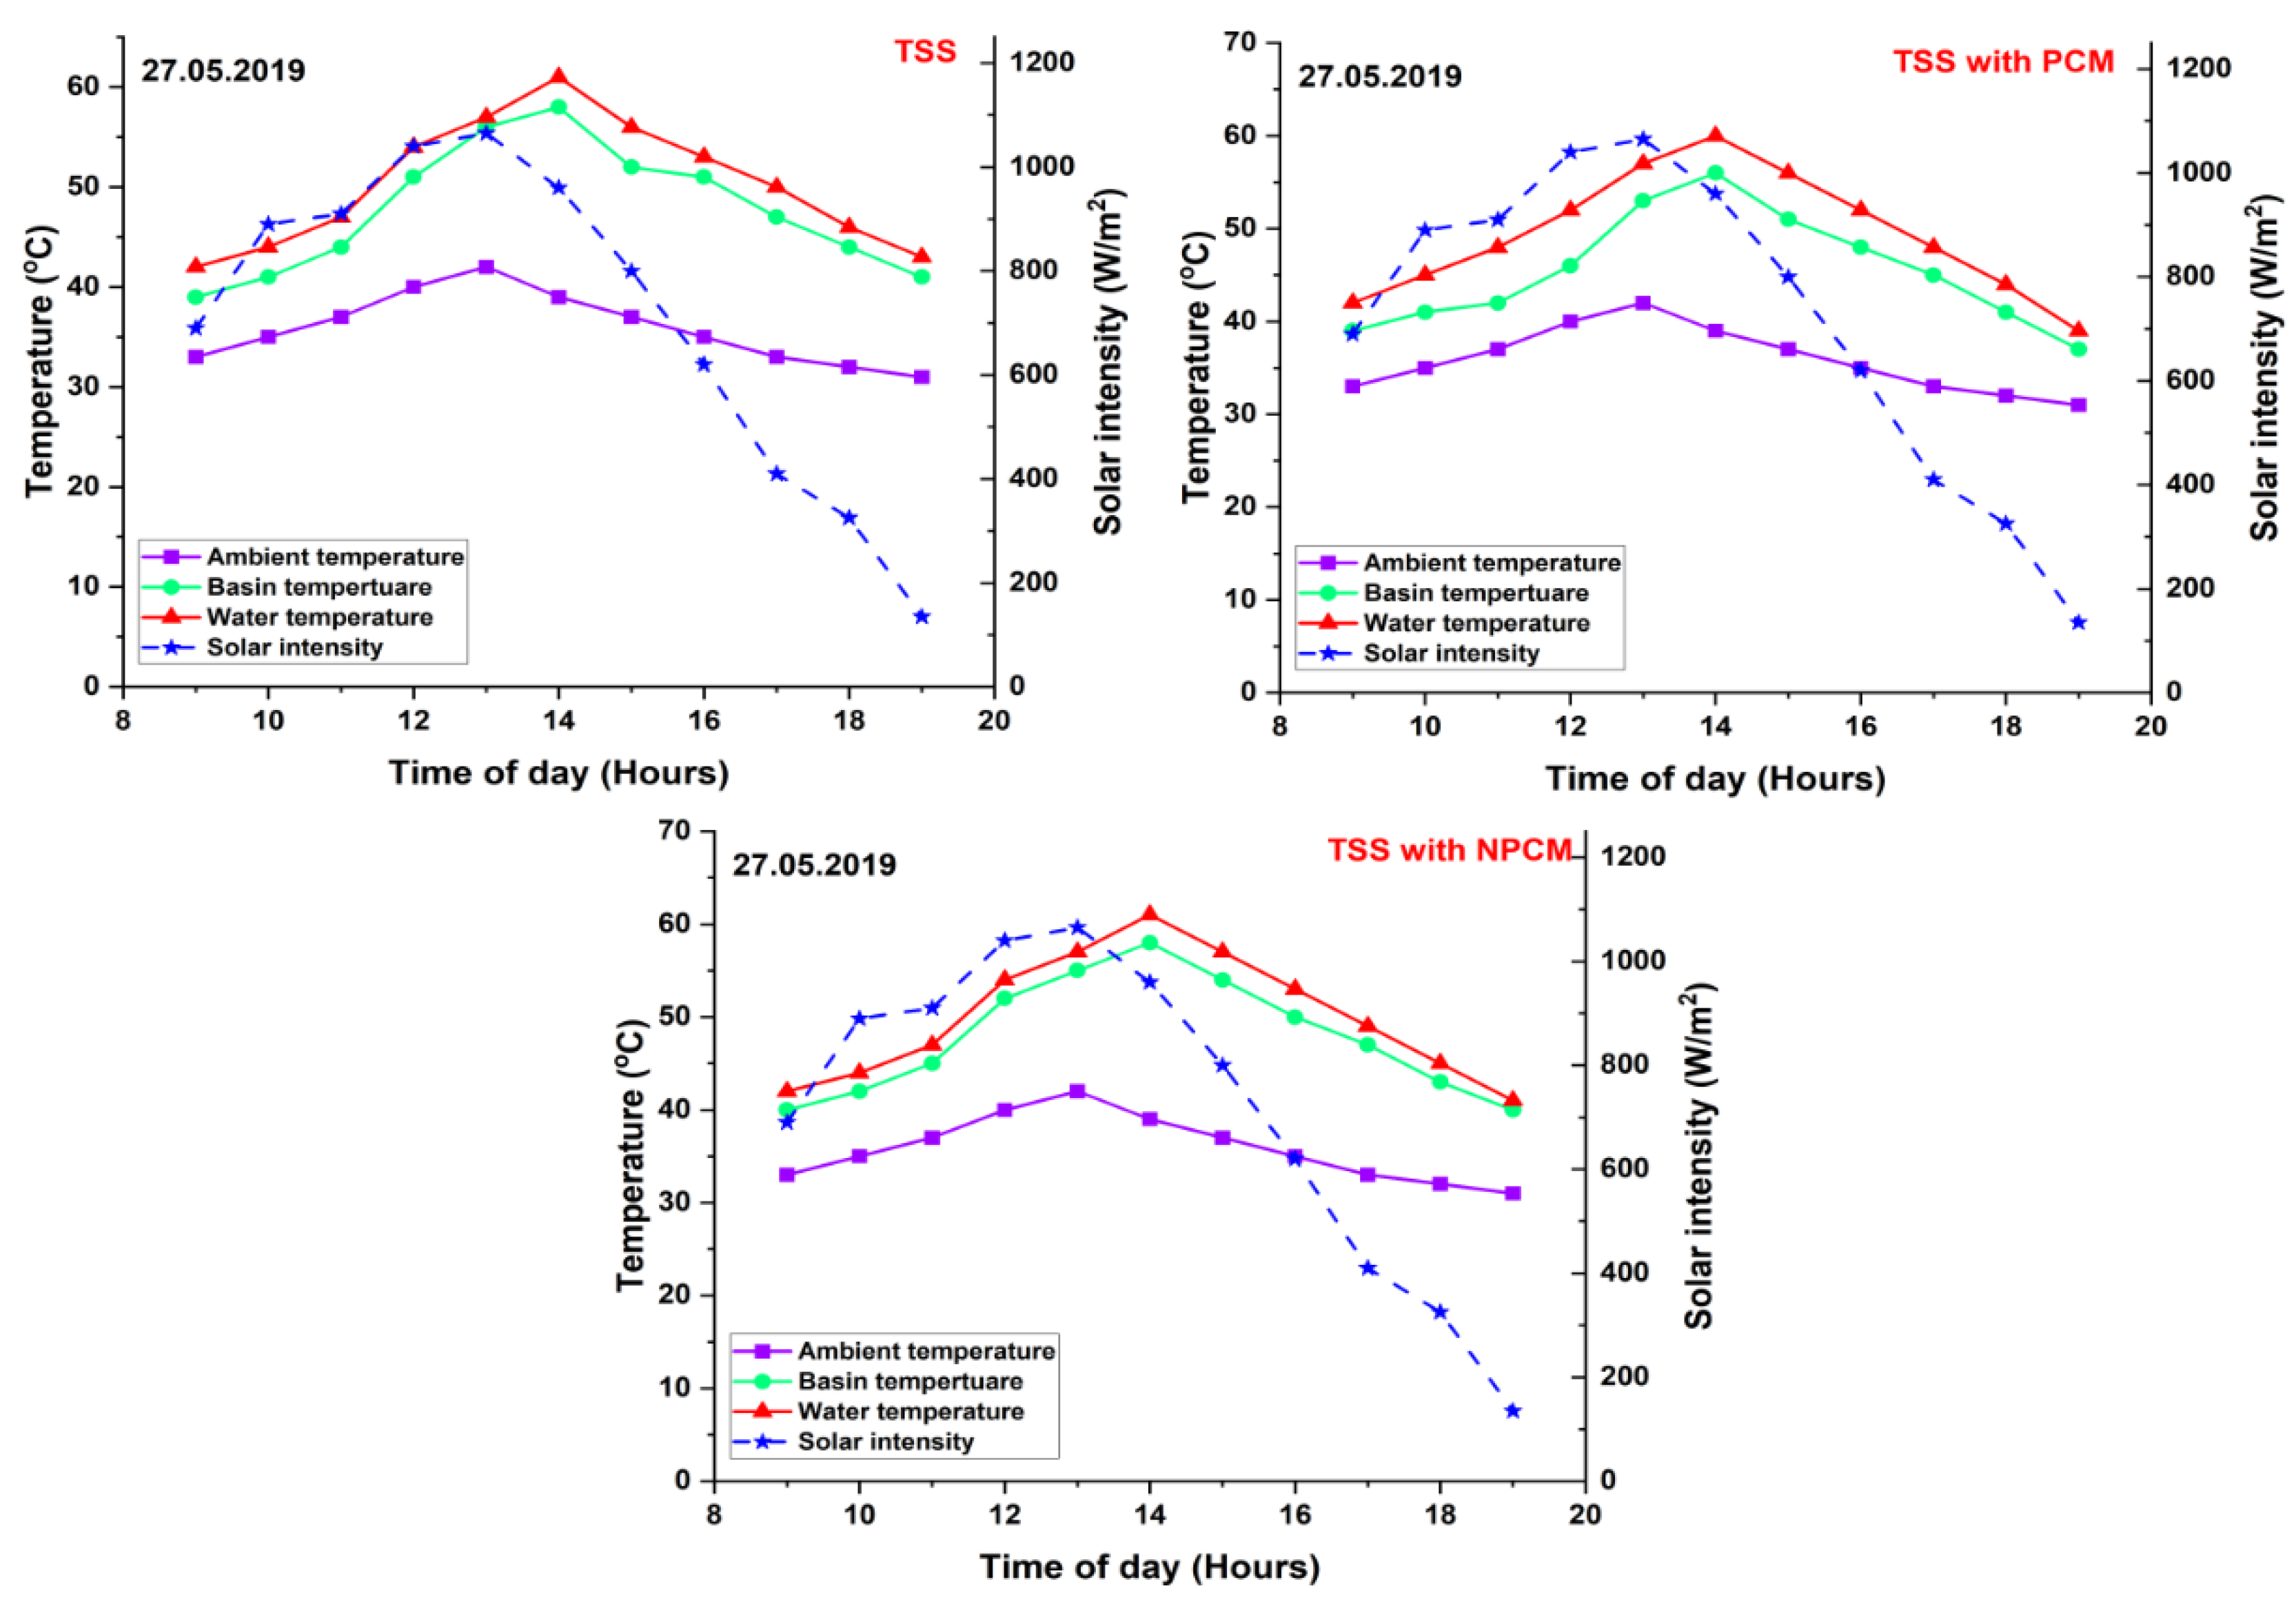
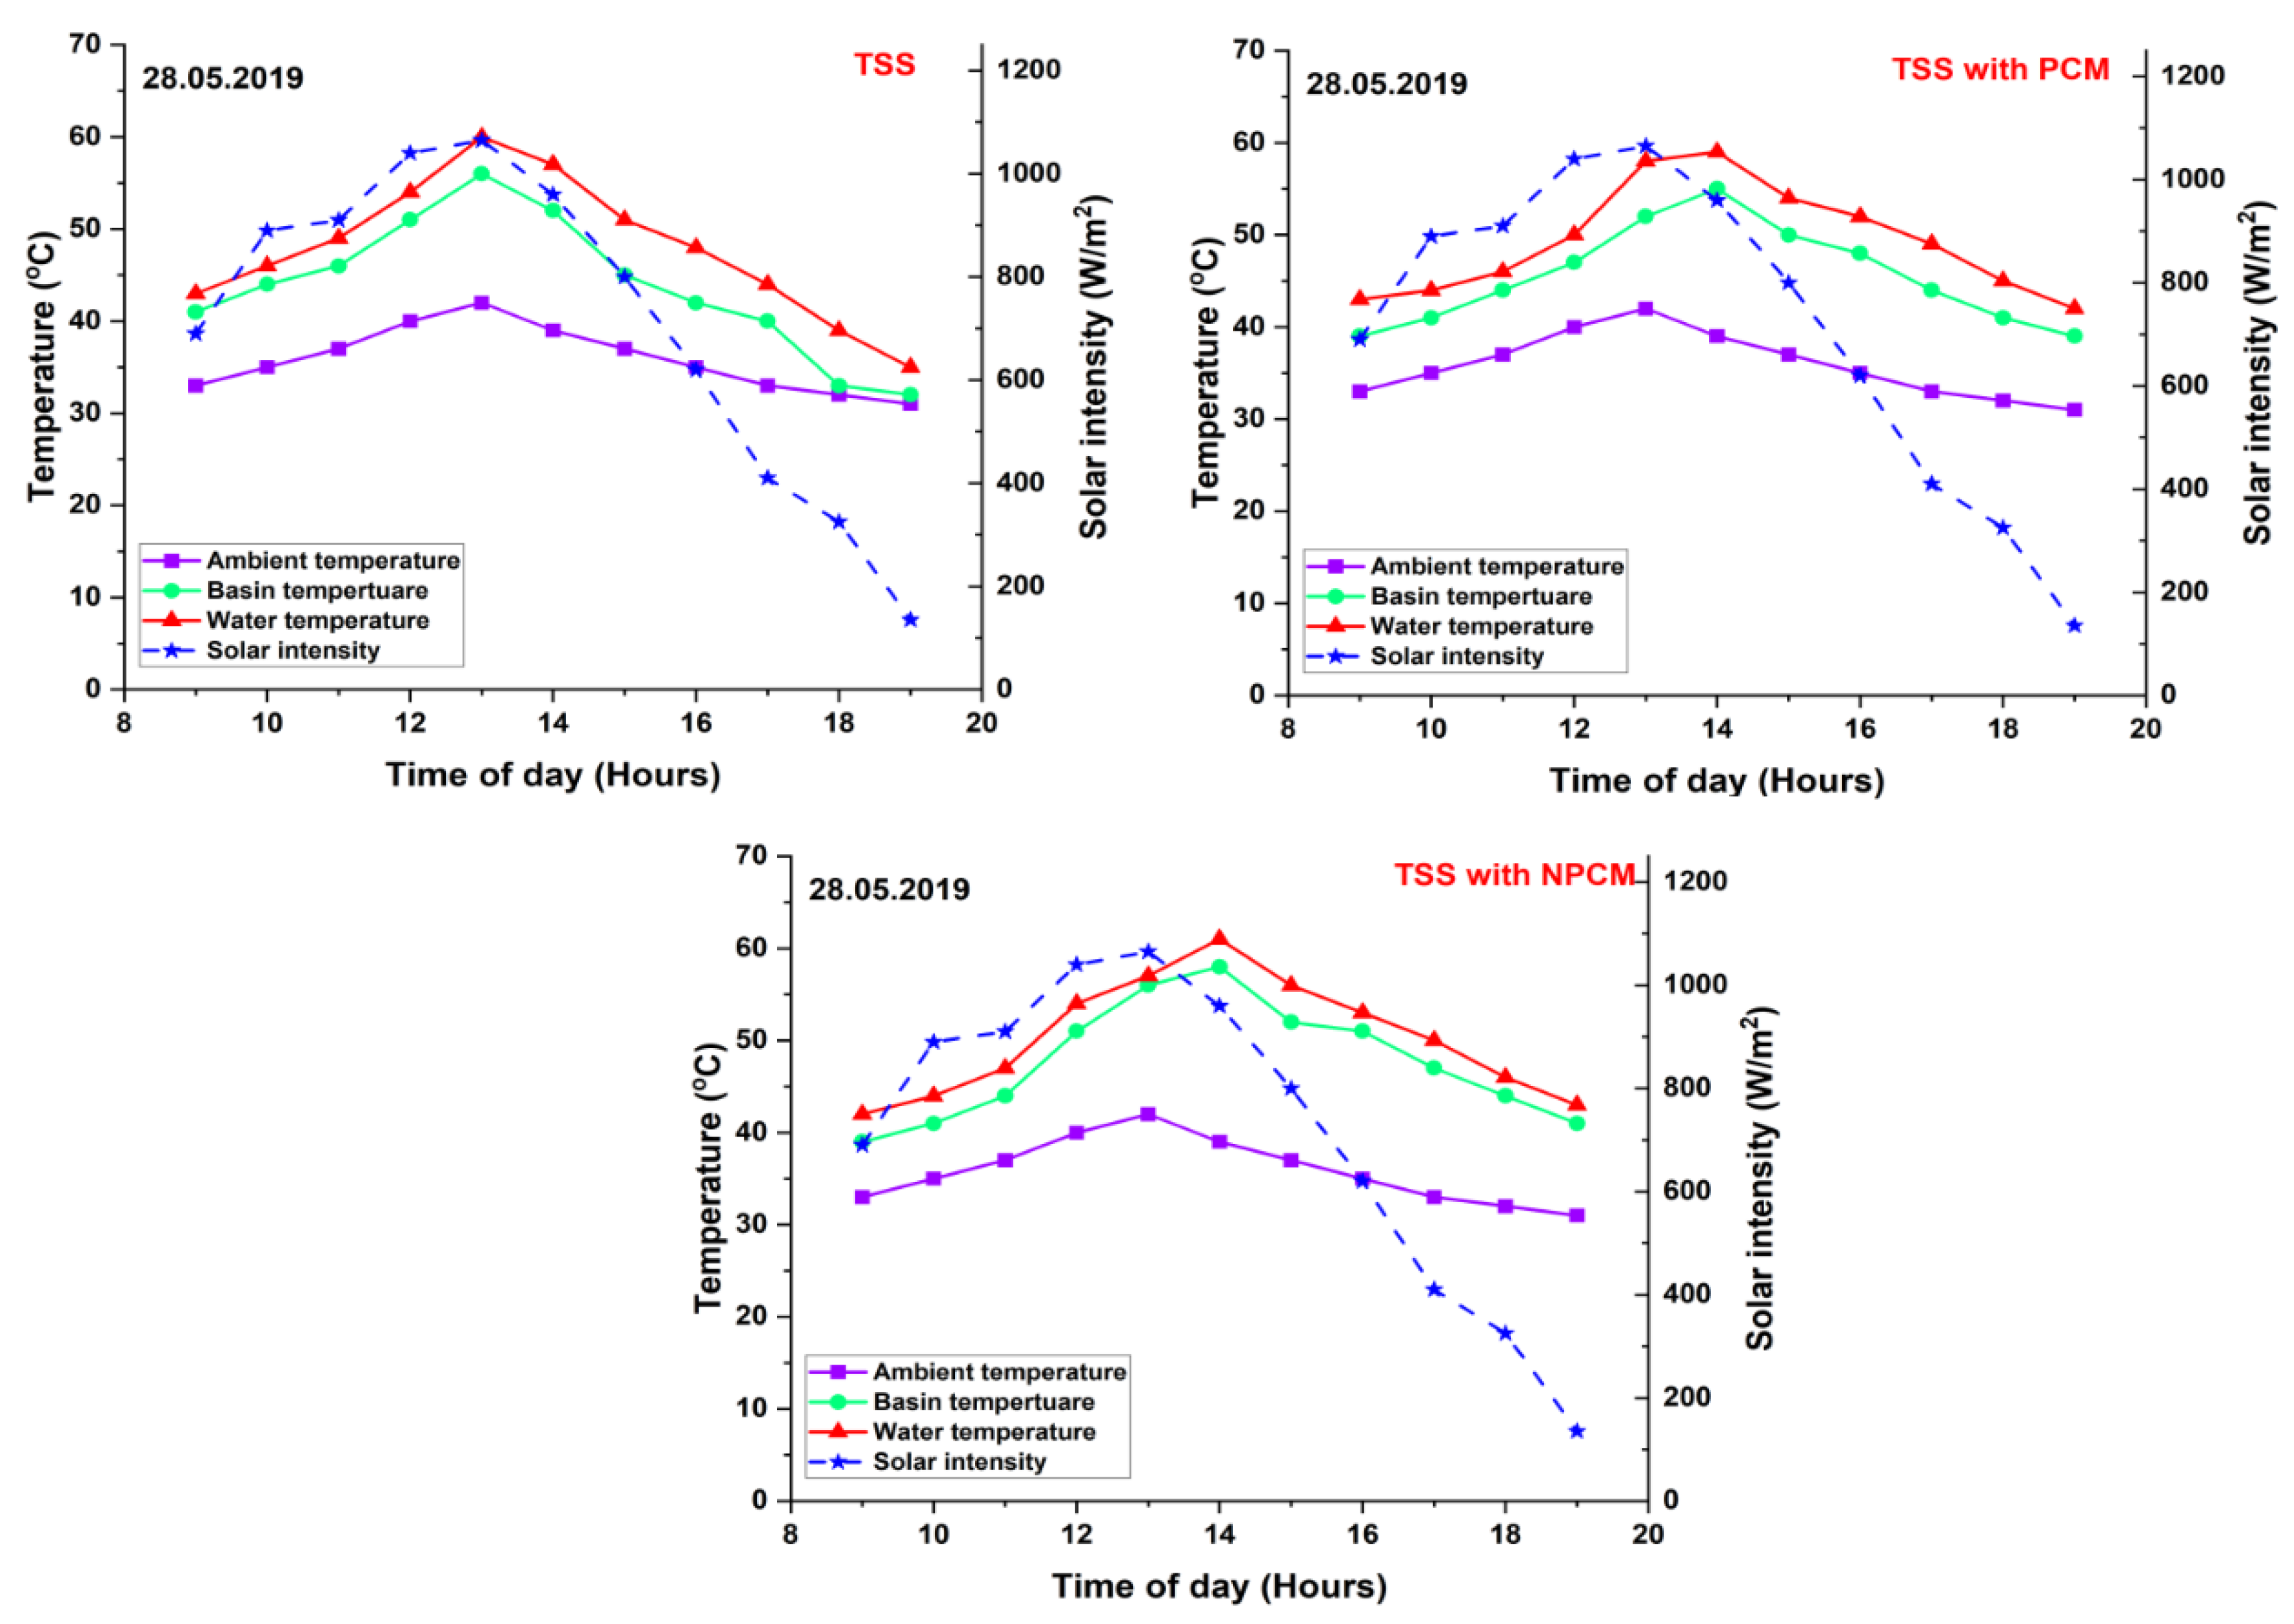
3.1. Hourly Changes in Various Parameters of the TSS Models

The changes in the solar irradiance, ambient temperature, basin temperature and brackish water temperature during the experimental days are depicted in Figure 2 and Figure 3. The solar intensity rose to reach its maximum value until 1p.m., then it declined. The maximum solar radiation values were noted to be 1060 and 1065 W/m2 on 27 May 2019 and 28 May 2019 in each instance. The average solar intensity of 720 W/m2 was recorded on 27 May 2019, while on 28 May 2019, it was observed to be 713 W/m2. On both experimental days, the highest ambient temperature was noted to be 42 ± 0.1 °C. The average ambient temperature per day was recorded to be around 36 ± 0.1 °C. The basin temperature rose with an increase in solar intensity to attain its maximum value until 1 p.m., then it declined. On 27 May 2019 and 28 May 2019, the highest basin temperatures for the CTSS were noted to be 57 ± 0.1 and 56 ± 0.1 °C in each instance. For the TSS-PCM, the maximum basin temperatures were recorded to be 56 ± 0.1 and 55 ± 0.1 °C on the respective experimental days. On 27 May 2019 and 28 May 2019, the highest basin temperatures for the TSS-NPCM were observed to be 58 ± 0.1 °C on both days. The average basin temperature per day was noted to be 44 ± 0.1, 45 ± 0.1 and 48 ± 0.1 °C for the CTSS, TSS-PCM and TSS-NPCM in each instance. Similar to the basin temperature, the brackish water temperature also increased to attain its maximum value until 1 p.m., after which it declined. On 27 May 2019 and 28 May 2019, the highest water temperatures for the CTSS were noted to be 61 ± 0.1 and60 ± 0.1 °C in each instance. For the TSS-PCM, the maximum brackish water temperatures were recorded to be 60 ± 0.1 and 59 ± 0.1 °C on the respective experimental days. On 27 May 2019 and 28 May 2019, the highest water temperatures for the TSS-NPCM were observed to be 61 ± 0.1 °C on both days. The average water temperature per day was noted to be 48 ± 0.1, 49 ± 0.1 and 50 ± 0.1 °C for the CTSS, TSS-PCM and TSS-NPCM in each instance. It was observed that TSS-NPCM has the highest basin and water temperature. The NPCM showed the highest thermal conductivity because graphene has excellent heat absorption capacity in comparison to other materials.

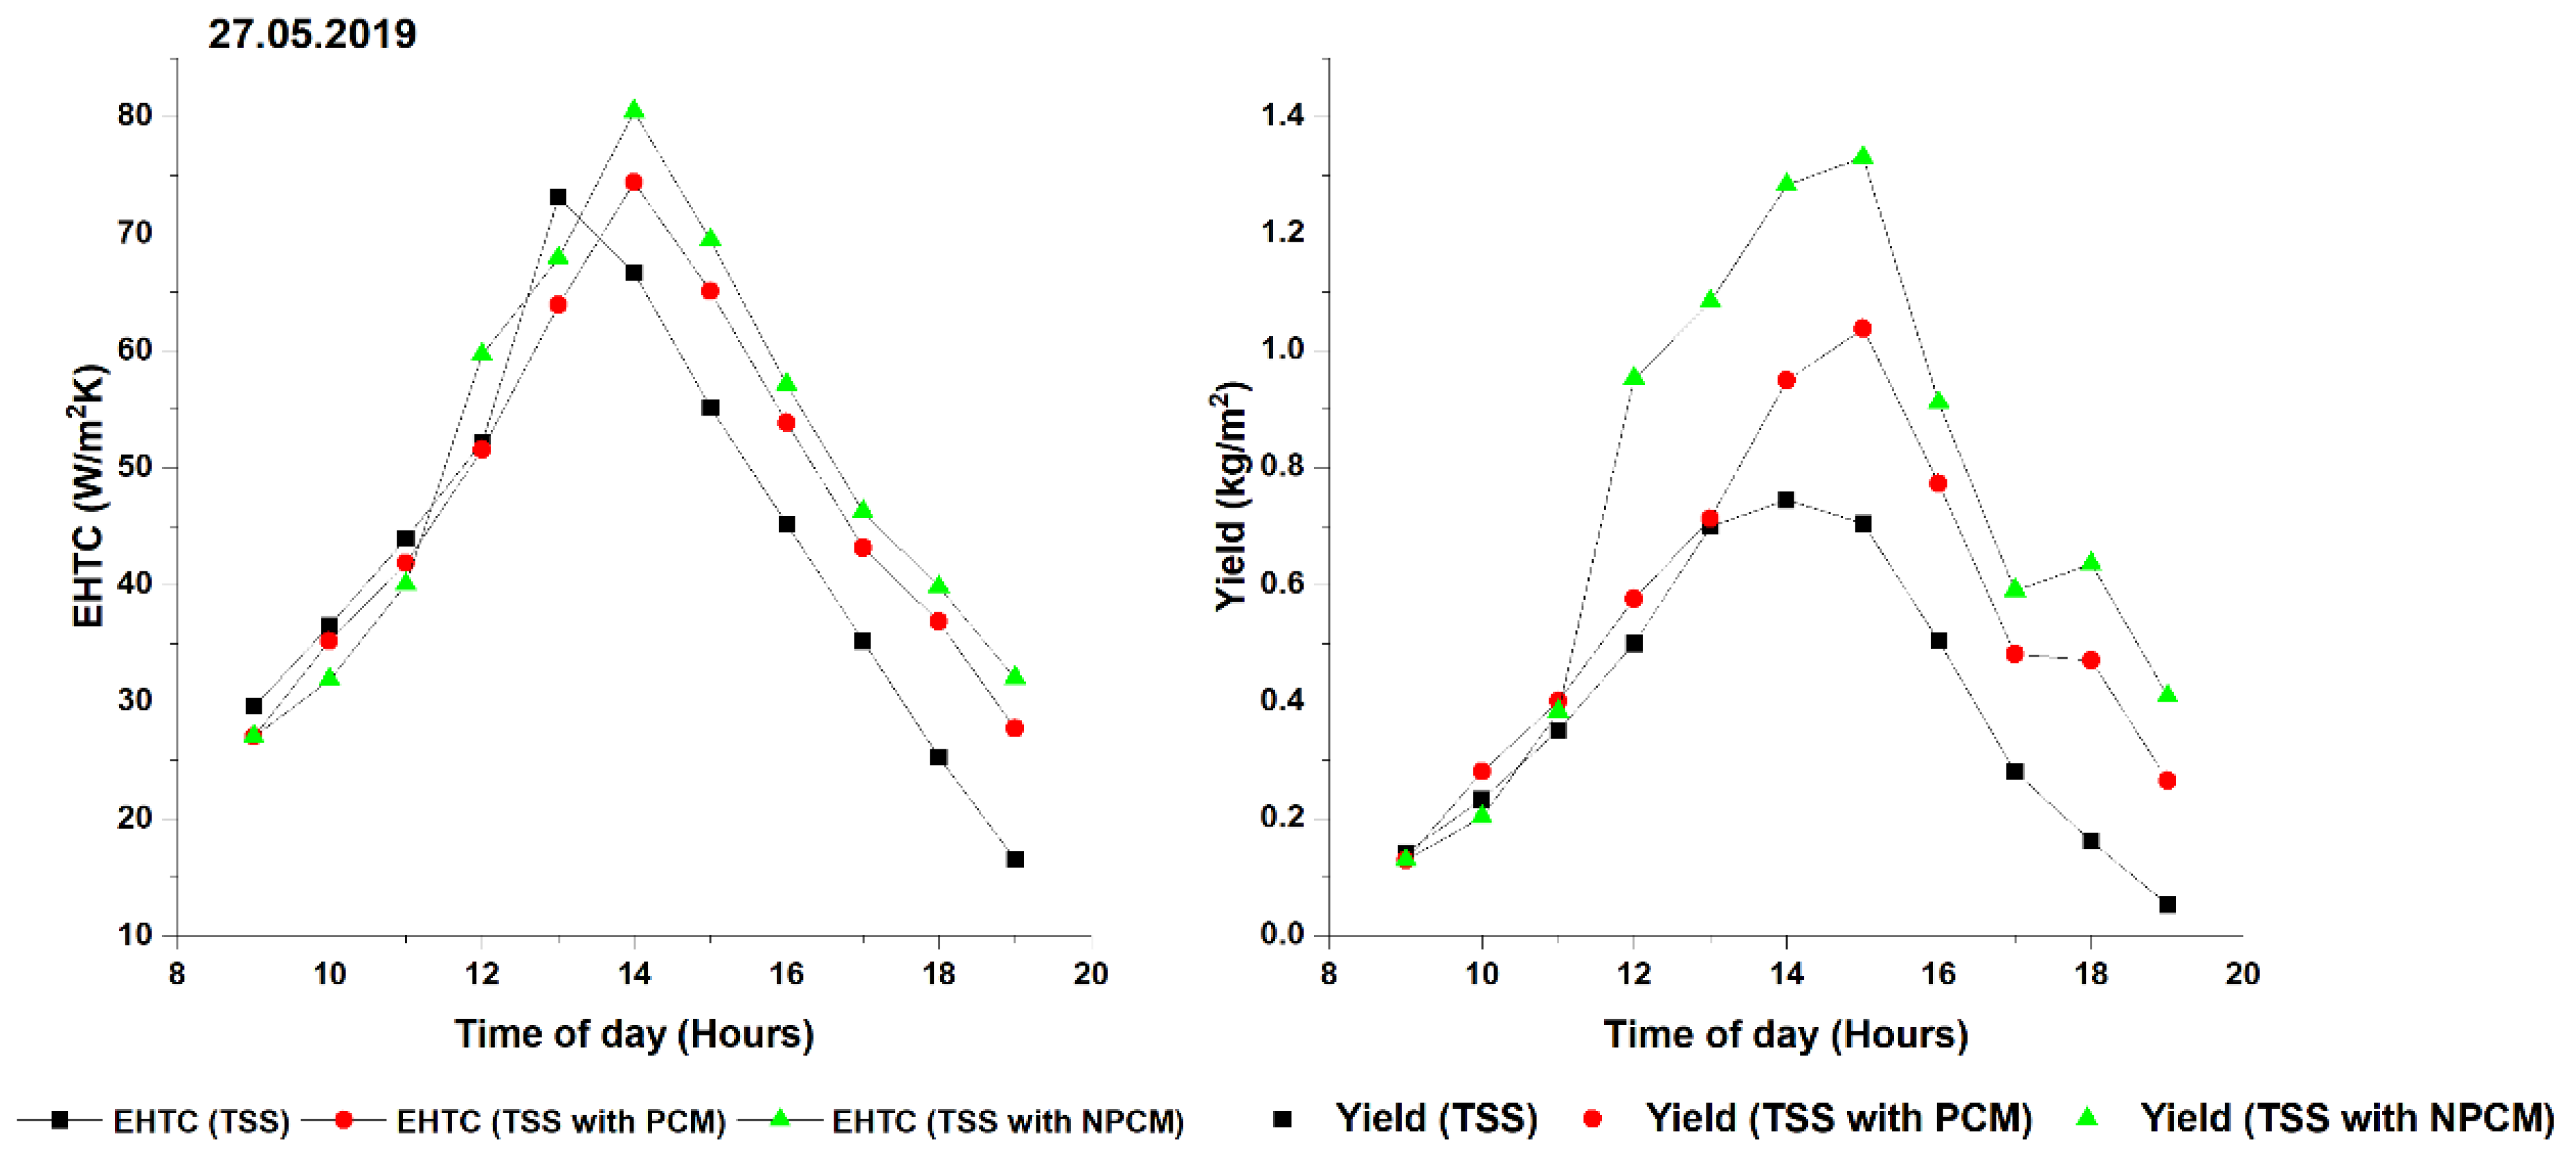
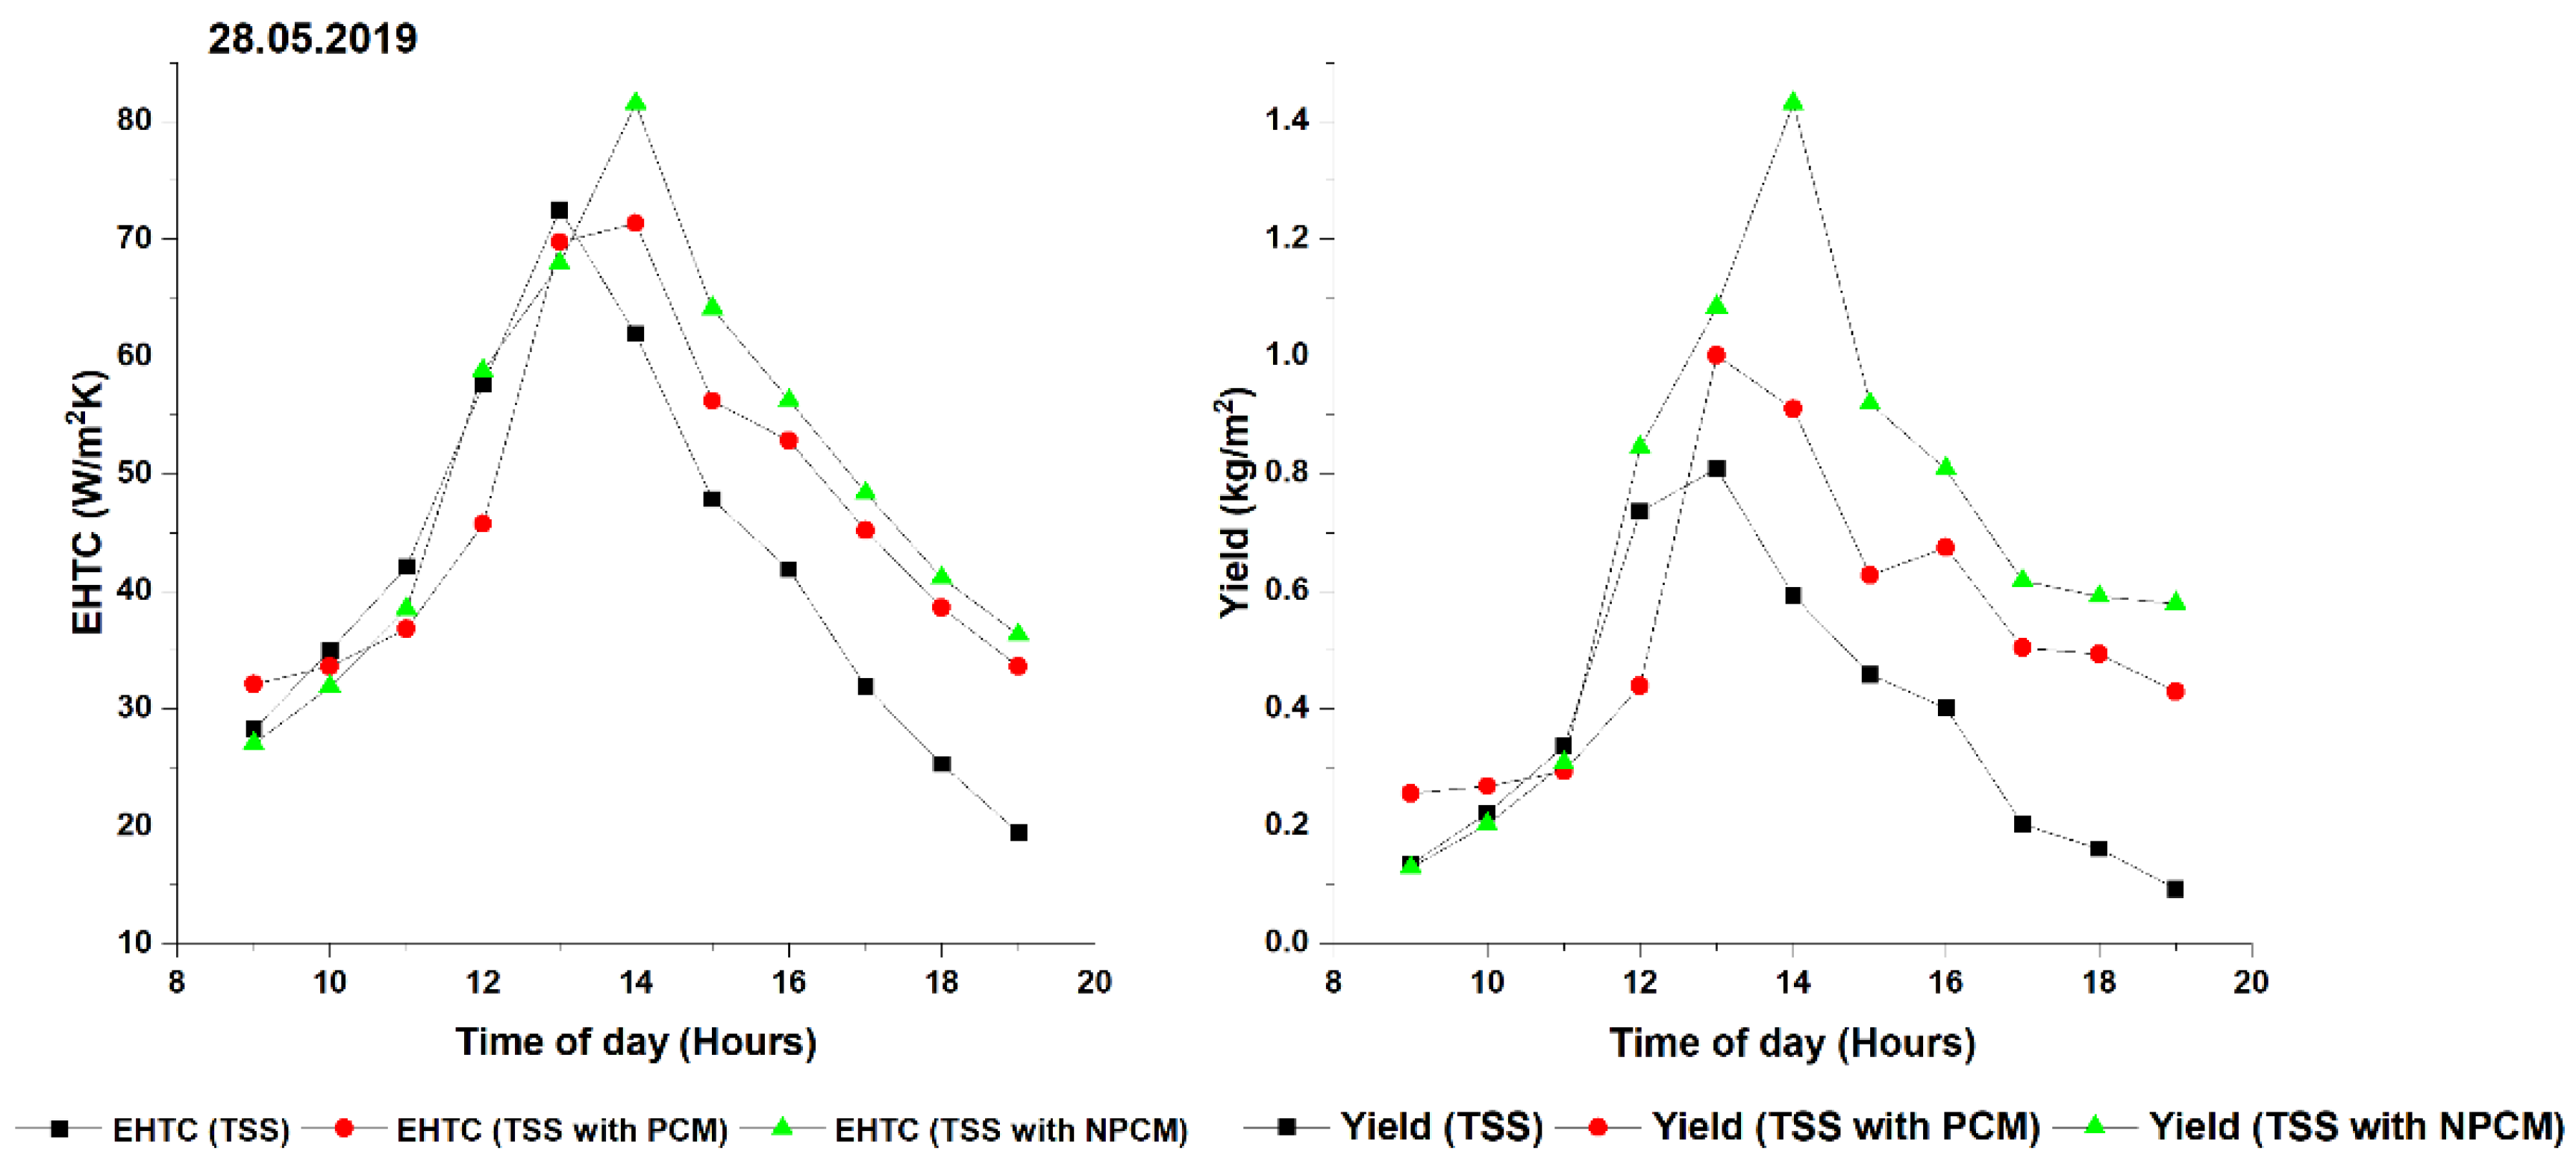
3.2. Hourly Changes of Evaporative Heat Transfer Coefficient (EHTC) and Productivity of the TSS Models

The changes in EHTC and the potable water productivity of the CTSS, TSS-PCM and TSS-NPCM are depicted in Figure 4 and Figure 5. In general, the TSS-NPCM shows the highest EHTC value on both the experimental days at 2 p.m. On 27 May 2019 and 28 May 2019, the highest EHTC values for the CTSS were noted to be 73 and 72 W/m2K in each instance. For the TSS-PCM, the maximum EHTC values were recorded to be 74 K and 71 W/m2K on the respective experimental days. On 27 May 2019 and 28 May 2019, the highest EHTC values for the TSS-NPCM were observed to be 81 W/m2K on both days. The average EHTC value per day was noted to be 43, 47 and 50 W/m2K for the CTSS, TSS-PCM and TSS-NPCM in each instance.
The EHTC from brackish water to tubular cover is calculated by Equation (1) [40]
h e , w g = 16.273 × 10 3 x h c , w g [ P w P g i T w T g i ]
Convective heat transfer coefficient (hc) from brackish water to tubular cover is calculated by Equation (2) [40]
h c , w g = 0.884 [ ( T w T g i ) + ( P w P g i ) ( T w + 273 ) ( 268.9 × 10 3 P w ) ]
where Pw and Pgi denote the partial vapor pressure of water and inner glass, while Tw and Tgi denote the water temperature and inner glass temperature, respectively.
Partial vapor pressure at the brackish water temperature is calculated by Equation (3) [40],
P w = e x p ( 25.317 ( 5144 273 + T w ) )
Partial vapor pressure at the inner tubular cover is calculated by Equation (4) [40],
P g i = e x p ( 25.317 ( 5144 273 + T g i ) )
The presence of NPCM in the TSS has helped in enhancing the maximum hourly yield of freshwater. The highest amount of pure water produced per hour was obtained at 2 p.m. on both the experimental days from the TSS-NPCM. On 27 May 2019 and 28 May 2019, the highest yield from the CTSS was noted to be 0.74 and 0.80 kg in each instance at 2 p.m. For the TSS-PCM, the maximum yield was recorded to be 1.03 and 1.00 kg on the respective experimental days. On 27 May 2019 and 28 May 2019, the highest yield from the TSS-NPCM was observed to be 1.32 and 1.43 kg in each instance at 2 p.m. The total yield per day was noted to be 4.3, 6.0 and 7.9 kg from the CTSS, TSS-PCM and TSS-NPCM in each instance. The high thermal conductivity of the NPCM helped in raising the temperature of the water, in turn contributing to the enhancement in the distillate yield. During the day, the NPCM absorbed high amounts of heat, which it stored and slowly released during the off shine hours, which helps in the heating and evaporation of water to produce the highest yield.

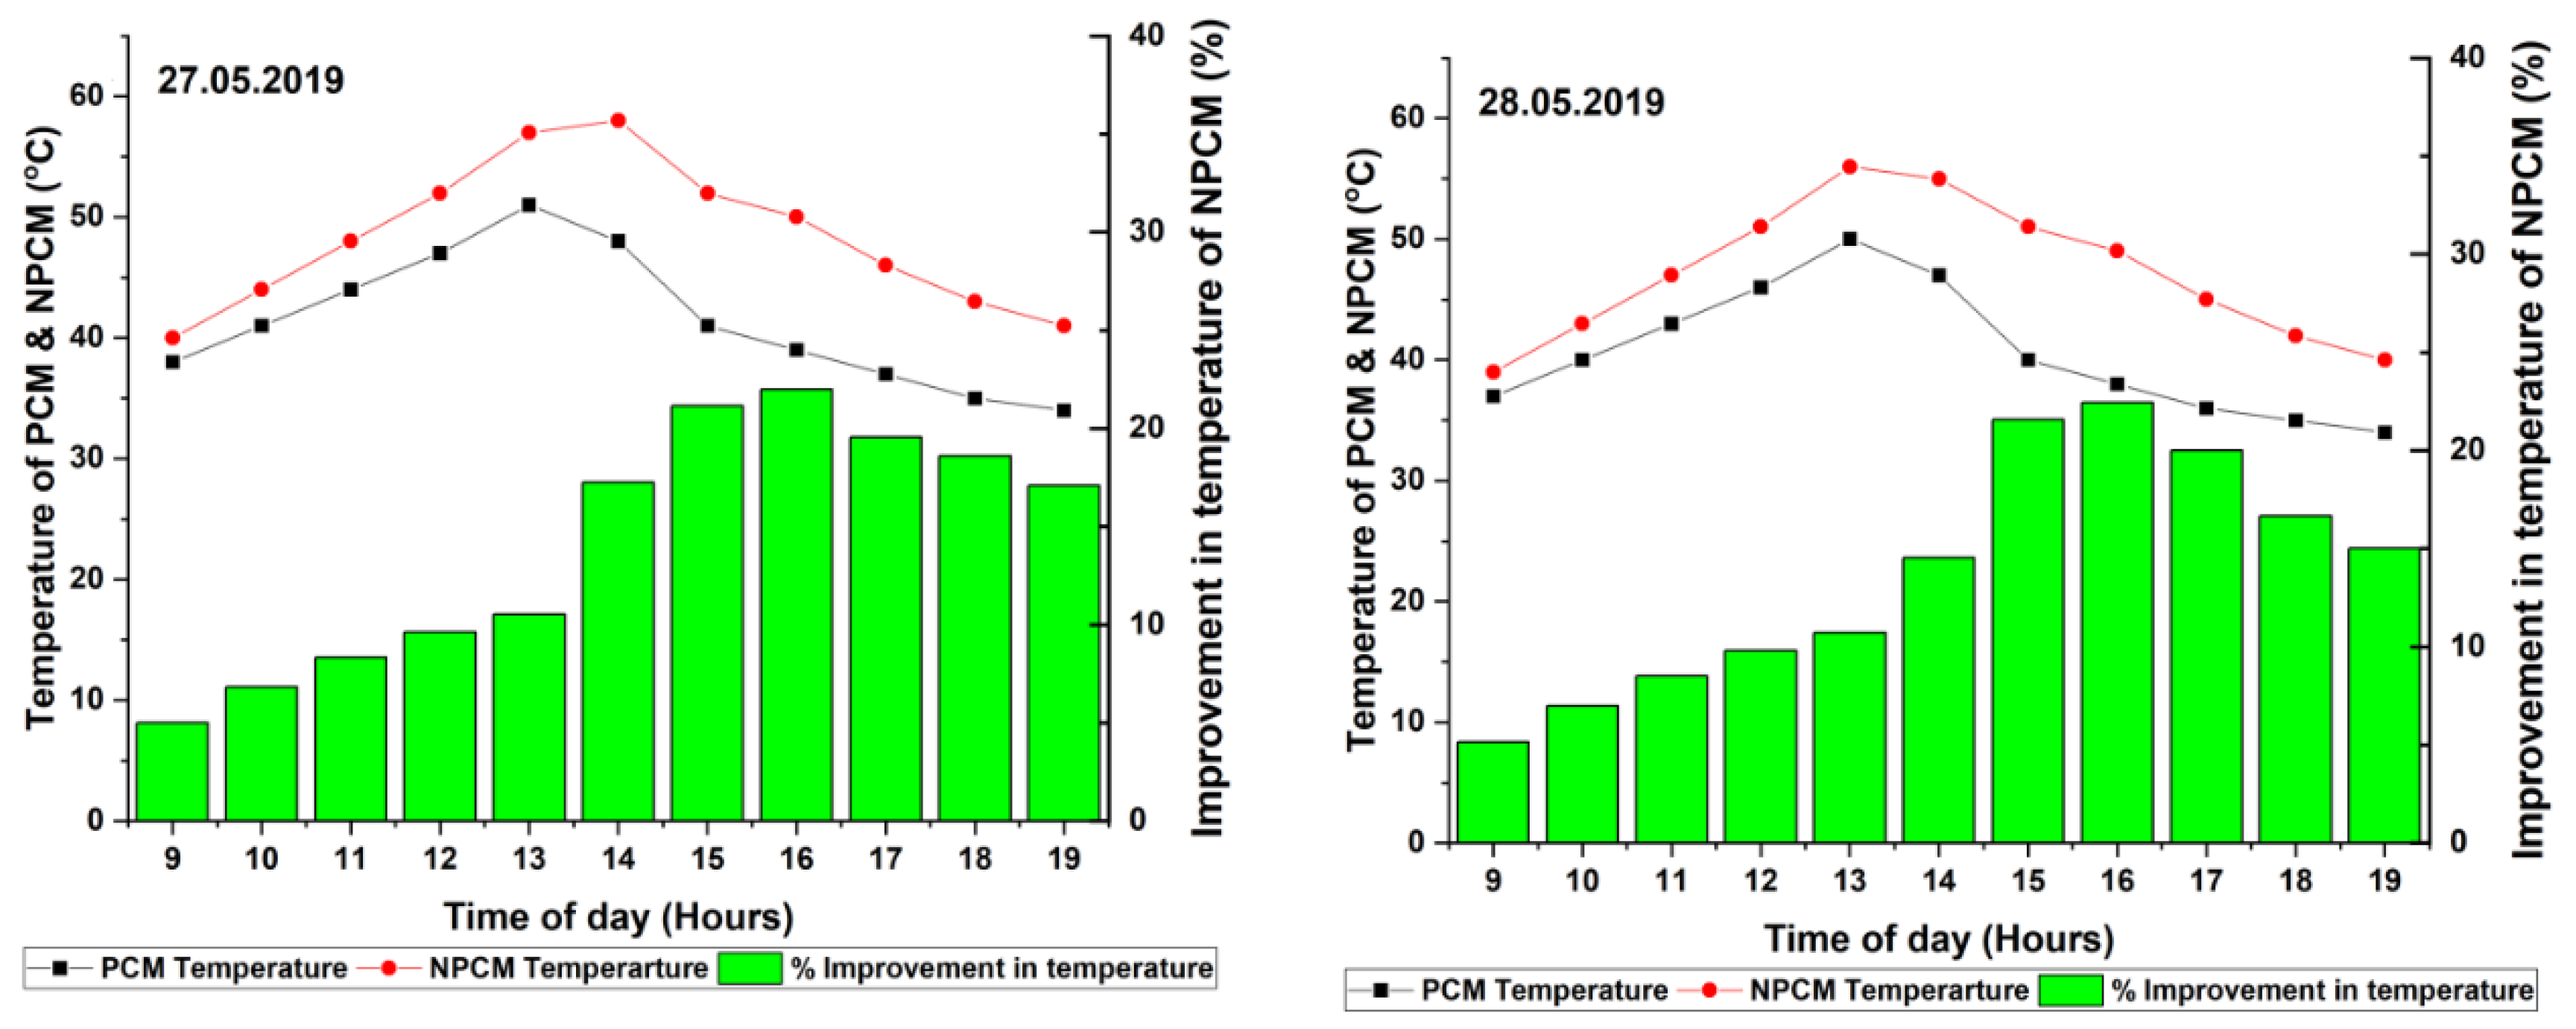
3.3. Hourly Changes in the PCM and NPCM Temperatures in the TSS Models

The changes in the PCM and NPCM temperature in the TSS-PCM and TSS-NPCM, as well as improvement in temperature of NPCM are depicted in Figure 6. The NPCM shows greater temperature than the PCM because of the high thermal conductivity of graphene. The highest temperature on both the experimental days was obtained at 1 p.m. On 27 May 2019 and 28 May 2019, the highest PCM temperatures were noted to be 51 ± 0.1 and 50 ± 0.1 °C in each instance. For the NPCM, the maximum temperatures were recorded to be 57 ± 0.1 and 56 ± 0.1 °C on the respective experimental days. The average PCM and NPCM temperatures per day were noted to be 41 ± 0.1 and 48 ± 0.1 °C in each instance. The NPCM showed about a 17.1% rise in temperature when compared to the PCM. The excellent heat absorption capacity during the on shine hours, and the ability to release the heat slowly during the off shine hours, has helped the TSS-NPCM perform better than the CTSS and TSS-PCM in all aspects.

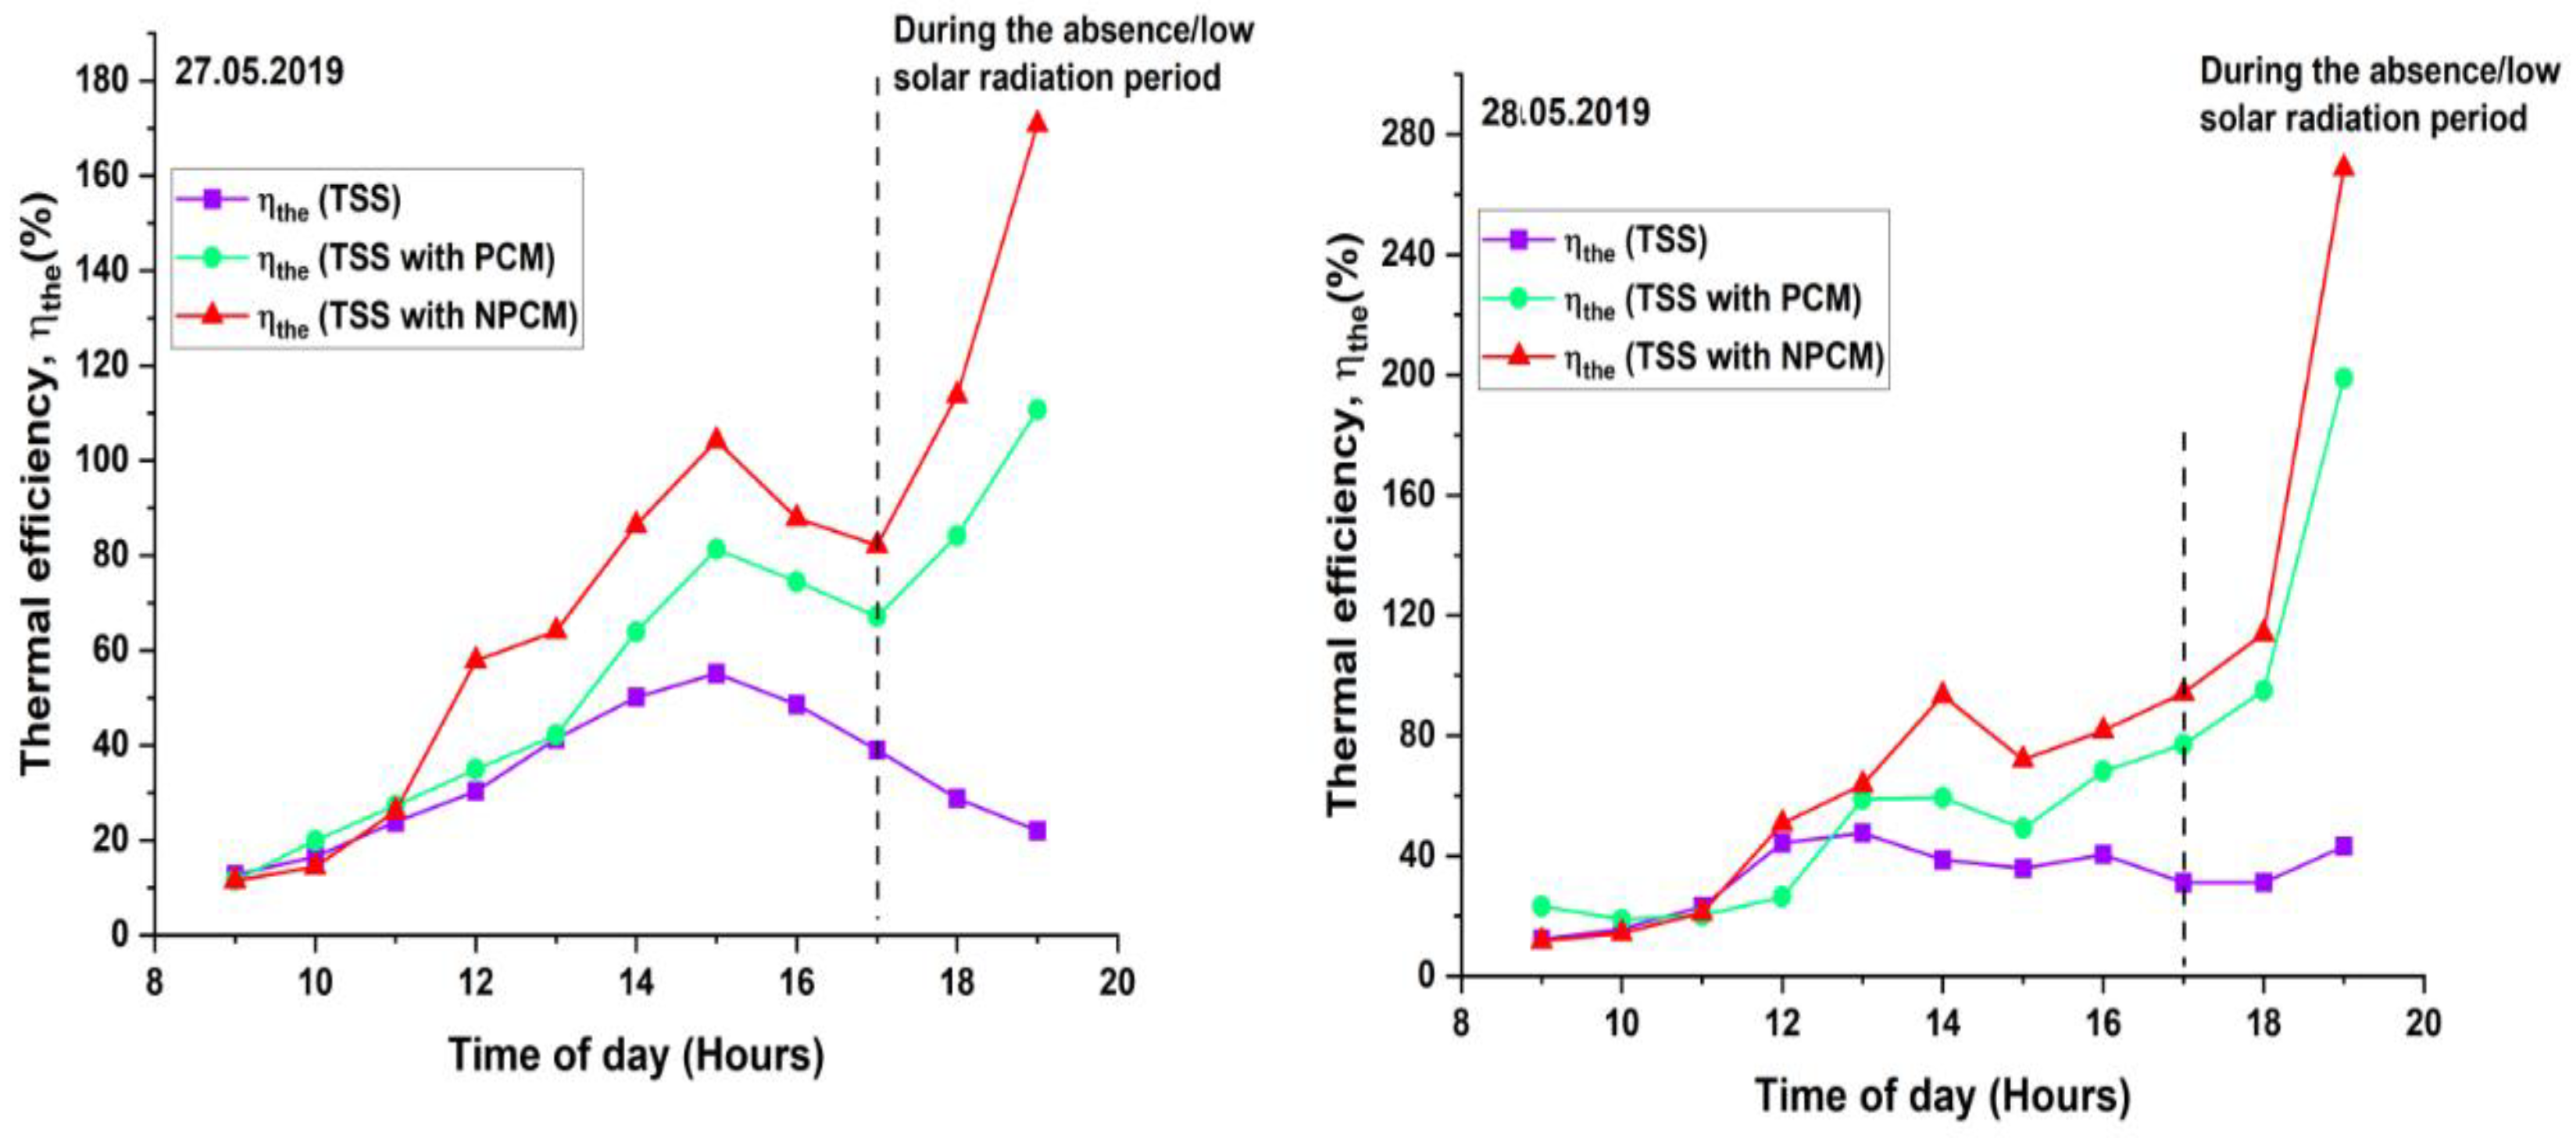
3.4. Hourly Changes in the Thermal Efficiency of the TSS Models

The changes in the thermal efficiency of the CTSS, TSS-PCM and TSS-NPCM are depicted in Figure 7. The energy efficiency of the NPCM is higher than that of the PCM because of its high thermal properties. On 27 May 2019 and 28 May 2019, the highest thermal efficiency of the CTSS was noted to be 55% and 47% at 2 p.m. in each instance. For the TSS-PCM, the maximum thermal efficiency was recorded to be 110% and 198% on the respective experimental days at 7 p.m. On 27 May 2019 and 28 May 2019, the highest thermal efficiency of the TSS-NPCM was observed to be 170% and 268% at 7p.m. The average thermal efficiency per day was noted to be 31%, 46% and 59% for the CTSS, TSS-PCM and TSS-NPCM in each instance. The NPCM shows the highest thermal efficiency because graphene has excellent heat absorption capacity in comparison to other materials.
The energy efficiency of the TSS is calculated by Equation (5) [40],
η p . t h = m e w   ×   h f g I S ( t ) × A s × 3600 × 100 %
mew being the mass flow rate of water, hfg the latent heat of vaporization, As the still area and Is the solar irradiance received.

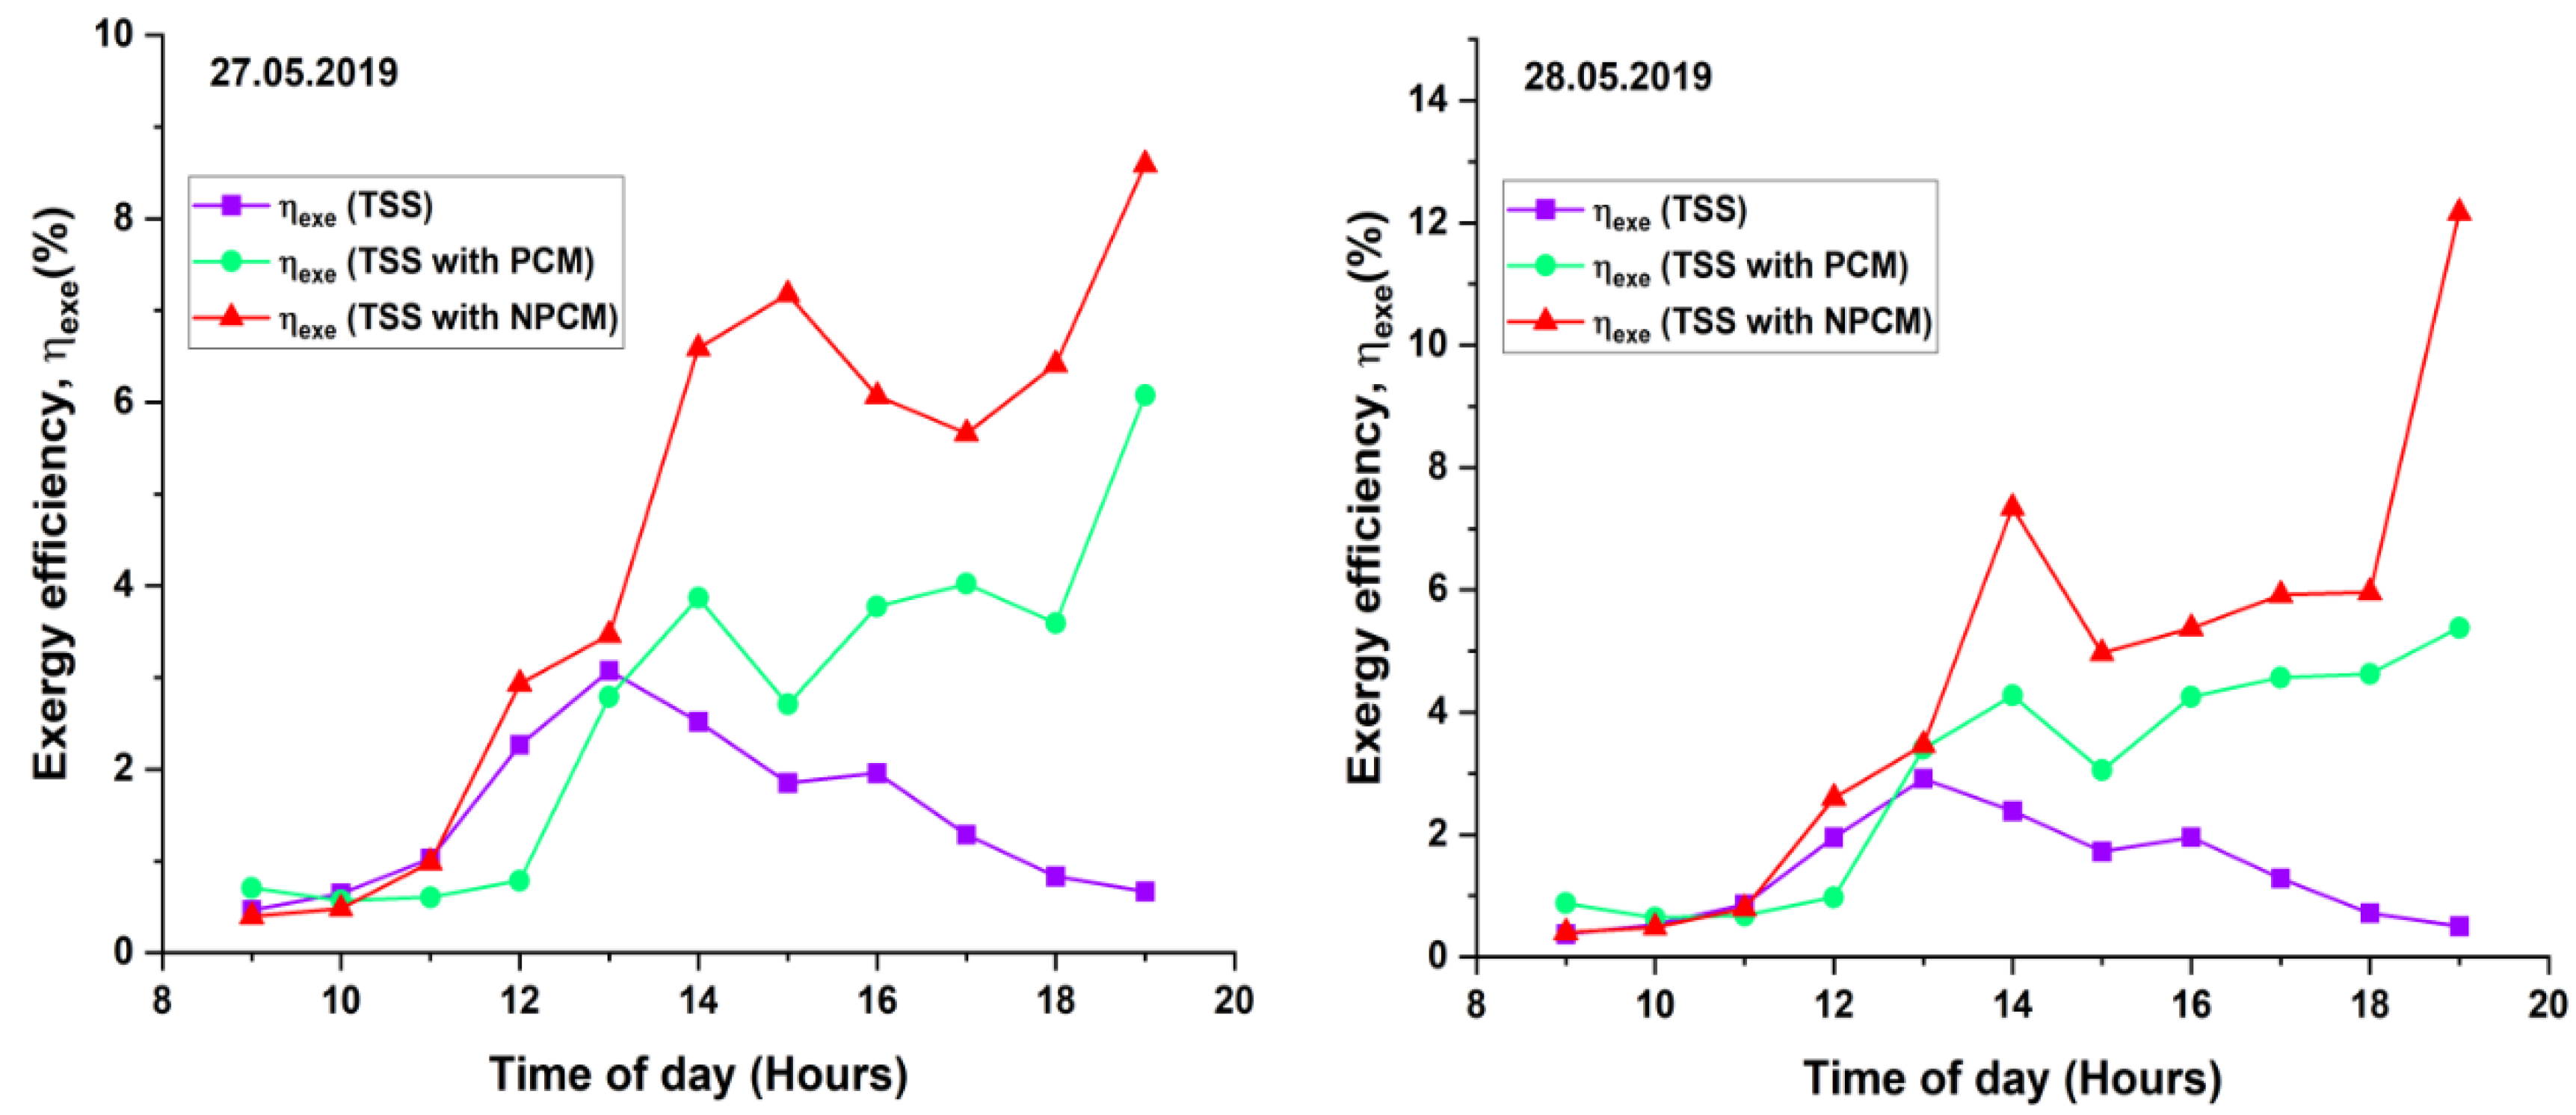
3.5. Hourly Changes in the Exergy Efficiency of the TSS Models

The changes in the exergy efficiency of the CTSS, TSS-PCM and TSS-NPCM are depicted in Figure 8. On 27 May 2019 and 28 May 2019, the highest exergy efficiency of the CTSS was noted to be 3.07% and 2.91% at 1 p.m. in each instance. For the TSS-PCM, the maximum exergy efficiency was recorded to be 6.07% and 5.38% on the respective experimental days at 7 p.m. On 27 May 2019 and 28 May 2019, the highest exergy efficiency of the TSS-NPCM was calculated to be 8.58% and 12.16% at 7 p.m. The average exergy efficiency per day was noted to be 1.67%, 2.20% and 3.75% for the CTSS, TSS-PCM and TSS-NPCM in each instance. The TSS-PCM and the TSS-NPCM showed 24.1% and 55.4% enhancement in exergy effectiveness in each instance when compared to the CTSS setup. The higher heat absorption capacity of the graphene in the NPCM helped in better productivity and efficiency.
The exergy efficiency of the TSS is calculated by Equation (6) [41],
η p . e = e p . o u t e p . i n
where ep.out is the output exergy and ep.in is the input exergy.
Exergy output of a TSS is calculated by Equation (7) [41],
e p . o u t = ( m d x h f g ) ( 1 [ T a + 273 T w + 273 ] )
md being the hourly yield, hfg the latent heat of vaporization, Ta the air temperature, and Tw the water temperature.
Exergy input of a TSS is calculated by Equation (8) [41],
e p . i n = ( A x I t ) [ 1 + ( 1 3 [ T a + 273 6000 ] 4 4 3 [ T a + 273 6000 ] ) ]
where A is the area of the solar still, It is the solar irradiance received and Ta is the air temperature.
Table 2 summarizes the yield, energy and exergy efficiency of the CTSS, TSS-PCM and TSS-NPCM, and it also summarizes the percentage increase in yield, energy efficiency and exergy efficiency of the TSS-PCM and TSS-NPCM compared to the CTSS.
Table 2 shows that the yield produced from the TSS-PCM was 38.9% to 42.3% higher compared to the CTSS, and the yield produced from the TSS-NPCM was 81% higher compared to the CTSS. Table 3 provides the relative studies between the productivity of various stills with PCM. It is identified in Table 3 that the maximum yield of 9.36 L/m2day was obtained by Kabeel et al. [27] in the analysis of solar still with hot air injection and the use of PCM. In the present research, PCM produces a yield of 6.07 kg, and NPCM produces a yield of 7.9 kg.

4. Conclusions

The following results have been reported from the above study:
  • The presence of PCM and NPCM increased both the basin and brackish water temperature considerably. Average basin temperature per day for the CTSS, TSS-PCM and TSS-NPCM were recorded to be 44 ± 0.1, 45 ± 0.1 and 47 ± 0.1 °C, while the average water temperatures in a day for the models were noted to be 47 ± 0.1, 49 ± 0.1 and 50 ± 0.1 °C.
  • The productivity of TSS-NPCM was recorded to be the highest. The total yield per day was noted to be 4.37, 6.07 and 7.91 kg from the CTSS, TSS-PCMand TSS-NPCM in each instance.
  • Due to the high thermal conductivity of graphene, the NPCM shows about a 17.1% rise in temperature when compared to PCM (paraffin wax).
  • The thermal efficiency of the NPCM is higher than that of the PCM because of its high thermal properties. The highest thermal efficiencies of the CTSS, TSS-PCM and TSS-NPCM were noted to be 55%, 198%, and 268%, respectively.
  • The highest exergy efficiencies of the CTSS, TSS-PCM and TSS-NPCM were noted to be 1.67%, 2.2% and 3.75%, respectively.

Author Contributions

M.M.T.—writing—original draft preparation; A.M.M.—Conceptualization, methodology, project administration and writing—review and editing; F.A.E.—writing—review and editing; N.V.—supervision and methodology; R.S.—software, validation, formal analysis and writing—review and editing; F.P.G.M.—writing—review and editing. All authors have read and agreed to the published version of the manuscript.

Funding

This research received no external funding.

Conflicts of Interest

The authors declare no conflict of interest.

Abbreviations

Abbreviations
CTSSConventional Tubular Solar Still
TSSTubular Solar Still
PCMPhase Change Material
NPCMNano Phase Change Material
PCParabolic Concentrator
CPCConcentric Parabolic Concentrator
EHTCEvaporative Heat Transfer Coefficient
Nomenclature
AArea (m2)
hHeat transfer coefficient (W/m2K)
I(t)Solar intensity (W/m2)
MHourly productivity from Solar Still (kg/m2 h)
PPartial vapor pressure (N/m2)
TTemperature (°C)
ηefficiency (%)
Subscript
aAmbient
cConvective
dDaily
eEvaporative
gGlass
giinner glass
pvPhotovoltaic
sSurface area of condensing cover
thThermal
wWater

References

  1. Manokar, A.M.; Winston, D.P.; Kabeel, A.; El-Agouz, S.; Sathyamurthy, R.; Arunkumar, T.; Madhu, B.; Ahsan, A. Integrated pv/t solar still-a mini-review. Desalination 2018, 435, 259–267. [Google Scholar] [CrossRef]
  2. Sathyamurthy, R.; Arunkumar, T. Different parameter and technique affecting the rate of evaporation on active solar still-a review. Heat Mass Transf. 2018, 54, 593–630. [Google Scholar]
  3. Gonzalo, A.P.; Marugán, A.P.; Márquez, F.P.G. A review of the application performances of concentrated solar power systems. Appl. Energy 2019, 255, 113893. [Google Scholar] [CrossRef] [Green Version]
  4. Muñoz, C.Q.G.; Marquez, F.P.G.; Liang, C.; Maria, K.; Abbas, M.; Mayorkinos, P. A New Condition Monitoring Approach for Maintenance Management in Concentrate Solar Plants, Proceedings of the Ninth International Conference on Management Science and Engineering Management, Karlsruhe, Germany, 21–23 July 2015; Springer: Berlin/Heidelberg, Germany, 2015; pp. 999–1008. [Google Scholar]
  5. Manokar, A.M.; Vimala, M.; Winston, D.P.; Ramesh, R.; Sathyamurthy, R.; Nagarajan, P.; Bharathwaaj, R. Different parameters affecting the condensation rate on an active solar still—A review. Environ. Prog. Sustain. Energy 2019, 38, 286–296. [Google Scholar] [CrossRef] [Green Version]
  6. Kabeel, A.; MuthuManokar, A.; Sathyamurthy, R.; Prince Winston, D.; El-Agouz, S.; Chamkha, A.J. A review on different design modifications employed in inclined solar still for enhancing the productivity. J. Sol. Energy Eng. 2019, 141. [Google Scholar] [CrossRef]
  7. Manokar, A.M.; Taamneh, Y.; Kabeel, A.; Sathyamurthy, R.; Winston, D.P.; Chamkha, A.J. Review of different methods employed in pyramidal solar still desalination to augment the yield of freshwater. Desalin Water Treat. 2018, 136, 20–30. [Google Scholar] [CrossRef]
  8. Manokar, A.M.; Winston, D.P. Experimental analysis of single basin single slope finned acrylic solar still. Mater. Today Proc. 2017, 4, 7234–7239. [Google Scholar] [CrossRef]
  9. Manokar, A.M.; Winston, D.P. Comparative study of finned acrylic solar still and galvanised iron solar still. Mater. Today Proc. 2017, 4, 8323–8327. [Google Scholar] [CrossRef]
  10. Papaelias, M.; Márquez, F.P.G.; Ramirez, I.S. Concentrated solar power: Present and future. In Renewable Energies; Springer: Cham, Switzerland, 2018; pp. 51–61. [Google Scholar]
  11. Raj, S.V.; Manokar, A.M. Design and analysis of solar still. Mater. Today Proc. 2017, 4, 9179–9185. [Google Scholar]
  12. Manokar, A.M.; Winston, D.P.; Kabeel, A.; Sathyamurthy, R. Sustainable fresh water and power production by integrating pv panel in inclined solar still. J. Clean. Prod. 2018, 172, 2711–2719. [Google Scholar] [CrossRef]
  13. Jiménez, A.A.; Gómez, C.Q.; Márquez, F.P.G. Concentrated solar plants management: Big data and neural network. In Renewable Energies; Springer: Cham, Switzerland, 2018; pp. 63–81. [Google Scholar]
  14. Arunkumar, T.; Velraj, R.; Denkenberger, D.C.; Sathyamurthy, R.; Kumar, K.V.; Ahsan, A. Productivity enhancements of compound parabolic concentrator tubular solar stills. Renew. Energy 2016, 88, 391–400. [Google Scholar] [CrossRef]
  15. Chang, Z.; Zheng, Y.; Chen, Z.; Zheng, H.; Zhao, M.; Su, Y.; Mao, J. Performance analysis and experimental comparison of three operational modes of a triple-effect vertical concentric tubular solar desalination device. Desalination 2015, 375, 10–20. [Google Scholar] [CrossRef]
  16. Elashmawy, M. An experimental investigation of a parabolic concentrator solar tracking system integrated with a tubular solar still. Desalination 2017, 411, 1–8. [Google Scholar] [CrossRef]
  17. Elshamy, S.M.; El-Said, E.M. Comparative study based on thermal, exergetic and economic analyses of a tubular solar still with semi-circular corrugated absorber. J. Clean. Prod. 2018, 195, 328–339. [Google Scholar] [CrossRef]
  18. Hou, J.; Yang, J.; Chang, Z.; Zheng, H.; Su, Y. Effect of different carrier gases on productivity enhancement of a novel multi-effect vertical concentric tubular solar brackish water desalination device. Desalination 2018, 432, 72–80. [Google Scholar] [CrossRef]
  19. Hou, J.; Yang, J.; Chang, Z.; Zheng, H.; Su, Y. The mass transfer coefficient assessment and productivity enhancement of a vertical tubular solar brackish water still. Appl. Therm. Eng. 2018, 128, 1446–1455. [Google Scholar] [CrossRef]
  20. Rahbar, N.; Asadi, A.; Fotouhi-Bafghi, E. Performance evaluation of two solar stills of different geometries: Tubular versus triangular: Experimental study, numerical simulation, and second law analysis. Desalination 2018, 443, 44–55. [Google Scholar] [CrossRef]
  21. Xie, G.; Sun, L.; Yan, T.; Tang, J.; Bao, J.; Du, M. Model development and experimental verification for tubular solar still operating under vacuum condition. Energy 2018, 157, 115–130. [Google Scholar] [CrossRef]
  22. Al-Hamadani, A.A.; Shukla, S.K. Experimental investigation and thermodynamic performance analysis of a solar distillation system with pcm storage: Energy and exergy analysis. Distrib. Gener. Altern. Energy J. 2014, 29, 7–24. [Google Scholar] [CrossRef]
  23. Ansari, O.; Asbik, M.; Bah, A.; Arbaoui, A.; Khmou, A. Desalination of the brackish water using a passive solar still with a heat energy storage system. Desalination 2013, 324, 10–20. [Google Scholar] [CrossRef]
  24. Asbik, M.; Ansari, O.; Bah, A.; Zari, N.; Mimet, A.; El-Ghetany, H. Exergy analysis of solar desalination still combined with heat storage system using phase change material (pcm). Desalination 2016, 381, 26–37. [Google Scholar] [CrossRef]
  25. El-Sebaii, A.; Al-Ghamdi, A.; Al-Hazmi, F.; Faidah, A.S. Thermal performance of a single basin solar still with pcm as a storage medium. Appl. Energy 2009, 86, 1187–1195. [Google Scholar] [CrossRef]
  26. Kabeel, A.; Abdelgaied, M. Improving the performance of solar still by using pcm as a thermal storage medium under egyptian conditions. Desalination 2016, 383, 22–28. [Google Scholar] [CrossRef]
  27. Kabeel, A.; Abdelgaied, M.; Mahgoub, M. The performance of a modified solar still using hot air injection and pcm. Desalination 2016, 379, 102–107. [Google Scholar] [CrossRef]
  28. Mousa, H.; Gujarathi, A.M. Modeling and analysis the productivity of solar desalination units with phase change materials. Renew. Energy 2016, 95, 225–232. [Google Scholar] [CrossRef]
  29. Shalaby, S.; El-Bialy, E.; El-Sebaii, A. An experimental investigation of a v-corrugated absorber single-basin solar still using pcm. Desalination 2016, 398, 247–255. [Google Scholar] [CrossRef]
  30. Rufuss, D.D.W.; Suganthi, L.; Iniyan, S.; Davies, P. Effects of nanoparticle-enhanced phase change material (npcm) on solar still productivity. J. Clean. Prod. 2018, 192, 9–29. [Google Scholar] [CrossRef]
  31. Arunkumar, T.; Jayaprakash, R.; Ahsan, A.; Denkenberger, D.; Okundamiya, M. Effect of water and air flow on concentric tubular solar water desalting system. Appl. Energy 2013, 103, 109–115. [Google Scholar] [CrossRef]
  32. Chen, Z.; Yao, Y.; Zheng, Z.; Zheng, H.; Yang, Y.; Chen, G. Analysis of the characteristics of heat and mass transfer of a three-effect tubular solar still and experimental research. Desalination 2013, 330, 42–48. [Google Scholar] [CrossRef]
  33. Manokar, A.M.; Vimala, M.; Winston, D.P.; Sathyamurthy, R.; Kabeel, A. Effect of insulation on energy and exergy effectiveness of a solar photovoltaic panel incorporated inclined solar still—An experimental investigation. In Solar Desalination Technology; Springer: Singapore, 2019; pp. 275–292. [Google Scholar]
  34. Sasikumar, C.; Manokar, A.M.; Vimala, M.; Winston, D.P.; Kabeel, A.; Sathyamurthy, R.; Chamkha, A.J. Experimental studies on passive inclined solar panel absorber solar still. J. Therm. Anal. Calorim. 2020, 139, 3649–3660. [Google Scholar] [CrossRef]
  35. Muñoz, C.Q.G.; Marquez, F.P.G.; Lev, B.; Arcos, A. New pipe notch detection and location method for short distances employing ultrasonic guided waves. ActaAcust. United Acust. 2017, 103, 772–781. [Google Scholar] [CrossRef] [Green Version]
  36. Manokar, A.M.; Vimala, M.; Sathyamurthy, R.; Kabeel, A.; Winston, D.P.; Chamkha, A.J. Enhancement of potable water production from an inclined photovoltaic panel absorber solar still by integrating with flat-plate collector. Environ. Dev. Sustain. 2019, 1–23. [Google Scholar] [CrossRef]
  37. Manokar, A.M. Experimental study on effect of different mass flow rate in an inclined solar panel absorber solar still integrated with spiral tube water heater. Sesalination Water Treat. 2020, 176, 285–291. [Google Scholar] [CrossRef]
  38. Jiménez, A.A.; Muñoz, C.Q.G.; Marquez, F.P.G.; Zhang, L. Artificial Intelligence for Concentrated Solar Plant Maintenance Management, Proceedings of the Tenth International Conference on Management Science and Engineering Management, Baku, Azerbaijan, August 30–02 September 2016; Springer: Singapore, 2016; pp. 125–134. [Google Scholar]
  39. Gómez Muñoz, C.Q.; Arcos Jiménez, A.; GarcíaMárquez, F.P.; Kogia, M.; Cheng, L.; Mohimi, A.; Papaelias, M. Cracks and welds detection approach in solar receiver tubes employing electromagnetic acoustic transducers. Struct. Health Monit. 2018, 17, 1046–1055. [Google Scholar] [CrossRef]
  40. Tiwari, G.; Lawrence, S. New heat and mass transfer relations for a solar still. Energy Convers. Manag. 1991, 31, 201–203. [Google Scholar] [CrossRef]
  41. Tiwari, G.; Dimri, V.; Chel, A. Parametric study of an active and passive solar distillation system: Energy and exergy analysis. Desalination 2009, 242, 11–18. [Google Scholar] [CrossRef]
Figure 1. Schematic and photo of experimental setup.
Energies 13 03989 g001
Figure 2. Hourly variations in different parameters on 27 May 2019.
Energies 13 03989 g002
Figure 3. Hourly variations in different parameters on 28 May 2019.
Energies 13 03989 g003
Figure 4. Hourly variations of evaporative heat transfer coefficient (EHTC) and potable water productivity on 27 May 2019.
Energies 13 03989 g004
Figure 5. Hourly variations of EHTC and potable water productivity on 28 May 2019.
Energies 13 03989 g005
Figure 6. Hourly variations of Phase Change Material (PCM), Nano Phase Change Material (NPCM)temperatures and improvement in temperature of NPCM.
Energies 13 03989 g006
Figure 7. Hourly variations of thermal efficiency.
Energies 13 03989 g007
Figure 8. Hourly variations of exergy efficiency.
Energies 13 03989 g008
Table 1. Uncertainty and range of instruments.
S. No.EquipmentMakeUncertaintyRange
1.Solar power meterTES-132±3.56%0–2500 W/m2
2.ThermocoupleJ-Type±1.57%0–400 °C
3.Calibrated flask±1.58%0–3000 mL
Table 2. Percentage increase in yield, energy and exergy efficiency of the Tubular Solar Still(TSS).
S.noDateType of Solar Still Yield (kg)Energy Efficiency (%)Exergy Efficiency (%)
Actual% IncreaseActual% IncreaseActual% Increase
127.05.2019CTSS4.37Ref31.53Ref1.67Ref
TSS-PCM6.0738.9046.1146.202.2031.73
TSS-NPCM7.9181.0058.9787.023.75124.55
228.05.2019CTSS4.14Ref29.12Ref1.55Ref
TSS-PCM5.8942.2745.1354.971.9525.80
TSS-NPCM7.5181.4056.1092.653.48124.51
Table 3. Relative studies between the productivity of various stills with PCM.
S. NoAuthor NameExperimental Work DoneYield (kg/m2)% Improvement in Yield Compared to the Conventional Models
1Al-Hamadani and Shukla [22]Study of solar distillation system with PCM 1480 mL/m2h-
2Ansari et al. [23]Desalination with solar still incorporated with energy storage system._-
3Asbik et al. [24]Solar still combined with PCM _-
4El-Sebaii et al. [25]Thermal performance of single basin still with PCM9.005 kg/m2day85.3
5Kabeel and Abdelgaied [26]Performance analysis of solar still using PCM7.54 L/m2day67.18
6Kabeel et al. [27]Analysis of modified solar still with hot air injection and PCM9.36 L/m2day108
7Mousaand Gujarathi [28]Productivity analysis of solar desalination units using PCM2.1 L/day49
8Shalaby et al. [29]V-corrugated absorber single basin solar still using PCM0.558 kg/m2h12
9Rufuss et al. [30]Productivity analysis of solar still with NPCM5.28 L/m2/day43.2
10Thalib et al. (present study)Operational performances of TSS with PCM 6 kg/day38.9
11Thalib et al. (present study)Operational performances of TSS with NPCM 7.9 kg/day81

