Abstract
This article focuses on addressing the data aggregation faults caused by the Phasor Measuring Unit (PMU) by installing Wireless Sensor Networks (WSN) in the grid. All data that is monitored by PMU should be sent to the base station for further action. But the data that is sent from PMU does not reach the main server properly in many situations. To avoid this situation, a sensor-based technology has been introduced in the proposed method for sensing the values that are monitored by PMU. Also, the basic parameters that are necessary for determining optimal solutions like energy consumption, distance and cost have been calculated for wireless sensors, whereas, for PMU optimal placements with cost analysis have been restrained. For analyzing and improving the accuracy of the proposed method, an effective Binary Logistic Regression (BLR) algorithm has been integrated with an objective function. The sensor will report all measured PMU values to an Online Monitoring System (OMS). To examine the effectiveness of the proposed method, the examined values are visualized in MATLAB and results prove that the proposed method using BLR is more effective than existing methods in terms of all parametric values and the much improved results have been obtained at a rate of 81.2%.
1. Introduction
In recent days, the application of Phasor Measuring Units (PMUs) and Wireless Sensor Networks (WSN) for monitoring electrical grid parameters has been observed as a developing area. For making the operation of the grid smarter and smoother, a sensing device that observes the functioning of PMU and intimates it to the Online Monitoring System (OMS) is essential. Therefore, this way of smart integration paves the way for preventing critical grid situations such as excessive loss of power consumption. Even though the global positioning system (GPS) receiver is present, it can only track the position of PMUs. In addition, all the measurements which are provided by the PMU will be transferred to the satellite and then to the control center. While transferring the parametric data, the occurrence of a fault may be present, and there is no way to detect faults such as wrong measurement data with noise. Moreover, the errors in measurement can only be controlled after detecting the type of problem that persists in PMU. This requires the help of a large amount of manpower, and immediate remedial actions cannot be taken. As a result, there might be a huge loss of energy where more blackouts can occur within a short period of time.
Therefore, the communicating PMU device requires a wireless device for supervision which will be able to detect the faults quickly and report them to the control center. In a modern trend, the wireless sensors which can sense the fault data in PMUs with less energy consumption can be integrated with PMUs for better control operations. The block diagram of the proposed method is indicated in Figure 1.
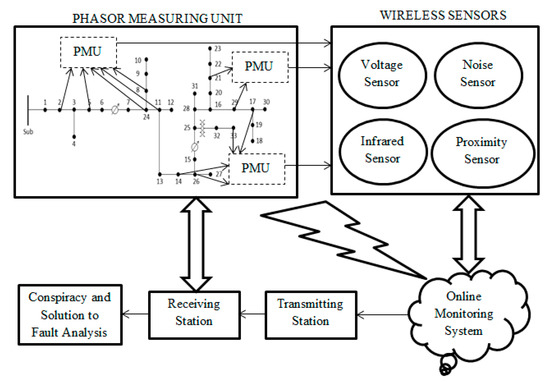
Figure 1.
Incorporation of sensors with Phasor Measuring Units (PMU) for fault detection.
1.1. Motivation of Proposed Work
The primary motivation for deliberating this research work is to monitor the level of voltage, the status of PMU in the grid and to overcome the blackouts that occur in case of PMU failure within a short period. Therefore, the communicating PMU device requires an intelligent wireless device for controlling it. The installed group of sensors will be able to detect the faults quickly and reports it to the control center. The wireless sensors which can sense the fault data in PMUs with less energy consumption can be integrated with PMUs for better control operations.
1.2. Short Review on Existing Literature
There are numerous gaps that exist in the prevailing literature [1,2,3,4,5,6,7,8,9,10,11,12] when PMUs are connected in grid. In the following literature, all of the authors have installed PMU for monitoring the grid but fail to detect any of the important parameters. In many cases, the existing literature lacks discussion on the installation of sensors in the grid for making it smart, although the importance of placing sensors in the grid has been analyzed by several researchers where the framework consists of placement of PMUs at suitable locations for achieving full observability [1].
1.3. Research Gap and Motivation
All the existing literature has not provided any discussion related to the implementation of an additional communication device for monitoring the status of PMU, which includes parameters like energy consumption, voltage, and angle measurements. Also, no researchers have examined the detection of data faults in PMU, which provides necessary voltage values for operating the electric grids. Therefore, to overcome the drawbacks mentioned above, a sensor device has been integrated with all optimal PMUs that are installed in the grid. The sensor builds the gap (Table 1) by monitoring and reporting the status and fault information of PMU to the receiver (OMS). This will make the work station take remedial actions for preventing driving under emergencies, thus making the grid smart.

Table 1.
Significant contributions associated with the proposed method.
1.4. Outline of Article
The remaining sections of the article is organized as follows: Section 2 describes a brief literature review where the fundamentals of the proposed work is designed. Section 3 formulates the proposed model on PMU with sensors. Section 4 integrates the optimization algorithm with proposed formulations. Section 5 validates the efficiency and parametric values of the projected method and finally, Section 6 concludes the research discussion with discussion on future revisions to be made.
2. Literature Survey
The importance of placing sensors in the grid has been analyzed by several researchers where the framework consists of placement of PMUs at suitable locations for achieving full observability [1]. Since there is a usage of traditional transformers across different areas around the world, a sensor must be needed for acquiring signals at the destination. Also, the control mechanisms in PMU are possible only when an accurate sensor is installed on the grid [1]. However, the major drawback in [1] is that only the placement locations of PMU are calculated where there is a possibility to replace the traditional transformer. Still, the same operation of the transformer has been performed in a digitalized way. Now, from the digital outcomes, which are indicated in [1], a challenging task on testing the bad data has been performed [2]. In this testing, the variation of data error is also detected and controlled by using a Kalman filter. The procedure starts by analyzing the previous state of PMU, which is under observation and compares it with the currently updated value where the PMU remains in a fully observable state. Even though this method produces less data error, it can only be applicable if there is any change in the voltage magnitude [2], and the sensor development procedure is not integrated into the place where voltage change occurs.
An optimal approach for wide-area systems has been developed [3] at a later phase for analyzing the impact of communication infrastructure that is integrated with PMU. In this case, the importance of communication infrastructure in the grid has been well-defined by using a genetic algorithm. This method uses a high number of sensor nodes where the cost of sensor placement will be much higher than traditional methods [3]. The method described in [3] for achieving complete observability is not possible in all situations because, in real-time, a mesh network cannot be formed under different situations. This limitation has been solved by using a phase-detection model [4] where the data attack procedure is evaluated using the Global Positioning System (GPS). Here, the clock precision error is also calculated, and the potential risk of placing the PMU data using time synchronization standard is observed [4]. But, even though the method provides a solution to data attack methods, a detailed procedure of sensor integration with important parametric analysis like less energy consumption of nodes, proper data aggregation has not been described [4]. If the data is aggregated correctly, then there is no need to detect the phase of PMUs.
An image acquisition-based sensor visionary system has been developed [5] for real-time monitoring of grids. In this method, a line detection method has been developed where the three-dimensional image of the damaged line in a particular area will be identified. Therefore, once the image arrives at the receiver, the appropriate necessary actions will be taken. This method involves a high cost of computation, and there is a discussion-based in smart meter investigation [5]. Still, the sensors are not integrated with the PMU-based rectification system. Also, the power failures can be easily identified by the developed method [5], where a cloud storage system has been built. However, these methods will require manpower, and there is no proficiency in automatic rescue operation [5] if large scale systems are integrated. For solving the drawback mentioned above, a virtual method of PMU analysis has been carried out [6]. In this method, traffic will be generated where each region will be divided into different zones. A latency test with a communication overlay has been designed for locally generated data. Also, an online monitoring system using Google application engines has been integrated for data aggregation. However, in the outcome analysis, the only percent of power-saving with bandwidth has been discussed, and there is no clear information whether the distance covered by the communication device in the zonal areas are higher or lesser [6].
The method mentioned above [6] has been simplified using software-defined networks [7] for making the communication much easier through the channel. Since the demand for electricity increases day-by-day, the requirement for monitoring the individual grid using network software has also been increased. If the software-defined networks are used then, the automatic control process can be easily completed [7]. This paves the way for creating sensor-based technological solutions in analyzing the network grid. However, there is no practical information regarding control information and parametric monitoring of PMU when it is placed in different areas of grid networks [7]. The usage of multiple sensors in the grid paves the way for monitoring different parameters, which even includes the temperature and humidity of PMU [8]. This has been indicated as a power management unit, which in turn gives rise to energy harvesting systems. In this method, a battery and automated power platform have been designed for cost-efficient implementation [8]. It is observed that in this method, the only microcontroller has been used for effective operation with transmitting and receiving antennas. The usage of both microcontrollers and multiple sensors will increase cost, and thus the energy consumption of each node will be much higher [8].
A survey has been showing [9] on the generalization of PMU with reliable models where the procedure for data uncertainty, fault analysis in the grid has been discussed. The authors describe that for reliability evaluation methods such as Markov based models can be integrated, but the application of PMU has been advanced in different areas, and the only solution to overcome the defects in PMU is by integrating real-time communication equipment, which identifies fault even in remote locations [9]. While designing the sensor technologies for integration with PMU, the standards suggested by IEEE C37.118 should always be followed [10]. The merging unit for interoperability test has been suggested where the signal identification and transmission test has been showing, which are kept as per the standards of IEEE. This is followed while placing the PMUs at desired locations. However, the sensors can be integrated as per the requirement by considering the optimal placement of PMUs [10].
Further, the sensors should be feasible for integrating with PMUs [11], and the feasibility solutions have been described by using cloud-based networks. The process has been executed by considering synchrophasor systems, and a high standard of encryption is also provided for ensuring the safe process of data transfer [11]. Even though the best security solutions are provided in [11], only the data security cost has been analyzed without any discussion regarding the implementation cost. Finally, a discussion on self-healing smart grids has been offered [12] with different emerging techniques where network communication with middleware solutions has been provided. To date, the aforementioned existing methods are the only available approaches for PMU integration with sensor-based networks, and all the methodologies have been analyzed for building a novel approach.
Objectives
The main objective of this study is to integrate a communicating device (Sensors) for monitoring the status and to report the fault information to the control center (OMS) that is observed by PMUs. This new flanged objective will be more efficient for building a smart grid environment by satisfying the constraints of energy consumption, range, and distance. The implementation design of the proposed objective which is formulated in Equation (7) is applied to a large-scale transmission system and small-scale distribution system.
3. Problem Formulation
Since the prime objective of the proposed method is to achieve complete communication observability in the presence of sensors, it is necessary to calculate the range covered by each individual sensor. For achieving long-distance communication, the entire area where the PMU is placed in the grid will be divided separately and will be marked as individual groups (Circles). Therefore, the maximum range will be achieved, and it can be calculated mathematically using (1).
where, represents the distance of the sensor to be maximized; and denotes the possible arrangements of PMU that are placed in the grid.
The above equation indicates that if the distance covered by the sensor is maximized then, the cost of installation will be automatically reduced, and the energy consumption of the installed nodes will be minimized as much as possible. All Equations (1)–(6) have been derived from [2,3] in a unique way where the objective function indicated in (7) has not been stated in any existing literature, which forms the novelty of the projected methodology. The possible arrangements represent the accurate connection that is provided by the sensors to the PMUs, which are denoted using (2).
where, represents the exact value of the sensors that are placed near the PMUs.
Since the range covered by sensors in the grid which are located at different regions are in circles, the exact range can be calculated by combining (1) and (2) as,
where, for precise monitoring each sensor has been divided into separate groups where PMUs are installed in the grid. There are several areas where the installed sensors have to monitor, and after monitoring the precise value it will be uploaded to OMS. This is not possible by implementing a single sensor as the range covered by PMU is much higher. Therefore, sensors are deployed as groups in the same areas where PMUs are installed. Thus, 0.47 is the exact value which is covered by each sensor in each sub-region where the PMUs are placed. Once the range covered by the sensor is maximized then, the energy consumption should be minimized. This is an important concern in the case of PMUs because the energy of PMUs is already very high. If the energy of the sensor is also higher, then it is not logical to place the sensor in different regions.
In addition, these grouped sensors will determine important parameters which include energy consumption and cost. For example, if the number of PMUs in a particular area is much lesser, the installed sensor group will also be much lesser, and, even if any additional group is installed then, it will be switched off for a particular period of time thus resulting in energy saving processes. Therefore, energy consumption can be mathematically expressed using (4). In line with the above concern, if a group of sensors are placed in one region and if any sensor fails in one particular group then there is no need for replacing the sensor. Instead, the energy supplied to other sensors in the same group will be increased for equalizing the total supplied energy and the cost of installation will be saved.
where, denotes the input voltage of both PMU and sensors as per IEEEC37.118 standard; and represents the cut off voltage of both PMU and sensors, respectively.
In the proposed work, only the voltage data of PMUs are integrated, so the energy consumption of both sensors and PMU will be determined based on the values of voltage only. Here, the maximum voltage (230V) will be converted to 5V inside the power supply module for suitable installation, and if the value is less, then cut-off voltage will be indicated. If the major parametric inputs such as distance and energy consumption are given properly, then the data can be aggregated appropriately. This is a major issue in several situations because the areas are divided into circles where the data aggregation should happen in sequence order, and it will be examined using an online monitoring system. Therefore, the data combination from different areas can be given as,
where, represents the total number of observable PMUs.
It can be seen from (5) that once the distance of the sensor is multiplied with the maximum number of observable PMUs, then the data will be sent from transmitter to receiver in sequence order, and the same will follow for large-scale systems to reduce the data similarity index. Implementation of (5) will provide the data clearly (i.e.,) the data of the first area will be obtained, and once the data is stored, then the data of the next area will be attained. This will reduce the confusion among workers, and they can easily detect the areas where the problem has occurred. Analyzing the implementation cost of the proposed method is an important constraint because here, two different communication devices are combined (PMU and sensors). Therefore, the cost should be minimized as low as possible, and it is calculated mathematically by using (6).
where, denotes the number of sensors installed for observing the features of PMU.
The objective function can be represented using (7) as,
The above equation indicates that if the distance covered by the sensor is maximized, then the cost of installation will be automatically reduced, and the energy consumption of the installed nodes will be minimized as much as possible. This objective function indicated in (7) has not been stated in any existing literature, which forms the novelty of the projected methodology.
4. Optimization Algorithm
An optimization algorithm plays a vital role in deciding the performance of the proposed methodology. Genetic algorithms are incorporated in existing literature [3] for monitoring PMU because of its natural selection process and ability to determine optimal solutions for subsequent iterations. Also, the basic setup using genetic algorithms has been followed [3], where the observability which is detected by binary values (0 or 1) will be different when genetic algorithms are introduced. In this process, unobservable PMUs will be automatically fixed thus allowing the algorithm to converge earlier. Even though the data transmission process is much higher when genetic algorithms are implemented, the same strategy cannot be followed when sensors are implemented, because sensors have unique characteristics for identifying erroneous values of PMU. Thus, the location of PMUs and the occurrence of faults are detected with binary numbers (0 or 1) by integrating a new improved Binary Logistic Regression (BLR) [13] to improve the performance of communication equipment that is implemented in the projected method. The major reason for choosing BLR is that it is one type of machine learning algorithm that exists in recent trends, and the PMU placement is a non-linear problem where the best solutions to non-linear equations will be provided only by BLR. Also, the integration of formulations with BLR has been derived from existing literatures [14,15].
For the projected method, accuracy in determining the fault that exists in PMUs through sensors is an important task; therefore, BLR is a perfect choice where the accuracy rate will be much higher when compared with other algorithms. The prediction of real value PMU using sensors will be mapped to binary values using the exponential function, which is given in (8).
where, denotes the total cost of communication device which consists of both PMU and sensors.
The equivalent proposition for (8) can be defined using a sigmoid function and is given as,
where, represents the matrix equation for all the PMUs in logistic scale.
Therefore, (8) can be modified as,
The cost function calculation of linear regression is easy to implement, and it is much similar to logistic regression. But if the cost function of linear terms is integrated, then a non-convex solution will be obtained where the major objective of minimizing the cost will result in failure. For a good communication system implementation, the cost function should be minimum, and it can be calculated using BLR as shown in Figure 2,
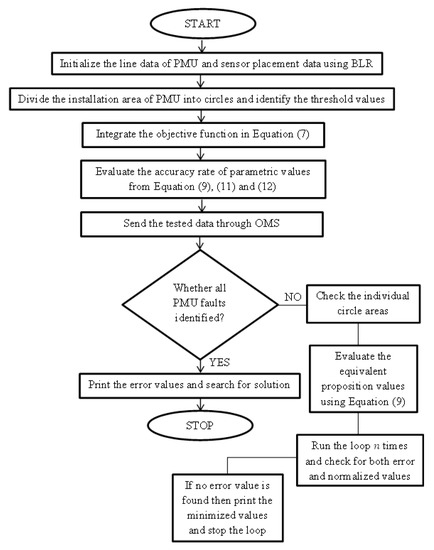
Figure 2.
Flow chart of Binary Logistic Regression (BLR).
Equation (11) indicates that, for calculating the cost of all installed PMUs in the grid, both the binary values will be taken into account; whereas, for the optimum cost of installation () only the binary value 1 will be considered. For other communication devices (Sensors), the total cost of implementation will be calculated separately, and it depends on base cost and the number of sensors installed. For each parametric calculation, the gradient descent function will be calculated, which is given in Equation (12).
where, and represents the first and second-order derivative of gradient descent function.
In (12), all the parameters to be monitored will be implemented based on their derivative function values. From (12), the entire parametric convergence rate will be calculated where BLR has converged at a faster rate when compared to other algorithms. The flow chart of proposed algorithm is shown in Figure 2.
5. Results and Discussion
In this section, the effect of integrating the proposed formulations with BLR has been elaborated. It is necessary to analyze the impact of PMU on both transmission and distribution grids. An OMS will monitor all the updated status of PMU, which is provided by sensors. For better understanding, the OMS provides the simulation results in MATLAB for a specific time period. Therefore, to check the efficiency of the projected method, the following case studies are performed.
- Case 1: Effect of energy consumption
- Case 2: Maximization of range
- Case 3: Minimization of cost
For each of the test cases, the following two test systems are taken under consideration (i.e.,); for transmission systems, a large-scale IEEE 118 bus [14] has been examined. For the distribution system, an IEEE 33 node [15] has been tested. All the test systems consist of only voltage measurements which are obtained from line data for detecting the occurrence of a fault in PMU, and the sensor will report the faults to the control center.
5.1. Case 1
In this case, the energy consumption of sensors that are integrated with PMU has been analyzed. It is essential that the communication devices should always provide low energy with enhanced performance. Particularly, for the case of PMU, it is very important because the energy consumed by PMU in the grid will be much higher. So, if there is a need for another communication device, then the energy acquired by the device should be as low as possible. Therefore, in this important case, it is necessary to minimize the energy consumption of nodes and is calculated using (4). Since voltage measurements are considered, the sensor will make use of the degenerated voltage measurements for accurate calculations. The power supply will be converted suitably to 5V for integrating the sensors with PMU.
The simulation result of the test systems for this case has been projected in Figure 3. It can be observed that the data transfer rate of PMU and sensor is much higher, which always varies between 100 to 500 Mbps. Even for much higher data rates, the energy consumption of the sensor is minimized. For example, in the IEEE 118 bus system (Figure 3a), if the transfer rate is 300 Mbps, then the corresponding energy consumed by the nodes in the proposed BLR will be 76 mW. In contrast, for the existing method [3] (GA), it is 89 mW. Similarly, for the IEEE 33 node system (Figure 3b), if the transfer rate is 400 Mbps, then the energy consumed by the nodes for the proposed system (BLR) will be 27 mW. But, for the same data transfer rate, the energy consumed by GA [3] is 42 mW. This proves that BLR is much more efficient than existing systems, and it consumes less energy for both transmission and distribution systems.
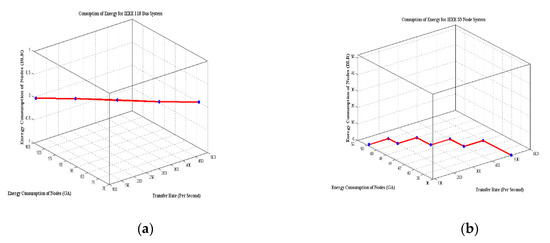
Figure 3.
Energy consumption of test systems: (a) IEEE 118 bus and (b) IEEE 33 node.
5.2. Case 2
In this case, the fundamental parameter, which is the most important for all sensor integrations in the grid called a range of data measurement, is examined. It is always necessary that the distance covered by a distinct sensor should always be wider. Already, the communicating PMU device will provide a wide range of data measurements where the installed sensors should be able to cover the wide-ranging distance of PMUs. If this constraint is satisfied, then it is possible to measure all the data faults that are measured by PMU within a short interval of time.
The sensor should be calibrated in such a way that it should maximize the distance; therefore, in the proposed method for security protections, the regions covered by PMUs are divided into different zones (Circles). Therefore, accurate distant sensors can be placed for measuring the data of PMUs, and it will be updated in the OMS. Figure 4 shows the distance covered by sensors in both transmission and distribution test systems. It can be seen from Figure 4 that the distance covered by the proposed BLR is much higher than the existing GA method [3]. For example, in the IEEE 118 bus system, the number of PMUs for achieving full observability is 68, and the maximum distance covered by a distinct sensor in a particular area is around 11.36 km, whereas, for the same test system, the distance covered by GA is only 6.8 km. Similarly, for the IEEE 33 node, the number of optimal PMUs will be 11, and the appropriate distance covered by the sensor is 2.1 km. But, with the same number of PMUs, the GA method covers only 1.5 km per area, which are divided into circles.
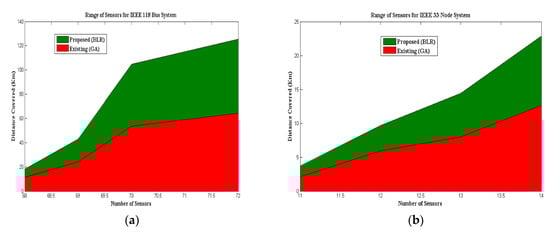
Figure 4.
Distance covered by sensors for test systems: (a) IEEE 118 bus; and (b) IEEE 33 node.
5.3. Case 3
After achieving maximum distance, the next case study relies on the calculation of the cost of installed sensors and PMUs from Equation (6). In the proposed method, two communicating devices are installed; therefore, the cost for both sensors and PMU should be minimized. For each area, the required maximum number of sensors should be integrated for proper data aggregation. Also, if it is possible, two additional low-cost sensors can be added in the area because sometimes there might be a failure in the data detection operation of sensors. If this case persists, the additional sensors can be switched on immediately. The base cost of PMU and sensor is about 3046200 and 11421.56 INR, respectively [16,17]. Figure 5 shows the maximum number of sensors necessary for monitoring the optimal PMUs with the equivalent installation cost.
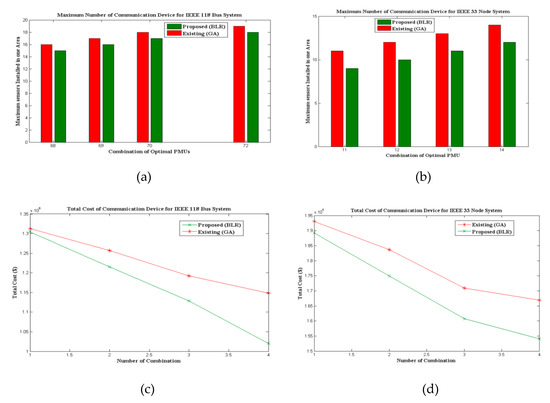
Figure 5.
Concentrated installation and cost of communication devices for IEEE 118 bus and IEEE 33 node systems.
From Figure 5, it can be realized that, for the proposed BLR implementation in IEEE 118 bus and IEEE 33 node systems, the maximum number of sensors in a specific area is 15 (Figure 5a) and 9 (Figure 5b), respectively. But for the existing GA [3], the number of sensors in a distinct area for IEEE 118 bus and IEEE 33 node systems is 16 and 11, respectively. Similarly, the equivalent total cost of the projected method is minimized to 1019870 INR for IEEE 118 bus system (Figure 5c), and for IEEE 33 nodes, the cost of implementation is around 154069 INR (Figure 5d). The total cost of communication device placement is compared with GA [3] for both IEEE 118 bus and IEEE 33 node systems, which affords nearly 1147912 INR and 166890 INR, respectively. This comparison statement proves that BLR is a cost-effective method when compared with other methodologies.
6. Conclusions
In this article, a new flanged method of detecting the data fault error in PMU by sensors has been addressed with the minimization of installation cost and energy consumption. Typically, PMU is a communicating device which measures the voltage magnitude and phase angle of all the corresponding buses. This is an important measurement relative to the grids because the voltage plays a major role in the supply of electricity. If there is any failure that is associated with PMUs, then it requires a large amount of manpower for resolving it. Therefore, an automated measuring device is necessary for monitoring the PMUs, which is provided by integrating the wireless sensors. Also, the basic parametric values such as maximum distance with minimization of cost and energy are also fulfilled by the proposed methodology by integrating BLR with OMS. Further, it is important to test the efficiency of the proposed method; therefore, the proposed arrangement has been applied for both transmission (IEEE 118 bus) and distribution systems (IEEE 33 node), and the results prove to be more effective when compared with the GA method.
Directions for Future Work
The proposed work on PMU with sensors can be extended to large-scale and practical real-time systems for observing the complete outcome of grids. Even the extension work on large-scale systems should be introduced for monitoring wide areas. The main challenge for incorporating this future work resides on placing the group of sensors and dividing them appropriately at areas where PMUs are going to be installed.
Author Contributions
Conceptualization, and methodology, H.M.; software, Y.T.; validation, R.K.; formal analysis, S.N.; investigation, H.R.B.; data curation, I.K.; writing—original draft preparation, H.M.; writing—review and editing, Y.T.; visualization, R.K. All authors have read and agreed to the published version of the manuscript.
Funding
This research received no external funding.
Conflicts of Interest
The authors declare no conflict of interest.
References
- Yao, W.; Wells, D.; King, D.; Herron, A.; King, T.; Liu, Y. Utilization of optical sensors for phasor measurement units. Electr. Power Syst. Res. 2018, 156, 12–14. [Google Scholar] [CrossRef]
- Paudel, S.; Smith, P.; Zseby, T. Stealthy attacks on smart grid PMU state estimation. ACM Int. Conf. Proceeding Ser. 2018, 2018, 1–10. [Google Scholar]
- Bashian, A.; Assili, M.; Anvari-Moghaddam, A.; Catalão, J.P.S. Optimal design of a wide area measurement system using hybrid wireless sensors and phasor measurement units. Electronics 2019, 8, 1085. [Google Scholar] [CrossRef]
- Akkaya, I.; Lee, E.A.; Derler, P. Model-based evaluation of GPS spoofing attacks on power grid sensors. In Proceedings of the 2013 Workshop on Modeling and Simulation of Cyber-Physical Energy Systems (MSCPES), Berkeley, CA, USA, 20–20 May 2013. [Google Scholar]
- Subair, S.; Sanjeev, J.; Durga, M.S. Application of Phasor Measurement Units and Internet of Things for Real Time Monitoring of Smart Grid Using 3d Imagery. IOSR J. Eng. 2018, 2018, 84–87. [Google Scholar]
- Meloni, A.; Pegoraro, P.A.; Atzori, L.; Sulis, S. An IoT architecture for wide area measurement systems: A virtualized PMU based approach. In Proceedings of the 2016 IEEE International Energy Conference (ENERGYCON), Leuven, Belgium, 4–8 April 2016. [Google Scholar]
- Rehmani, M.H.; Davy, A.; Jennings, B.; Assi, C. Software Defined Networks-Based Smart Grid Communication: A Comprehensive Survey. IEEE Commun. Surv. Tutor. 2019, 21, 2637–2670. [Google Scholar] [CrossRef]
- Bellier, P.; Laurent, P.; Stoukatch, S.; Dupont, F.; Joris, L.; Kraft, M. Autonomous micro-platform for multisensors with an advanced power management unit (PMU). J. Sens. Sens. Syst. 2018, 7, 299–308. [Google Scholar] [CrossRef]
- Mohanta, D.K.; Murthy, C.; Sinha Roy, D. A Brief Review of Phasor Measurement Units as Sensors for Smart Grid. Electr. Power Components Syst. 2016, 44, 411–425. [Google Scholar] [CrossRef]
- Song, E.Y.; Fitzpatrick, G.J.; Lee, K.B. Smart Sensors and Standard-Based Interoperability in Smart Grids. IEEE Sens. J. 2017, 17, 7723–7730. [Google Scholar] [CrossRef] [PubMed]
- Coppolino, L.; D’Antonio, S.; Mazzeo, G.; Romano, L.; Sgaglione, L. An Approach for Securing Cloud-Based Wide Area Monitoring of Smart Grid Systems. Lect. Notes Data Eng. Commun. Technol. 2019, 22, 952–959. [Google Scholar]
- Xu, G.X.; Wu, Q.; Daneshmand, M.; Liu, Y.; Wang, M. A data privacy protective mechanism for WBAN. Wirel. Commun. Mob. Comput. 2015, 14, 421–430. [Google Scholar]
- Liu, L. Research on logistic regression algorithm of breast cancer diagnose data by machine learning. In Proceedings of the 2018 International Conference on Robots & Intelligent System (ICRIS), Changsha, China, 26–27 May 2018; pp. 157–160. [Google Scholar]
- Pasqualetti, F.; Dorfler, F.; Bullo, F. Cyber-physical security via geometric control: Distributed monitoring and malicious attacks. Proc. IEEE Conf. Decis. Control 2012, 3418–3425. [Google Scholar]
- Bahramipanah, M.; Cherkaoui, R.; Paolone, M. Decentralized voltage control of clustered active distribution network by means of energy storage systems. Electr. Power Syst. Res. 2016, 136, 370–382. [Google Scholar] [CrossRef]
- Young, M.; Silverstein, A. Factors Affecting PMU Installation Costs. In U.S. Department of Energy Office of Electricity Delivery and Energy Reliability (DOE-OE); U.S Department of Energy: Washington, DC, USA, 2014; p. 12. [Google Scholar]
- Lai, C.S.; McCulloch, M.D. Levelized cost of electricity for solar photovoltaic and electrical energy storage. Appl. Energy 2017, 190, 191–203. [Google Scholar] [CrossRef]


© 2020 by the authors. Licensee MDPI, Basel, Switzerland. This article is an open access article distributed under the terms and conditions of the Creative Commons Attribution (CC BY) license (http://creativecommons.org/licenses/by/4.0/).