Abstract
In this paper, a 15 kVA soft open point converter is presented. The converter design and manufacturing have been presented in previous papers. The aim of this paper was to show the results of the devices in a full-scale laboratory environment, Gridlab, made of four distribution LV feeders, each rated 40 A. The tests demonstrated the good dynamics of the SOP control and its usefulness in performing a suitable PQ control. They also showed an improvement in the voltage profile and in the load capacity of the overall network. In the final part of the paper, the feedback earned during the development and the test of this first prototype are presented. This feedback will benefit the team for the design of a new improved 50 kVA version.
1. Introduction
Nowadays, utility distribution grids are experiencing serious problems, such as voltage imbalance, voltage variations in the adjacent feeders, higher fault and peak currents, and inappropriate intervention of the protection. The main factor responsible for this increased number of problems can easily be found in the increase of distributed generation (DG) and electric vehicles (EVs). In order to integrate an increasing number of distributed renewable energy generation and electric vehicles into the grid, while maintaining power quality, efficiency, and reliability [1,2], modernization of the medium- and low-voltage distribution network has become mandatory. Possible ways of obtaining this modernization are to add a mesh connection to the radial feeders [3] or to use active compensation or energy storage systems [4].
The solution proposed in this paper makes use of soft (normally) open converters (in the following: “SOP”), originally proposed by Bloemink and Green [5]. The soft-open point is a power electronic device whose main purpose is to allow a meshed operation of radially operated distribution networks, i.e., open loops. An internal storage capability can also be easily added [6]. A SOP is essentially made of two (or more [7]) back-to-back (B2B) DC-AC power converters, allowing the connection of two (or more) different distribution feeders, either fed by the same or by different transformer stations.
With reference to Figure 1, an SOP device was connected at the end of two radial feeders:
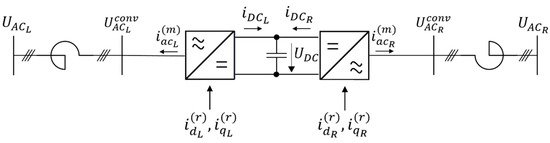
Figure 1.
SOP connecting two radial feeders (principle).
- In normal conditions, it is closed, thus establishing a meshed/loop network topology among the two feeders for load flows;
- In fault conditions, it opens, faster than mechanical breakers that remain in the distribution system, thus establishing a radial network topology for better managing fault currents.
The SOP concept is flexible, thanks to the capability of controlling real and reactive power in a customizable manner without supply interruptions. It is cost effective as an alternative solution to expensive network reinforcements. Furthermore, it increases the DER hosting capability of distribution networks and reduces curtailment requirements. Finally, it is an evolutionary solution, because it guarantees the compatibility with the preservation of existing equipment, including protection systems (power electronics converters do not contribute to the short circuit current).
In recent years, the concept of SOP has been widely analyzed in the literature, from different points of view. Several papers have been devoted to the modelling and control of SOP devices. The d,q mathematical model and the control of SOP devices was analyzed in [8], where a dual-loop local decentralized controller is proposed. A decoupled feedback linearization control of a three-port SOP was studied in [9]. An analysis of the circulating current due to feeder interconnection for a three-level SOP was studied in [10]. An SOP control for active distribution network voltage level management was proposed in [11]. An SOP EMC filter under a large unbalanced current was studied in [12].
Various optimization methods, such as particle-swarm optimization (PSO) algorithm [13], are applied for the operation of SOP in distribution networks. In [14], the authors discuss the method of calculating the optimal operating point of an SOP using the PSO algorithm. In [15], an SOP-based operation strategy for unbalanced active distribution networks is presented, in order to reduce power losses and simultaneously mitigate the three-phase unbalance of the upper-level grid.
Another important issue is related to the planning of SOP devices. The optimal allocation of soft-open points in distribution networks was studied in [16], while a strategy for distribution network reconfiguration through the designation of the optimal number, location, and size of DGs was presented in [17]. A multi-objective SOP planning methodology in an active distribution network was studied in [18].
The use of SOP in the MV distribution network has been considered by several authors. In [19], the author considers the use of medium-voltage power electronic compensation by considering modified versions of existing flexible AC transmission system (FACTS) or custom power devices. In [20], the authors propose the use of modular multilevel converters as power electronics topology for an MV SOP. A control strategy of a multi-port MMC-based SOP under steady-state operation of a distribution network is presented in [21]. In [22], an analysis of the operating areas of the MMC structure in comparison to a back-to-back structure is presented. In [23], the behavior of an MV S(N)OP device in normal and fault conditions has been analyzed. In [24], the authors proposed an optimal power flow calculation method for an unbalanced distribution network making use of a split-phase S(N)OP. The impact of advanced flexible power electronic devices, such as a PV smart inverter, and SOP on energy consumption and losses was analyzed in [25], while the application of SOP and the impact of different load shedding schemes on power restoration in a distribution network is presented in [26]. SOPs have also been proposed for improving the grid resiliency in response to outages caused by natural disasters [27,28].
However, most of these works are either conceptual or not related to actual field demonstrations. This paper takes a different and complementary approach. Here, the standpoint is to present the test results of a full-scale LV prototype, rated for 15 kVA. The design key issues of the SOP were presented in [29], and will only partially be repeated here. The tests were performed in a laboratory environment, the GridLab laboratory at the HES-SO Valais (CH). This choice allowed testing of the device under different conditions. The obvious advantage to direct deployment into a real system is that the topology cannot be changed, and faults or EMC perturbations cannot be freely introduced into the system under test. The main objective of the activity covered by this paper was to show how an SOP device can improve the voltage profile in a “close-to-the-field” distribution system.
Finally, it should be noted that we do not consider in this paper SOP based on modular multilevel converter (MMC) topologies, which are recently proposed as an alternative to the B2B 2- or 3-level voltage source converter (VSC) configuration, especially for MV applications; see [19,20,21,22,23]. See [22] for a comparison between the two structures in terms of PQ operating area.
The paper is organized as follows. Section 1 shortly introduces the SOP key idea, then a literature review is performed, and the activities presented in this paper are summarized. In Section 2, the hardware of a 15 kVA SOP prototype is described. In Section 3, the SOP studies aiming to define the scenarios for the experimental tests on the laboratory are presented. In Section 4, the laboratory tests are described and the results for different test scenarios are presented. The lessons learned from the tests are presented in Section 5, where the requirements for the development of a new 50 kVA converter for SOP applications are also highlighted. Finally, our conclusions on the laboratory test results are discussed in Section 6.
2. LV Soft-Open Point 15 kVA Prototype
2.1. SOP Hardware
The converter’s main features are: 15 kVA, 230/400 V 3-phase 2-level VSCs based on the PENELER converter [30], LCL output filters, the possibility to add battery storage via a custom DC/DC converter, and CAN and SCI communication protocol available. In Figure 2a, the principle schematic of the SOP is represented, while the SOP electrical cabinet is shown in Figure 2b. The volume of the prototype was intentionally not optimized, in order to facilitate the accessibility to the various components.
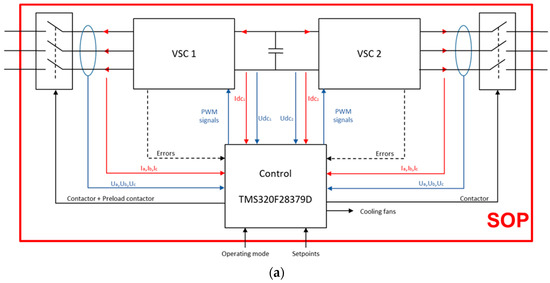
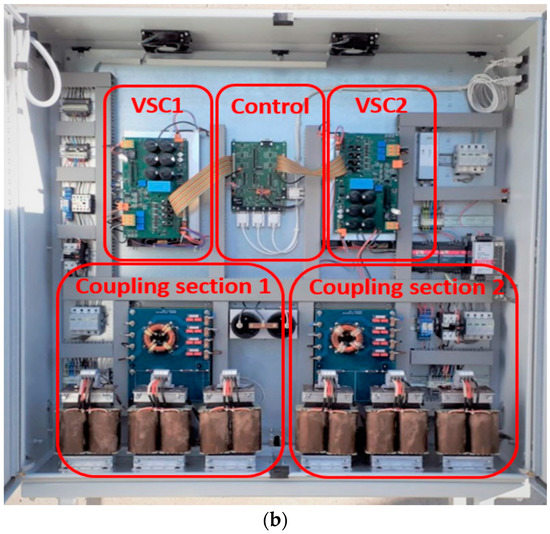
Figure 2.
(a) SOP principle, with control and measurements; (b) 15 kVA SOP prototype.
2.2. LV SOP Control Modes
Figure 3 shows the two main control modes studied for the LV SOP:
Figure 3.
LV SOP control mode definition.
- A “switch mode”: In this mode, the SOP emulates the behavior of a coupling switch. This is achieved by controlling the voltage difference between the two SOP terminals to zero and requires no external measurements, control, or optimization. This mode is best suited for stand-alone deployments of the SOP.
As an example, Figure 4 shows the phase ΔΦ and amplitude ΔU across the terminals of an LV SOP. The close command is sent after a 500-ms delay: As it can be seen, the control system brings both the magnitude and angle differences to zero in less than 500 ms.
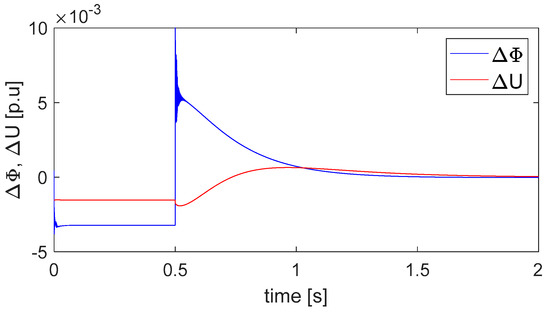
Figure 4.
Voltage magnitude (red) and angle (blue) difference between the SOP terminals’ voltages after a “close” operation in “switch mode” (simulation results).
- A PQ mode [29]: In this mode, the reference values for the active power transferred through the SOP and the reactive powers are supplied to both SOP terminals. In this mode, the reference values need to be determined by an external control/optimization system with a control objective, e.g., the minimization of transformer loadings. This is most suitable for the use of an SOP in an environment with other smart grid technology deployments.
2.3. PQ Control Strategy Principle
For the tests presented in this paper, the PQ control mode was only used.
With reference to Figure 5a, VSC1 controls the real and reactive power on its AC side. It also controls the DC link voltage at 700 V with a PI voltage controller. The output of the DC-link PI controller is added to the d current reference of the inverter 1. In Figure 5b, the control diagram of VSC2 is shown. The current references are obtained directly from the real P1* and reactive Q1*, Q2* power references. The real power reference for the two inverter is of course the same, while the reactive powers can be completely independent. The synchronization angles θ1 and θ2 are obtained with a classical PLL approach. Each inverter is synchronized on its own three-phase network. The controller implements the typical d,q decoupling strategy. The inverter output currents are measured and used in the control. In the control, the presence of an LCL filter is neglected. Due to the low value of the grid side inductance, only the inverter inductance is taken into account. The resonance effect of the LCL filter is limited with passive resistance. Both inverters make use of space vector modulation (SVM). As it is well known, this modulation strategy, with the same DC link voltage, allows an increase of the output voltage of the converter by 15.5%. However, simulations and tests showed that the SVM has the disadvantage of creating a circulating third harmonic between the two VSCs, in the case of the four-wire grid connection. To avoid the problem of circulating third harmonic currents, an isolation delta/star transformer was placed between the VSC2 of the SOP and its connection point for this version of the prototype.
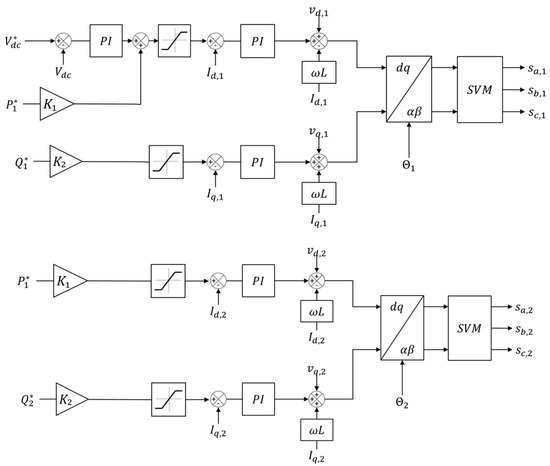
Figure 5.
(a) VSC1 control schematic (top); (b) VSC2 control schematic (bottom).
Additional information on the control of the SOP can be found in [29,30].
2.4. Functional Tests in PQ Mode
In order to verify the dynamics of the proposed control, the prototype was preliminary tested at the HEIG-VD laboratory in Yverdon-les-Bains (CH). The SOP set-points used during these preliminary tests, summarized in Table 1, are directly supplied to the power converters’ control.

Table 1.
Functional test set-points.
The test results in Figure 6 show the dynamics of the DC link control (blue trace, 250 V/div) performed by the converter VSC1, with a 200% step variation of the real power delivered by the converter VSC2 (yellow signal, 10 A/div). In green, the grid voltage (100 V/div) is shown, while the pink shows the VSC1 current (10 A/div). The SOP is connected to the school grid, which is quite distorted. As can be seen in Figure 6, the dynamic response of the current is shorter than a quarter of the period, while the DC link voltage recovers to its nominal value in about three periods.
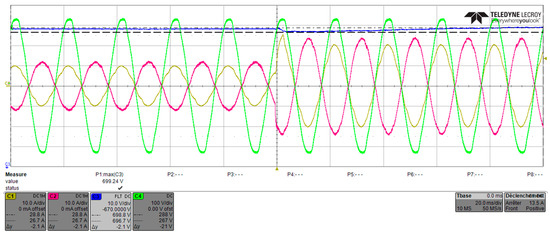
Figure 6.
Dynamics of the DC link control during a step variation of the real power.
3. LV SOP Application Studies
3.1. LV SOP Optimal Placement
The optimal placement of SOP is a sensible subject [16]. In order to determine in which type of network and at which location within these networks an SOP could be most useful, a study approach based on synthetically generated generic networks was chosen. First, generic networks were randomly built, varying the following characteristics:
- Number of MV/LV transformers;
- Number of nodes in the branches;
- Type of network: urban or rural (with larger and smaller loads);
- Type of lines: cables or overhead lines; and
- The addition of a “singularity” into the network, i.e., a large consumer or generator.
The networks include PV generators and residential consumers. Transformer, lines, and cables with the usual parameters were used. An ideal SOP was then placed at selected locations where the voltage deviations and/or load current vs. cable ampacity were the highest (several alternative placements can be compared).
An improvement score considering the average voltage deviations compared to the nominal voltage of each node as well as the loading line/cable (with higher penalties for values approaching the maximum capacity) was introduced. The scores were evaluated and compared for three combinations of load and generation (max/max, max/min and min/max) and with or without SOP. Figure 7 shows a non-geographic example of a generated network.
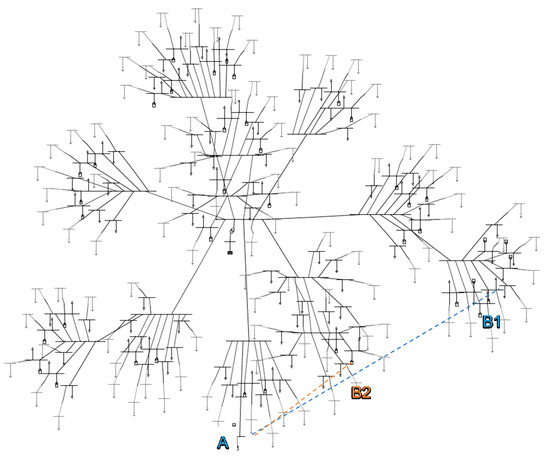
Figure 7.
Example of a generic (randomly generated) network (use case 3 in Table 2)
All elements in black are those that exist prior to the addition of an SOP into the LV network. Several positions were investigated for the addition of an SOP (in color). The best-suited solutions are inter-links between nodes A and B1 or A and B2, respectively. Figure 8 shows the resulting voltage profiles for several load/generation combinations with and without an SOP between nodes A and B2. The profiles show that extreme values of node voltages are more widely spread without an SOP than with. This illustrates how the SOP will improve the voltage criterion of our evaluation. A similar behavior can be seen for the current criterion and hence the solution has a positive improvement score. The approach can be repeated on several example networks in order to find networks and SOP locations with the largest improvement potential.
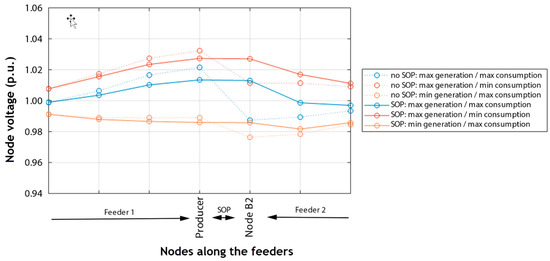
Figure 8.
Comparison of voltages under different load conditions with and without SOP (use case 3 in Table 2)
3.2. Application Study Results
Table 2 shows a comparison of different use cases that were generated and evaluated using the procedure described in the section above. The achieved improvement score gives a measure of the capability of an SOP to improve the performance of the considered distribution grid and hence its ability to host additional load or energy generation. It appears from the comparison that the presence of long or heavily loaded cables increases the beneficial contribution of the SOP. This is the case for use case 1 and use case 3 (which is used as an illustration above) especially. This kind of configuration will hence be investigated with a higher priority in further experimental steps.
Table 2.
Comparative results for the use cases (generic distribution grids).
4. Prototype Laboratory Functional Tests
The aim of these tests was to demonstrate the capacity of the SOP to transfer active power between two feeders and to achieve independent inductive or capacitive reactive power control on both feeders.
4.1. Laboratory Description
The tests were performed at the GridLab laboratory (HES-SO Valais-Wallis, CH). The GridLab “District” is made of four distribution LV feeders, each rated 40 A. A serial compensator (LVSR) [31] was used to modify the voltage at the beginning of the line. Each section between the prosumers are made of RL circuits reproducing the characteristics of the lines or cables (RL and XL on Figure 9 and Table 3).
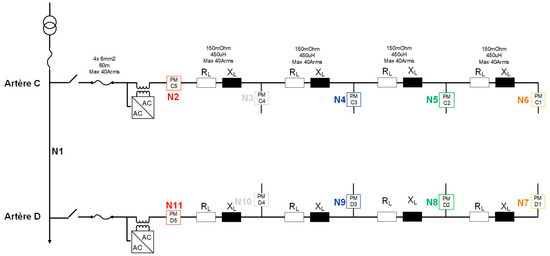
Figure 9.
Schematic of the network used for the tests.
Table 3.
Main characteristics of the GridLab network.
Emulated prosumers can be connected to these feeders. The prosumers are represented by three-phase bidirectional converters (ABB ACS 800-U). Their real and reactive power (max 15 kVA) can be remotely programmed with pre-established profiles. In order to test other equipment, two access points with 3 × 16 mm2 are available on each feeder. Protections are installed on each feeder.
The laboratory is supplied by the school grid; thus, the voltage level varies during the day, following the city-network voltage level.
For these tests, only two feeders (Figure 9 were used and inter-connected with the SOP (Figure 10). Different scenarios of consumption and injection were imposed to the prosumers on the feeders.
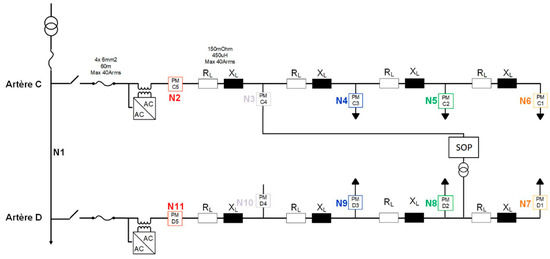
Figure 10.
C4D2 configuration, i.e., SOP connected between the point C4 on feeder 2 and point D2 on feeder D.
4.2. Test Scenarios and Configuration
The available access points are C2, C4, D2, and D4. Four different combinations with various amounts of production and injection were tested. In Figure 10, the configuration C4D2 is presented, with the isolation transformer between the feeder D and the SOP.
Two types of case studies were considered, namely the consumption on feeder C and production on feeder D (Table 4) and the consumption on both feeders (Table 5).
Table 4.
All studied cases with production and consumption.
Table 5.
All studied cases with consumption only. II.1 Same power consumed on both feeders; II.2 Different power consumed.
As already mentioned, the VSC1 controls the DC bus voltage at 700 V. This means that an active power reference can be supplied to the VSC2, connected at the feeder D. The active power circulation at the feeder C will be equal to this reference, with the addition of the VSI overall losses (see Figure 6).
In order to secure the integrity of the measures and to take into account the external perturbations on the voltage level, each test was realized during a period of 6 min, the first half without the SOP and the second with the SOP.
The setpoints for reactive power for the prosumers were at 0. However, in reality, a small reactive power is measured for each load (a few hundreds of Var), which is due to the EMC filters. Moreover, it must be highlighted that the converters emulating the prosumers have a power limitation when the voltage level at their point of common coupling exceeds the limits of its nominal range (ca. +/−11% of the 230 Vrms nominal voltage).
4.3. Tests Results
Only some of the most interesting cases will be presented here. All the results are in per-unit form, with Ibase = 40 A and Vbase = 230 V
4.3.1. First Scenario (I.1.1) Test Results and Evaluation
In this first scenario (see parameters in Table 6), there is only consumption on the feeder C, provoking a voltage drop and production on the feeder D, which causes the voltage to exceed the limit only by a little.
Table 6.
Setpoints for the first scenario (all power in kW and KVAR).
In this situation, the converter at point D1 will not limit its power injection. The key idea is to use the SOP to transmit active power between both feeders, in order to limit the voltage variations. As it can be seen in Figure 11, the SOP helps to maintain the voltage level within acceptable limits. It can be noticed in Table 7, that the current on both feeders is reduced by the action of the SOP. This would not be the case with the commonly used Volt-VAr compensation.
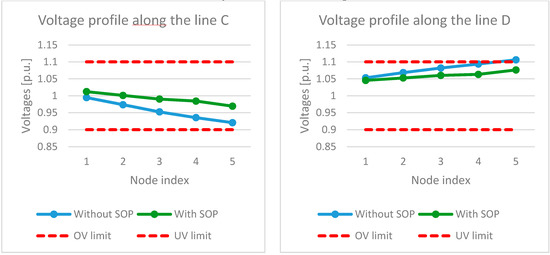
Figure 11.
Voltages (p.u.) on feeder C (left) and feeder D (right) for the first scenario.
Table 7.
Currents (in p.u.) at the beginning of the feeders for the first scenario.
4.3.2. Second Scenario (II.2.1 and II.2.2) Tests and Evaluation
For the second scenario (parameters shown in Table 8) both feeders have only consumption, but the feeder D is more loaded than the feeder C.
Table 8.
Setpoints for the second scenario (all power in kW and KVAR).
The SOP is used to balance the loads on both lines (case with SOP {1}) and to raise the voltage level by injecting reactive power (case with SOP {2}).
Figure 12 shows that balancing the loads between both lines increases the voltage level on the feeder D while it decreases it on the feeder C. Since the upstream cable is much more resistive than inductive, the effect of the reactive power is not as strong as it would be on a MV grid with the same p.u. voltage and current values. Finally, the currents in the first section of the feeders for the second scenario is reported in Table 9.
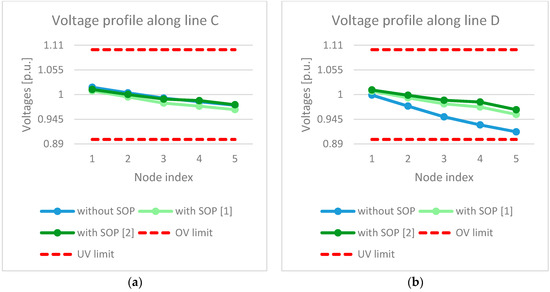
Figure 12.
(a) Voltages on feeder C and (b) feeder D for the second scenario. All values are in p.u.
Table 9.
Currents in the first section of the feeders for the second scenario.
4.3.3. Power Source (Prosumers) Voltage Limitation
As the input voltage of the laboratory grid is uncontrolled, some of the tests resulted in unpredicted over voltages (roughly +11% of the nominal value), which in turn resulted in a limitation of the power injected by the “prosumers”.
In some cases, the action of the SOP can be seen not only on the voltage level but also on the maximal power injection level. In Figure 13, it can be seen that without the SOP, the voltage at the last point of the feeder (D1) is above the +10% limit and the power injected is limited to below 8 kW by the prosumer converter itself. The SOP helps to keep the voltage within the limits and thus the converter at point D1 can inject up to 10 kW.
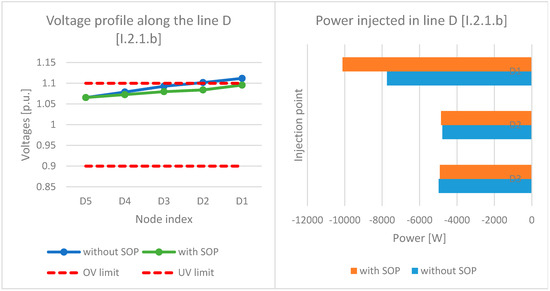
Figure 13.
Voltage profile (left) and injected power (right) on feeder D for the test case I.2.1.b. All values are in p.u.
5. Lesson Learned and Future Developments
Thanks to the good results of the first prototype, a second prototype, to be installed on a real site, is under development.
- The test results demonstrated that the SOP can actually perform the foreseen improvement in two adjacent feeders’ voltage profiles.
- However, as far as the real and reactive power references’ generation are concerned, the tests were made in an open loop. This is an essential part of the controller that needs to be developed to obtain a useful SOP device.
- Another important issue that emerged during the tests is the management of the neutral connection, especially in non-balanced grid conditions.
- In order to have the SOP converter working in unbalanced conditions, an improved PLL strategy will be implemented, together with performance of the current control in the a,b,c frame with a resonant controller (which can react to reverse sequence components), instead of d,q PI controllers (which can act only on direct sequence components).
- The neutral will be connected to the split DC-link through a suitable inductance. The two half-DC links will be controlled by a fourth IGBT leg [32].
- For the 50 kVA prototype, a passive resistive dumping solution will not be acceptable, due to the losses that this solution will create. A suitable active damping solution will be implemented.
- The new prototype will also be able to perform voltage control (i.e., grid-forming capabilities), and the DC-link control can be alternatively performed by both inverters.
- The grid-forming capability will be added to the VSCs.
Figure 14 shows a preliminary version of the design for this new SOP, while Table 10 summarizes the main differences between the first prototype and the new one.
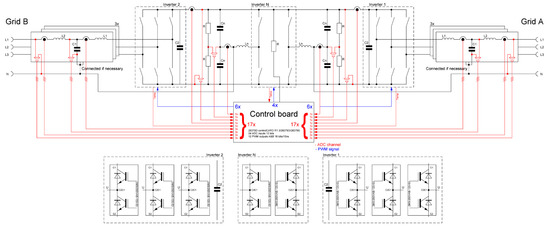
Figure 14.
Principle schematic of the 50 kVA LV SOP.
Table 10.
Comparison between the 15 kVA and the new 50 kVA prototypes.
6. Conclusions
In this paper, the laboratory tests of a 15 kVA LV SOP prototype were presented. The tests of the SOP were performed in the GridLab (Sion, CH) laboratory environment. Two types of case studies (scenarios) were applied and four different combinations with various amounts of production and injection were tested.
In the first scenario, there was only consumption on one feeder, provoking a voltage drop, and only production on the other one, which caused the voltage to exceed the limit. The SOP was used to transmit active power between both feeders, in order to limit the voltage variations. In the second scenario, both feeders had only consumption, but one feeder was more loaded than the other one. In this case, the SOP was used to balance the loads on both feeders and to raise the voltage level by injecting reactive power.
Both scenarios confirmed the validity of the SOP solution and showed a clear improvement in the voltage profile of the involved feeders and in the load capacity of the overall network.
A series of feedback was earned on the development and testing of this prototype. A third harmonics current circulating among the feeders was put in evidence, mainly due to the SVM modulation (which adds a triangular voltage to the branch voltages’ references). The current control will be performed in the a,b,c frame with a resonant controller, instead of using PI controllers in the d,q domain, to allow independent control of each phase in case of the four-wire system. The neutral will be connected to a split DC-link through a suitable inductance. The two half-DC link will be controlled by a fourth IGBT leg. In order to have the SOP converter working in unbalanced conditions, an improved and more resilient PLL strategy will be implemented. Grid-forming capabilities will be added.
This feedback will benefit the team for the design of a new 50 kVA version. It must be highlighted that the presented tests from the real and reactive power point of view were made in an open loop, i.e., there is no central controller evaluating the references for the SOP starting from the grid current and voltage conditions. This part of the project is still under development.
Author Contributions
Conceptualization, M.B., M.C. and P.F.-P.; methodology, T.P., M.B. and M.C.; software, T.P.; validation, T.P., M.B., D.R., P.F.-P., M.C.; formal analysis, M.B., P.F.-P., M.C.; investigation, T.P., D.R.; resources, M.C.; data curation, T.P., M.B.; writing—original draft preparation, M.C.; writing—review and editing, M.B., P.F.-P., M.C.; visualization, M.B.; supervision, M.C.; project administration, P.F.-P. and M.C.; funding acquisition, P.F.-P. and M.C. All authors have read and agreed to the published version of the manuscript.
Funding
This project has been partially financed by the EOS Holding (CH). This research is part of the activities of the Swiss Centre for Competence in Energy Research on the Future Swiss Electrical Infrastructure (SCCER-FURIES), which is financially supported by the Swiss Innovation Agency (Innosuisse—SCCER program).
Acknowledgments
The authors would like to thank their colleagues who have actively contributed to the SOP project described in this paper: Mohamed Allani (HES-SO Fribourg), Enea Auberson (HES-SO Fribourg), Cédric Bernasconi (HES-SO Fribourg), Didier Blatter (HES-SO Valais), Andéol Demierre (HES-SO Fribourg), Chloé Dour (HES-SO Fribourg), Loïc Eggenschwiler (HES-SO Fribourg) and Sébastien Wasterlain (HES-SO Yverdon-les-Bains).
Conflicts of Interest
The authors declare no conflict of interest.
References
- Blanco, J.Á. How to manage the impact of distributed generation in the grid? In Proceedings of the CIRED 2012 Workshop: Integration of Renewables into the Distribution Grid, Lisbon, Portugal, 29–30 May 2012. [Google Scholar]
- Pan, A.; Tian, Y.; Zhao, H.; Yang, X.; Jin, J. Power quality analysis of PV system of summer and winter. In Proceedings of the CIRED 2012 Workshop: Integration of Renewables into the Distribution Grid, Lisbon, Portugal, 29–30 May 2012. [Google Scholar]
- Hadjsaid, N.; Alvarez-Hérault, M.; Caire, R.; Raison, B.; Descloux, J.; Bienia, W. Novel architectures and operation modes of distribution network to increase DG integration. In Proceedings of the IEEE PES General Meeting, Providence, RI, USA, 25–29 July 2010. [Google Scholar]
- Omran, W.A.; Kazerani, M.; Salama, M.M.A. Investigation of Methods for Reduction of Power Fluctuations Generated from Large Grid Connected Photovoltaic Systems. IEEE Trans. Energy Convers. 2011, 26, 318–327. [Google Scholar] [CrossRef]
- Bloemink, J.M.; Green, T.C. Increasing distributed generation penetration using soft normally-open points. In Proceedings of the EEE PES General Meeting, Providence, RI, USA, 1 July 2010. [Google Scholar]
- Bloemink, J.M.; Green, T.C. Increasing photovoltaic penetration with local energy storage and soft normally-open points. In Proceedings of the IEEE Power and Energy Society General Meeting, Detroit, MI, USA, 24–28 July 2011. [Google Scholar]
- Abdelrahman, M.A.; Long, C.; Wu, J.; Jenkins, N. Optimal Operation of Multi-Terminal Soft Open Point to Increase Hosting Capacity of Distributed Generation in Medium Voltage Networks. In Proceedings of the 53rd International Universities Power Engineering Conference (UPEC), Glasgow, UK, 4–7 September 2018. [Google Scholar]
- Zhichun, Y.; Yu, S.; Fan, Y.; Yang, L.; Lei, S.; Wei, H. Study of Decentralized Coordinated Control for Soft Open Point of Active Distribution Networks. In Proceedings of the 2019 IEEE Sustainable Power and Energy Conference (iSPEC), Beijing, China, 21–23 November 2019. [Google Scholar]
- Hou, L.; Zhang, G.; Peng, B.; Yi, L.U.; Xu, F. Decoupled Feedback Linearization Control for SOP. In Proceedings of the 2019 IEEE 10th International Symposium on Power Electronics for Distributed Generation Systems (PEDG), Xi’an, China, 3–6 June 2019. [Google Scholar]
- Hou, Q.; Zheng, J.; Dai, N. Application of Soft Open Point for Flexible Interconnection of Urban Distribution Network. In Proceedings of the 2019 IEEE PES Asia-Pacific Power and Energy Engineering Conference (APPEEC), Macao, China, 1–4 December 2019. [Google Scholar]
- Hafezi, H.; Laaksonen, H. Autonomous Soft Open Point Control for Active Distribution Network Voltage Level Management. In Proceedings of the 2019 IEEE Milan PowerTech, Milan, Italy, 28 August 2019; pp. 1–6. [Google Scholar]
- Zhang, W.; Dahidah, M.; Thompson, G.; Pickert, V.; Elgendy, M. On Investigating EMC Filter Solutions in Soft Open Points Under Large Unbalanced Current. In Proceedings of the IECON 2019—45th Annual Conference of the IEEE Industrial Electronics Society, Lisbon, Portugal, 14–17 October 2019. [Google Scholar]
- Calvini, M.; Carpita, M.; Formentini, A.; Marchesoni, M. PSO-Based Self-Commissioning of Electrical Motor Drives. IEEE Trans. Ind. Electron. 2015, 62, 768–776. [Google Scholar] [CrossRef]
- Han, C.; Song, S.; Yoo, Y.; Lee, J.; Jang, G.; Yoon, M. Optimal Operation of Soft-Open Points for High Penetrated Distributed Generations on Distribution Networks. In Proceedings of the 10th International Conference on Power Electronics and ECCE Asia (ICPE 2019-ECCE Asia), Busan, Korea, 27–37 May 2019. [Google Scholar]
- Li, P.; Ji, H.; Wang, C.; Zhao, J.; Song, G.; Ding, F.; Wu, J. Optimal Operation of Soft Open Points in Active Distribution Networks Under Three-Phase Unbalanced Conditions. IEEE Trans. Smart Grid 2019, 10, 380–391. [Google Scholar] [CrossRef]
- Cong, P.; Hu, Z.; Tang, W.; Lou, C. Optimal allocation of soft open points in distribution networks based on candidate location opitimization. In Proceedings of the 8th Renewable Power Generation Conference (RPG 2019), Shanghai, China, 24–25 October 2019. [Google Scholar]
- Shafik, M.B.; Rashed, G.I.; Chen, H.; Elkadeem, M.R.; Wang, S. Reconfiguration Strategy for Active Distribution Networks with Soft Open Points. In Proceedings of the 14th IEEE Conference on Industrial Electronics and Applications (ICIEA), Xi’an, China, 19–21 June 2019. [Google Scholar]
- Zhang, S.; Zhang, L.; Li, K.; Zhang, H.; Lyu, J.; Cheng, H. Multi-objective Planning of Soft Open Point in Active Distribution Network Based on Bi-level Programming. In Proceedings of the 2019 IEEE Innovative Smart Grid Technologies, Asia (ISGT Asia), Chengdu, China, 24 May 2019; pp. 3251–3255. [Google Scholar]
- Bloemink, J.M. Distribution-Level Power Electronics: Soft Open-Points; Imperial College London: London, UK, 2013. [Google Scholar]
- Pereda, J.; Green, T.C. Direct Modular Multilevel Converter with Six Branches for Flexible Distribution Networks. IEEE Trans. Power Deliv. 2016, 31, 1728–1737. [Google Scholar] [CrossRef]
- Yang, M.; Pei, X.; Li, Y. Multi-port Coordinated Control Strategy of SOP in Distribution Network. In Proceedings of the 2020 IEEE Applied Power Electronics Conference and Exposition (APEC), New Orleans, LA, USA, 15–19 March 2020. [Google Scholar]
- Li, M.; Yang, H.; Zhao, R.; Zheng, T.; Lu, Y.; Yang, Y.; Si, C. Comparative Study on the Operating Area of M3C and B2B MMC for Soft Open Point Application. In Proceedings of the 10th International Conference on Power Electronics and ECCE Asia (ICPE 2019-ECCE Asia), Busan, Korea, 27–31 May 2019. [Google Scholar]
- Li, Y.; Pei, X.; Kang, Y.; Lu, Y.; Xu, F.; Wang, C. Voltage support strategy of SNOP under fault circumstance. In Proceedings of the 2019 IEEE Applied Power Electronics Conference and Exposition (APEC), Anaheim, CA, USA, 17–21 March 2019. [Google Scholar]
- Lei, C.; Li, C.; Wang, Q.; Wang, J.; Zhou, N. An Optimal Three-Phase Power Control Method of Distribution Network Based on Split-Phase SNOPs. In Proceedings of the 2019 IEEE Innovative Smart Grid Technologies, Asia (ISGT Asia), Chengdu, China, 21–24 May 2019; pp. 1580–1588. [Google Scholar]
- Pamshetti, V.B.; Singh, S.; Thaku, A.K.; Singh, S.P.; Bussa, V.K. Integrated Operation of Conservation Voltage Reduction and Network Reconfiguration in PV-Rich Distribution Network considering Soft Open Point Impact. In Proceedings of the 2019 IEEE Industry Applications Society Annual Meeting, Baltimore, MA, USA, 15 March 2019. [Google Scholar]
- Xie, Z.; Han, B.; Li, G.; Xu, C.; Jiang, C. Load Shedding Method of Power Restoration of Distribution Network Based on SOP. In Proceedings of the 2019 IEEE Innovative Smart Grid Technologies, Asia (ISGT Asia), Chengdu, China, 21–24 May 2019; pp. 3997–4001. [Google Scholar]
- Ding, T.; Wang, Z.; Jia, W.; Chen, B.; Chen, C.; Shahidehpour, M. Multiperiod Distribution System Restoration with Routing Repair Crews, Mobile Electric Vehicles, and Soft-Open-Point Networked Microgrids. IEEE Trans. Smart Grid 2020, 1–13. [Google Scholar] [CrossRef]
- Shen, Y.; Gu, C.; Ma, Z.; Yang, X.; Zhao, P. A Two-Stage Resilience Enhancement for Distribution Systems under Hurricane Attacks. IEEE Syst. J. 2020, 1–9. [Google Scholar] [CrossRef]
- Attanasio, F.; Wasterlain, S.; Pidancier, T.; Marchesoni, M.; Favre-Perrod, P.; Carpita, M. Low Voltage Soft Open Point with Energy Storage: System Simulation and Prototype Preliminary Test Results. In Proceedings of the 2018 International Symposium on Power Electronics, Electrical Drives, Automation and Motion (SPEEDAM), Amalfi, Italy, 20–22 June 2018; pp. 254–261. [Google Scholar]
- Wasterlein, S.; Parisod, H.; Roggo, D.; Carpita, M. EMC studies on grid integration of Distributed Energy Resources. A 10 kW, IEC-61850 compliant inverter design and preliminary test results. In Proceedings of the Power Electronics, Electrical Drives, Automation and Motion (SPEEDAM), 2016 International Symposium on, Anacapri, Italy, 22–24 June 2016. [Google Scholar]
- Germanier, A.; Roggo, D.; Biner, H.-P. Ac Line Voltage Controller for Grid Integration of Renewable Energy Sources. In Proceedings of the 7th European Conference on Power Electronics and Applications (EPE’15 ECCE-Europe), Geneva, CH, USA, 8–10 September 2015. [Google Scholar]
- Zhong, Q.; Hornik, T. H∞ current control strategy for the neutral point of a three-phase inverter. In Proceedings of the 50th IEEE Conference on Decision and Control and European Control Conference, Orlando, FL, USA, 12–15 December 2011. [Google Scholar]
© 2020 by the authors. Licensee MDPI, Basel, Switzerland. This article is an open access article distributed under the terms and conditions of the Creative Commons Attribution (CC BY) license (http://creativecommons.org/licenses/by/4.0/).