Life Cycle Assessment of Italian Electricity Scenarios to 2030


Abstract
1. Introduction
- -
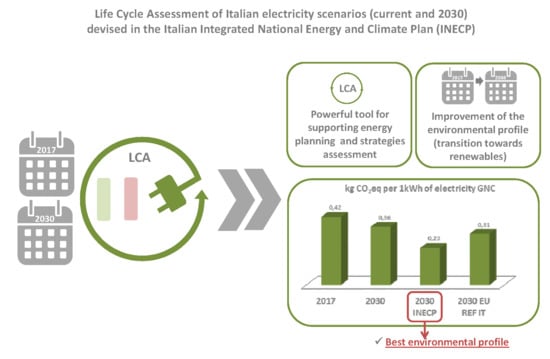
- For an effective energy transition towards a low carbon system, the reduction of greenhouse gas emissions shall occur over the entire chain of energy production and consumption. LCA allows to evaluate the potential impacts of a system/product taking into account all the processes along the entire life cycle.
- -
- LCA provides an impact assessment of the electricity scenarios not only on climate change, but taking into account a more complex environmental profile, including several environmental impact categories, in order to verify the effects of a policy on the different environmental aspects and to point out potential environmental trade-offs [4].
- -
- An in-depth LCA analysis of the current and future electricity mix is definitely relevant since energy policies promote the electrification of final energy consumptions. The detailed and updated analysis of the current and future mix can be used as a reference in other LCA studies, since the electricity production pervades the life cycle of numerous products and often represents one of the most relevant processes.
- -
- LCA results (detailed for phase and geographic location) represent the basis for monetary valuation of environmental externalities [5].
2. Materials and Methods
- -
- A mix of electricity production technologies and energy sources;
- -
- The efficiency and load factor related to the specific technology.
- -
- electricity production only (Only EL): internal combustion (CI), gas turbine (TG), condensing steam (C), combined cycle (CC), repowered (RP);
- -
- combined heat and power production (CHP): internal combustion (CIC), gas turbine (TGC), combined cycle (CCC), counter pressure steam (CPC), condensing steam with bleed (CSC).
- -
- -
- -

| Energy Source | 2016 | 2017 | 2030 Base | 2030 INECP |
|---|---|---|---|---|
| Wind | 1885 | 1822 | 2029 | 2029 |
| Photovoltaic | 1146 | 1239 | 1329 | 1329 |
- -
- natural gas import market: SNAM data (Sustainability Report and Ten-Year Development Plan) [19] were used;
- -
- oil products input market: data from the Italian Oil Association [20] were used;
- -
- CO2 emissions during operation of the thermoelectric plants: ISPRA [21] values based on IPCC [22] were used with the exception of “Other Petroleum power plants”, for which we used the values based on environmental declarations of the Italian thermoelectric plants registered to the Community eco-management and audit system—EMAS (Regulation 1221/2009) [23]. Average emission factors per unit of fuel in input (used in this study for current and future scenarios) are reported in Table 4.
- -
- NOx, SOx and PM10 emissions during operation of thermoelectric fossil power plants: a selection of data extracted from the Environmental Declaration (requested by EMAS Regulation) of Italian Thermoelectric plants were elaborated. The elaboration included 102 plants, which constitutes a sample of the Italian thermoelectric power plants. About half of the power plants were excluded from the calculation of the average emissions due to incompleteness or because they are multi-fuel plants. The sample of power plants used for the calculation of the average emissions covers from 30% (oil power plants) to about 90% (coal power plants) of the total electricity production in Italy (year 2017), depending on the type of power plants, as reported in Table 5. Average emission values are reported in Table 6.
3. Results
- -
- Climate change: main contribution comes from electricity produced by natural gas power plants.
- -
- Ozone depletion: main contribution comes from electricity produced by natural gas power plants (it is mainly related to fuel upstream phase, and in particular to the transport of gas through pipeline and to the refrigerants used in the compression stations).
- -
- Particulate matter: main contribution comes from electricity produced by natural gas power plants; in the INECP scenario it comes also from photovoltaic, due to the market for silicon wafer production. Emissions are linked to China energy mix, used for photovoltaic silicon wafer production.
- -
- Ionizing radiation: as above mentioned, main contribution comes from imported electricity.
- -
- Photochemical ozone formation: main contribution comes from electricity produced by natural gas power plants.
- -
- Acidification: in addition to natural gas power plants also the impacts relating to imported electricity and coal plants (for 2030 BASE only) should be highlighted. The impacts are substantially associated with the coal upstream (also in the case of imported electricity).
- -
- Terrestrial eutrophication and marine eutrophication: main contribution is associated to natural gas, coal power plants and import. It must be underlined also the contribution deriving from biomass power plants (this is due in part to the cultivation phase of vegetables dedicated to bioliquid production).
- -
- Freshwater eutrophication: main contribution comes from coal upstream. According to background life cycle inventory data, the impact is mainly due to coal mining operations. As concerns INECP main contribution comes from Net Import.
- -
- Mineral fossil and renewable resource depletion: main contribution comes from photovoltaic systems, due to the aluminium used for the frame and for the support structure of the modules, as well as to the metals present in the inverter.
4. Discussion and Conclusions
Author Contributions
Funding
Acknowledgments
Conflicts of Interest
Appendix A
| Source | Total % | Only EL % | CI % | TG % | C % | CC % | CHP % | CIC % | TGC % | CCC % | CPC % | CSC % |
|---|---|---|---|---|---|---|---|---|---|---|---|---|
| Coal | 10.96 | 10.91 | - | - | 10.91 | - | 0.04 | - | - | 0.04 | 0.00 | - |
| Other bituminous coal | 10.88 | 10.84 | - | - | 10.84 | - | 0.04 | - | - | 0.04 | 0.00 | - |
| Sub-bituminous coal | 0.08 | 0.08 | - | - | 0.08 | - | - | - | - | - | - | - |
| Manufactured gases | 0.86 | - | - | - | - | - | 0.86 | 0.04 | - | 0.43 | - | 0.39 |
| Coke oven gas | 0.23 | - | - | - | - | - | 0.23 | 0.01 | - | 0.12 | - | 0.11 |
| Blast furnace gas | 0.62 | - | - | - | - | - | 0.62 | 0.03 | - | 0.31 | - | 0.29 |
| Oil and petroleum products | 3.73 | 0.62 | 0.08 | 0.00 | 0.54 | 0.00 | 3.11 | 0.01 | 0.13 | 2.89 | 0.04 | 0.05 |
| Refinery gas | 0.61 | - | - | - | - | - | 0.61 | 0.01 | 0.11 | 0.41 | 0.03 | 0.04 |
| Liquefied petroleum gases | 0.01 | - | - | - | - | - | 0.01 | - | 0.00 | 0.01 | - | 0.00 |
| Gas oil and diesel oil (without biofuels) | 0.13 | 0.12 | 0.02 | - | 0.11 | - | 0.01 | - | 0.00 | 0.01 | 0.00 | 0.00 |
| Fuel oil | 0.52 | 0.47 | 0.06 | 0.00 | 0.40 | 0.00 | 0.06 | 0.00 | 0.01 | 0.04 | 0.00 | 0.00 |
| Other oil products | 2.46 | 0.03 | - | - | 0.03 | - | 2.43 | - | - | 2.43 | - | - |
| Natural gas | 38.82 | 13.84 | 0.08 | 0.11 | 0.11 | 13.55 | 24.97 | 2.50 | 1.37 | 20.66 | 0.23 | 0.21 |
| Renewables and biofuels | 33.24 | |||||||||||
| Hydro power | 13.06 | |||||||||||
| Wind power | 5.44 | |||||||||||
| Solar photovoltaic | 6.80 | |||||||||||
| Geothermal | 1.94 | |||||||||||
| Primary solid biofuels | 1.27 | 0.69 | 0.09 | - | 0.60 | - | 0.58 | 0.17 | 0.00 | - | 0.06 | 0.35 |
| Biogas | 2.54 | 0.95 | 0.93 | 0.01 | 0.00 | 0.00 | 1.60 | 1.59 | 0.00 | 0.01 | - | 0.00 |
| Renewable municipal waste | 0.74 | 0.38 | - | - | 0.38 | - | 0.37 | 0.11 | 0.00 | - | 0.04 | 0.22 |
| Other liquid biofuels | 1.45 | 1.01 | 0.34 | 0.00 | - | 0.67 | 0.43 | 0.13 | 0.00 | - | 0.05 | 0.26 |
| Non-renewable waste | 0.77 | 0.39 | - | - | 0.39 | - | 0.38 | 0.11 | 0.00 | - | 0.04 | 0.23 |
| Industrial wastes | 0.03 | 0.02 | - | - | 0.02 | - | 0.01 | 0.00 | - | - | 0.00 | 0.01 |
| Non-renewable municipal waste | 0.74 | 0.38 | - | - | 0.38 | - | 0.37 | 0.11 | 0.00 | - | 0.04 | 0.22 |
| Import net | 11.40 | |||||||||||
| other energy sources | 0.23 | |||||||||||
| Electricity GNC | 100.00 |
| Source | Total % | Only EL % | CI % | TG % | C % | CC % | CHP % | CIC % | TGC % | CCC % | CPC % | CSC % |
|---|---|---|---|---|---|---|---|---|---|---|---|---|
| Coal | 9.84 | 9.79 | - | - | 9.79 | - | 0.04 | - | - | 0.04 | 0.00 | - |
| Other bituminous coal | 9.83 | 9.79 | - | - | 9.79 | - | 0.04 | - | - | 0.04 | 0.00 | - |
| Sub-bituminous coal | 0.01 | 0.01 | - | - | 0.01 | - | - | - | - | - | - | - |
| Manufactured gases | 0.74 | - | - | - | - | - | 0.74 | 0.04 | - | 0.40 | - | 0.30 |
| Coke oven gas | 0.25 | - | - | - | - | - | 0.25 | 0.01 | - | 0.14 | - | 0.10 |
| Blast furnace gas | 0.44 | - | - | - | - | - | 0.44 | 0.02 | - | 0.24 | - | 0.18 |
| Other recovered gas | 0.05 | - | - | - | - | - | 0.05 | 0.00 | - | 0.03 | - | 0.02 |
| Oil and petroleum products | 3.47 | 0.61 | 0.07 | 0.00 | 0.54 | 0.00 | 2.87 | 0.01 | 0.13 | 2.62 | 0.03 | 0.07 |
| Refinery gas | 0.57 | - | - | - | - | - | 0.57 | 0.01 | 0.11 | 0.36 | 0.03 | 0.06 |
| Gas oil and diesel oil (without biofuels) | 0.14 | 0.12 | 0.01 | - | 0.11 | - | 0.02 | - | 0.00 | 0.01 | 0.00 | 0.00 |
| Fuel oil | 0.51 | 0.46 | 0.05 | 0.00 | 0.40 | 0.00 | 0.06 | 0.00 | 0.01 | 0.03 | 0.00 | 0.01 |
| Other oil products | 2.24 | 0.03 | - | - | 0.03 | - | 2.21 | - | - | 2.21 | - | - |
| Natural gas | 42.30 | 16.15 | 0.08 | 0.16 | 0.11 | 15.79 | 26.16 | 2.73 | 1.37 | 21.61 | 0.21 | 0.25 |
| Renewables and biofuels | 31.32 | |||||||||||
| Hydro power | 10.91 | |||||||||||
| Wind power | 5.35 | |||||||||||
| Solar photovoltaic | 7.35 | |||||||||||
| Geothermal | 1.87 | |||||||||||
| Primary solid biofuels | 1.27 | 0.66 | 0.09 | - | 0.58 | - | 0.61 | 0.17 | 0.00 | - | 0.06 | 0.37 |
| Biogas | 2.50 | 0.89 | 0.88 | 0.01 | 0.00 | 0.00 | 1.61 | 1.60 | 0.00 | 0.01 | - | 0.00 |
| Renewable municipal waste | 0.72 | 0.35 | - | - | 0.35 | - | 0.37 | 0.11 | 0.00 | - | 0.04 | 0.23 |
| Other liquid biofuels | 1.34 | 0.93 | 0.31 | 0.00 | - | 0.61 | 0.42 | 0.12 | 0.00 | - | 0.04 | 0.25 |
| Non-renewable waste | 0.75 | 0.37 | - | - | 0.37 | - | 0.38 | 0.11 | 0.00 | - | 0.04 | 0.23 |
| Industrial wastes | 0.03 | 0.02 | - | - | 0.02 | - | 0.01 | 0.00 | - | - | 0.00 | 0.01 |
| Non-renewable municipal waste | 0.72 | 0.35 | - | - | 0.35 | - | 0.37 | 0.11 | 0.00 | - | 0.04 | 0.23 |
| Import net | 11.38 | |||||||||||
| other energy sources | 0.20 | |||||||||||
| Electricity GNC | 100.00 |
| Source. | Total % | Only EL % | CI % | TG % | C % | CC % | CHP % | CIC % | TGC % | CCC % | CPC % | CSC % |
|---|---|---|---|---|---|---|---|---|---|---|---|---|
| Coal | 9.56 | 9.56 | - | - | 9.56 | - | - | - | - | - | - | - |
| Other bituminous coal | 9.56 | 9.56 | - | - | 9.56 | - | - | - | - | - | - | - |
| Manufactured gases | 0.86 | - | - | - | - | - | 0.86 | - | - | 0.86 | - | - |
| Blast furnace gas | 0.86 | - | - | - | - | - | 0.86 | - | - | 0.86 | - | - |
| Oil and petroleum products | 1.20 | - | - | - | - | - | 1.20 | - | 0.00 | 1.20 | - | - |
| Other oil products | 1.20 | - | - | - | - | - | 1.20 | - | - | 1.20 | - | - |
| Natural gas | 40.76 | 15.67 | - | - | - | 15.67 | 25.09 | 3.91 | 0.61 | 20.57 | - | - |
| Renewables and biofuels | 38.59 | |||||||||||
| Hydro power | 15.00 | |||||||||||
| Wind power | 7.38 | |||||||||||
| Solar photovoltaic | 9.95 | |||||||||||
| Geothermal | 2.07 | |||||||||||
| Primary solid biofuels | 2.10 | 1.95 | - | - | 1.95 | - | 0.15 | 0.15 | - | - | - | - |
| Biogas | 1.67 | 0.62 | 0.61 | 0.01 | 0.00 | 0.00 | 1.05 | 1.05 | 0.00 | 0.00 | - | 0.00 |
| Renewable municipal waste | 0.43 | - | - | - | - | - | 0.43 | 0.15 | 0.00 | - | 0.06 | 0.21 |
| Non-renewable waste | 0.43 | - | - | - | - | - | 0.43 | 0.15 | 0.00 | - | 0.06 | 0.21 |
| Non-renewable municipal waste | 0.43 | - | - | - | - | - | 0.43 | 0.15 | 0.00 | - | 0.06 | 0.21 |
| Import net | 8.40 | |||||||||||
| CSP | 0.20 | |||||||||||
| Electricity GNC | 100.00 |
| Source | Total % | Only EL % | CI % | TG % | C % | CC % | CHP % | CIC % | TGC % | CCC % | CPC % | CSC % |
|---|---|---|---|---|---|---|---|---|---|---|---|---|
| Manufactured gases | 0.86 | - | - | - | - | - | 0.86 | - | - | 0.86 | - | - |
| Blast furnace gas | 0.86 | - | - | - | - | - | 0.86 | - | - | 0.86 | - | - |
| Oil and petroleum products | 1.20 | - | - | - | - | - | 1.20 | - | 0.00 | 1.20 | - | - |
| Other oil products | 1.20 | - | - | - | - | - | 1.20 | - | - | 1.20 | - | - |
| Natural gas | 34.15 | 2.31 | - | - | - | 2.31 | 31.84 | 1.71 | 2.15 | 27.99 | - | - |
| Renewables and biofuels | 53.92 | |||||||||||
| Hydro power | 14.60 | |||||||||||
| Wind power | 11.88 | |||||||||||
| Solar photovoltaic | 21.22 | |||||||||||
| Geothermal | 2.09 | |||||||||||
| Primary solid biofuels | 1.90 | 1.77 | - | - | 1.77 | - | 0.13 | 0.13 | - | - | - | - |
| Biogas | 1.71 | 0.64 | 0.62 | 0.01 | 0.00 | 0.00 | 1.08 | 1.07 | 0.00 | 0.00 | - | 0.00 |
| Renewable municipal waste | 0.51 | - | - | - | - | - | 0.51 | 0.15 | 0.00 | - | 0.06 | 0.31 |
| Non-renewable waste | 0.51 | - | - | - | - | - | 0.51 | 0.15 | 0.00 | - | 0.06 | 0.31 |
| Non-renewable municipal waste | 0.51 | - | - | - | - | - | 0.51 | 0.15 | 0.00 | - | 0.06 | 0.31 |
| Import net | 8.46 | |||||||||||
| CSP | 0.89 | |||||||||||
| Electricity GNC | 100.00 |
References
- European Commission. EU Climate Action. Available online: https://ec.europa.eu/clima/policies/eu-climate-action_en (accessed on 20 January 2020).
- Ministry of Economic Development, Ministry of the Environment and Protection of Natural Resources and the Sea, Ministry of Infrastructure and Transport. Integrated National Energy and Climate Plan. Available online: https://www.mise.gov.it/index.php/it/energia/energia-e-clima-2030 (accessed on 20 April 2020).
- ISO-The International Organization for Standardization. ISO 14040:2006: Environmental Management-Life Cycle Assessment-Principles and Framework; ISO: Geneva, Swtzerland, 2006. [Google Scholar]
- Hammond, G.P.; Jones, C.I.; O’Grady, Á. Environmental Life Cycle Assessment (LCA) of Energy Systems. In Handbook of Clean Energy Systems; John Wiley and Sons: New York, NY, USA, 2015; pp. 1–26. [Google Scholar]
- Girardi, P.; Brambilla, C.; Mela, G. Life Cycle Air Emissions External Costs Assessment for Comparing Electric and Traditional Passenger Cars. Integr. Environ. Asses. 2020, 16, 140–150. [Google Scholar] [CrossRef] [PubMed]
- San Miguel, G.; Cerrato, M. Life Cycle Sustainability Assessment of the Spanish Electricity: Past, Present and Future Projections. Energies 2020, 13, 1896. [Google Scholar] [CrossRef]
- Thonemann, N.; Maga, D. Life Cycle Assessment of German Energy Scenarios. In Progress in Life Cycle Assessment; Springer: Cham, Switzerland, 2019; pp. 165–175. [Google Scholar]
- Stamford, L.; Azapagic, A. Life cycle sustainability assessment of UK electricity scenarios to 2070. Energy Sustain. Dev. 2014, 23, 194–211. [Google Scholar] [CrossRef]
- Cellura, M.; Cusenza, M.A.; Guarino, F.; Longo, S.; Mistretta, M. Life Cycle Assessment of Electricity Generation Scenarios in Italy. In Life Cycle Assessment of Energy Systems and Sustainable Energy Technologies; Springer: Cham, Switzerland, 2018; pp. 3–15. [Google Scholar]
- Hertwich, E.G.; Gibon, T.; Bouman, E.; Arvesen, A.; Suh, S.; Heath, G.A.; Shi, L. Integrated life-cycle assessment of electricity-supply scenarios confirms global environmental benefit of low-carbon technologies. In Proceedings of the National Academy of Sciences Annual Meeting, Washington, DC, USA, 25–28 April 2015; Volume 112, pp. 6277–6282. [Google Scholar]
- Gibon, T.; Wood, R.; Arvesen, A.; Bergesen, J.D.; Suh, S.; Hertwich, E.G. A methodology for integrated, multiregional life cycle assessment scenarios under large-scale technological change. Environ. Sci. Technol. 2015, 49, 11218–11226. [Google Scholar] [CrossRef] [PubMed]
- Murphy, D.J.; Raugei, M. The Energy Transition in New York: A Greenhouse Gas, Net Energy, and Life-Cycle Energy Analysis. Energy Technol. 2020, 1901026. [Google Scholar] [CrossRef]
- Astudillo, M.F.; Treyer, K.; Bauer, C.; Pineau, P.O.; Amor, M. Life cycle inventories of electricity supply through the lens of data quality: Exploring challenges and opportunities. Int. J. Life Cycle Assess. 2017, 22, 374–386. [Google Scholar] [CrossRef]
- Beylot, A.; Guyonnet, D.; Muller, S.; Vaxelaire, S.; Villeneuve, J. Mineral raw material requirements and associated climate-change impacts of the French energy transition by 2050. J. Clean. Prod. 2019, 208, 1198–1205. [Google Scholar] [CrossRef]
- EC-JRC. ILCD Handbook: Recommendations for Life Cycle Impact Assessment in the European Context. 2011. Available online: http://eplca.jrc.ec.europa.eu/uploads/2014/01/ILCD-Recommendation-of-methods-for-LCIAdef (accessed on 20 January 2020).
- Wernet, G.; Bauer, C.; Steubing, B.; Reinhard, J.; Moreno-Ruiz, E.; Weidema, B. The ecoinvent database version 3 (part I): Overview and methodology. Int. J. Life Cycle Assess. 2016, 21, 1218–1230. [Google Scholar] [CrossRef]
- TERNA. Dati Statistici Sull’energia Elettrica in Italia. 2017. Available online: https://www.terna.it/it-it/sistemaelettrico/statisticheeprevisioni/datistatistici.aspx (accessed on 1 March 2019).
- Eurostat. Energy Balances April 2019 Edition. Available online: https://ec.europa.eu/eurostat/web/energy/data/energy-balances (accessed on 1 March 2020).
- SNAM. Bilancio di Sostenibilità. 2014. Available online: www.snam.it (accessed on 1 October 2015).
- Ministero dello Sviluppo Economico. Produzione Nazionale di Idrocarburi-Anno. 2015. Available online: http://unmig.sviluppoeconomico.gov.it/unmig/produzione/produzione.asp (accessed on 1 October 2015).
- ISPRA. Fattori di Emissione per la Produzione e il Consumo di Energia. 2017. Available online: http://www.sinanet.isprambiente.it/it/sia-ispra/serie-storiche-emissioni/fattori-di-emissione-per-la-produzione-ed-il-consumo-di-energia-elettrica-in-italia/view (accessed on 15 June 2019).
- IPCC. Guidelines for National Greenhouse Gas Inventories–Chapter 2–Stationary Combustion. 2006. Available online: http://www.ipcc-nggip.iges.or.jp/public/2006gl/vol2.html (accessed on 2 June 2018).
- Funedda, M. Sarlux Srl Dichiarazione Ambientale; Sarlux Srl: Cagliari, Italy, 2018. [Google Scholar]
- European Commission. EU Reference Scenario (REF2016); Publications Office of the European Union: Luxembourg, 2016.
- Sala, S.; Crenna, E.; Secchi, M.; Pant, R. Global Normalisation Factors for the Environmental Footprint and Life Cycle Assessment; Publications Office of the European Union: Luxembourg, 2017. [CrossRef]
- Ardente, F.C.; Latunussa, E.; Blengini, G.A. Resource efficient recovery of critical and precious metals from waste silicon PV panel recycling. Waste Manag. 2019, 91, 156–167. [Google Scholar] [CrossRef] [PubMed]
- Louwen, A.; Van Sark, W.G.J.H.M.; Schropp, R.E.I.; Turkenburg, W.C.; Faaij, A.P.C. Life-cycle greenhouse gas emissions and energy payback time of current and prospective silicon heterojunction solar cell designs. Prog. Photovolt. Res. Appl. 2015, 23, 1406–1428. [Google Scholar] [CrossRef]
- Santoyo-Castelazo, E.; Azapagic, A. Sustainability assessment of energy systems: Integrating environmental, economic and social aspects. J. Clean. Prod. 2014, 80, 119–138. [Google Scholar] [CrossRef]


| Impact Category | u.m. | Assessment Method | Recommendation Level |
|---|---|---|---|
| Climate Change | (kg CO2 eq) | Baseline model of 100 years of the IPCC | I |
| Ozone depletion | (kg CFC−11 eq) | Steady-state ODPs | I |
| Particulate matter | (kg PM2.5 eq) | RiskPoll model | I |
| Ionizing radiation HH | (kBq U235 eq) | Human health effect model | II |
| Photochemical ozone formation | (kg NMVOC eq) | LOTOS-EUROS as applied in ReCiPe | II |
| Acidification | (molc H+ eq) | Accumulated Exceedance | II |
| Terrestrial eutrophication | (molc N eq) | Accumulated Exceedance | II |
| Freshwater eutrophication | kg P eq | EUTREND model as implemented in ReCiPe | II |
| Marine eutrophication | kg N eq | EUTREND model as implemented in ReCiPe | II |
| Mineral, fossil & ren resource depletion | kg Sb eq | CML 2002 | II |
| Fuel | Scenario | CI | TG | C | CC | CIC | TGC | CCC | CPC | CSC |
|---|---|---|---|---|---|---|---|---|---|---|
| Other bituminous coal | 2016 | 0.39 | 0.25 | |||||||
| 2017 | 0.39 | 0.25 | 0.11 | |||||||
| 2030 BASE | 0.47 | |||||||||
| Sub bituminous coal | 2016 | 0.39 | ||||||||
| 2017 | 0.38 | |||||||||
| Coke oven gas | 2016 | 0.35 | 0.32 | 0.34 | ||||||
| 2017 | 0.38 | 0.33 | 0.36 | |||||||
| Blast furnace gas | 2016 | 0.32 | 0.29 | 0.32 | ||||||
| 2017 | 0.34 | 0.30 | 0.32 | |||||||
| 2030 BASE | 0.30 | |||||||||
| 2030 INECP | 0.30 | |||||||||
| Other recovered gas | 2016 | 0.33 | 0.30 | 0.33 | ||||||
| 2017 | 0.36 | 0.31 | 0.33 | |||||||
| Refinery gas | 2016 | 0.39 | 0.30 | 0.26 | 0.12 | 0.12 | ||||
| 2017 | 0.35 | 0.28 | 0.26 | 0.10 | 0.14 | |||||
| Liquefied petroleum gases | 2016 | 0.31 | ||||||||
| 2017 | 0.35 | 0.32 | ||||||||
| Gas oil and diesel oil (without biofuels) | 2016 | 0.39 | 0.36 | 0.47 | ||||||
| 2017 | 0.39 | 0.36 | 0.42 | 0.47 | ||||||
| Fuel oil | 2016 | 0.38 | 0.35 | 0.18 | 0.16 | |||||
| 2017 | 0.38 | 0.35 | 0.18 | 0.16 | 0.10 | |||||
| Other oil products | 2016 | 0.24 | 0.23 | |||||||
| 2017 | 0.23 | 0.23 | ||||||||
| 2030 BASE | 0.48 | |||||||||
| 2030 INECP | 0.49 | |||||||||
| Natural gas | 2016 | 0.37 | 0.32 | 0.38 | 0.54 | 0.41 | 0.32 | 0.48 | 0.20 | 0.27 |
| 2017 | 0.37 | 0.31 | 0.39 | 0.54 | 0.41 | 0.32 | 0.49 | 0.20 | 0.28 | |
| 2030 BASE | 0.58 | 0.45 | 0.36 | 0.50 | ||||||
| 2030 INECP | 0.54 | 0.45 | 0.36 | 0.50 | ||||||
| Primary solid biofuels | 2016 | 0.41 | 0.26 | 0.21 | 0.20 | 0.13 | ||||
| 2017 | 0.42 | 0.28 | 0.21 | 0.20 | 0.14 | |||||
| 2030 BASE | 0.33 | 0.39 | ||||||||
| 2030 INECP | 0.33 | 0.39 | ||||||||
| Biogas | 2016 | 0.37 | 0.32 | 0.40 | 0.36 | |||||
| 2017 | 0.37 | 0.32 | 0.40 | 0.36 | 0.16 | |||||
| 2030 BASE | 0.40 | 0.40 | 0.40 | |||||||
| 2034 INECP | 0.40 | 0.40 | 0.40 | |||||||
| Renewable municipal waste | 2016 | 0.25 | 0.31 | 0.30 | 0.20 | |||||
| 2017 | 0.25 | 0.30 | 0.29 | 0.20 | ||||||
| 2030 BASE | 0.23 | 0.23 | 0.23 | |||||||
| 2030 INECP | 0.23 | 0.23 | 0.23 | |||||||
| Other liquid biofuels | 2016 | 0.41 | 0.49 | 0.40 | 0.40 | 0.36 | ||||
| 2017 | 0.42 | 0.48 | 0.40 | 0.40 | 0.37 | |||||
| Industrial wastes | 2016 | 0.26 | 0.14 | |||||||
| 2017 | 0.26 | 0.22 | 0.10 | 0.14 | ||||||
| Non-renewable municipal waste | 2016 | 0.25 | 0.31 | 0.30 | 0.20 | |||||
| 2017 | 0.25 | 0.30 | 0.29 | 0.20 | ||||||
| 2030 BASE | 0.23 | 0.23 | 0.23 | |||||||
| 2030 INECP | 0.23 | 0.23 | 0.23 |
| Power Plant Type | CO2 (kg/MJin) |
|---|---|
| Natural Gas | 0.0564 |
| Coal | 0.0939 |
| Fuel Oil | 0.0767 |
| Gas Diesel Oil | 0.0741 |
| LPG | 0.0642 |
| Pet. TAR | 0.1211 |
| Power Plant Type | N° Power Plants in the Sample | Electricity Production (% on Total) 1 |
|---|---|---|
| Natural Gas | 35 | 53% |
| Coal | 8 | 93% |
| Fuel Oil | 1 | 30% |
| Other Oil products | 1 | 56% |
| Total (fossil thermoelectric) | 45 | 56% |
| Power Plant Type | SOx (g/MJin) | NOx (g/MJin) | PM 10 (g/MJin) |
|---|---|---|---|
| Natural Gas | 0.00 | 1.73 × 10⁻² | 1.88 × 10⁻⁵ |
| Coal | 2.99 × 10⁻² | 3.99 × 10⁻² | 1.25 × 10⁻³ |
| Fuel Oil | 3.22 × 10⁻² | 2.47 × 10⁻² | 3.33 × 10⁻³ |
| Pet TAR | 1.51 × 10⁻² | 2.06 × 10⁻² | 2.03 × 10⁻⁴ |
| Impact Category | u.m. | 2016 | 2017 | 2030 BASE | 2030 INECP | 2030 EU-REF IT |
|---|---|---|---|---|---|---|
| Climate Change | kg CO2 eq | 4.18 × 10⁻¹ | 4.17 × 10⁻¹ | 3.57 × 10⁻¹ | 2.26 × 10⁻¹ | 3.14 × 10⁻¹ |
| Ozone depletion | kg CFC-11 eq | 3.79 × 10⁻⁸ | 4.05 × 10⁻⁸ | 3.72 × 10⁻⁸ | 3.16 × 10⁻⁸ | 3.17 × 10⁻⁸ |
| Particulate matter | kg PM2.5 eq | 7.47 × 10⁻⁵ | 7.48 × 10⁻⁵ | 6.30 × 10⁻⁵ | 5.73 × 10⁻⁵ | 6.10 × 10⁻⁵ |
| Ionizing radiation HH | kBq U235 eq | 2.87 × 10⁻² | 2.89 × 10⁻² | 1.98 × 10⁻² | 1.96 × 10⁻² | 2.02 × 10⁻² |
| Photochemical ozone formation | kg NMVOC eq | 4.67 × 10⁻⁴ | 4.71 × 10⁻⁴ | 4.08 × 10⁻⁴ | 3.14 × 10⁻⁴ | 3.80 × 10⁻⁴ |
| Acidification | molc H+ eq | 8.97 × 10⁻⁴ | 8.93 × 10⁻⁴ | 7.48 × 10⁻⁴ | 5.69 × 10⁻⁴ | 7.23 × 10⁻⁴ |
| Terrestrial eutrophication | molc N eq | 1.63 × 10⁻³ | 1.61 × 10⁻³ | 1.41 × 10⁻³ | 1.06 × 10⁻³ | 1.39 × 10⁻³ |
| Freshwater eutrophication | kg P eq | 9.41 × 10⁻⁵ | 9.07 × 10⁻⁵ | 7.43 × 10⁻⁵ | 4.55 × 10⁻⁵ | 7.80 × 10⁻⁵ |
| Marine eutrophication | kg N eq | 1.88 × 10⁻⁴ | 1.84 × 10⁻⁴ | 1.29 × 10⁻⁴ | 9.51 × 10⁻⁵ | 1.25 × 10⁻⁴ |
| Mineral, fossil & ren resource depletion | kg Sb eq | 3.22 × 10⁻⁶ | 3.18 × 10⁻⁶ | 3.33 × 10⁻⁶ | 6.05 × 10⁻⁶ | 3.05 × 10⁻⁶ |
| Impact Category | Main Contributor to the Impact |
|---|---|
| Climate Change | Natural gas power plants |
| Ozone Depletion | Natural gas power plants |
| Particulate Matter | Natural gas power plants and Photovoltaic (INECP) |
| Ionizing radiation | Imported electricity |
| Photochemical Ozone Formation | Natural gas power plants |
| Acidification | Natural gas power plants |
| Terrestrial eutrophication | Natural gas power plants |
| Marine eutrophication | Natural gas power plants |
| Freshwater eutrophication | Coal power plants(2030 BASE) Net Import (INECP) |
| Mineral fossil and renewable resource depletion | Photovoltaic system |
© 2020 by the authors. Licensee MDPI, Basel, Switzerland. This article is an open access article distributed under the terms and conditions of the Creative Commons Attribution (CC BY) license (http://creativecommons.org/licenses/by/4.0/).
Share and Cite
Gargiulo, A.; Carvalho, M.L.; Girardi, P. Life Cycle Assessment of Italian Electricity Scenarios to 2030. Energies 2020, 13, 3852. https://doi.org/10.3390/en13153852
Gargiulo A, Carvalho ML, Girardi P. Life Cycle Assessment of Italian Electricity Scenarios to 2030. Energies. 2020; 13(15):3852. https://doi.org/10.3390/en13153852
Chicago/Turabian StyleGargiulo, Alessia, Maria Leonor Carvalho, and Pierpaolo Girardi. 2020. "Life Cycle Assessment of Italian Electricity Scenarios to 2030" Energies 13, no. 15: 3852. https://doi.org/10.3390/en13153852
APA StyleGargiulo, A., Carvalho, M. L., & Girardi, P. (2020). Life Cycle Assessment of Italian Electricity Scenarios to 2030. Energies, 13(15), 3852. https://doi.org/10.3390/en13153852